Article

The Influence of the Spraying Pressure of an Injector Asymmetric Double Nozzle with Variable Flow on Head Fungicide Coverage, Yield, Grain Quality, and Deoxynivalenol Content in Winter Wheat

1
Department of Agronomy, University of Ljubljana, 1000 Ljubljana, Slovenia
2
Department for Agrochemistry and Brewing, Slovenian Institute of Hop Research and Brewing, 3310 Žalec, Slovenia
3
Wise Technologies Ltd., 1000 Ljubljana, Slovenia
4
Department of Plant Protection, Agricultural Institute of Slovenia, 1000 Ljubljana, Slovenia
*
Authors to whom correspondence should be addressed.
Agronomy 2021, 11(1), 43; https://doi.org/10.3390/agronomy11010043
Submission received: 20 November 2020 / Revised: 22 December 2020 / Accepted: 25 December 2020 / Published: 28 December 2020
(This article belongs to the Special Issue Fungal Disease Management and Mycotoxin Prevention in Cereals)

Abstract

:
Spraying parameters are important factors when spraying wheat heads against fusarium head blight (FHB) to control the deoxynivalenol level in the grain and to obtain high and quality yields. In 2019 and 2020, field trials were conducted in order to establish the effect of the spraying pressure (2 bar, 4 bar, and 6 bar) of special nozzles with a variable flow rate Agrotop VR 1.5 on the head fungicide coverage, yield parameters, and the deoxynivalenol (DON) value in the grain. The coverage of the front and rear sides of wheat heads increased with the increase of spraying pressure from 2 to 6 bar. In 2019, when the infection with FHB was more severe, no significant differences appeared in the yield and the hectoliter weight at a lower spraying pressure, while the DON value at this pressure approached the maximum permissible level. In that year, the DON value exponentially fell with the increase of spraying pressure. In 2019, the thousand grain weight was higher at the spraying pressure of 6 bar than at the pressures of 2 and 4 bar. The results show that also a lower spraying pressure (2 bar) and a volume application rate (117 L/ha) below the recommended one suffice to retain the DON value in the grain below the maximum permissible level, even in years with more severe infection.

1. Introduction

Fusarium head blight (FHB) is one of the most important wheat diseases, as it causes the contamination of grain with mycotoxins. This reduces the yield and diminishes the quality of grain [1,2]. The spray deposition of a fungicide on wheat heads is an important factor of FHB suppression. Wheat heads are difficult to spray with a fungicide in a way to achieve its even coverage. Different studies show that uneven spray deposition occurs at the front and the rear sides of wheat heads [3]. At the front side of heads, the achieved coverage is 20%, while at the rear side of heads, it is approximately 10% [4]. The new spraying technologies rarely achieve more than 10% head fungicide coverage, while spraying with an airplane achieves only from 1 to 3% [5]. Turbo FloodJet nozzles, which turn alternatively forward and back on the spray boom, can achieve 30% coverage, both at the front and the rear of wheat heads. In a three-year study, this nozzle achieved higher efficiency against FHB than the standard nozzles with a vertical jet [6,7]. The authors in [2] established a 1.30–1.43-fold higher content of the active ingredient in heads after spraying with double nozzles, and a 1.08–1.34-fold higher content of the active ingredient in heads after spraying with the Turbo FloodJet nozzles, in comparison with the standard nozzles with a vertical jet. The application of nozzles with a backward spray jet and symmetric and asymmetric double flat fan nozzles achieved better coverage on the front and the rear side of wheat heads [8,9,10,11].
FHB can reduce yield by up to 30%, while the grain becomes infected with mycotoxins, particularly with deoxynivalenol (DON) [12]. Conditions favourable to FHB can diminish the quality of grain, lower the absolute thousand grain weight, and bring about a higher percentage of tiny, scabby, and colored grain. The application of a fungicide with the active ingredients prothioconazole and tebuconazole can lower the DON value in the grain by 22–72% [13,14,15]. The timely application of azole fungicides, which contain the active ingredients tebuconazole, metconazole, and prothioconazole, can reduce infections by 50–70% and mycotoxin content by 50–80%. In the experiment [16], azole fungicide was used to lower the DON value in the grain of both common and durum wheat, the latter being more susceptible to FHB [12]. It is reasonable to spray plants with fungicides up to 11 days after flowering if the inoculum is present at the time of spraying [17].
The aim of this trial was to establish the effects of a low-volume application rate on the head fungicide coverage, the DON content in wheat grain, and yield. In the trial, an artificial inoculum was made with F. graminearum. The hypothesis was posed that a lower spraying pressure (2 bar), and consequently a lower volume application rate (117 L/ha), will produce a lower fungicide coverage of heads and leaves when spraying with a special TD VR nozzle with a bypass valve. This will result in lower yield, poorer grain quality, and higher mycotoxin DON content in the grain. We were interested in how insufficient head fungicide coverage influenced the DON value in the grain, and what the lower limit of volume application rate was when spraying wheat heads.

2. Results

2.1. Quality of Spray Deposition on the Heads and Leaves of Wheat

The front side of heads at the spraying pressure of 6 bar displayed a higher head fungicide coverage value than at the pressure of 2 bar in both years of the experiment (Table 1). In 2019, there were no differences in head coverage between the spraying pressures of 2 and 4 bar. On the rear side of heads, the coverage value significantly increased with a higher spraying pressure. Regardless of the spraying pressure, the coverage value on the rear side of heads was higher than on the front side of the heads in both years of the experiment. On the flag leaf (Leaf 1) in 2019, the coverage value increased with a higher spraying pressure, while in the following year the head fungicide coverage at the pressure of 6 bar was significantly higher than at the pressure of 2 bar. The coverage value on Leaf 2 in 2019 at the pressure of 6 bar was higher than at the remaining two spraying pressures, while in 2020 the coverage at the pressures of 4 and 6 bar was higher than at the pressure of 2 bar. In 2020, the lower Leaf 3 had higher coverage value at the pressure of 6 bar than at the remaining two spraying pressures, while in 2019 there were no differences in the coverage value.

2.2. Tracer Deposit

In 2019, the wheat heads at the pressure of 6 bar had a higher tracer deposit than at the remaining two spraying pressures, the heads in 2020 at the pressure of 6 bar had a higher tracer deposit than at the pressure of 2 bar (Table 2). In both years of the experiment, at the pressures of 4 and 6 bar, the filter paper on the front side had a higher tracer deposit in comparison with the spraying pressure of 2 bar. On the rear side, the tracer deposit significantly increased with a higher spraying pressure in both years of the experiment. In general, the tracer deposit on the filter paper on the rear side was higher than on the front side regardless of the spraying pressure.
In 2019, Leaf 1 (the flag leaf) had a higher tracer deposit at the pressure of 6 bar than at the lower spraying pressures of 2 and 4 bar (Table 3). The following year, on Leaf 1 a higher tracer deposit appeared at the pressures of 4 and 6 bar than at the pressure of 2 bar. Leaf 2 (immediately below the flag leaf) in 2019 did not display differences in the tracer deposit between the treatments, while in 2020 Leaf 2 displayed a tracer deposit that was lower at the pressure of 2 bar than at the pressures of 4 and 6 bar. In 2019, Leaf 3 (the third leaf from the top) showed a higher tracer deposit at the pressure of 6 bar than at the remaining two pressures. In 2020, a higher tracer deposit was observed on Leaf 3 at the pressures of 4 and 6 bar than at the pressure of 2 bar.

2.3. Yield

In 2019, the grain yield at the spraying pressures of 4 and 6 bar was significantly higher than in the control, which was not sprayed with the fungicide (Table 4). In that year, there were no differences in the grain yield between the control and the spraying pressure of 2 bar. There were also no differences in the grain yield between the spraying pressures of 2 bar, 4 bar, and 6 bar. In 2020, the plots sprayed with a pressure of 2 bar had a significantly higher yield than the untreated control. There were also no significant differences in the grain yield between the control and the spraying pressures of 4 and 6 bar at 14% moisture.

2.4. DON Content

In 2019, DON content in the control (without spraying of heads) was significantly higher than at the plots sprayed with the pressures of 4 and 6 bar (Table 5). There were no significant differences in the DON value in the grain between the control and the spraying pressure of 2 bar. Moreover, no significant differences appeared in the DON value in the grain between the spraying pressures of 2 bar, 4 bar, and 6 bar. The control in 2019 exceeded the maximum level of DON in the grain, which was 1250 µg/kg, while the DON value at the pressure of 2 bar was close to this maximum level. In 2020, the DON value in the grain was very low regardless of treatment.
In 2019, the relationship between the DON content in the grain and the spraying pressure was depicted with an exponential regression model. The equation of the fitted model is DON = exp (7.40374 − 0.343659 * pressure). R-squared is 71.1%, while the correlation coefficient is −0.84. The 0 bar pressure on the chart is the control plot, at which the heads were not sprayed with the fungicide (Figure 1).

2.5. Grain Quality

In 2019, the hectoliter weight in the control was significantly lower than at the plots sprayed with the pressures of 4 bar and 6 bar (Table 6). There were no differences in the hectoliter weight between the control and the spraying pressure of 2 bar in that year. In the following year, no differences appeared in the hectoliter weight between the treatments. In both years of the experiment, there were no significant differences in the protein content in the grain. In 2019, the protein content was higher than in 2020, regardless of treatment. In both years of the experiment, no differences were found in falling number and in sedimentation value. In 2019, the sedimentation value was higher than in 2020 at all treatments.

2.6. Thousand Grain Weight

In 2019, the control had a lower thousand grain weight than the plots sprayed at different pressures (Table 7). At the spraying pressure of 6 bar, the thousand grain weight was significantly higher than at the spraying pressures of 2 and 4 bar. The last two pressures did not display any significant differences in 2019. In 2020, the control had a significantly lower thousand grain weight in comparison to different spraying pressures. In 2020, the thousand grain weight was in general higher, regardless of treatment, than in 2019.

2.7. Grain Size

No grain was larger than 4 mm in any year of the experiment. In 2020, there was a significantly higher percentage of grain sized 3–4 mm at the pressure of 2 bar than in the control, while in 2019 there were no differences between the treatments in this grain size range (Table 8). In 2019, at the size of grain 2.5–3 mm, there were no differences, while in 2020 the control had a higher percentage of grain sized 2.5–3 mm than at the spraying pressure of 2 bar. In 2020, the control had a higher percentage of grain sized 2.0–2.5 mm than at the plots sprayed at the pressures of 2 and 4 bar. In 2019, there were no differences in this grain size range between the treatments. In 2019, in the smallest grain size range of <2 mm, there were no differences between the treatments, while in 2020 the control had a higher percentage of grains <2 mm than at the spraying pressures of 2 and 6 bar.

2.8. Correlation Matrix

According to Roemer–Orphal’s scale, a strong correlation exists when the correlation coefficient is between 0.5 and 0.75, and very strong correlation when it is between 0.75 and 0.9 [18]. There was a negative linear correlation between the head coverage and the DON content in the grain. A strong positive linear correlation appeared between the head coverage and the tracer deposit, between the yield and the thousand grain weight, between the thousand grain weight and the hectoliter weight, between the DON content and the proteins, between the DON content and the sedimentation value, between the protein content and the sedimentation value, and between the falling number and the sedimentation value (Table 9). There was a strong negative correlation between the yield and the DON content, between the yield and the protein content, between the yield and the sedimentation value, between the thousand grain weight and the DON content, between the thousand grain weight and the proteins, between the thousand grain weight and the falling number, between the DON content and the hectoliter weight, between the hectoliter weight and the protein content, and between the hectoliter weight and sedimentation value. A very strong positive correlation appeared between the yield and the hectoliter weight and between the protein content and the sedimentation value, which was expected. A very strong negative correlation appeared between the thousand grain weight and the sedimentation value.

3. Discussion

3.1. Coverage of Heads and Leaves

In line with the posed hypothesis, it turned out that the fungicide coverage on the front and the rear of wheat heads was lower at the pressure of 2 bar than at the spraying pressures of 4 bar and 6 bar. This is connected primarily with the higher volume application rate per hectare at the spraying pressures of 4 bar and 6 bar, while the speed of spraying was constantly 7 km/h. The ratio in the volume application rate between the pressures of 6 bar and 2 bar was 2.32, which is considerably higher than that of the standard nozzles, i.e., 1.73. The nozzle TD VR 1.5 is able to do this by a special bypass valve, which opens an additional hole to boost the flow rate. This is a special feature of the nozzle. That is why this nozzle is used for higher volume application rates in the ratio 3:1 or even 4:1, while the standard nozzles only achieve the ratio 2:1. The results of the head fungicide coverage show better efficiency on the rear side of the heads. We believe that a 10° angle of a spraying jet forward in relation to the vertical is too small for droplets to sufficiently reach the front side of the heads, as they hit primarily lower leaves. In general, at the spraying pressure of 2 bar, a low percentage of head fungicide coverage was achieved, both on the front and rear sides of heads, and did not exceed 11.4%. Our results do not match the findings of [4], which established a 10% coverage of the front side of heads and a 20% coverage of the rear side of heads, but a different type of nozzle was used compared to our experiment. In our research, the coverage of the rear side of the heads was better because an asymmetric double flat fan nozzle was used. Our results to a lesser extent agree with the results of the authors of [5,19], who reported that the coverage of the rear side of wheat heads did not exceed 10%. In our research, at the pressures of 4 and 6 bar, a coverage from 18.1 to 31.6% was achieved on the rear side of the wheat heads.
By using flood flat fan TurboFloodJet nozzles and at a volume application rate of 250 L/ha, a 37% head fungicide coverage was achieved, while the standard nozzle XR only reached a 12% coverage [7]. The results in our study show that an increased spraying pressure increases the head fungicide coverage, which is compatible with the findings of [20]. The authors of [3] also reported a twofold higher head fungicide coverage at a twofold higher volume application rate per hectare. At the spraying pressure of 6 bar, the first leaf (the flag leaf) had a higher fungicide coverage than at the spraying pressure of 2 bar. A similar effect was observed on the second leaf. At the pressures of 4 bar, the coverage on the first and second leaves was higher than at the pressure of 2 bar (2019—the first leaf; 2020—the second leaf); in the other cases, it was not. In 2020, the coverage on the third leaf was higher at the pressure of 6 bar than at the remaining two spraying pressures. These results show that the coverage of the first three leaves is higher primarily at the pressure of 6 bar than at the pressures of 2 and 4 bar. It was expected that the pressure of 4 bar would produce a significantly higher coverage than the pressure of 2 bar on the first two leaves, but this was not confirmed.
The tracer deposit on heads and leaves displayed trends similar to those observed in the coverage value. At the pressure of 6 bar, a higher tracer deposit on heads was established than at the remaining two spraying pressures. On the front of the filter paper, which was used to establish the amount of tracer deposit on the front side of heads, the deposit per cm2 was at the spraying pressures of 4 and 6 bar higher than at the pressure of 2 bar. On the back side of the filter paper, the tracer deposit per cm2 increased with the increased spraying pressure. As with the coverage value, the tracer deposit per cm2 on the rear filter paper was higher than on the front side, which was expected. The results of the tracer on the leaves show that the pressure of 6 bar produces a higher tracer deposit per cm2 of the leaf than the pressure of 2 bar on Leaves 1, 2, and 3. It was observed that the upper leaf had the highest tracer deposit regardless of the spraying pressure, while Leaves 2 and 3 had lower deposits. Thus, it is obvious that, with a higher spraying pressure, with the VR nozzle, a better spray deposition on the flag leaf and on the two leaves below can be achieved. Some authors say that certain improvements in spraying technology, such as the slope of the nozzle, the volume median diameter, and the volume application rate, can increase the head fungicide coverage and the retention [2,21]. The results in our study correspond to these findings, since the maximum permissible level of deoxynivalenol was not exceeded with an increased spraying pressure and consequently an increased volume application rate. In [22], it was found that spraying wheat with an unmanned aerial vehicle and mist sprayers was efficient in suppressing FHB.

3.2. Yield

In 2019, the control had a significantly lower grain yield than at the spraying pressures of 4 and 6 bar. This was to a great extent caused by the rainy weather in the time of wheat flowering in 2019 and the increased infection of heads with FHB. In 2020, the grain yield in the control was significantly lower than at the plot sprayed with the pressure of 2 bar, and this was not expected. It was expected, that the grain yield at the spraying pressures of 4 and 6 bar would be significantly higher compared to control, because of higher fungicide coverage of wheat heads at these two spraying pressures, compared to spraying pressure of 2 bar. However, no significant differences appeared. The grain yield in 2020 was much higher than in 2019, which means that there were considerably more infections with FHB in 2019. This is confirmed also by the mycotoxin DON values and the quality of the grain. Different studies report as much as a 74% reduction in grain yield [23,24,25]. In our experiment, the grain yield in 2019 was on average lower by approximately 30% in comparison to the year 2020. In [26], a 26% higher yield, in comparison with an untreated control, was achieved on average over three years at plots sprayed in wheat heads.

3.3. DON Content

In 2019, the results of the DON value in the grain were partly in accordance with the hypothesis that a better fungicide spray deposition would lower that value. This was confirmed at the spraying pressures of 4 and 6 bar in comparison to the control, but not at the spraying pressure of 2 bar. At this spraying pressure, the DON value in the grain was 1000 µg/kg, which is very close to the maximum level, but there was no significant difference. In that year, the wheat flowering phase had a higher amount of precipitation, which caused infection and the spread of disease. Some authors arrived at similar findings [27,28]. In 2020, there was very little DON content in the grain, which can be explained by the low amount of precipitation in the wheat flowering phase and the lower possibility of grain infection with DON. These results suggest that, even with a low pressure and a low volume application rate, the DON value can be maintained at a very low level. The reduction of the DON value in 2019 ranged from 45.2% at the spraying pressure of 2 bar to 88% at the spraying pressure of 6 bar, in comparison to the control. Many authors have reported reductions in the DON value from 22 to 72% [13,14,15,29,30]. In 2019, the relationship between DON and spraying pressure was expressed with an exponent regression model. This model shows that, with an increase in the spraying pressure, the DON value decreases with the acquired exponent function. At the pressure of 2 bar and at a low volume application rate (117 L/ha), the DON value approached the allowed maximum level in the grain, which was 1250 µg/kg. However, the recommended volume application rate for the prevention of FHB is between 250 and 300 L/ha, which is considerably more than at the pressures of 2 bar (117 L/ha) and 4 bar (207 L/ha) in our study.

3.4. Grain Quality

In 2019, with regard to the parameters of grain quality, a significant difference was established between treatments only in hectoliter weight. In that year, the control had a lower hectoliter weight than at the plots sprayed at the pressures of 4 and 6 bar. The hectoliter weight is connected to flour yield. The higher the hectoliter weight is, the higher the flour yield is when the grain is ground, and vice versa. A higher hectoliter weight is influenced by surface smoothness and grain compactness. A lower hectoliter weight is influenced by grain surface scabbiness and by long, narrow, and floury grain. From this it was concluded that in 2019 there was more scabby grain due to the lower hectoliter weight. In 2020, the hectoliter weight of grain was higher than the year before in all treatments, which suggests that there were fewer infections with FHB [31]. There were no differences in the protein content in the grain, the falling number, or the sedimentation value between the treatments in both years of the experiment. The protein content was in 2019 higher than in 2020. As a rule, lower yields mean a higher protein content, and vice versa [32]. The authors of [33] reported about the increased protein content in infected grains with FHB. This might be the reason that in 2019, when infection with FHB took place, the protein content in the grain was higher than the following year, but this is also influenced by other factors.
A falling number between 250 and 300 is optimal for baking. It depends on the cultivar, weather conditions in the time of ripening, lodging, and nitrogen fertilizing. It is influenced most by rainy weather when wheat has already ripened, which causes a reduction in the falling number. In our experiment, this did not happen, as the lowest falling number was 296 (2019), and the highest was 359 (2020). It has been reported [12] that fungal enzymes of α-amylase decompose starch in grain, which can lower the falling number. This did not happen in any year of our experiment.
The higher the sedimentation value is, the higher the quality of proteins is. In 2019, the sedimentation value was higher than in 2020. This is connected to the higher protein content in 2019 and the lower content in the following year. If a cultivar is able to synthesize proteins, the protein content and the sedimentation value will increase with intensive nitrogen fertilization; otherwise, they do not [34].

3.5. Thousand Grain Weight

The infection of grain with FHB primarily lowers the thousand grain weight [12]. This was confirmed in our research. In 2019, there was a significant increase in the thousand grain weight from the control to the spraying pressure of 6 bar. The thousand grain weight at the spraying pressure of 6 bar, in particular, was higher than at the pressures of 2 and 4 bar. We believe this was due to the improved spray deposition of the fungicide onto the wheat heads. The authors of [1] reported that the reduction of yield occurs due to the sterility of infected spikelets and the reduction in grain size. In 2020, the thousand grain weight was higher in the plots sprayed with different pressures than in the control. In 2020, the thousand grain weight was higher than the year before, primarily due to a lesser infection with FHB, which is demonstrated by the DON results and the yield in that year.

3.6. Grain Size

In 2019, there was on average a lower percentage of grain sizes 3–4 mm and a higher percentage of grain sizes 2.5–3 mm than in 2020. This can be linked to the results of the thousand grain weight, which was in 2019 lower than in 2020 regardless of treatment. In 2019, there were differences in the percentages of grain in regard to the size ranges between individual treatments. This suggests that, in years with more intense infections with FHB, there are a larger amount of tiny and scabby grains, as reported by several authors [12,23,25]. Particularly in 2020, there was a higher percentage of grain sizes 3–4 mm at the pressure of 6 bar than in the control, while at the same pressure, there was a lower percentage of grain sizes 2.5–3 mm than in the control.

3.7. Correlation

A negative correlation between the head fungicide coverage and the DON content in the grain was established. This testifies to the importance of good head fungicide coverage in lowering the DON content in the grain. In this study, the grain yield was strongly influenced by the thousand grain weight, and even more by the hectoliter weight, which is demonstrated by a strong positive linear correlation (r = 0.8998). The yield was negatively influenced by the DON value, which is in line with the findings of several studies [12,26,35]. Other parameters of grain quality, such as the protein content, the sedimentation value, and the falling number, have a negative linear correlation with the yield. The positive linear correlation is between the DON content in the grain and the protein content, and between the DON content and the sedimentation value. At this point, our findings correspond to [33], the authors of which state that FHB-infected grain has a higher protein content. Another study [32] reported that, in addition to a higher DON content, FHB infection caused lower yields, and this in general means a higher protein content. There was a negative linear correlation between the DON content in the grain and the hectoliter weight, as was expected.

4. Conclusions

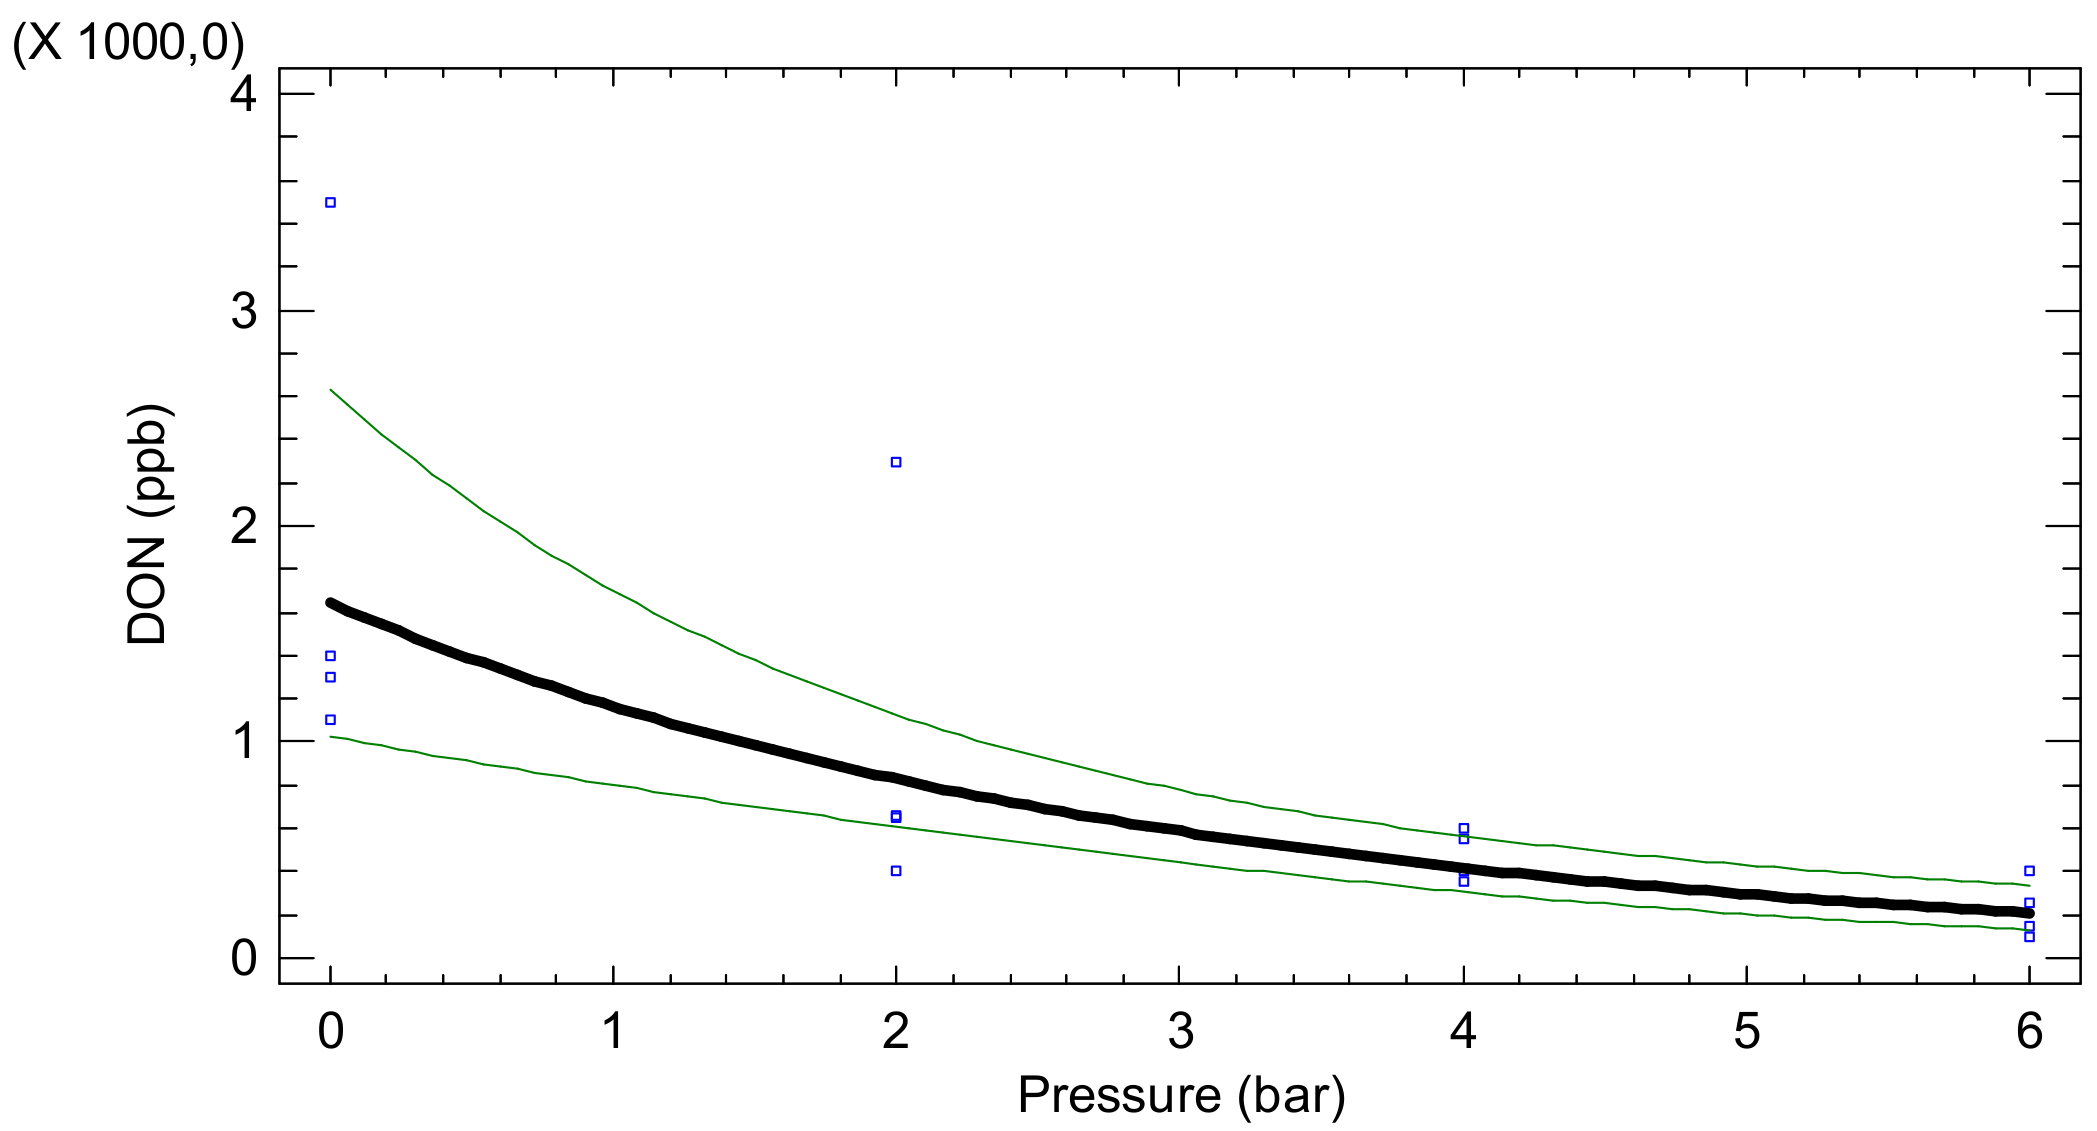
The experiment confirmed the hypothesis that head fungicide coverage increases at higher pressures. This holds true both in regard to the quality of spray deposition and the quantity of spray deposition on heads. At the pressure of 2 bar, in particular, a very low head fungicide coverage was achieved, both at the front and rear sides. Despite the poorer spray deposition on heads at the pressure of 2 bar, there were no significant differences in grain yield with the remaining spraying pressures, which is not in accordance with our hypothesis. Similarly, in the year 2019, with a more intense infection with FHB, at a poorer head fungicide coverage, and at a lower spraying pressure of 2 bar, no significant differences appeared in the DON value at the remaining spraying pressures. At the pressure of 2 bar, the DON value approached a maximum level, 1250 µg/kg, in 2019. Despite this, the DON value in the grain tended to decrease at an increased spraying pressure with an exponent function in 2019. In the grain quality parameters, the spraying pressure had no significant influence, so our hypothesis was not confirmed. However, a poorer spray deposition on heads lowered the thousand grain weight. This is manifested particularly in years with more intense infection. On the basis of the study, it is concluded that the choice of spraying pressures with a special double nozzle with a variable injector should be made according to climatic conditions during sensitive wheat growing stages (heading and flowering). Low spraying pressures and water volumes should be used when weather conditions are not favourable to FHB spreading. When weather conditions are suitable for FHB infection higher spraying pressures and water volumes should be applied. In order to confirm our results, future experiments should continue with a volume application rate even lower than 100 L/ha and with the application of a symmetric double flat fan nozzle.

5. Materials and Methods

5.1. Field Trial

In 2019 and 2020, a field trial was carried out at the laboratory field of the Biotechnical Faculty in Ljubljana, Slovenia. The experimental spraying against FHB involved variable injector nozzles with the double asymmetrical jet TurboDrop VR 1.5 produced by Agrotop. This nozzle has a special bypass valve, which constantly changes the intersection of outlet and thus the volume flow rate at the ratio 1:3 at the pressures from 2 to 8 bar, and at the ratio 1:6 at the pressures from 1 to 6 bar. The standard nozzles have a ratio of volume flow rate of 1:2 at pressures from 2 to 8 bar. The angle of the spraying jet is 120°. The front jet is directed forward in the direction of driving at an angle of 10° in relation to the vertical, while the back is directed backward at an angle of 50° in relation to the vertical [36].
With these nozzles, three spraying pressures were applied, namely 2 bar, 4 bar, and 6 bar. At the spraying speed of 7 km/h and at the pressure of 2 bar, the volume application rate was 117 L/ha; it was 207 L/ha at the pressures of 4 bar, and it was 271 L/ha at the pressure of 6 bar. At the pressure of 2 bar, the volume median diameter (VMD) exceeded 550 µm, it ranged from 400 to 550 µm at the pressure of 4 bar, and it ranged from 350 to 400 µm (ASAE and BCPC) at the pressure of 6 bar.
The experimental design comprised random blocks with four repetitions. The trial involved three spraying pressures (2, 4, and 6 bar) and a control (untreated plants). The length of individual experimental unit was 19 m, and the width was 2.5 m. The spraying of wheat heads was carried out at the beginning of flowering (BBCH 61–63). In 2019, the spraying of heads was carried out on the 25th of May, and it was carried out on the 21st of May in the following year. During the spraying of heads in 2019, the precipitation was almost four times higher than in 2020, which meant significantly better conditions for the infection of heads with FHB (Table 10). Otherwise, the entire amount of precipitation in the period October–July was similar, around 1000 mm in both years of the trial (Table 11). The tractor sprayer Agromehanika AGS 600 EN was used, which was fitted with hydraulic spray booms. The driving speed during the spraying was 7 km/h. The spraying of heads involved the fungicide Prosaro with the active ingredients prothioconazole (125 g/L) and metconazole (125 g/L) at a dosage of 1 L/ha (Bayer AG, Germany). The wheat cultivar was Bastide, which is an awn wheat that is moderately susceptible to FHB. The precrop was winter wheat. In autumn, the plot was ploughed with a reversible plough.
Immediately before spraying, the water-sensitive papers (WSPs) were fixed to the front and the rear side of heads, on the flag leaf (Leaf 1), and on the two lower leaves (Leaves 2 and 3). Nine wheat heads, 9 flag leaves, 9 s leaves, and 9 third leaves were randomly chosen per plot. The spraying of heads was then carried out with the fungicide. With WSP, the quality of spray deposition on heads and on the first three leaves below the head was established.
Filter paper was placed on the front and the rear side of heads. The experimental plot was then sprayed with a colorant, a water solution of the colour Helios SC 500. First, the colour was dissolved in water in the sprayer’s tank via hydraulic mixing. The experimental plot was then sprayed as planned for the treatments. The procedure was repeated three times at each experimental unit. Thus, the amount of tracer deposit on the heads and the leaves of wheat was evaluated. The analysis of the deposit was performed at the Slovenian Institute of Hop Research and Brewing in Žalec.
All agrotechnical tasks in the trial were performed in line with good agricultural practice. They included soil cultivation, sowing, fertilizing, and chemical plant protection.

5.2. Artificial Inoculation and Inoculum Production

Two hours after spraying the heads with the fungicide, the artificial infection with Fusarium graminearum was performed. The seeds infected with the said fungus were soaked in water and then sprayed with the battery sprayer Solo 416 Li on the experimental plots. The entire area was watered with artificial rain so as to increase the possibility of infection.
The F. graminearum isolate originated from the infected wheat seeds harvested in Slovenia in 2018. The pure fungal cultures were grown in petri dishes on one-third potato dextrose agar (PDA) with the pieces of filter paper placed at the surface of the medium to stimulate conidial production. Conidia were splashed from 14-day-old cultures with sterile tap water. The suspension was used to inoculate the sterilized wheat grains in glass containers. The inoculum was also transferred to petri dishes with the medium prepared as described above. After 16 days of incubation at 20–22 °C, exposed to natural light at the laboratory bench, sufficient sporulation was achieved. The grains and sporulating cultures were rinsed with sterile tap water, and the obtained conidial suspension was filtered through cheesecloth. The concentration of conidia was determined using a hemocytometer and adjusted to 2 × 10⁵ conidia/mL.

5.3. WSP Analysis and Tracer Analysis

The analysis of WSPs was carried out with the Wise Node system, from the company Wise Technologies Ltd. Slovenia. The system consists of an industrial camera (Basler), which contains an accurate sensor (2 million pixels per picture; resolution: 1920 × 1080). The camera and the computer are connected via USB 3.0 cable. The camera is fixed on a mechanical structure. Three measurements were carried out on each measuring paper. On an individual measurement paper, the programme calculates the coverage value and the number of droplet impacts per 1 cm2. Thus, the quality of phytopharmaceutical product (PPP) deposition on the heads was established.
The method for measuring tracer deposit is based on determining the amount of the tracer Helios SC 500, which has fluorescent properties on collectors. An amount of 0.2 g of wheatears was cut by scissors cleaned with ethanol for each new individual sample in a beaker. Seven milliliters of solvent diethylene glycol monoethyl ether (Sigma-Aldrich, Germany) were added and extracted for 15 min in an ultrasonic bath (Bandelin Sonorex, Germany) at room temperature. Immediately after extraction, the liquid part was transferred into the vial and subjected to further analysis by HPLC.
Filter paper was cut by scissors cleaned with ethanol for each new individual sample in a beaker. Two milliliters of solvent 2-ethoxyethanol (Sigma-Aldrich Chemie GmbH, Munich, Germany) were added and extracted for 15 min in an ultrasonic bath (Bandelin electronic GmbH & Co. KG, Berlin, Germany) at room temperature. Immediately after extraction, the liquid part was transferred into the vial and subjected to further analysis by HPLC.
Approximately 0.2 g of wheat leaves were cut by scissors cleaned with ethanol for each new individual sample in a beaker. Two milliliters of solvent diethylene glycol monoethyl ether (Sigma-Aldrich Chemie GmbH, Munich, Germany) was added and extracted for 15 min in an ultrasonic bath (Bandelin electronic GmbH & Co. KG, Berlin, Germany) at room temperature. Immediately after extraction, the liquid part was transferred into the vial and subjected to further analysis by HPLC.
Ten microliters of the obtained extract was injected into the liquid chromatograph equipped with a fluorescence detector (Agilent Technologies, Inc. Headquarters, Santa Clara, CA, USA) and without any column. The isocratic mobile phase (2-ethoxyethanol for paper collectors and diethylene glycol monoethyl ether for plant tissues) with a flow of 0.7 mL/min was used. The excitation energy with a wavelength of 375 nm was used; emitted light was detected at a wavelength of 435 nm. The amount of tracer in the collector was calculated externally from the calibration curve prepared with standard solutions of tracer in solvents used for extraction.

5.4. Yield and Yield Parameters

The harvest was carried out with a Wintersteiger plot harvester with a working width of 1.5 m. The moisture of the grain was measured with the Pfeuffer HE 40 moisture meter. The yield was calculated at 14% moisture. On each experimental plot, 8 samples of 1000 kernels were weighted using the ABS-N Kern analytic scale with an accuracy of 0.1 mg to measure the thousand grain weight. In addition, 100 g of grain were poured through a sieve, and the percentages of grain sizes >4 mm, 3–4 mm, 2.5–3 mm, 2–2.5 mm, and <2 mm were calculated. The thousand grain weight and the percentages of grain sizes were established for each plot in eight repetitions. The parameters of grain quality, such as the hectoliter weight, the protein percentage, the falling number, and the sedimentation value, were established by the Institute Bureau Veritas, according to standards SIST ISO 1871, SIST ISO 7971-2, and SIST ISO 3093. One measurement per plot was done.

5.5. DON Analysis

The grain samples were collected manually from the heads before the harvest and flailed with a Wintersteiger thresher. The analysis of the DON was performed with the ROSA FAST5 DON Quantitative Test. A grain sample of 50 g is weighed, and 250 mL of deionized water is then added. The sample is then shaken for a maximum of 2 min and filtered through MN 615 filter paper. After that, a diluted extract is made of 100 µL of extract +1.0 mL of DONQ-FAST 5 dilution buffer. The test strips are placed in a ROSA incubator. The tape is peeled, and 300 µL of diluted extract is then pipetted into the sample compartment. The tape is resealed and incubated for 5 min. After that, the test strip is inserted into a ROSA-M Reader for measuring DON content. The test strip should be measured within 1 min after incubation. The measuring range is between 0 and 1.5 ppm. If the measured value is higher, another diluted extract is prepared from 300 µL of diluted extract + 1.0 mL of DONQ-FAST 5 dilution buffer. The subsequent procedure is the same and the measuring range is between 0 and 6 ppm (Charm Sciences, Inc. Headquarters, Lawrence, USA).

5.6. Data Analysis

The statistical analysis was carried out with the programme Statgraph 4.0. The analysis of variance for random blocks was carried out. Duncan’s multiple comparison test was used for establishing the differences between means. The degree of risk was 0.05. The statistical differences between the treatments were presented with different letters. The relationship between the DON content in the grain and the spraying pressure was presented with a regression model. First, the most suitable model was determined. The individual parameters of the model were then calculated, and the analysis of variance was then applied. The F-test, the coefficient of determination, and the coefficient of correlation were calculated. The Pearson correlation coefficients were also calculated for different variables.

Author Contributions

Conceptualization, F.V. and M.V.; methodology, F.V., I.J.K., M.Ž., and M.O.; software, M.Š.; validation, S.T., I.Š., R.B., and M.V.; formal analysis, F.V.; investigation, F.V.; resources, S.T., M.V., and I.Š.; data curation, F.V.; writing—original draft preparation, F.V., S.T., and M.V.; writing—review and editing, F.V., M.V., and S.T.; visualization, F.V. and S.T.; supervision, F.V. and S.T.; project administration, M.V.; funding acquisition, S.T. and M.V. All authors have read and agree to the published version of the manuscript.

Funding

This research was carried out within Animal health, environment and food safety No. P4-0092, a programme funded by the Slovenian Research Agency.

Institutional Review Board Statement

Not applicable. Study does not involve humans or animals.

Informed Consent Statement

Not applicable.

Data Availability Statement

The data presented in this study are available on request from the corresponding author.

Acknowledgments

We are grateful to Mihovil Šantić for developing the device for image analysis and the computer program Wise Node for analysing spray deposition on WSP paper.

Conflicts of Interest

The authors declare that there are no conflicts of interest.

References

  1. Wegulo, S.N.; Baenziger, P.S.; Nopsa, J.H.; Bockus, W.W.; Hallen-Adams, H. Management of Fusarium head blight of wheat and barley. Crop Prot. 2015, 73, 100–107. [Google Scholar] [CrossRef]
  2. Lehoczki-Krsjak, S.; Varga, M.; Mesterházy, Á. Distribution of prothioconazole and tebuconazole between wheatears and flag leaves following fungicide spraying with different nozzle types at flowering. Pest Manag. Sci. 2015, 71, 105–113. [Google Scholar] [PubMed]
  3. McMullen, M.; Halley, S.; Pederson, J.; Hofman, V.; Moos, J.; Panigrahi, S.; Gu, D.; Gregoire, T. NDSU Greenhouse Studies: Yield More Tips for Improved Fungicide Spraying for Wheat/Barley Head Scab Control; Extension Report 56; North Dakota State University: Fargo, ND, USA, 1999; pp. 1–5. [Google Scholar]
  4. Halley, S.; Pederson, J.; McMullen, M.; Lukach, J. Sprayer modifications for enhanced control of Fusarium head blight with fungicides. In Proceedings of the 1999 National Fusarium Head Blight Forum, Best Western Ramkota Inn, Sioux Falls, SD, USA, 5–7 December 1999; Wagester, J.A., Ward, R.W., Hart, L.P., Hazen, S.P., Lewis, J., Borden, H., Eds.; University Printing, Michigan State University: East Lansing, MI, USA, 1999; pp. 51–52. [Google Scholar]
  5. Hooker, D.C.; Spieser, H.; Schaafsma, A.W. Effective application of fungicides on wheat heads: What’s the best? In Proceedings of the 2nd International Symposium on Fusarium Head Blight, incorporating the 8th European Fusarium Seminar, Orlando, FL, USA, 11–15 December 2004; Canty, S.M., Boring, T., Wardwell, J., Ward, R.W., Eds.; Michigan State University: East Lansing, MI, USA, 2004; p. 330. [Google Scholar]
  6. Lehoczki-Krsjak, S.; Szabo-Hever, A.; Toth, B.; Kotai, C.; Bartok, T.; Varga, M. Prevention of Fusarium mycotoxin contamination by breeding and fungicide application to wheat. Food Addit. Contam. Part A 2010, 27, 616–628. [Google Scholar] [CrossRef] [PubMed]
  7. Mesterházy, Á.; Tóth, B.; Varga, M.; Bartók, T.; Szabó-Hevér, Á.; Farády, L.; Lehoczki-Krsjak, S. Role of fungicides. application of nozzle types and the resistance level of wheat varieties in the control of Fusarium head blight and deoxynivalenol. Toxins 2011, 3, 1453–1483. [Google Scholar] [CrossRef] [Green Version]
  8. Miller, P.C.H.; Lane, A.G.; Wheeler, H.C. Optimising Fungicide Application according to Crop Canopy Characteristics in Wheat; Project Report No. 277; HGCA: London, UK, 2002; p. 33. [Google Scholar]
  9. Parkin, C.S.; Miller, P.C.H.; Magan, N.; Aldred, D.; Gill, J.; Orson, J.H. The deposition of fungicides on ears to control Fusarium ear blight and the mycotoxin contamination of grain. Asp. Appl. Biol. 2006, 77, 445–452. [Google Scholar]
  10. Vajs, S.; Leskošek, G.; Simončič, A.; Lešnik, M. Comparison of effectiveness of standard and drift-reducing nozzles for control of some winter wheat diseases. J. Plant Dis. Prot. 2008, 115, 23–31. [Google Scholar]
  11. Knewitz, H.; Koch, H. Was die neuen Düsen bringen. DLG-Mitt. 2010, 3, 68–71. [Google Scholar]
  12. Miedaner, T. Mykotoksine in Weizen und Mais. Fusarien Erfolgreich Vorbeugen; DLG Verlag GmbH: Frankfurt am Main, Germany, 2012; pp. 17–59. [Google Scholar]
  13. Homdork, S.; Fehrmann, H.; Beck, R. Effects of field application of tebuconazole on yield. yield components and the mycotoxin content of Fusarium-infected wheat grain. J. Phytopathol. 2000, 148, 1–6. [Google Scholar] [CrossRef]
  14. Hart, P.; Van Ee, G.; Ledebuhr, R. Uniform fungicide Trial Collaborative Study 2001—Michigan State University. In Proceedings of the National Fusarium Head Blight Forum, Erlanger, KY, USA, 8–10 December 2001; pp. 54–58. [Google Scholar]
  15. McMullen, M.; Lukach, J.; McKay, K.; Schatz, B. Wheat uniform fungicide and biocontrol trials. In Proceedings of the National Fusarium Head Blight Forum, Erlanger, KY, USA, 8–10 December 2001; Canty, S.M., Lewis, J., Siler, L., Ward, R.W., Eds.; Kinko’s: Okemos, MI, USA, 2001; pp. 67–69. [Google Scholar]
  16. Blandino, M.; Scarpino, V.; Sulyok, M.; Krska, R.; Reyneria, A. Effect of agronomic programmes with different susceptibility to deoxynivalenol risk on emerging contamination in winter wheat. Europ. J. Agron. 2017, 85, 12–24. [Google Scholar]
  17. Freije, A.N.; Wise, K.A. Impact of Fusarium graminearum inoculum availability and fungicide application timing on Fusarium head blight in wheat. Crop Prot. 2015, 77, 139–147. [Google Scholar] [CrossRef]
  18. Vasilj, Đ. Biometrika i Eksperimentiranje u Bilinogojstvu; Hrvatsko Agronomsko Društvo: Zagreb, Croatia, 2000; pp. 107–120. [Google Scholar]
  19. Hooker, D.C.; Spieser, H.; Schaafsma, A.W. Effective application of fungicides on wheat heads: What’s the best? In Proceedings of the 2005 National Fusarium Head Blight Forum, Milwaukee, WI, USA, 11–13 December 2005; Canty, S.M., Boring, T., Wardwell, J., Siler, L., Ward, R.W., Eds.; Michigan State University: East Lansing, MI, USA, 2005; p. 209. [Google Scholar]
  20. Derksen, R.C.; Paul, P.A.; Ozkan, H.E. Field evaluations of application techniques for fungicide spray deposition on wheat and artificial targets. Appl. Eng. Agric. 2012, 28, 325–331. [Google Scholar] [CrossRef]
  21. Fritz, B.K.; Hoffmann, W.C.; Martin, D.E.; Thomson, S.J. Aerial application methods for increasing spray deposition on wheat heads. Appl. Eng. Agric. 2007, 23, 709–715. [Google Scholar] [CrossRef]
  22. Xiao, J.; Chen, L.; Pan, F.; Deng, Y.; Ding, C.; Liao, M.; Suc, X.; Cao, H. Application method affects pesticide efficiency and effectiveness in wheat fields. Pest Manag. Sci. 2020, 76, 1256–1264. [Google Scholar] [CrossRef] [PubMed]
  23. McMullen, M.; Jones, R.; Gallenberg, D. Scab of wheat and barley: A reemerging disease of devastating impact. Plant. Dis. 1997, 81, 1340–1348. [Google Scholar] [CrossRef] [Green Version]
  24. McMullen, M.; Bergstrom, G.; De Wolf, E.; Dill-Macky, R.; Hershman, D.; Shaner, G.; Van Sanford, D. A unified effort to fight an enemy of wheat and barley: Fusarium head blight. Plant Dis. 2012, 96, 1712–1728. [Google Scholar] [CrossRef] [Green Version]
  25. Parry, D.W.; Jenkinson, P.; McLeod, L. Fusarium ear blight (scab) in small grain cereals a review. Plant Pathol. 1995, 44, 207–238. [Google Scholar] [CrossRef]
  26. Blandino, M.; Pascale, M.; Haidukowski, M.; Reyneri, A. Influence of agronomic conditions on the efficacy of different fungicides applied to wheat at heading: Effect of flag senescence, Fusarium head blight attack, grain yield and deoxynivalenol contamination. Ital. J. Agron. 2011, 6, 204–211. [Google Scholar] [CrossRef]
  27. Balmas, V.; Vitale, S.; Marcello, A.; Corazza, L. Fusariosi della spiga. L’Informatore Agrar. 2000, 35, 27–29. [Google Scholar]
  28. Moretti, A.; Corazza, L.; Balmas, V.; Santori, A.; Ritieni, A. Funghitossigeni e micotossine: Filiera cerealicola. Inf. Fitopatol. 2002, 12, 17–22. [Google Scholar]
  29. Milus, E.A.; Hershman, D.; McMullen, M. Analysis of the 2001 Uniform Wheat Fungicide and Biocontrol Trials Across Locations. In Proceedings of the 2001 National Fusarium Head Blight Forum, Erlanger, KY, USA, 8–10 December 2001; Canty, S.M., Lewis, J., Siler, L., Ward, R.W., Eds.; Kinko’s: Okemos, MI, USA, 2001; pp. 75–79. [Google Scholar]
  30. Lechoczki-Krsjak, S.; Toth, B.; Kotai, C.; Martonosi, I.; Farady, L.; Kondrak, L.; Szabo-Hever, A.; Mesterhazy, A. Chemical control of FHB in wheat with different nozzle types and fungicides. Cereal Res. Commun. 2008, 36, 677–681. [Google Scholar] [CrossRef]
  31. Salgado, J.D.; Madden, L.V.; Paul, P.A. Quantifying the effects of fusarium head blight on grain yield and test weight in soft red winter wheat. Phytopathology 2015, 105, 295–306. [Google Scholar] [PubMed] [Green Version]
  32. Simmonds, N.W. The relation between yield and protein in cereal grain. J. Sci. Food Agric. 1995, 67, 309–315. [Google Scholar] [CrossRef]
  33. Breiteneder, H.; Radauer, C.A. classification of plant food allergens. J. Allergy Clin. Immunol. 2004, 113, 821–830. [Google Scholar] [CrossRef] [PubMed]
  34. Rossini, F.; Provenzano, M.E.; Sestili, F.; Ruggeri, R. Synergistic Effect of Sulfur and Nitrogen in the Organic and Mineral Fertilization of Durum Wheat: Grain Yield and Quality Traits in the Mediterranean Environment. Agronomy 2018, 8, 189. [Google Scholar] [CrossRef] [Green Version]
  35. Mesterházy, Á.; Bartók, T.; Lamper, C. Influence of cultivar resistance, epidemic severity, and Fusarium species on the efficacy of fungicide control of Fusarium head blight in wheat and deoxynivalenol (DON) contamination of grain. Plant Dis. 2004, 87, 1107–1115. [Google Scholar] [CrossRef] [PubMed] [Green Version]
  36. Agrotop. Available online: https://www.agrotop.com/spray-technology/news/news-single/turbodropR-vr-mk-ii/ (accessed on 10 October 2020).
Figure 1. An exponential model to describe the relationship between DON and pressure in the year 2019. Outer lines represent confidence limits.
Agronomy 11 00043 g001
Table 1. Coverage value at different spraying pressures in 2019 and 2020.
YearSpray PressureCoverage Value (%)
Head-FrontHead-RearLeaf 1Leaf 2Leaf 3
20192 bar7.0 a,*9.9 a16.4 a9.3 a10.0 a
4 bar9.7 a18.1 b29.2 b9.3 a10.5 a
6 bar15.5 b24.0 c41.8 c27.5 b13.6 a
20202 bar6.6 a11.4 a20.6 a7.9 a8.5 a
4 bar10.7 b20.4 b26.5 ab15.2 b11.4 a
6 bar12.3 b31.6 c30.0 b14.0 b15.5 b
* Different letters in the same column and the same year represent significant difference according to Duncan’s test (p < 0.05).
Table 2. Tracer deposit on wheat heads and on filter paper.
YearSpray PressureWheat Head (µg/g)Filter Paper
Front (µg/cm2)Rear (µg/cm2)
20192 bar0.076 a,*0.0102 a0.0227 a
4 bar0.122 a0.0250 b0.0383 b
6 bar0.279 b0.0236 b0.0630 c
20202 bar0.103 a0.0052 a0.0180 a
4 bar0.158 ab0.0202 b0.0336 b
6 bar0.190 b0.0210 b0.0529 c
* Different letters in the same column and the same year represent significant difference according to Duncan’s test (p < 0.05).
Table 3. Tracer deposit on wheat leaves.
YearSpray PressureLeaf (µg/cm2)
123
20192 bar0.026 a,*0.015 a0.015 a
4 bar0.036 a0.021 a0.017 a
6 bar0.054 b0.024 a0.031 b
20202 bar0.014 a0.010 a0.009 a
4 bar0.030 b0.020 b0.021 b
6 bar0.026 b0.020 b0.024 b
* Different letters in the same column and the same year represent significant difference according to Duncan’s test (p < 0.05).
Table 4. Grain yield at 14% moisture.
YearSpray PressureYield (t/ha)
20192 bar4.97 ab,*
4 bar5.73 b
6 bar5.72 b
control4.59 a
20202 bar8.64 b
4 bar8.38 ab
6 bar8.16 ab
control7.64 a
* Different letters in the same column and the same year represent significant difference according to Duncan’s test (p < 0.05).
Table 5. Deoxynivalenol (DON) content in the grain (µg/kg).
YearSpray PressureDON (µg/kg)
20192 bar1000 ab,*
4 bar475 a
6 bar225 a
control1825 b
20202 bar0 a
4 bar0 a
6 bar25 a
control13 a
* Different letters in the same column and the same year represent significant difference according to Duncan’s test (p < 0.05).
Table 6. Quality parameters of the grain.
YearSpray PressureHW (kg/hL)PC (%)FN (s)S (mL)
20192 bar68.9 ab,*12.7 a352 a50.5 a
4 bar70.0 b13.1 a358 a52.3 a
6 bar70.2 b13.3 a359 a50.3 a
control66.3 a13.4 a348 a55.5 a
20202 bar74.2 a11.2 a305 a34.3 a
4 bar74.7 a11.4 a335 a35.0 a
6 bar74.1 a11.0 a296 a33.3 a
control73.4 a11.5 a330 a37.5 a
* Different letters in the same column and the same year represent significant difference according to Duncan’s test (p < 0.05). HW—hectoliter weight; PC—protein content; FN—falling number; S—sedimentation.
Table 7. Thousand grain weight.
YearSpray PressureTGW (g)
20192 bar38.6 b,*
4 bar40.1 b
6 bar41.7 c
control35.2 a
20202 bar45.6 b
4 bar44.1 b
6 bar44.3 b
control41.9 a
* Different letters in the same column and the same year represent significant difference according to Duncan’s test (p < 0.05).
Table 8. Grain size.
YearSpray PressureGrain Size (%)
>4 mm3–4 mm2.5–3 mm2.0–2.5 mm<2 mm
20192 bar0.1 a28.4 a61.7 a7.4 a2.4 a
4 bar0.2 a35.8 a54.6 a7.0 a2.4 a
6 bar0.1 a33.8 a57.6 a6.4 a2.0 a
control0.1 a27.6 a59.9 a9.3 a2.8 a
20202 bar0 a60.7 b,*31.0 a6.4 a1.6 a
4 bar0 a52.5 ab37.9 ab6.0 a2.0 ab
6 bar0 a55.1 ab36.2 ab6.6 ab1.8 a
control0 a31.3 a44.8 b9.0 b2.4 b
* Different letters in the same column and the same year represent significant difference according to Duncan’s test (p < 0.05).
Table 9. Pearson product moment correlations between each pair of variables (2 years mean).
CYTGWDONHWPCFNST
C 0.08960.2194−0.35380.19200.01540.0876−0.05160.5513
nsns*nsnsnsns**
Y0.0896 0.6428−0.65920.8998−0.5144−0.4352−0.5708−0.4836
ns ************
TGW0.21940.6428 −0.67050.6555−0.7490−0.5726−0.7987−0.1678
ns** **********ns
DON−0.3538−0.6592−0.6705 −0.66770.61200.23790.6192−0.0212
***** ****ns**ns
HW0.19200.89980.6555−0.6677 −0.5461−0.3614−0.5915−0.3365
ns****** *****ns
PC0.0154−0.5144−0.74900.6120−0.5461 0.52840.95340.4485
ns****** ****
FN0.0876−0.4352−0.57260.2379−0.36140.5284 0.59820.3907
ns***ns** ***
S−0.0516−0.5708−0.79870.6192−0.59150.95340.5982 0.4210
ns************ *
T0.5513−0.4836−0.1678−0.0212−0.33650.44850.39070.4210
***nsnsns***
Correlation: ns—not significant. * p < 0.05; ** p < 0.001; C—head coverage; Y—yield; TGW—thousand grain weight; DON—DON content; HW—hectoliter weight; PC—protein content; FN—falling number; S—sedimentation; T—tracer deposit.
Table 10. Precipitation in the head spraying period in the last decade of May 2019 and 2020 for Ljubljana, Bežigrad.
DatePrecipitation (mm)DatePrecipitation (mm)
2019-05-201.22020-05-208.8
2019-05-213.72020-05-210
2019-05-220.42020-05-220
2019-05-237.32020-05-230
2019-05-2402020-05-2425
2019-05-2502020-05-250
2019-05-265.72020-05-262
2019-05-272.72020-05-270
2019-05-2815.32020-05-280
2019-05-2975.62020-05-290
2019-05-3016.52020-05-300
2019-05-311.72020-05-310
Sum130.1 35.8
Table 11. Weather information for the crop season of 2018/2019 and 2019/2020 for Ljubljana, Bežigrad.
Year/MonthT (°C)Precipitation (mm)Year/MonthT (°C)Precipitation (mm)
2018/1013.21252019/1013.276
2018/118.31092019/118.8188
2018/122.2122019/123.6130
2019/010.7662020/011.914
2019/024.9982020/026.842
2019/039.0482020/037.2105
2019/0411.6892020/041325
2019/0512.92392020/0515.3115
2019/0623.5462020/0619.6147
2019/0722.91422020/0721.8160
Sum 1002 974
Publisher’s Note: MDPI stays neutral with regard to jurisdictional claims in published maps and institutional affiliations.

