Abstract
Although there has been an increase in the cultivation of highbush blueberry (Vaccinium corymbosum L.) worldwide for several years now, the availability of suitable soils for this species remains a problem. Highbush blueberry is a plant that requires acidic soils (pH 3.8–5.5), which are well aerated and have a stable level of groundwater and high humus content. In the present study, substances such as urea phosphate fertilizer, sulfur, sulfuric acid, and phosphogypsum were used to acidify three soils: peat, loamy sand, and loamy silt. The study aimed to lower the pH of the tested soils and optimize this parameter to cultivate highbush blueberry. The resulting changes in pH, content of macro- and micro-elements, and enzymatic activity were evaluated. Acidifying substances mitigated peat and loamy sand’s reaction to highbush blueberry requirements, while the reaction of loamy silt was changed only slightly, which made this soil unsuitable for plant cultivation. Sulfur dust acidified the examined soils rapidly and to the highest degree, followed by urea phosphate and phosphogypsum, while the weakest acidification was achieved with sulfuric acid solutions. The salt concentration of the soil was increased the most by the highest dose of phosphogypsum, which indicated that it could not be used to acidify soil for the cultivation of highbush blueberry. Among the acidifying substances, only urea phosphate showed a stimulating effect on the soils’ enzymatic activity, whereas others did not significantly affect or decrease this parameter.
1. Introduction
The low availability of suitable soils for cultivation is one of the main factors limiting new highbush blueberry (Vaccinium corymbosum L.) plantations. For several years, the world has seen a rapid increase in interest in the cultivation of this species. Highbush blueberry is most commonly grown in the USA and Canada, as well as in New Zealand and South Africa. About 10% of the world’s highbush blueberry crops are in Europe, and its biggest cultivators are Germany, Spain, and Poland, which ranks fifth in plantation area worldwide [1,2,3].
Some of the important chemical properties of soil that affect its microbiological activity and the bioavailability of nutrients are the granulometric compositions, organic matter content, and pH [4,5]. The effect of soil pH on plants is determined primarily by their genetic diversity. Unusual requirements characterize highbush blueberry; it grows on soils with low pH (3.8–5.5), they are well aerated, exhibit physical properties characteristic of light soils, and have high humus content. Therefore, organic soils in which water ratios are regulated and weak mineral soils in which the chemical properties can be easily modified are suitable for cultivating this species [6,7,8]. In natural conditions, its shrubs grow on forest soils having a low level of nutrients. Generally, peat soils are most suitable for this species [9]. Currently, all over Europe, there is a decrease in peat bogs [10,11] due to the dehydration of areas designated for meadows and fields, modernization of the landscape, and legal protection of peatlands. Although the expenditure on field preparation is high, blueberry cultivation is economically beneficial. The gains obtained from blueberry cultivation are huge as the fruit price has been quite stable and remains high over the years [12].
The interest in the cultivation of highbush blueberry encourages growers to use soils that are less suitable for this species. The available studies show that one of the most important criteria influencing blueberry’s growth is the soil pH [13,14]. Thus, the cultivation of highbush blueberry can be improved by lowering the pH of the soil by using the following substances: fragmented coniferous tree bark, high peat, composted pine sawdust, paper mill sludge, acids, and physiologically acidic fertilizers [15,16]. Gagnon et al. [17] stated that the soil’s pH could be lowered using primary and secondary peppermill sludge, a good source of carbon and other nutrients. On the other hand, urea phosphate increases the content of magnesium and phosphorus and the mineral forms of nitrogen in the soil, especially N-NH4 [18], which causes acidification of the peat substrate [19]. Some authors [20] have recommended using sulfur to increase the soil acidity for enhancing blueberry cultivation. According to Starast et al. [21], sulfur can increase nutrient-rich soil’s acidity, but not that of nutrient-poor soil with a light texture, for which only NPK (nitrogen, phosphorus, potassium) fertilizers are effective. The use of acidifying fertilizers causes an increase in salinity, which is unfavorable as blueberry is salt-sensitive. Changes in pH and increase in salinity may significantly affect the biochemical processes taking place in the soil and its enzymatic activity [22]. Soil enzymes (the so-called decomposing exoenzymes) are secreted outside the cells, mainly by soil microorganisms and, to a lesser extent, by plants and soil fauna. These enzymes take part in the transformation of carbon, nitrogen, phosphorus, sulfur, and other macro- and micro-elements, as well as in the flow of energy, and thus influence the physical and chemical properties of the soil environment [23,24]. Soil enzymes, namely catalase, urease, and acid and alkaline phosphatases, are a good indicator of soils’ biological activity, particularly those subjected to remarkable modifications [25].
The present study assumed that acidifying substances can significantly reduce the soils’ pH to values that are optimal for highbush blueberry cultivation. The preliminary tests carried out in vases under controlled conditions formed the basis for the subsequent field experiments. The aim of the study was to evaluate the changes in pH, content of macro- and micro-elements, and enzymatic activity of the three tested soils, which were acidified with urea phosphate fertilizer, sulfur, sulfuric acid, and phosphogypsum.
2. Materials and Methods
2.1. Soils
The studies were carried out in the Department of Horticulture and Department of Agroengineering of the West Pomeranian University of Technology in Szczecin.
The experiment determined the ability to reduce the reaction to the requirements of blueberries of three soils:
- Peat: pH 6.22, organic matter content 553.1 g in 1000 g soil, organic carbon content 57.6 g in 1000 g soil, EC 0.48 mS/cm.
- Loamy sand (sand 84%, silt 13%, clay 3%): pH 6.36, organic matter content 29.4 g in 1000 g soil, organic carbon content 6.75 g in 1000 g soil, EC 0.24 mS/cm. In which a natural process of acidification occurred as a result of long-term fallow.
- Loamy silt (sand 43%, silt 53%, clay 4%): pH 7.64, organic matter content 42.1 g in 1000 g soil, organic carbon content 9.87 g in 1000 g soil, EC 0.27 mS/cm.
Soil was dried (air dried) and sieved before experiment in a 2 mm sieve. Skeletal parts were discarded: loamy sand—0.2%, loamy silt—1%.
2.2. Acidifying Substances
Four substances were used for soil acidification, each in three different doses:
- Urea phosphate fertilizer (pH 1.2): content of mineral ingredients—N 17.7%; P2O5 44.6%, [CO(NH2)-H3PO4]—very good solubility in water.0.1 g (300 kg fertilizer per ha = 50 kg N/ha), 0.2 g, 0.3 g fertilizer per 1 kg soil was applied.
- Milled dusty sulfur—sulfur content min. 99.85%.1 g (3000 kg S/ha), 2 g, 3 g sulfur per 1 kg of soil were used.
- Water solution of sulfuric acid H2SO4 (pH 2, pH 3 and pH 4), the soil was watered with 100 mL of water acidified with sulfuric acid per 1 kg of soil.
- Phosphogypsum (pH 1.33)—waste obtained from Police Chemical Plant, being a side-product of the process of obtaining phosphoric acid from phosphorites by extraction with sulfuric acid, 3Ca3(PO4)2-CaF2 + 10H2SO4 → 10CaSO4 + 6H3PO4 + 2HF.
5 g (15 tons/ha), 10 g, 15 g of phosphogypsum per 1 kg of soil were used.
The doses were calculated on the assumption that a 30 cm humus layer will be acidified.
Scheme of the experiment: 3 soils, 4 acidifying substances, 3 doses of test substances experience
3 × 4 × 3 = 36 objects × 5 repetitions = 180 objects
The soils were dried and mixed before the start of the experiment and sieved to separate the skeletal parts and standardize the sample. Then, they were packed in waterproof vases with a capacity of, for example, 8 kg to allow water evaporation, and substances were added according to the scheme. The soils in the packages were thoroughly mixed, and 100 mL of redistilled water was added per liter of soil. The soils were gradually watered every 2 weeks (moisture was kept at the level of 1.7–2.1 pF). For soils acidified with sulfuric acid, water was acidified to an appropriate pH value before it was added. The changes in the pH of the studied soils were observed for 12 months, and changes in soil reaction were measured six times for every 2 months.
2.3. Elemental Analysis
The pH of the soil in KCl and salinity was measured potentiometrically by the ELMETRON CX 742 instrument. The pH of each soil sample was measured in 1 mol KCl solution (pHKCl) at ratio 1:5. 10 mL portions of soil, previously dried, ground, sieved (ø 2 mm sieve), and thoroughly mixed, were placed in 100 mL beakers, and 50 mL 1 mol KCl were added. After manual stirring, the suspensions are left for 24 h at room temperature. Suspensions were mixed twice before pH measurement. The measurement was conducted potentiometrically, after calibration based on standard solutions in a pH range of 4–7.
The estimation of the content of minerals in dry weight was carried out in accordance with the Polish Standard [26] using certified reagents. Tests were performed in three replications. The analyses were performed at the beginning of the experiment (control) and after 12 months—the end of the experiment. In the soil available, K and P were determined by extracting in C6H10CaO6 and Ca; Mg by extracting in C2H3O2NH4. Total nitrogen concentration was determined by the Kjeldahl distillation method using a Gerhardt 30. The content of potassium and calcium was measured with the atomic emission spectrometry, whereas magnesium content with the flame atomic absorption spectroscopy using iCE 3000 Series. Phosphorus content was determined with the colorimetric method at wavelength 470 nm, employing spectrophotometer Marcel s 330 PRO. The content of available micronutrients (Cu, Zn, Mn, Fe) was by extracting in 1 Mol HCl. Measured with the flame atomic absorption spectroscopy using SAA Solaar [27,28].
2.4. Analysis of Soil Enzymes
Urease was determined by the method developed by Kandeler and Gerber [29]. Five g of soil (were incubated with 0.08 M aqueous or buffered urea solution (pH 10.0) at 37 °C for 2 h. The accumulated ammonium was subsequently extracted with a solution that contained 1 N KCL and 0.01 N HCL. The ammonium was quantified by spectrophotometry at 690 nm. The activity of catalase was determined following Johnson and Temple method [30] by back-titrating residual H2O2 with KMnO4. The mixture of 5 g of dry soil and 0.3% hydrogen peroxide solution was shaken at 120 rpm for 20 min and then 1.5 M H2SO4 was added. Afterwards, the solution was filtered and we titrated the liquid using 0.1M KMnO4. Acid phosphatase activity was measured according to Tabatabai and Bremner [31] modified by Margesin [32]. After the addition of buffered p-nitrophenyl phosphate solution, soil samples (5 g) were incubated for 1 h at 37 °C. The p-nitrophenol released by phosphomonoesterase activity was extracted and colored with sodium hydroxide and determined photometrically at 400 nm.
2.5. Statistical Analysis
All statistical analyses were performed using Statistica 12.5 (StatSoft Polska, Cracow, Poland). Non-parametric methods (Kruskal–Wallis test) were used if neither the homogeneity of variance nor the normality of distribution was established previously. Statistical significance of the differences between means was determined by testing the homogeneity of variance and normality of distribution, followed by ANOVA with Tukey’s post hoc test. The significance was set at p < 0.05. Multivariate analysis was performed by applying principal component analysis (PCA). The data were auto-scaled during pre-processing.
3. Results and Discussion
3.1. Soil pH
Highbush blueberry is a plant that requires very acidic soils (pHKCl 3.8–5.5) and is thus one of the few grown on a larger scale. In this study, the analyzed soils’ reaction ranged from slightly acidic in the case of loamy sand and peat, to alkaline for loamy silt (Table 1). All acidifying substances used significantly lowered the pH of the tested soils in comparison with the control object. The decrease in the soil pH intensified over time, which was in line with the results shown in the studies of Krzebietke and Benedycka [19] and Ochmian et al. [33]. Fertilization can directly or indirectly change the soil’s chemical, physical, and microbiological properties, thereby influencing its productivity [34,35].

Table 1.
Effect of acidifying substances on the change in pH of loamy silt, peat and loamy sand.
Of the analyzed soils, the least acidification was observed in loamy silt (Table 1). It was observed that the extent of acidification depended on the soil texture. Loamy silt is characterized by a high ability to maintain a constant pH. The substances used in the study lowered the alkaline nature of this soil (7.64) to slightly acidic (5.56–6.59) and neutral (6.60–7.09). The lowest pH was found in loamy silt fertilized with 3 g of sulfur dust; in relation to the original value, a decrease in pH to 5.56 (i.e., by 2.08 units) was recorded. Peat has a lower buffer capacity than loamy silt (against changes in soil pH) because it consists mainly of humidified organic matter with a high proportion of humus and mineral acids, acidifying the soil environment. In this study, peat was found to be highly acidified. Depending on the type and dose of the substance used, the pH of this decreased from 6.22 to ≥4.5 (strong acidic reaction) and <5.5 (acidic reaction). The highest acidifying effect was noted with the application of sulfur dust at a dose of 1, 2, and 3 g. After adding this substance, the pH decreased to 3.99, 3.55, and 2.34 (i.e., by 2.33, 2.67, and 3.88 units, respectively). Among the analyzed soils, the loamy sand has the smallest soil sorption complex and the lowest buffer capacity. Therefore, even a small inflow of acidic substances can cause acidification, which is confirmed by this study’s results. Similar to loamy silt and peat, the lowest pH was recorded in loamy sand after the application of sulfur dust. As the dose of this substance increased to 1, 2, and 3 g, the examined loamy sand’s pH decreased to 4.26, 3.17, and 2.84 (i.e., by 2.1, 3.19, and 3.52 units), respectively. This agrees with the previous study’s results [36], which confirmed soil acidification after sulfur fertilization. After its addition to the soil, sulfur gradually oxidizes to sulfate, causing a significant salinity increase [37,38]. Oxidation of sulfur leads to hydrogen release, which acidifies the soil environment [39]. The addition of urea phosphate causes soil acidification due to phosphoric acid in its composition [40]. Changes in soil pH caused by urea phosphate are also associated with the presence of nitrogen. The transformation of nitrogen is considered one of the main mechanisms responsible for changing the soil pH [41]. In the present study, the application of urea phosphate, regardless of the dose, lowered the pH of peat and loamy sand to the range recommended to cultivate highbush blueberry. The acidifying effect of urea phosphate, which can be favorable for highbush blueberry cultivation, was also confirmed by Ochmian et al. [33]. Comparable results were obtained after applying phosphogypsum in loamy sand, but these were not confirmed by Sosulski et al. [42], as the authors did not find any significant change in the pH of soil toward acidity with the use of phosphogypsum.
3.2. Soil Salinization
Due to the high sensitivity of highbush blueberry to increase the salinity of the soil, fertilizers that maintain the specific conductivity (EC) at <2 mS/cm should be used in its cultivation [43]. In the present study, the soils’ salinity was influenced by their buffer capacity and the type and dose of the acidifying substance used (Table 2). Most salts were introduced after the application of phosphogypsum, followed by sulfur and urea phosphate. Due to low buffer capacity, the highest salinity was recorded in loamy sand among the analyzed soils. After applying phosphogypsum at a dose of 15 g/vase, the salinity of loamy sand was 8.31 g/kg NaCl. Sulfuric acid (H2SO4) reacts with the calcium present in the soil, converting it into a soluble form, while the calcium ions in the soil solution cause the displacement of exchangeable sodium. As a result, the salinity levels are reduced, permeability and soil aggregation are increased, and the sodium sulfate in the soil solution is washed out of the soil [44], which is confirmed by this study. The most favorable salinity level for the cultivation of highbush blueberry was achieved after applying H2SO4 solution (average: 0.22 for loamy silt, 1.48 for peat, and 1.37 g/kg NaCl for loamy sand), regardless of the pH of the substance. Similar results were observed after applying sulfur by El-Sharkawy et al. [45] and Zayed et al. [44]. The salinity levels recommended for blueberry cultivation were also recorded after the addition of urea phosphate in loamy silt. Compared to the control, urea phosphate slightly affected salinity, which changed, depending on the dose applied, from 0.77 to 1.27 g/kg NaCl. The principle component analysis (PCA) showed that regardless of the acidifier used, an increase in salinity of loamy silt, peat and loamy sand was associated with a decrease in soil pH. In some cases, the effect of an increase in the cations of calcium on the increase in salinity is observed, especially when phosphogypsum is used. However, this relation was not found, e.g., when ammonium sulfate was used in peat (Figure 1 and Figure 2). The increase in assimilable calcium has a positive effect on the development of plants on saline soils [46].
Table 2.
Effects of acidifying substances after 12 months on the salinity of loamy silt, peat and loamy sand (g/kg NaCl).
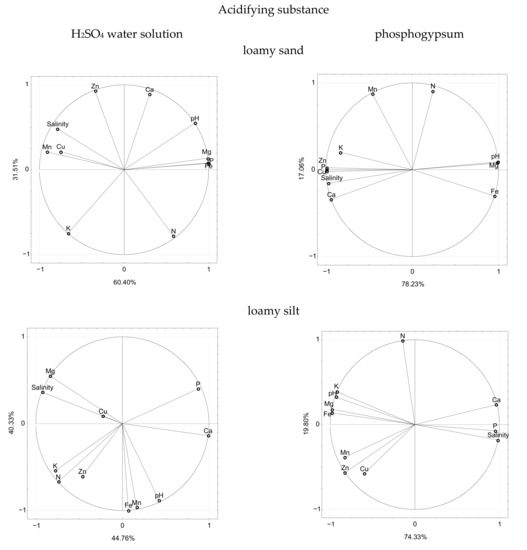
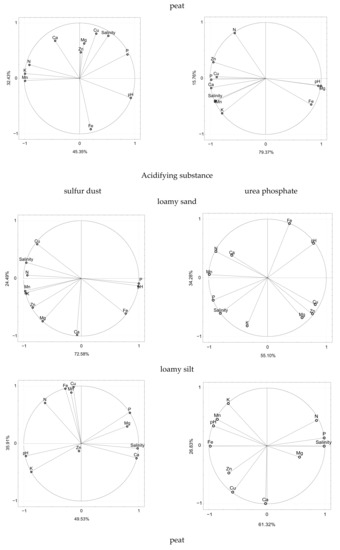
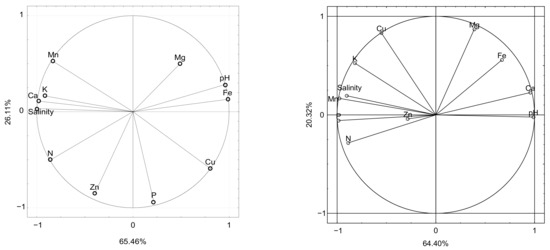
Figure 1.
The principle component analysis (PCA) for acidifying substances and minerals in tested soils.
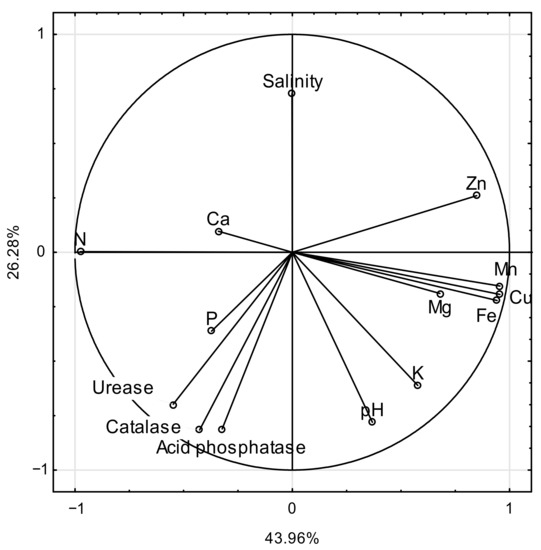
Figure 2.
Relationship between acidifying substances and the content of macro- and micro-elements and soil enzymes.
3.3. Macro-elements
Highbush blueberry demands a large amount of nitrogen from the soil, while it requires only a small amount of phosphorus, potassium, magnesium, and calcium [47,48,49]. However, its optimal development and yield depend on the mutual relationships between these elements. In the present study, the highest nitrogen content was found after applying urea phosphate (Table 3) in all analyzed soils. It has been reported that due to the application of urea phosphate, the content of ammonium and nitrate nitrogen in the soil increases, and the conversion of ammonium nitrogen to nitrates takes place quickly [19,50]. The soil reaction influences the efficiency of this process. Lowering the soil’s pH below 5.0 limits nitrification [51], and below pH 4.5, the process stops [52]. The highest amount of nitrogen was recorded in vases with the highest dose of urea phosphate (0.3 g), and the content increased by 24% in loamy silt and peat and by 20% in loamy sand. The application of urea phosphate at the dose of 2 g/vase (which corresponds to 100 kg N/ha) satisfied highbush blueberry’s nitrogen requirements. The dose of 3 g (150 kg N/ha) has been found to be too high because highbush blueberry poorly utilizes nitrogen above 120 kg/ha [53], while at a nitrogen level above 150 kg/ha, it can even die [54]. The PCA showed that the nitrogen content was positively related to phosphorus concentration and salinity, and negatively related to soil pH (Figure 1 and Figure 2). A significant positive relationship between the increase in the soil’s nitrogen and salinity was also confirmed by Krzebietke and Benedycka [19] and Mirzakhaninafchi et al. [50]. In addition, increasing the doses of sulfur dust was found to increase the amount of nitrogen in the analyzed peat and loamy sand. According to the PCA, the increase in nitrogen in these soils was associated with a decrease in pH and an increase in salinity (Figure 1 and Figure 2). It should be noted that sulfuric acid and phosphogypsum solutions do not contain nitrogen in their composition. Therefore, acidification with these substances resulted in a significant decrease in the amount of nitrogen in loamy silt, loamy sand and increased peat (Figure 1 and Figure 2). The significant increase in peat nitrogen content following fertilization with acidifying substances containing sulfur should be associated with their potential to cause more intensive mineralization of organic matter. The growth of soil microorganisms is dependent on the C:N:S ratio in the soil. Excess of mineral sulfur in the soil in relation to nitrogen forces the release of nitrogen through the microbiological decomposition of organic compounds [55].
Table 3.
Effects of acidifying substances after 12 months on total nitrogen in loamy silt, peat and loamy sand (g/kg).
In the control objects, the content of phosphorus was found to be medium in loamy silt and low in peat and loamy sand, in relation to the limited values of phosphorus in the soil [56] (Table 4). Highbush blueberry has a low demand for phosphorus [49]. The N:P ratio is an important parameter and should be about 10–15 [57]. Excess phosphorus can limit the uptake of microelements by blueberry bushes, which are very sensitive to their deficiency [58]. Among the acidifying substances used in the study, phosphogypsum and urea phosphate contain phosphorus in their chemical composition. Therefore, in all the soils studied, the highest increase in this element was found after applying phosphogypsum and urea phosphate. In acidic soils, urea obtained from urea phosphate favors the chelation of calcium by organic matter and phosphorus’s solubility. The level of phosphorus in the analyzed soils increased as the dose of both fertilizers increased. Phosphorus content in all soils reached a high level of >40 mg P/kg, except in loamy sand fertilized with phosphogypsum, in which the amount of phosphorus was in the range 26.4–37.2 mg P/kg (average). The highest phosphorus content was found in peat fertilized with urea phosphate at a dose of 0.3 g, which was more than six times higher (125.6 mg P/kg) than the control (19.2 mg P/kg). A similar increase in assimilable phosphorus in the soil after applying urea phosphate was reported by Takasu et al. [59] and Ochmian et al. [33]. Furthermore, the PCA showed that when phosphogypsum and urea phosphate were applied in loamy silt, peat, and loamy sand, the phosphorus content exhibited a positive relationship with the degree of salinity and a negative relationship with pH, iron, and, generally, magnesium (Figure 1 and Figure 2). Studies in the literature also confirm that the availability of phosphorus to plants decreases with the decrease in pH value [60], because at a low soil pH, phosphorus retrogrades to compounds with clay, iron, and manganese, and as a result, poorly soluble forms of these elements are formed [52]. The addition of excessive amounts of sulfur to the soil causes a decrease in the pH value, stimulating changes in the content of nutrients in their available forms [61]. Regardless of the form, sulfur fertilization limits the availability of soil phosphorus to plants [62]. In this study, loamy silt fertilized with H2SO4 solution and sulfur dust, regardless of the dose, contained 20% and 30% more phosphorus than the control soil. A higher amount of phosphorus was also found in the peat fertilized with sulfur dust (by 21% on average), whereas a decrease in phosphorus was only recorded in loamy sand, successively by 67% and 39%, after the application of H2SO4 solution and sulfur dust, regardless of the dose. The high buffer capacity of loamy silt and peat limits the retrogradation of phosphorus, whereas the low buffer capacity of humus-poor loamy sand favors greater acidification and chemical precipitation of the forms that are not absorbed by this element. In acidic soils, organic matter limits the formation of insoluble aluminum and iron phosphates [63].
Table 4.
Effects of acidifying substances after 12 months on the content of available phosphorus in loamy silt, peat and loamy sand (mg/kg).
The potassium content was high in the control objects in loamy silt and low in peat and loamy sand [56] (Table 5). Blueberry does not require high potassium fertilization [64]. Moreover, excess potassium in the soil limits other cations’ uptake, including magnesium, by blueberry bushes [65]. The use of acidifying substances caused a significant increase in the concentration of assimilable potassium in peat and loamy sand, but its levels were below optimal for blueberry growth. A decrease in the potassium content was noted in loamy silt, regardless of the type and dose of the acidifier used. However, the level of this element remained high. In loamy silt, potassium is strongly bound by clay minerals, and its release from the sorption complex of the soil is difficult. A reduction in potassium concentration after the sulfur application was found by Majcherczak et al. [62]. However, in the peat and loamy sand examined in the present study, the concentration of potassium increased by 59% and 63%, respectively, after the application of sulfur dust at the highest dose, and due to this increase, the potassium content reached a medium level in peat and a high level in loamy sand. It should be noted that an increase in the concentration of hydrogen and ammonium ions causes a rapid displacement of potassium from the sorption complex of loamy sand and peat, which favors a periodic increase in the easily accessible forms. The results of PCA indicated a significant relationship between the assimilable potassium and the pH, as well as the content of N, P, Ca, and Mg in the soil (Figure 1 and Figure 2) [66]. Sometimes, the lime application also increases the binding of potassium. High levels of calcium and magnesium in the soil solution may limit potassium’s assimilability [52]. In the loamy silt fertilized with phosphogypsum in this study, the potassium content was lower by 8% on average, regardless of the dose.
Table 5.
Effects of acidifying substances after 12 months on the content of available potassium in loamy silt, peat and loamy sand (mg/kg).
With respect to the limit values [56], the magnesium concentration in loamy silt, peat, and loamy sand in the control objects was high (Table 6). Among the acidifying substances studied, only phosphogypsum showed an unambiguous effect on lowering the assimilable magnesium content in the analyzed soils without reducing the values below the high level. The lowest potassium concentration was found after the application of 15 g phosphogypsum, with a reduction of 46% in loamy silt, 42% in peat, and 71% in loamy sand. From the PCA, it was found that the decrease in the content of assimilable magnesium was significantly influenced by the decrease in soil pH (Figure 1 and Figure 2). Takasu [67] and Takasu et al. [59] showed that fertilization with phosphogypsum and gypsum could increase magnesium. A short-term increase in the content of assimilable magnesium may occur due to its displacement from the sorption complex by calcium. On the other hand, the influence of sulfur fertilization on the decrease in the assimilable magnesium was stated by Majcherczak et al. [62]. In the present study, sulfur dust significantly increased magnesium’s content in mineral soils (loamy silt and loamy sand) and decreased this element in organic peat. The increase in the content of assimilable magnesium after sulfur application in mineral soils may result from its displacement from the sorption complex by hydrogen produced due to sulfur oxidation. The effect of urea phosphate on the content of magnesium in peat was negligible. In loamy silt and loamy sand, significantly larger amounts of this element were recorded after applying urea phosphate at the lowest doses. By contrast, a decrease in the concentration of assimilable magnesium in the soil after applying urea phosphate was found by Ochmian et al. [33]. The PCA showed that the increase in the amount of assimilable Mg in mineral soils was caused by a decrease in soil pH, while, in peat, increase in acidity caused a decrease in the amount of this element (Figure 1 and Figure 2). In the soil, some elements interact antagonistically or synergistically with each other, and as a result, may become partially or permanently immobilized. This study showed the positive effects of N and P and the antagonistic effects of K and Ca on Mg content (Figure 1 and Figure 2), which were confirmed earlier by Zamaniyan et al. [68] and Nguyen et al. [66].
Table 6.
Effects of acidifying substances after 12 months on the content of available magnesium in loamy silt, peat and loamy sand (mg/kg).
Highbush blueberry has a low calcium requirement [69]. Among the acidifying substances used in the study, only phosphogypsum contains calcium in its chemical composition. The highest concentration of calcium was found in the objects in which 15 g of phosphogypsum was used (Table 7). Compared to the control, this element’s content increased more than three times in loamy silt, almost two times in peat, and almost four times in loamy sand. Calcium is antagonistic to phosphorus and limits, by itself, the absorption of many macro- and micro-elements. The PCA showed that only in peat fertilized with sulfuric acid, sulfur dust, and urea phosphate, the concentration of assimilable calcium decreased with an increase in assimilable phosphorus concentration (Figure 1 and Figure 2). However, this relation was not found with phosphogypsum (Figure 1 and Figure 2). When phosphogypsum is used for acidification, phosphorus and calcium are introduced concurrently, so no antagonism between these elements becomes apparent. The increase in calcium concentration in the soil under the influence of phosphogypsum was confirmed by Takasu [67] and Takasu et al. [59]. The authors demonstrated [59] that phosphogypsum can have a limited effect on the solubility of calcium in soils rich in clay minerals such as alophans. The increase in the assimilable calcium observed in loamy silt and peat after applying sulfur dust is due to the displacement of this element from the sorption complex by hydrogen cations released during sulfur oxidation [70]. In acidic organic soils, urea phosphate immobilizes calcium in the form of insoluble calcium phosphate [19]. In the peat examined in this study, after applying urea phosphate, the calcium content was, on average, 9% lower than that in the control.
Table 7.
Effects of acidifying substances after 12 months on the content of available calcium in loamy silt, peat and loamy sand (mg/kg).
The ratios of individual macro-nutrients in the soil influence blueberry bushes’ development and should be as follows: K:Mg = 4:1, Ca:Mg = 10:1, and Ca:K = 5:1 [57]. A very narrow K:Mg ratio found in the present study confirmed the lack of assimilable potassium and the need for its supplementation. Potassium also affects the assimilability of NO3−, Mn, and Fe. Higher Ca:Mg and Ca:K ratios in the studied soils indicated a large excess of assimilable Ca. In loamy sand and peat, a high proportion of assimilable Ca causes a decrease in K, Fe, Mn, Cu, and Zn’s assimilability.
3.4. Micro-elements
The solubility of iron in the soil increases with acidification and under reducing conditions [71]. Insoluble forms of iron are present in the soil as oxides and hydroxides, sulfates, carbonates, and phosphates. However, organic iron combinations are mobile and accessible to plants [72]. In acidic soils, iron toxicity may occur under reducing conditions [73,74]. In a temperate climate zone, iron deficiency does not occur in the soil unless the chemical balance is disturbed by anthropogenic factors [73]. The Fe-antagonistic elements are P, Ca, Cu, Zn, and Mn, while the synergistic element is K. All acidifying substances used in this study caused a significant reduction in the amount of assimilable Fe in the tested soils (Table 8). However, according to the limit values [27], its abundance was high. It was observed that the application of sulfuric acid solution with pH 2, sulfur dust at a dose of 1 g/vase, and urea phosphate at a dose of 2 g/vase reduced the content of assimilable iron in peat and loamy sand, but the content of Fe was still several times higher than the optimal content of 75–150 mg/kg [75]. Fe deficiency occurs in highbush blueberry plants only if the soil pH is too high, and in the presence of excess Ca and P [6]. The PCA showed that the reduction in available iron was associated with an increase in acidification, salinity, and available calcium or phosphorus (Figure 1 and Figure 2). Furthermore, in loamy sand and peat, it was found that an increase in its antagonistic elements caused the decrease in available Fe: Cu, Zn, and Mn (Figure 1 and Figure 2). Moreover, in organic soils, organic acids’ presence leads to the complexation of metal cations by their carboxylic groups [76].
Table 8.
Effects of acidifying substances after 12 months on the content of available iron in loamy silt, peat and loamy sand (mg/kg).
Manganese is bound strongly by clay minerals and carbonates, and weakly by organic matter (high mobility in organic soils). With an increase in organic matter, the available Mn content also increases [72,77]. Manganese binds other trace metals (e.g., copper) and may limit their accessibility to plants. The presence of sulfur favors manganese’s assimilability, and its solubility increases at soil pH < 5.5 [78,79]. Generally, all the acidifying substances used increased the amount of assimilable manganese in peat and loamy sand and decreased this element in loamy silt (Table 9). The available manganese in loamy silt was at the medium level and in loamy sand at the high level in relation to the limit values [27]. Blueberry has a low demand for assimilable Mn, and its optimal content is 20–50 mg/kg of soil [75]. In peat, only a slightly higher amount of assimilable Mn compared to optimal level was found, while in loamy sand, it was more than three times higher. The application of a sulfuric acid solution with pH 2, sulfur dust at a dose of 1 g/vase, and urea phosphate at a dose of 0.2 g/vase caused an increase in the assimilable forms of manganese in peat and loamy sand. No shortage of available Mn has been observed in blueberry cultivation [6]. However, its excess (>350 mg/kg) negatively affects the development of highbush blueberry [80]. In this study, an increased concentration of assimilable Mn in loamy sand and peat was positively correlated with salinity, soil pH, and assimilable K concentration (Figure 1 and Figure 2). In turn, a decrease in the amount of available Mn in loamy silt was found with an increase in the content of available calcium when phosphogypsum, sulfur, and urea phosphate were applied for fertilization, and with an increase in Cu content when hydrochloric acid solutions were applied (Figure 1 and Figure 2).
Table 9.
Effects of acidifying substances after 12 months on the content of available manganese in loamy silt, peat and loamy sand (mg/kg).
Clay soils are usually rich in zinc, while carbonate and sandy soils are poor. Zinc is a very mobile metal in the soil, whose solubility increases with acidification and organic matter growth [72,77]. The present study showed that all the acidifying substances used generally increased the amount of assimilable zinc in peat and loamy sand, but decreased or had no effect on its content in loamy silt (Table 10). Regardless of the fertilization variant, loamy silt and loamy sand were rich, and peat was poor in assimilable zinc considering the limit values [27]. Highbush blueberry requires 5–25 mg Zn/kg and 1–4 mg Cu/kg of soil [75]. Optimal content of the assimilable forms of zinc and copper was found in peat, while in loamy sand, these elements were several times higher than optimal. The application of sulfuric acid solution with pH 2, sulfur dust at a dose of 1 g/vase, and urea phosphate at a dose of 0.2 g/vase caused an increase in assimilable content zinc in peat and ammonium sulfate in loamy sand. In addition, these substances caused an increase in the content of assimilable copper in peat and loamy sand. The PCA showed that the increase in the amount of available Zn in loamy sand and peat was caused by an increase in acidity (Figure 1 and Figure 2). In acidic soils, zinc is mainly absorbed by clay minerals and only to a negligible extent by organic matter [81]. With the increase in organic matter and decrease in soil pH, an increase in Zn availability has been observed in previous studies [72,77]. Furthermore, Zn’s sorption depends on the presence of other elements; for example, copper is absorbed faster by soils than zinc [82].
Table 10.
Effects of acidifying substances after 12 months on the content of available zinc in loamy silt, peat and loamy sand (mg/kg).
In the analyzed loamy silt, however, it was found that the decrease in the amount of assimilable zinc was closely related to the increase in the content of P and Ca (Figure 1 and Figure 2). Sorption of Zn increases rapidly above pH 5 [83], while phosphate fertilization, liming, and addition of sulfur compounds reduce the assimilability of this element [73,84,85,86]. In acidic soils, phosphorus increases the absorption of zinc, especially in Fe and Al’s presence. Increased adsorption of zinc under phosphate’s influence is primarily attributed to the formation of a P–Zn complex on colloidal surfaces [87]. Moreover, Mn oxides can bind to Zn, contributing to its deficiency [88,89]. In their study, Krzywy et al. [90] did not find any significant effect of phosphogypsum on assimilable Zn content in the soil. On the other hand, Kulczycki [78] demonstrated that sulfur fertilization does not affect the content of assimilable zinc in the soil, but it affects Zn’s higher uptake by plants.
Copper is strongly bound by clay minerals and humus, and precipitates in sulfides, sulfates and carbonates, giving rise to insoluble forms. In an acidic environment, Cu forms easily soluble compounds. The mobility and availability of copper in the soils is determined by the organic compounds [73,91]. Low-weight organic compounds released during the decomposition of organic matter increase copper’s assimilability, while peat organic substance strongly binds and immobilizes this element [73]. Furthermore, the solubility of copper is influenced by P, Zn, iron hydroxides, Mn, and Al, as well as clay minerals. The present study showed that the acidifying substances caused an increase in the content of assimilable copper in loamy sand, while in loamy silt and peat, their effect varied, but most frequently, there was a decrease in the amount of assimilable copper (Table 11). Regardless of the acidification variant, the amount of available copper was high in loamy silt and loamy sand, and low in peat in relation to the limited values [27]. In the previous studies, Krzywy et al. [90] and Skwierawska et al. [84] did not find any significant influence of phosphogypsum and sulfur, respectively, on the content of assimilable Cu in the soil. Similarly, Kulczycki [78] demonstrated that sulfur fertilization does not affect the content of assimilable copper in the soil, but it increases Cu’s uptake by plants, especially in sandy, less clayey soils.
Table 11.
Effects of acidifying substances after 12 months on the content of available copper in loamy silt, peat and loamy sand (mg/kg).
The PCA showed that the decrease in the content of assimilable copper in loamy silt was associated with an increase in pH and the amount of antagonistic P in the soil (Figure 1 and Figure 2). Pérez-Novo et al. [87] have shown that P–Cu complexes are formed on colloidal surfaces. The effect of acidification on Cu content was also observed in peat, but in some cases, an increase in the assimilable Fe content was found to reduce assimilable Cu content (Figure 1 and Figure 2). The organic iron compounds present in the peat are known to easily absorb and immobilize Cu [88,89]. On the other hand, the increase in the amount of assimilable copper in loamy sand was unequivocally due to a decrease in pH and the content of assimilable phosphorus and iron (antagonistic elements of Cu) and an increase in the content of assimilable K and Zn forms (Figure 1 and Figure 2). It has been reported that the higher the pH and cation-exchange capacity of the soil, the worse the desorption of copper. Sorption of Cu increases rapidly above pH 4 [83]. The small proportion of clay minerals and organic matter in the loamy sand favors copper’s solubility because this element, like Zn, is highly absorbed by clay minerals and organic matter [81,82]. Moreover, copper is bound by Fe, Mn oxides, and sulfur [88]. It should be emphasized that humic acids’ sorption is more reversible than by oxides [81].
3.5. Soil Enzymatic Activity
The catalase activity in the soil mainly depends on oxygenation, humidity, temperature, pH, the content of humus and clay, the chemical properties of soil, and the source of the enzyme [92,93]. Catalase is permanently absorbed by clay minerals and organic colloids in the soil, which stabilizes and limits its activity. In the present study, the best catalase activity was noted in peat and the worst in loamy sand (Table 12). The acidifying substances used caused the highest decrease in this enzyme activity in peat (by 26%) and the lowest decrease in loamy sand (by 7%) compared to the control. On the other hand, only urea phosphate increased catalase activity compared to the control in all the analyzed soils (loamy silt, peat, and loamy sand). In loamy silt, an increase in the doses of urea phosphate significantly increased the enzyme activity, while in peat and loamy sand, the activity was decreased (at the highest dose, no significant difference was noted compared to the control). Moreover, it was found that regardless of the soil, the lower the pH of the sulfuric acid solution and the higher the doses of phosphogypsum and sulfur dust, the more pronounced the decrease in catalase activity. However, Bielińska and Żukowska [23] showed that nitrogen and phosphorus in the soil stimulate the soil enzymatic activity.
Table 12.
Activity of catalytic activity enzyme in the soil depending on the acidifying substances used after 12 months (% O2·g).
The PCA showed that catalase activity was positively associated with urease and acid phosphatase activity and the content of assimilable phosphorus and total nitrogen in the soil. It was found that a decrease in pH caused the decrease in catalase activity in the studied soils—significantly below the optimal value, i.e., 7.0 (Table 13). Catalase activity is seen at a pH of 5.0–10.5. Moreover, a negative effect of salinity and the content of assimilable heavy metals—Zn, Cu, Mn, and Fe—on catalase activity has been reported in other studies. For instance, Telesiński [93] showed the negative effect of salinity, while Wyszkowska et al. [94] and Kızılkaya et al. [24] showed the negative effect of heavy metal contamination on the catalase activity in the soil. In turn, Skwaryło-Bednarz et al. [95] showed a positive effect of small amounts of Cu and Zn on the soil catalase activity. The study showed the best urease activity in peat and the worst activity in loamy sand. The acidifying substances caused the highest decrease in the urease enzyme activity in peat (by 29%) and the lowest in loamy silt (by 7%) compared to the control. The persistence of urease in the soil is mainly related to the presence of humus and clay minerals [24,96,97].
Table 13.
Activity of urease activity enzymes in the soil depending on the acidifying substances used after 12 months (μmol p-NP kg/h).
In addition, the study showed that the activity of urease increased only after the application of urea phosphate, with the best effect noted at a dose of 0.1 g/vase and the least effect at a dose of 0.3 g/vase. However, when other acidifying substances were used, urease activity decreased significantly compared to the control. The highest doses of acidifying substances caused the highest reduction in the activity of urease.
The PCA showed that urease activity was positively related to catalase and acid phosphatase activity and the content of assimilable phosphorus and total nitrogen in the soil. The urease enzyme activity is optimal at a pH of 6–7 [96]. As acidification increases, its activity significantly decreases. Bielińska and Żukowska [23] showed that soil urease activity correlated with C and N organic and N-NH4 content. On the other hand, a decrease in its activity was caused by a decrease in pH value and increased salinity and content of assimilable heavy metals such as Zn, Cu, Mn, and Fe. Telesiński [93] showed that salinity had a negative effect on urease activity. Furthermore, the inhibiting effect of increased amounts of heavy metals on the activity of this enzyme has been confirmed by other authors [24,98,99].
The present study showed the highest acid phosphatase enzyme activity in peat and the lowest activity in loamy sand (Table 14). Phosphatase enzymes are closely related to clay minerals and humus [24,97]. The acidifying substances used in this study caused the maximum decrease in acid phosphatase activity in loamy sand (by 21%) and the smallest decrease in loamy silt (by 1%) compared to the control. It was also found that the application of urea phosphate at all doses caused a significant increase in the activity of acid phosphatase in loamy silt, while in loamy sand and peat, an increase was observed only at a dose of 0.1 g/vase. Moreover, a significant increase in its activity was caused by phosphogypsum at a dose of 5 g/vase in loamy silt and peat, and by sulfuric acid solution with pH 2 in peat. In the remaining variants of fertilization, no significant effect or decrease in this enzyme activity in relation to the control was found. The PCA showed that acid phosphatase activity is closely positively related to that of urease and catalase. The increased activity of acid phosphatase in the soils studied was observed with an increase in the content of assimilable phosphorus and total nitrogen. On the other hand, a decrease in the enzyme activity resulted mainly from an increase in salinity and the content of assimilable heavy metals, namely Zn, Cu, Mn, and Fe.
Table 14.
Activity of acid phosphatase enzyme in the soil depending on the acidifying substances used after 12 months (μmol p-NP kg/h).
The activity of acid phosphatase is the highest at the pH range of 4–6 [96]. The soils studied mostly had an optimal pH for the good activity of this enzyme. The positive influence of nitrogen fertilization on acid phosphatase activity was indicated in the studies by Gajda et al. [100] and Nowak et al. [101]. Nevertheless, other factors had a limiting effect on this enzyme. Phosphatases respond quickly to an increase in salinity [93] and the content of heavy metals in the soil [24,98,102,103]. Even a small increase in heavy metals in the soil favors these enzymes’ activity [101]. In summary, the activities of urease, acid phosphatase, and catalase enzymes are closely related. The decrease in enzymatic activity is connected with a decrease in the pH value, an increase in salinity, and the content of assimilable heavy metals, including Zn, Cu, Mn, and Fe. On the other hand, an increase in the content of assimilable phosphorus and total nitrogen is conducive to an increase in these enzymes’ activity.
4. Conclusions
- Acidifying substances lowered the reaction of peat and loamy sand to highbush blueberry requirements, while the reaction of loamy silt was changed only slightly, which made it unsuitable for the cultivation of this plant. Sulfur dust acidified the studied soils rapidly and to the highest extent, followed by urea phosphate and phosphogypsum, while the weakest acidification was achieved with sulfuric acid solutions.
- Among the tested variants of acidifying substances, only sulfuric acid solution with pH 2, urea phosphate at a dose of 0.2 g/vase (in peat and loamy sand), and sulfur dust at a dose of 1 g/vase (in peat soil) lowered the pH of soils to the optimal values required by highbush blueberry, and did not significantly increase salinity.
- The concentration of salt in the soil was increased the most by the highest dose of phosphogypsum, which made it unsuitable for soil acidification in the cultivation of highbush blueberry. The salt concentration was less affected by sulfur and urea phosphate and, to the lowest degree, by sulfuric acid. Loamy sand was the most susceptible to salinity, while peat was the least susceptible.
- Fertilization with acidifying substances caused significant changes in the assimilation of macro- and micro-elements. A dose of 0.3 g/vase (which corresponds to 150 kg/ha) is too high for urea phosphate, and it increases the amount of nitrogen above the standard value, which adversely affects the development of highbush blueberry.
- Among the acidifying substances used, only urea phosphate had a stimulating effect on the enzymatic activity of soils, while the other substances generally did not influence or reduce the activity of the enzymes.
Author Contributions
Material, I.O. and K.K.; conceptualization, I.O., K.K., R.M. and A.J.; methodology, I.O., A.J. and R.M.; formal analysis, I.O., A.J. and R.M.; writing—original draft preparation, I.O., A.J. and R.M.; writing—review and editing, I.O., K.K., R.M. and A.J.; visualization, I.O. and R.M. All authors have read and agreed to the published version of the manuscript.
Funding
This research was supported by the Polish Ministry of Science and Higher Education, grant number NN 310205737 and West Pomeranian University of Technology, grant number 518-07-014-3171-03/18.
Institutional Review Board Statement
Not applicable.
Informed Consent Statement
Not applicable.
Data Availability Statement
The data presented in this study are available on request from the corresponding author.
Conflicts of Interest
The authors declare that they have no known competing financial interests or personal relationships that could have appeared to influence the work reported in this paper.
References
- Delian, E.; Bădulescu, L.; Dobrescu, A.; Săvulescu, E.; Bădescu, C. Aspects regarding vegetative growing, reproductive development and minerals distribution in highbush blueberry leaves and fruits as affected by substrate composition. J. Hortic For. Biotech. 2010, 14, 334–341. [Google Scholar]
- Brazelton Cort. World Blueberry. Acreage&Production 2016. 2014. Available online: http://dev.manicmoosemedia.com/SERegional/wp-content/uploads/4.-Cort-Brazelton-World-Blueberry-Acreage-and-Production-2016.pdf (accessed on 12 August 2020).
- Ochmian, I.; Błaszak, M.; Lachowicz, S.; Piwowarczyk, R. The impact of cultivation systems on the nutritional and phytochemical content, and microbiological contamination of highbush blueberry. Sci. Rep. 2020, 10, 1–14. [Google Scholar] [CrossRef] [PubMed]
- Liu, G.; Hanlon, E. Soil pH Range for Optimum Commercial Vegetable Production; University of Florida Institute of Food and Agricultural Sciences: Gainesville, FL, USA, 2012; pp. 1–12. [Google Scholar]
- Ochmian, I.; Figiel-Kroczyńska, M.; Lachowicz, S. The Quality of Freeze-Dried and Rehydrated Blueberries Depending on their Size and Preparation for Freeze-Drying. Acta Univ. Cibiniensis Ser. E Food Technol. 2020, 24, 61–78. [Google Scholar] [CrossRef]
- Korcak, R.F. Nutrition of blueberry and other calcifuges. Hort. Rev. 1988, 10, 183–227. [Google Scholar]
- Wach, D. Effect of soil mulching with some organic materials on the size of berries highbush blueberries (Vaccinium corymbosum L.). In Annales Universitatis Mariae Curie-Skłodowska Lublin; Sciendo: Warsaw, Poland, 2008; Volume XVIII (2), pp. 9–14, (In Polish, abstract In English). [Google Scholar]
- Ochmian, I.; Kozos, K. Influence of foliar fertilisation with calcium fertilisers on the firmness and chemical composition of two highbush blueberry cultivars. J. Elem. 2015, 20, 185–201. [Google Scholar] [CrossRef]
- Ochmian, I.; Kozos, K.; Chełpiński, P.; Szczepanek, M. Comparison of berry quality in highbush blueberry cultivars grown according to conventional and organic methods. Turk. J. Agric For. 2015, 39, 174–181. [Google Scholar] [CrossRef]
- Chmielewski, T.; Chmielewski, S. The process of lake and bog ecosystems disappearance in the region of Polesie National Park since the second half of XX ct. and the prospects of their protection. Probl. Ekol. Kraj. 2010, 26, 121–134. [Google Scholar]
- Chambers, F.M.; Cloutman, E.W.; Daniell, J.R.G.; Mauquoy, D.; Jones, P.S. Long-term ecological study (palaeoecology) to chronicle habitat degradation and inform conservation ecology: An exemplar from the Brecon Beacons, South Wales. Biodivers. Conserv. 2013, 22, 719–736. [Google Scholar] [CrossRef]
- Wróblewska, W.; Czernyszewicz, E. The level and price volatility of blueberry fruits (Vaccinium corymbosum L.) obtained by producer and on the wholesale market during 2007–2016. Rocz. Nauk. Stowarzyszenia Ekon. Rol. Agrobiz. 2017, 19, 275–281. [Google Scholar] [CrossRef][Green Version]
- Bădescu, C.; Petre, G.H.; Bădescu, C.; Delian, E.; Bădescu, A. Soil and climatic limitations to blueberry culture in Romania submontane areas. Acta Hortic. 2009, 810, 765–770. [Google Scholar] [CrossRef]
- Ochmian, I.; Malinowski, R.; Kubus, M.; Malinowska, K.; Sotek, Z.; Racek, M. The feasibility of growing highbush blueberry (V. corymbosum L.) on loamy calcic soil with the use of organic substrates. Sci. Hortic. 2019, 257, 108690. [Google Scholar] [CrossRef]
- Ochmian, I.; Grajkowski, J.; Skupień, K. Influence of substrate on yield and chemical composition of highbush blueberry fruit cv. ‘Sierra’. J. Fruit Ornam. Plant Res. 2009, 17, 89–100. [Google Scholar]
- Kozos, K.; Ochmian, I. The influence of fertilisation urea phosphate on growth and yielding bush of two highbush blueberry cultivars (V. corymbosum). Folia Pomer. Univ. Technol. Stetin. Agric. Aliment. Pisc. Zootech. 2016, 3251, 29–38. [Google Scholar] [CrossRef]
- Gagnon, B.; Simard, R.R.; Lalande, R.; Lafond, J. Improvement of soil properties and fruit yield of native lowbush blueberry by papermill sludge addition. Can. J. Soil Sci. 2003, 83, 1–9. [Google Scholar] [CrossRef]
- Grata, K.; Krzysko-Łupicka, T. Ecological effects of carbamide phosphate on soil diazotrophs in autumn. Part I Ecol. Chem. Eng. 2008, 15, 587–593, (In Polish, abstract In English). [Google Scholar]
- Krzebietke, S.; Benedycka, Z. The influence of urea phosphate on the physicochemical properties of peat substrate under laboratory conditions. Acta Agrophys. 2006, 7, 969–976. [Google Scholar]
- Bratsch, A.; Teach, V. Blueberries for the Upper Pietmond and Mountain Regions. Part 2; Virginia Cooperative Extension: Blacksburg, VA, USA, 2005. [Google Scholar]
- Starast, M.; Karp, K.; Vool, E. Effect of NPK fertilization and elemental sulphur on growth and yield of lowbush blueberry. Agric. Food Sci. 2007, 16, 34–45. [Google Scholar] [CrossRef]
- Shi, Z.J.; Lu, Y.; Xu, Z.G.; Fu, S.L. Enzyme activities of urban soils under different land use in the Shenzhen city, China. Plant Soil Environ. 2008, 54, 341–346. [Google Scholar] [CrossRef]
- Bielińska, E.J.; Żukowska, G. Activity of protease and urease in light soil fertilized with sewage sludge. Acta Agrophys. 2002, 70, 41–47. [Google Scholar]
- Kızılkaya, R.; Aşkın, T.; Bayraklı, B.; Sağlam, M. Microbiological characteristics of soils contaminated with heavy metals. Eur. J. Soil Biol. 2004, 40, 95–102. [Google Scholar] [CrossRef]
- Wang, R.; Dorodnikov, M.; Yang, S.; Zhang, Y.; Filley, T.R.; Turco, R.F.; Zhang, Y.; Xu, Z.; Li, H.; Jiang, Y. Responses of enzymatic activities within soil aggregates to 9-year nitrogen and water addition in a semi-arid grassland. Soil Biol. Biochem. 2015, 81, 159–167. [Google Scholar] [CrossRef]
- Polish Standard. PN-R-04016-21 Chemical and Agricultural Analysis of Soil. In Determination of the Content of Available Zinc, Copper, Anganese, Iron; Polish Committee for Standardization: Warsaw, Poland, 1992. [Google Scholar]
- IUNG (Institute of Soil Science and Plant Cultivation). Fertiliser Recommendations Part I. Limits for Estimating Soil Macro- and Microelement Content. Series P. (44); Państwowy Instytut Badawczy w Puławach: Puławy, Poland, 1990; pp. 26–28. [Google Scholar]
- Ochmian, I.; Oszmiański, J.; Lachowicz, S.; Krupa-Małkiewicz, M. Rootstock effect on physico-chemical properties and content of bioactive compounds of four cultivars Cornelian cherry fruits. Sci. Hortic. 2019, 256, 108588. [Google Scholar] [CrossRef]
- Kandeler, E.; Gerber, H. Short-term assay of soil urease activity using colorimetric determination of ammonium. Biol. Fert. Soils 1988, 6, 68–72. [Google Scholar] [CrossRef]
- Johnson, J.L.; Temple, K.L. Some variables affecting the measurement of “catalase activity” in soil. Soil Sci. Soc. Am. J. 1964, 28, 207–209. [Google Scholar] [CrossRef]
- Tabatabai, M.A.; Bremner, J.M. Use of p-nitrophenyl phosphate for assay of soil phosphatase activity. Soil Biol. Biochem. 1969, 1, 301–307. [Google Scholar] [CrossRef]
- Ochmian, I.; Oszmiański, J.; Jaśkiewicz, B.; Szczepanek, M. Soil and highbush blueberry responses to fertilization with urea phosphate. Folia Hort. 2018, 30, 295–305. [Google Scholar] [CrossRef]
- Dong, Y.J.; He, M.R.; Wang, Z.L.; Chen, W.F.; Hou, J.; Qiu, X.K.; Zhang, J.W. Effects of new coated release fertilizer on the growth of maize. J. Soil Sci. Plant Nutr. 2016, 16, 637–649. [Google Scholar] [CrossRef][Green Version]
- Serrano, J.; Silva, J.; Shahidian, S.; Silva, L.L.; Sousa, A.; Baptista, F. Differential vineyard fertilizer management based on nutrient’s spatio-temporal variability. J. Soil Sci. Plant Nutr. 2017, 17, 46–61. [Google Scholar] [CrossRef]
- Bobowiec, A.; Tabak, M. The effect of waste sulfur obtained during biogas desulfurization on the availability of selected trace elements in soil. Geol. Geophys. Environ. 2018, 44, 345–355. [Google Scholar] [CrossRef]
- Zhao, C.; Degryse, F.; Gupta, V.; McLaughlin, M.J. Elemental sulfur oxidation in Australian cropping soils. Soil Sci. Soc. Am. J. 2015, 79, 89–96. [Google Scholar] [CrossRef]
- Kar, G.; Schoenau, J.J.; Gillespie, A.W.; Dhillon, G.S.; Peak, D. Sulfur Species Formed in the Seed Row of Sulfur-Fertilized Soils as Revealed by K-Edge X-ray Absorption Near-Edge Structure Spectroscopy. Soil Sci. Soc. Am. J. 2019, 83, 1324–1332. [Google Scholar] [CrossRef]
- Margesin, R. Acid and Alkaline Phosphomonoesterase with the Substrate p-Nitrophenyl Phosphate. W: Methods in Soil Biology; Schinner, P.Z.R.F., Öhlinger, E., Kandeler, E., Margesin, R., Eds.; Springer: Berlin/Heidelberg, Germany, 1996; pp. 213–217. [Google Scholar]
- Harter, R.D. Acid Soils of the Tropics. ECHO Technical Note; ECHO: North Fort Myers, FL, USA, 2007. [Google Scholar]
- Cao, X.; Wahbi, A.; Ma, L.; Li, B.; Yang, Y. Immobilization of Zn, Cu, and Pb in contaminated soils using phosphate rock and phosphoric acid. J. Hazard Mater. 2009, 164, 555–564. [Google Scholar] [CrossRef] [PubMed]
- Butterly, C.R.; Bhatta Kaudal, B.; Baldock, J.A.; Tang, C. Contribution of soluble and insoluble fractions of agricultural residues to short-term pH changes. Eur. J. Soil Sci. 2011, 62, 718–727. [Google Scholar] [CrossRef]
- Sosulski, T.; Szara, E.; Labetowicz, J.; Przybysz, M. The influence of calcium carbonate, gypsum and phosphogypsum on the aluminium content in soil and plants. Zesz. Probl. Post Nauk. Roln. 2008, 533, 357–368. [Google Scholar]
- Machado, R.M.; Bryla, D.R.; Vargas, O. Effects of salinity induced by ammonium sulfate fertilizer on root and shoot growth of highbush blueberry. In X International Symposium on Vaccinium and Other Superfruits 1017; ISHS: Maastricht, The Netherlands, 2012; pp. 407–414. [Google Scholar]
- Zayed, B.; Abdelaal, M.; Deweedar, G. Response of rice yield and soil to sulfur application under water and salinity stresses. Egypt J. Agron. 2017, 39, 239–249. [Google Scholar] [CrossRef]
- El-Sharkawy, H.M.; Zayed, B.; Honna, T.; Yamamoto, S. Chemical compositions and salinity development in paddy soil as affected by irrigation intervals of mixed water under saline soil. Pakistan J. Biol. Sci. 2006, 9, 741–745. [Google Scholar] [CrossRef]
- Hadi, M.R.; Karimi, N. The role of calcium in plants’ salt tolerance. J. Plant Nutr. 2012, 35, 2037–2054. [Google Scholar] [CrossRef]
- Komosa, A. Theoretical basis of plant nutrition. In Nutrition of Horticultural Plants. Basics and Perspectives; PWRiL Oddział: Poznań, Poland, 2012. [Google Scholar]
- Komosa, A. Modern nutrition of highbush blueberry. In Atlas of Diseases and Pests of high-Bush Blueberry; Plantpress sp. Z o.o.: Kraków, Poland, 2014; pp. 7–15. [Google Scholar]
- Retamales, J.B.; Hancock, J.F. Blueberries. In Crop Production Science in Horticulture Series, 21; CAB International: Wallingford, CT, USA, 2012. [Google Scholar]
- Mirzakhaninafchi, H.; Mishra, I.M.; Nafchi, A.M. Study on Soil Nitrogen and Electrical Conductivity Relationship for Site-Specific Nitrogen Application. In 2017 ASABE Annual International Meeting; American Society of Agricultural and Biological Engineers: Berrien County, MI, USA, 2017; pp. 1–9, Paper Number: 1700892. [Google Scholar] [CrossRef]
- Fageria, N.K. Upland rice response to soil acidity in Cerrado soil. Pesqui Agropecu Bras. 2000, 35, 2303–2307. [Google Scholar] [CrossRef]
- Weil, R.R.; Brady, N.C. Nitrogen and sulfur economy of soils. In The Nature and Properties of Soils, 15th ed.; Pearson: Columbus, OH, USA, 2017; Chapter 13; pp. 583–642. [Google Scholar] [CrossRef]
- Messiga, A.J.; Haak, D.; Dorais, M. Blueberry yield and soil properties response to long-term fertigation and broadcast nitrogen. Sci. Hortic. 2018, 230, 92–101. [Google Scholar] [CrossRef]
- Bryla, D.R.; Machado, R.M.A. Comparative effects of nitrogen fertigation and granular fertilizer application on growth and availability of soil nitrogen during establishment of highbush blueberry. Front. Plant. Sci. 2011, 2, 46. [Google Scholar] [CrossRef]
- Ghani, A.; McLaren, R.G.; Swift, R.S. Sulphur mineralisation and transformations in soils as influenced by additions of carbon, nitrogen and sulphur. Soil Biol. Biochem. 1992, 24, 331–341. [Google Scholar] [CrossRef]
- Sadowski, A.; Nurzyński, J.; Pacholak, E.; Smolarz, K. Determining the Needs of Fertilization of Fruit Plants; SGGW-AR: Warszawa, Poland, 1990. [Google Scholar]
- Caspersen, S.; Svensson, B.; Håkansson, T.; Winter, C.; Khalil, S.; Asp, H. Blueberry—Soil interactions from an organic perspective. Sci. Hortic. 2016, 208, 78–91. [Google Scholar] [CrossRef]
- Fageria, N.K.; Baligar, V.C. Improving nutrient use efficiency of annual crops in Brazilian acid soils for sustainable crop production. Soil Sci. Plant Anal. 2001, 32, 1303–1319. [Google Scholar] [CrossRef]
- Takasu, E.; Yamada, F.; Shimada, N.; Kumagai, N.; Hirabayashi, T.; Saigusa, M. Effect of phosphogypsum application on the chemical properties of Andosols, and the growth and Ca uptake of melon seedlings. Soil Sci. Plant Nutr. 2006, 52, 760–768. [Google Scholar] [CrossRef]
- Tucher, S.; Hörndl, D.; Schmidhalter, U. Interaction of soil pH and phosphorus efficacy: Long-term effects of P fertilizer and lime applications on wheat, barley, and sugar beet. Ambio 2018, 47, 41–49. [Google Scholar] [CrossRef] [PubMed]
- Kozłowska-Strawska, J. Influence of plant fertilization with different sulphur compounds on the changes of soil reaction. Zesz. Probl. Post Nauk. Rol. 2007, 520, 635. [Google Scholar]
- Majcherczak, E.; Kozera, W.; Ralcewicz, M.; Knapowski, T. Content of total carbon and available forms of phosphorus, potassium and magnesium in soil depending on the sulphur rate and form. J. Elem. 2013, 18, 107–114. [Google Scholar] [CrossRef]
- Bashan, Y.; Kamnev, A.A.; de-Bashan, L.E. Tricalcium phosphate is inappropriate as a universal selection factor for isolating and testing phosphate-solubilizing bacteria that enhance plant growth: A proposal for an alternative procedure. Biol. Fert. Soils 2013, 49, 465–479. [Google Scholar] [CrossRef]
- Voogt, W.; Van Dijk, P.; Douven, F.; Van Der Maas, R. Development of a soilless growing system for blueberries (Vaccinium corymbosum): Nutrient demand and nutrient solution. Acta Hortic. 2014, 1017, 215–221. [Google Scholar] [CrossRef]
- Sullivan, D.; Bryla, D.R.; Costello, R.C. Chemical characteristics of custom compost for highbush blueberry. In Applied Manure and Nutrient Chemistry for Sustainable Agriculture and Environment; Springer: Dordrecht, the Netherlands, 2014; pp. 293–311. [Google Scholar]
- Nguyen, H.; Maneepong, S.; Suraninpong, P. Effects of potassium, calcium and magnesium ratios in soil on their uptake and fruit quality of pummelo. J. Agric. Sci. 2017, 9, 110121. [Google Scholar] [CrossRef]
- Takasu, E. Effect of phosphogypsum application on the chemical property of the soil and Ca uptake of Komatsuna plant. In Proceedings of the Annual Meeting of the Japanese Society of Soil Science and Plant Nutrition, Fukuoka, Japan, 14–16 September 2004; pp. 14–16. [Google Scholar]
- Zamaniyan, M.; Panahandeh, J.; Tabatabaei, S.J.; Motallebie-Azar, A. Effects of different ratios of K: Ca in nutrient solution on growth, yield and chicon quality of witloof chicory (Cichorium intybus L.). Int. J. AgriScience 2012, 2, 1137–1142. [Google Scholar]
- Bohner, A.; Unterweger, P.; Rohrer, V.; Gantar, E.M.; Sobotik, M.; Kappert, R. Autochtonous Vaccinium myrtillus for autochtonous rural value creation? II: European blueberry’s soil ecology and root systems. Acta Hortic. 2014, 1017, 77–83. [Google Scholar] [CrossRef]
- Hamza, M.A. Understanding soil analysis data; Report 327; Department of Agriculture and Food: Perth, Australia, 2008.
- Behera, P.R.; Jegadeeswari, D.; Chitdeshwari, T. Effect of Moisture Regimes and Amendments on Iron Transformation in Acid Soils. Madras Agric. J. 2018, 105, 276–281. [Google Scholar] [CrossRef]
- Li, B.Y.; Zhou, D.M.; Cang, L.; Zhang, H.L.; Fan, X.H.; Qin, S.W. Soil micronutrient availability to crops as affected by long-term inorganic and organic fertilizer applications. Soil Till Res. 2007, 96, 166–173. [Google Scholar] [CrossRef]
- Kabata-Pendias, A.; Pendias, H. Biogeochemistry of Trace Elements; PWN: Warszawa, Poland, 1999; pp. 37–88. [Google Scholar]
- Becker, M.; Asch, F. Iron toxicity in rice—conditions and management concepts. J. Plant. Nutr Soil Sci 2005, 168, 558–573. [Google Scholar] [CrossRef]
- Komosa, A. Guide values and soil nutrient contents of highbush blueberry (Vaccinium corymbosum L.) plantations in Poland. In Int. Conf. Vaccinium ssp. and Less Known Small Fruits: Cultivation and Health Benefit; Slovak Academy of Sciences: Nitra, Slovak, 2007; pp. 29–30. [Google Scholar]
- Jones, D.L.; Prabowo, A.M.; Kochian, L.V. Kinetics of malate transport and decomposition in acid soils and isolated bacterial populations: The effect of microorganisms on root exudation of malate under Al stress. Plant Soil 1996, 182, 239–247. [Google Scholar] [CrossRef]
- Fan, J.; Ding, W.; Chen, Z.; Ziadi, N. Thirty-year amendment of horse manure and chemical fertilizer on the availability of micronutrients at the aggregate scale in black soil. Environ. Sci. Pollut. R 2012, 19, 2745–2754. [Google Scholar] [CrossRef]
- Kulczycki, G. The effect of elemental sulfur fertilization on the content of microelements in plants and soils. Zesz. Probl. Post Nauk. Roln. 2004, 1, 199–206. [Google Scholar]
- Podleśna, A. Uptake of manganese by potato and pea plants in conditions of integrated cultivation with regard to sulfur and manure fertilization. Zesz. Nauk. Uniw. Przyr. Wrocławiu Rol. 2013, 595, 87–93. [Google Scholar]
- Bañados, M.P.; Ibáñez, F.; Toso, A.M. Mn toxicity induces abnormal shoot growth in ‘O’Neal’ blueberry. Acta Hortic. 2009, 810, 509–512. [Google Scholar] [CrossRef]
- Covelo, E.F.; Vega, F.A.; Andrade, M.L. Competitive sorption and desorption of heavy metals by individual soil components. J. Hazard Mater. 2007, 140, 308–315. [Google Scholar] [CrossRef]
- Covelo, E.F.; Andrade, M.L.; Vega, F.A. Simultaneous adsorption of Cd, Cr, Cu, Ni, Pb and Zn by different Soils. J. Food Agric. Environ. 2004, 2, 243–249. [Google Scholar]
- Cavallaro, N.; McBride, M.B. Zinc and copper sorption and fixation by an acid soil clay: Effect of selective dissolutions. Soil Sci. Soc. Am. J. 1984, 48, 1050–1054. [Google Scholar] [CrossRef]
- Skwierawska, M.; Nogalska, A.; Skwierawski, A. Changes in the concentrations of available zinc and copper in soil fertilized with sulfur. J. Elem. 2012, 17, 495–504. [Google Scholar] [CrossRef]
- Imran, M.; Kanwal, S.; Hussain, S.; Aziz, T.; Maqsood, M.A. Efficacy of zinc application methods for concentration and estimated bioavailability of zinc in grains of rice grown on a calcareous soil. Pak. J. Agric. Sci. 2015, 52, 169–175. [Google Scholar]
- Imran, M.; Rehim, A.; Sarwar, N.; Hussain, S. Zinc bioavailability in maize grains in response of phosphorous–zinc interaction. J. Plant. Nutr. Soil 2016, 179, 60–66. [Google Scholar] [CrossRef]
- Pérez-Novo, C.; Bermúdez-Couso, A.; López-Periago, E.; Fernández-Calviño, D.; Arias-Estévez, M. Zinc adsorption in acid soils: Influence of phosphate. Geoderma 2011, 162, 358–364. [Google Scholar] [CrossRef]
- Bradl, H.B. Adsorption of heavy metal ions on soils and soils constituents. J. Colloid interface Sci. 2004, 277, 1–18. [Google Scholar] [CrossRef]
- Covelo, E.F.; Vega, F.A.; Andrade, M.L. Simultaneous sorption and desorption of Cd, Cr, Cu, Ni, Pb, and Zn in acid soils: I. Selectivity sequences. J. Hazard Mater. 2007, 147, 852–861. [Google Scholar] [CrossRef]
- Krzywy, E.; Jakubowski, W.; Pasikowski, K. The influence of FeSO4 ⋅ 7H2O and phosphogypsum applied with different multicomponent fertilizers on the contents of assimilable forms of soil phosphorus and potassium, as well as sulphur, cadmium, copper, nickel, lead and zinc soluble in 1 mol HCl. Folia Univ. Agric. Stetin. Agricul. 2000, 81, 169–174. [Google Scholar]
- Domańska, J.; Filipek, T. Content of Cu bound to soil fractions as affected by soil pH and organic matter content. Environ. Prot. Nat. Resour. 2011, 48, 74–79. [Google Scholar]
- Brzezińska, M.; Włodarczyk, T.; Stępniewski, W.; Przywara, G. Soil aeration status and catalase activity. Acta Agroph. 2005, 5, 555–565. [Google Scholar]
- Telesiński, A. The effect of salinity on some biochemical indices of soil fertility. Water Environ. Rural. Areas 2012, 12, 209–217. [Google Scholar]
- Wyszkowska, J.; Kucharski, J.; Boros, E. Biochemical properties of soil contaminated with nickel and other heavy metals. J. Elementol. 2005, 10, 585–596. [Google Scholar]
- Skwaryło-Bednarz, B.; Kwapisz, M.; Onuch, J.; Krzepiłko, A. Assessment of the content of heavy metals and catalase activity in soils located in protected zone of the Roztocze National Park. Acta Agrophys. 2014, 21, 351–359. [Google Scholar]
- Januszek, K. Enzymatic activity of selected forest soils of southern Poland in the light of field and laboratory research. Zesz. Nauk. AR Krak. Rozpr. 1999, 250, 1–132. [Google Scholar]
- Turner, B.L.; Hopkins, D.W.; Haygarth, P.M.; Ostle, N. β-Glucosidase activity in pasture soils. Appl. Soil Ecol. 2002, 20, 157–162. [Google Scholar] [CrossRef]
- Bååth, E. Effects of heavy metals in soil on microbial processes and populations (a review). Water Air Soil Pollut. 1989, 47, 335–379. [Google Scholar] [CrossRef]
- Kalembasa, D.; Kuziemska, B.; Kalembasa, S. Influence of liming and waste organic materials on the activity of urease and dehydrogenase in soil contaminated with nickel. Inżynieria Ekol. 2014, 36, 7–17. [Google Scholar] [CrossRef]
- Gajda, A.M.; Martyniuk, S.; Stachyra, A.M.; Wróblewska, B.; Zięba, S. Relations between microbiological and biochemical properties of soil under different agrotechnical conditions and its productivity. Pol. J. Soil Sci. 2000, 33, 55–60. [Google Scholar]
- Nowak, J.; Tyrakowska-Bielec, U.; Durlej, J. The effect of different doses of nitrogen fertilizers on the activity of soil phosphoesterases. Folia Univ. Stetin. Agric. 2000, 83, 131–138. [Google Scholar]
- Wyszkowska, J.; Wyszkowski, M. Effect of cadmium and magnesium on microbiological activity in soil. Pol. J. Environ. Stud. 2002, 11, 585–592. [Google Scholar]
- Mocek-Płóciniak, A.; Sawicka, A. Effect of copper and lead on the number of microorganisms in the soils in the neighbourhood of the Legnica Copper Smelter. Zesz. Nauk. Univ. PrzyrWroc Rol LXXXIX 2006, 546, 259–270. [Google Scholar]
Publisher’s Note: MDPI stays neutral with regard to jurisdictional claims in published maps and institutional affiliations. |
© 2020 by the authors. Licensee MDPI, Basel, Switzerland. This article is an open access article distributed under the terms and conditions of the Creative Commons Attribution (CC BY) license (http://creativecommons.org/licenses/by/4.0/).