Article

Fruit Ripening, Antioxidants and Oil Composition in Koroneiki Olives (Olea europea L.) at Different Maturity Indices

1
Department of Olive and Horticultural Crops, Institute of Olive Tree, Subtropical Crops and Viticulture, Hellenic Agricultural Organization-DΕMETER, 87 Lakonikis st, 241 00 Kalamata, Greece
2
Institute of Technology of Agricultural Product, Hellenic Agricultural Organization-DEMETER, S. Venizelou 1 Str., Lycovrissi, 141 23 Attica, Greece
3
Laboratory of Pomology, Department of Crop Science, Agricultural University of Athens (AUA), Iera Odos 75, Botanikos, 118 55 Athens, Greece
*
Author to whom correspondence should be addressed.
Agronomy 2021, 11(1), 122; https://doi.org/10.3390/agronomy11010122
Submission received: 2 December 2020 / Revised: 7 January 2021 / Accepted: 8 January 2021 / Published: 10 January 2021

Abstract

:
Harvest timing of oil olives is important for oil quality. Concerning the specific features of each cultivar, physiological and quality characteristics during ripening of Koroneiki olives were investigated in two successive years, A and B, from trees on full production. In A, olives were harvested at maturity indices (MIs) 0.9, 1.4, 2.1 and 4, while in B at MIs 1.1, 3.8 and 6.9. MIs ~1, ~4 and ~7 corresponded to green, red and dark purple peel in olives, respectively. Peel color parameters (L*, h° and C*), respiration and ethylene production rates were evaluated along with phenolic compounds and total antioxidant capacity (TAC) in olives of both crop years. Additionally, oil composition and a-tocopherol content were examined in olives harvested in years A and B, respectively. During fruit development, respiration and ethylene productions rates, hydroxytyrosol concentration and linoleic acid increased, while TAC, oleuropein, luteolin-7-O-glucoside, linolenic acid and α-tocopherol values decreased. Positive correlations were found among the attributes determined in both crop years that had a similar course of change during ripening, and vice versa, which could be also related to harvest timing and to quality traits of olive products. At MI ~4, at least all determined variables corresponded to oil of high quality. Practically, an early harvest might result in an olive fruit rich in antioxidants and therefore in oil production of high quality, high stability during storage and long self-life.

1. Introduction

Olive (Olea europaea L.) is a characteristic species and one of the most important and widespread fruit trees in the Mediterranean basin. Olive trees can grow under unfavorable conditions, such as on arid areas and hilly lands, where other fruit trees cannot grow [1]. The majority of olive production is intended for olive oil extraction; however, a substantial part is destined for direct human consumption after a suitable process. Olive oil is a predominant component of the widely known ‘Mediterranean diet’, to which increasing attention is being paid [2]. The consumption of olive oil is linked to the low incidence of coronary heart disease, cancer and other chronic diseases among the people of the Mediterranean basin [3].
Olive oil is unique among other vegetable oils due to its characteristic aroma, that is attributed to its well-balanced composition of fatty acids and the presence of minor components, such as volatile compounds [4]. Unlike seed oils in which polyunsaturated fatty acids are predominated, olive oil is rich in monounsaturated oleic acid, which is less susceptible to oxidation, contributing to the high stability and its long shelf life [2,4]. Minor and partially soluble or non-soluble in water constituents of olive oil, which include polyphenols, tocopherols and volatile compounds, are responsible for its special sensory properties and contribute to its high oxidative stability during prolonged storage periods [4,5].
Olive fruit composition at harvest affects strongly the composition of oil, especially that of extra-virgin olive oil, which depends on the genetic background, the environmental growth conditions, such as biotic and abiotic stresses, and the agronomic techniques [2,5]. Olive ripening is commenced with the epidermal accumulation of anthocyanins that gradually proceeds to the mesocarp [6]. The maturity index (MI) proposed for olives by Uceda and Frias [7] takes into account both peel and pulp color of drupes and it ranges from deep green to black. This index has found wide acceptance, although it has been criticized as subjective, equivocal and lacking uniformity across cultivars unless combined with parameters directly associated with the biochemistry of ripening, such as anthocyanin content and fruit firmness [8,9]. Optimizing harvest time will be beneficial for the olive growers’ income. An early harvest results in the production of an olive oil rich in phenolic compounds and usually of superior nutritional value and sensory characteristics, but with low oil content that may involve intense characters, such as high bitterness and excess pungency, which are undesirable in some cases, while late harvest leads to increased oil yields, but a reduction in oil quality. However, the suggested MI depends largely on variety, while environmental conditions, cultivation practices, crop load and alternate bearing also influence the process of ripening and consequently the optimal MIs to harvest olives during fruit development [10,11]. For example, the suggested harvest timing for the high yielding and slow oil accumulation Barnea is at MI ~4, whereas for the early and massive fruit shedding Souri at ~2 [12].
The current work focused on the evaluation of physicochemical traits of Koroneiki olive drupes. ‘Koroneiki’ was selected because it is one of the main Greek olive cultivars, occupying around 60% of the total olive-growing land in the country. It produces small sized drupes, gives high yields and is characterized by a prolonged maturation period. ‘Koroneiki’ produces oil of exceptional quality, being of a fruity taste with an aroma of leaves and grass with notes of green apple and some astringency. However, studies of changes in Koroneiki olives composition during fruit development that inevitably affect the oil are limited [6,10,13].
The aim of this study was to assess the physicochemical properties of olives in respect to fruit ripening, so as to provide a harvest window when the production of oil of optimum quality is ensured. For this reason, the objective of this work was the detailed characterization of fruit and olive oil antioxidants, such as phenolic compounds and total antioxidant capacity of drupes and α-tocopherol content in oil, fatty acid profile in oil, along with the evaluation of fruit physical/physiological properties, being the peel color, respiration and ethylene production rates. The detailed information produced may promote the establishment of integrative harvest maturity parameters for Koroneiki.

2. Materials and Methods

2.1. Source and Handling of Fruit

Self-rooted olive (Olea europea L. cv. Koroneiki) trees grown on the experimental orchard at the Agricultural University of Athens (latitude 37°58′56″, longitude 23°42′47″) were used during two successive years from trees on full production, corresponding to crop year A and B. Seven- and nine-year-old trees, spaced at 4 × 2.5 m and trained as vase, were used in A and B, respectively. All trees selected were in good phytosanitary condition and healthy olive fruits were hand-picked from the fruit bearing zone on the periphery of each tree. At all harvest dates at both crop years, approximately 3 kg of fruit, 80 olives corresponding to approximately 100 g, were harvested from six trees. Fruit were harvested on 6 November, 16 November, 26 November and 8 December 2009 in crop year A and on 5 November, 19 November and 22 December 2010, in B. In both years, all harvested samples, macroscopically free of disorders and diseases, were transferred to the laboratory in paper bags. On each sampling day, sampling and sorting of fruit were all carried out according to a completely randomized design. Samples consisted of three replicates of approximately 60 olives each, apart from maturity index (MI) evaluation where each replicate consisted of 100 fruits each, on each sampling date.

2.2. Fruit Maturity Index (MI) Evaluation

Estimation of MI was conducted according to the method proposed by Uceda and Frias (1975) [7] based on the evaluation of peel and pulp color on a scale ranging from 0 (peel color deep green) to 7 (peel color all purple or black with all the flesh purple) [14].

2.3. Respiration and Ethylene Production Rates

Both respiration and ethylene production rates were evaluated at 20 °C according to Tsantili et al. (2012) [15]. In detail, respiration was assessed using a closed portable infrared gas (IRGA) analyzer (Model LI-6200, LI-COR, Lincoln, NE, USA) connected with a 500 mL airtight jar and the flow rate was adjusted to 900 mol s−1. Ethylene production was evaluated after 2 h enclosure in 500 mL sealed jars and analyzed by gas chromatography, while the detection limit was approximately 10 nL L−1. Respiration and ethylene production rates were expressed in mmol CO2 kg−1 h−1 and nmol C2H4 kg−1 h−1, respectively.

2.4. Peel Color

Peel color was measured at ten points on the surface of olive layers arranged to entirely cover an open petri dish (60 mm diameter) with a chroma meter (CR-300, Minolta, Ahrensburg, Germany) under darkness. From the given CIE L* a* b* values, a* and b* were transformed to hue angle (h°) and chroma (C*) [16].

2.5. Extraction Procedure and Determinations of Total Antioxidant Capacity (TAC) and Phenolic Compounds

A total of 60 destoned fresh olives were frozen using liquid nitrogen, freeze dried and powdered with mortar and pestle in liquid nitrogen before extraction. For TAC and phenolic compounds, 500 mg of powdered tissue was extracted three times with 80% v/v acetone (1 mL 100 mg−1 tissue) in an ultra-sonic ice bath for 15 min. The samples were then centrifuged at 4000× g for 5 min. The combined supernatants were divided equally into 2 parts. The one part was used for TAC determination and the other for phenolic extraction [15]. TAC was estimated by the ferric reducing antioxidant power (FRAP) assay [17], according to Tsantili et al. (2012) [15]. TAC values were expressed as trolox acid equivalents on a freeze-dried weight basis.
Phenolics were extracted from the second part three times with the same volume of ethyl acetate each time. The organic solvent was removed by a rotary evaporator at 37 °C, the residue was dissolved in 0.5 mL methanol and filtered through a nylon syringe filter (0.2 m pore size) before analysis. The identification and quantification of phenolic compounds was performed by a high performance liquid chromatography (HPLC) system, according to Tsantili (2014) [18]. Results were expressed in mg or μg per g of freeze-dried weight.

2.6. Extraction of Oil and Determination of Fatty Acid (FA) and α-Tocopherol Composition

A cold-pressing method with a laboratory screw-press device was used for oil extraction. Briefly, chilled (at 4 °C) destoned olives (~50 g) wrapped in cheese cloth were compressed between two parallel stainless-steel plates of 10 × 5 cm pre-cooled at 4 °C and each at a torque of 30 N m−1. Before analyses the recovered oil was centrifuged at 5000× g for 3 min [13].
The FA composition of oil samples was performed by gas chromatography of fatty acids methyl esters, according to Kafkaletou and Tsantili (2016) [13]. Determinations of FAs were carried out on samples of crop year A and results were expressed as % (w/w) in oil.
The α-tocopherol content of oil samples was determined using an HPLC system, consisting of a Varian 9010 pump (Varian, Santa Clara, CA, USA), HP 1050 UV-Vis detector (Hewlett-Packard, Waldbron, Germany) and Peak Simple 3.25 data processing system. The separation was achieved on an Ascentis® Express Fusecore analytical column (100 × 2.1 mm; 2.7 μm particle size). The mobile phase used was methanol/dichlormethane (85:15, v/v), the flow rate and the detection wavelength were set to 0.05 mL min−1 and 295 nm, respectively. Oil samples were dissolved in hexane, evaporated until dryness under vacuum, diluted in the mobile phase and filtered through a nylon syringe filter (0.2 m pore size) before analysis [19]. α-tocopherol was quantified in comparison with a multipoint calibration curve obtained from the corresponding standard. Determinations of α-tocopherol content were carried out on samples of crop year B and results were expressed as mg kg−1 oil.

2.7. Data Analysis

The significance of the effect of MI on all determined variables was evaluated by one-way analysis of variance (ANOVA). Mean (of three replicates of 60 olives each) separations were analyzed by the Tukey-HSD test (p = 0.05). The significant differences were estimated at p < 0.05. Principal Component Analyses (PCA) and pairwise correlations were performed to get an overview of the main variation in the data and to interpret variable relationships among the traits measured on both crop years, namely peel color parameters (L*, h° and C*), CO2 and C2H4 production rates, phenolic compounds and TAC. Data analyses were conducted using JMP 7.0.1 (SAS Institute, Cary, NC, USA).

3. Results and Discussion

3.1. Ripening and Quality Traits in Olives of Different MIs

3.1.1. MIs, Peel Color and CO2 and Ethylene Production Rates

In crop year A, the MIs averaged 0.9 (±0.05), 1.5 (±0.11), 2 (±0.18) and 4 (±0.31) on the four successive harvest dates, respectively, with numbers in parenthesis being ± SDs. In B, the MIs averaged 1.1 (±0.09), 3.8 (±0.26) and 6.9 (±0.08) on the three successive dates, respectively, with the samples being the same with those analyzed as controls in experiment I in a previous study [13].
Initially, at MI 0.9 in olives of crop year A, values of L*, h° and C* were about 56, 115 and 32, respectively (Figure 1a,c,e). Both L* and C* values were reduced considerably at MI 4.0, while values increased, being close to 360° in A or 0° in B, obtaining a red color in both years. Similarly, in fruit of crop year B, all peel color parameters decreased significantly at MI 3.8 in comparison to values at MI 1.1, indicating that samples had turned from green to red (Figure 1b,d,f). Moreover, at MI 6.9 all three-color parameters estimated were further reduced to approximately 23, 9 and 3 for L*, and C*, respectively. These values indicate that olives had a black or dark purple peel and almost all the pulp was purple [7]. According to Vinha et al. (2005) [8] the development of the deep purple color is associated with anthocyanin synthesis and particularly to cyanidin 3-O-glucoside and cyanidin 3-O-rutinoside. The present findings suggest that color differences could be distinguished with objective measurements rather than subjectively by visual estimation, as mentioned by Tsantili (2014) [18]. On the other hand, Garcia and Yousfi (2005) [9] proposed that firmness evaluation is a more reliable tool than color for predicting harvest for colored olives, but in the present study firmness was not able to be measured due to the small size of Koroneiki olives.
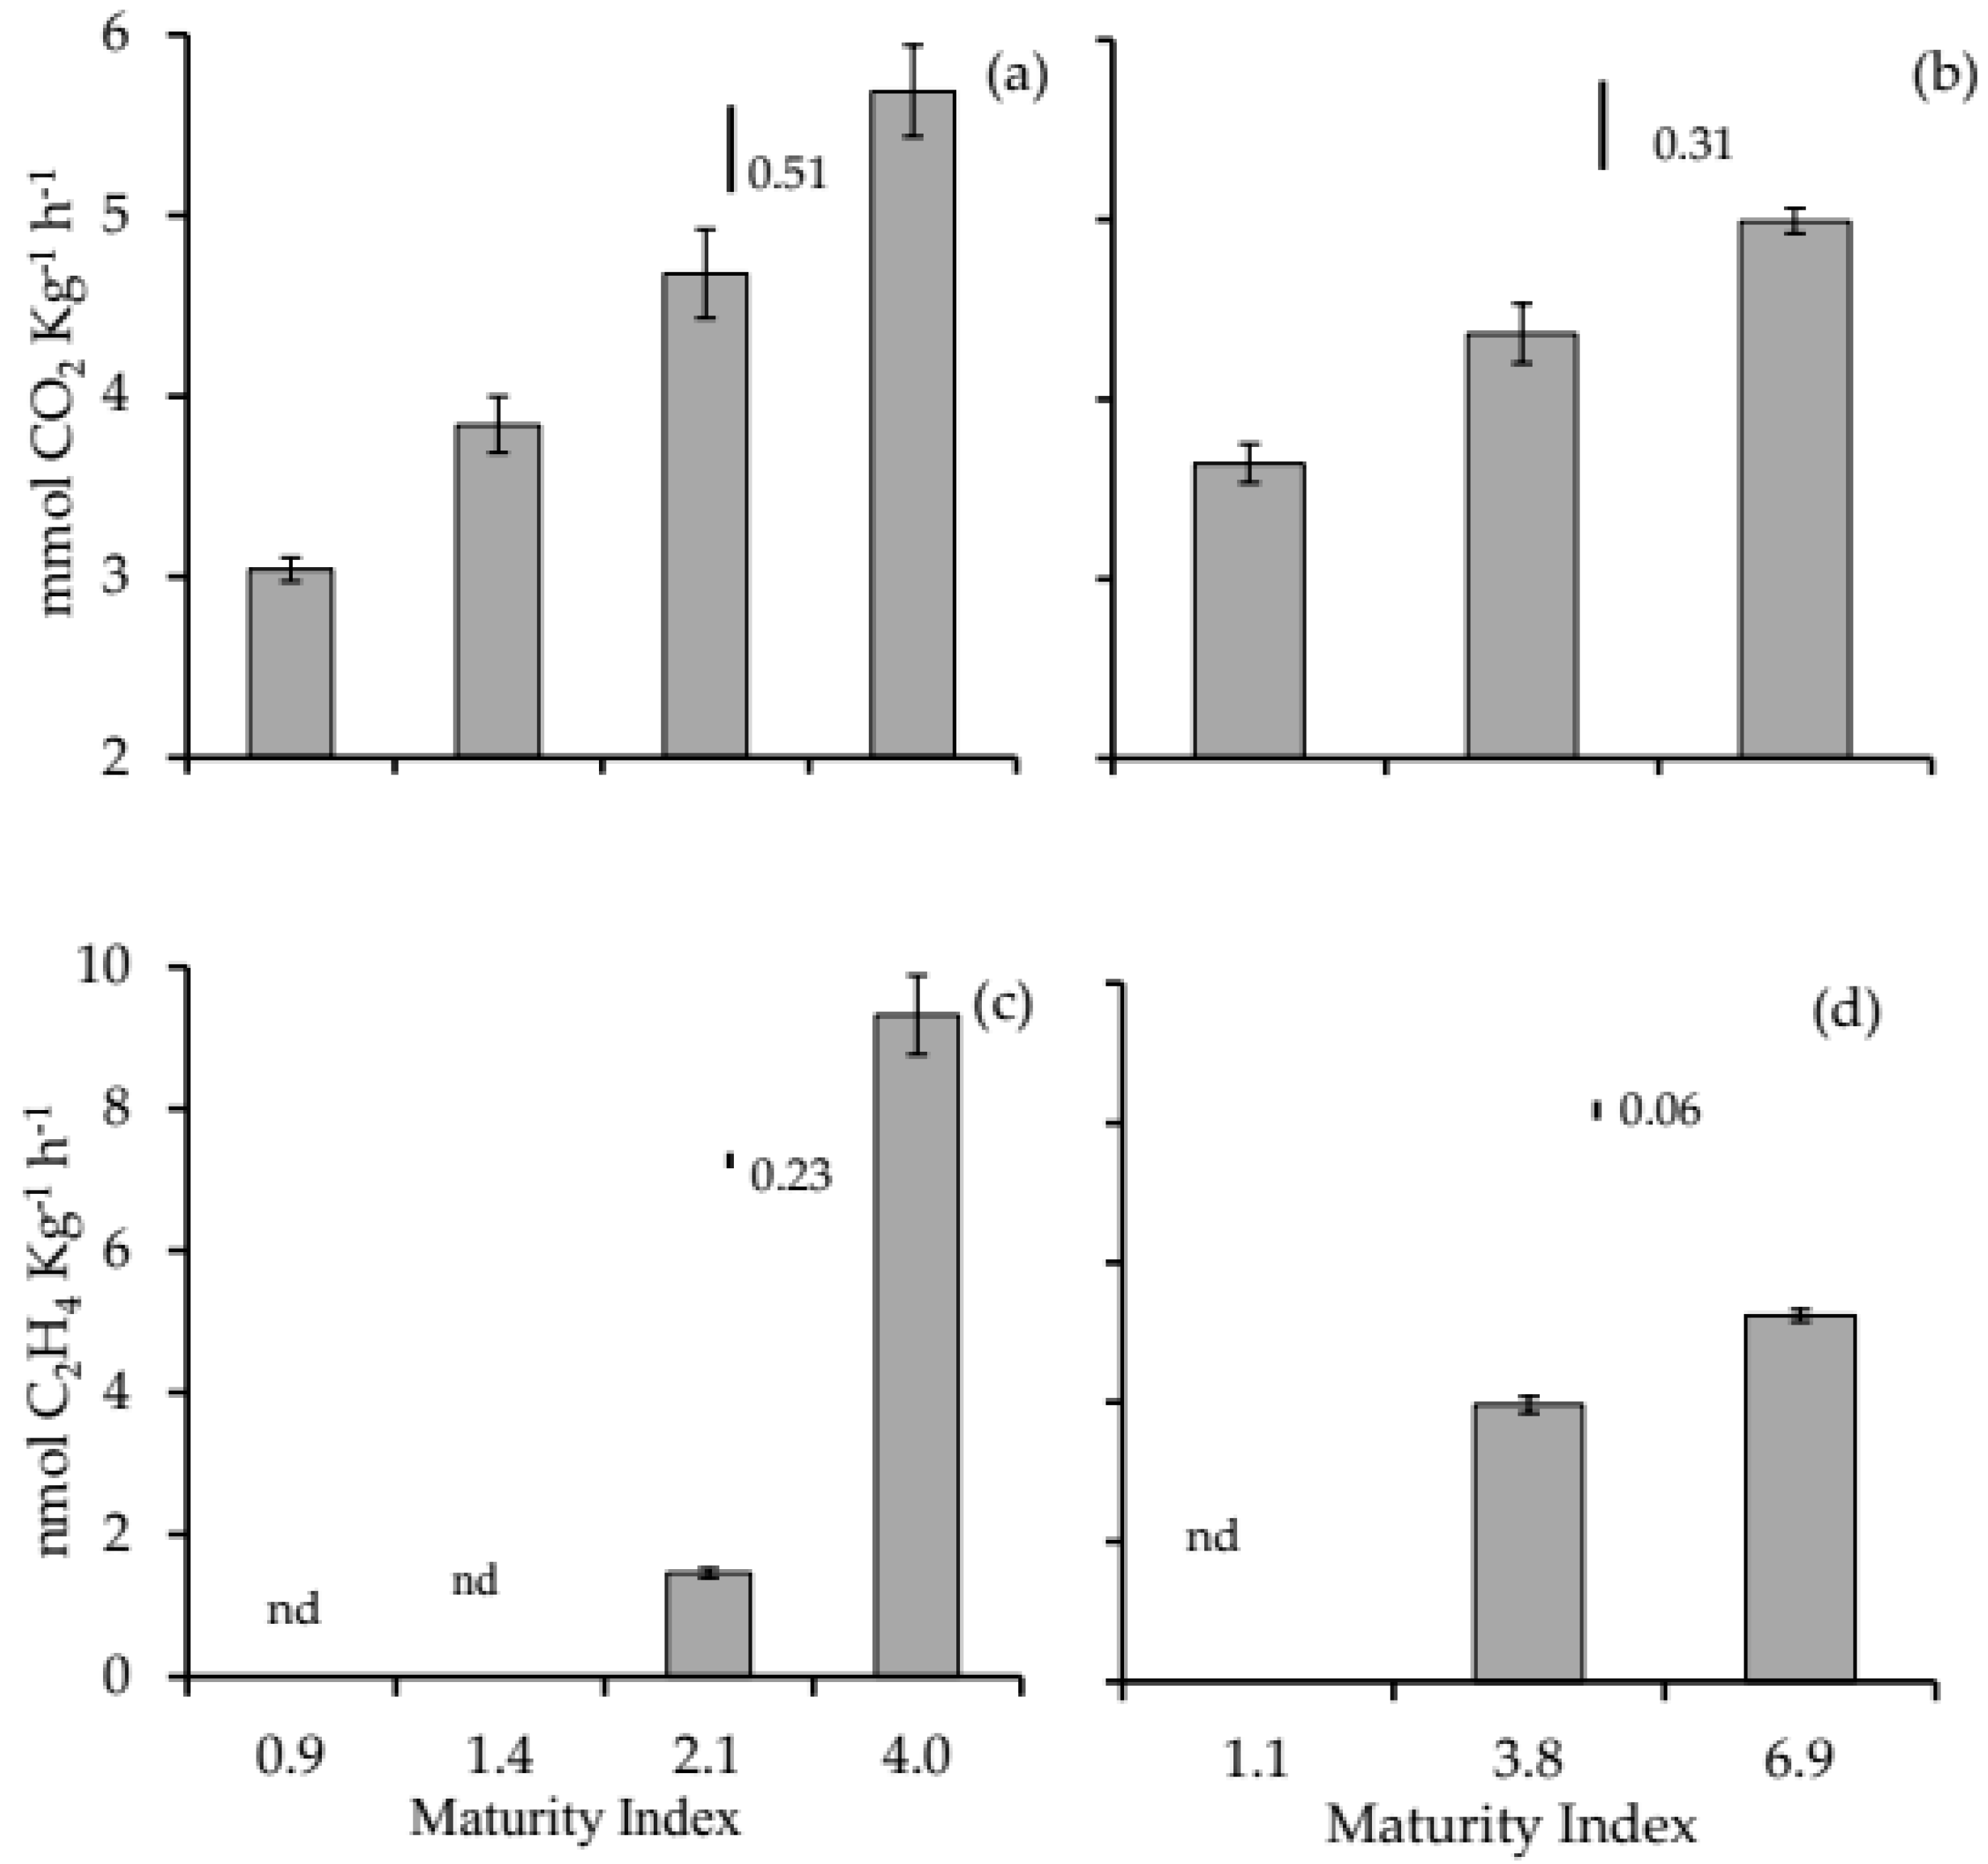
The respiration rate of olives at MI 0.9 in A, expressed in CO2 production, was 3.04 mmol kg−1 h−1, but increased to 3.8, 4, 7 and 5.7 mmol kg−1 h−1 at MI 1.4, 2.1 and 4, respectively (Figure 2a). A similar pattern of change was monitored in olives of of crop year B (Figure 2b). In detail, CO2 production was 3.6 mmol kg−1 h−1 on fruit at MI 1.1 and increased to 4.4 and 5 mmol kg−1 h−1, at MI 3.8 and 6.9, respectively. According to Ranalli et al. (1998) [20], similar tendency to increase was observed in Leccino and Frantoio olives during maturation. It is noteworthy that relatively high respiration rates in olives of advanced MIs may suggest that the fruit is sensitive to postharvest handling, indicating that olives have to be processed soon after harvest [18]. Additionally, the increased respiration rate during fruit development is in disagreement with a typical non-climacteric fruit. However, further investigation of this observation is not included in the aim of the present work.
Ethylene production was either not detectable in olives at MI ~1 of both crop years or found at low levels in olives of advanced MIs (Figure 2c,d). Here, detectable amounts of ethylene coincided with the appearance of red colored areas on the peel, at ~MI 4, in olives of both years. According to Fernández-Bolaños et al. (1997) [21] olives synthesize increasing amounts of ethylene as ripeninig proceeds. Both respiration and ethylene production rates were lower than in ‘Kalamon’ [18], but in accordance with the values reported in ‘Konservolia’ [15,22,23].

3.1.2. Phenolic Compounds

Plant phenolic compounds are derived from the shikimate pathway and phenylpropanoid metabolism. The phenolics of olives have been investigated thoroughly [24]. A decrease of phenolics during olive fruit development on tree, in many olive cultivars has been reported [25]. Phenolic compounds determined in ‘Koroneiki’ were the non-flavonoid oleuropein (OE), verbascoside (Verb), hydroxytyrosol (HT) and tyrosol (Tyr), in addition to the flavonoid phenolics luteolin-7-O-glucoside (Lut-7), rutin, quercetin and luteolin (Table 1). Here, OE was the major phenolic compound identified in all samples. In crop year A, OE was reduced considerably from 9.9 mg g−1 at MI 0.9 to 4.1 mg g−1 at MI 4, likewise in year B OE from 10.5 mg g−1 at MI 1.1 to 0.3 mg g−1 at MI 6.9. A trend of decreasing fruit OE content with advanced maturity was described in several French [26], Spanish [27] and Cypriot [6] cultivars. OE possesses pharmacological properties and olive varieties with high OE amounts are desirable for medical purposes and might be a target for breeding programs [28]. Verb values remained almost stable during ripening and were found at 0.32 and 0.18 mg g−1 on average, in olives of crop year A and B, respectively. In black ripe Kalamon olives Verb values measured were five times higher than current results [18]; in the literature, high levels of Verb have been reported in cultivars with large fruit size [26]. HT concentration in olives of both crop years increased about 65% during ripening and these findings are in accordance with literature [27,29,30]. Moreover, olive products with high HT values are preferable due to HT’s high antioxidant capacity [31]. Fluctuations in Tyr concentration during ripening were observed, however, Tyr is usually present in lower amounts than HT [32], and this was in agreement with the present results. Among the four flavonoid phenolics identified, Lut-7 and rutin were at similar levels and decreased during maturation process, and both were higher than quercetin and luteolin which were detected in traces, as suggested by others [8]. In another study on Koroneiki olives harvested at MI 3, OE, HT and rutin were estimated at higher levels than here, whereas Tyr at a similar level [6]. However, the current results were in general agreement with other cultivars studied [8,33,34]. During olive ripening, quantitative and qualitative changes in phenolics happen, and these fluctuations are ascribed to a series of chemical and enzymatic alterations of some phenolics [35,36]. Nevertheless, there might be variations over the years and environmental factors, as well as cultivation practices that could influence the phenolics in olives and olive products [10].
In crop year A at MI 0.9, TAC was found at about 179 μmol g−1 and reduced considerably to 160 μmol g−1 at MI 4. Similarly, in olives of year B, TAC values decreased from 172 to 129 μmol g−1, at MI 1.1 and 6.9, respectively. The current results were in accordance with the literature [13,35]. In this study, TAC estimated with the FRAP method was highly and positively correlated with OE (Table S1) indicating the high contribution of OE to TAC, and this was in general agreement with other works [29,37].

3.2. Oil Composition

The olive oil composition is very important both for its stability during storage and for human nutrition. In Koroneiki oil of crop year A derived from olives at MI 0.9, the values of palmitic, palmitoleic, stearic, oleic, arachidic and gondoic acid were 11.16, 0.84, 2.92, 76.18, 0.52 and 0.31%, (w/w in oil), respectively (Table 2), and remained almost stable until olives reached MI 4. Vaccenic acid showed no consistent changes. Linoleic acid exhibited a continuous increase that was highly significant, in detail it increased by 0.73-fold in comparison with initial levels. On the contrary, linolenic acid decreased considerably from 0.8% at MI 0.9 to 0.66% at MI 4. The current results were in accordance with other studies on Koroneiki oil [10,13].
At MI 0.9, the values of saturated fatty acids (SFA), mono-unsaturated fatty acids (MUFA), poly-unsaturated fatty acids (PUFA), unsaturated fatty acids/saturated fatty acids (UFA/SFA) and linoleic acid/linolenic acid (ω-6/ω-3) were 14.61, 79.24, 6.01, 5.85 and 6.44, respectively, and SFA, MUFA and UFA/SFA remain almost stable during ripening. However, significant changes occurred in PUFA and ω-6/ω-3 values that increased by 0.77- and 0.6-fold, respectively, by the end of the experiment. As expected, oleic and linoleic were the main FAs measured in Koroneiki oil, while changes in PUFA were attributed to linoleic acid increases. Dag et al. (2014) [11] observed that the reduction of the MUFA/PUFA ratio was ascribed to both a slight decrease in oleic acid and increase in linoleic acid, which could occur during desaturation of FAs under low temperatures. Here, a substantial decrease in MUFA/PUFA was observed from 12.28 at MI 2.1 to 10.14 at MI 4, coinciding with the increased linoleic acid at MI 4, while oleic remained fairly stable. Also, the ratio of ω-6/ω-3 is considered very important for disease prevention or therapy [38] and for this reason it was included into the present results. Particularly, a low ratio of ω-6/ω-3 in conjunction with elevated levels of linolenic acid (ω-3) are desirable in reducing the risk of chronic diseases [38]. In the present study, the ratio of ω-6/ω-3 decreased by 1.39-fold from MI 2.1 to MI 4.1 and this was primarily attributed to the respective increase in linoleic acid by 1.24-fold. In general, both oleic acid percentage and UFA/SFA ratio belong to the criteria for the characterization of olive oil quality and Koroneiki exhibits a higher proportion of oleic than other cultivars [39]. Indeed, oleic acid in Koroneiki was found at 76% in oil in A, being close to 70% at MI ~4 in a previous study of the same variety [13], against 60–62% in other varieties [39]. Moreover, decreases in the ratio of MUFA/PUFA are associated with oil deterioration in olives of advanced MIs or high field temperatures during ripening [11]. Here, decreases in MUFA/PUFA and increases in ω-6/ω-3 are attributed to the increased linoleic acid observed at MI 4. Kafkaletou and Tsantili (2016) [13] reported a further reduction of MUFA/PUFA ratio in the oil derived from Koroneiki olives at MI 6.9. However, this increase did not necessarily indicate the onset of oil deterioration since in Koroneiki, linoleic acid remains at very low levels even at MI 4, being ~7.1% in oil, against other varieties that exhibited about double that percentage [11]. Also, it has to be mentioned that the present samples of B crop year are the same as those in experiment I of an earlier study [13], with the respective means and ±SDs of oil percentage at the three successive harvest dates being 54.28 (±0.59), 60.03 (±1.32) and 64.71 (±0.97) (% w/flesh dw), while the effect of harvest date on the oil content was significant (p < 0.001). Therefore, taking into consideration the results of both studies, it is confirmed that oil from olives harvested at MI 4 exhibited values of high quality, at least concerning the variables determined here.

3.3. α-Tocopherol Content in Oil

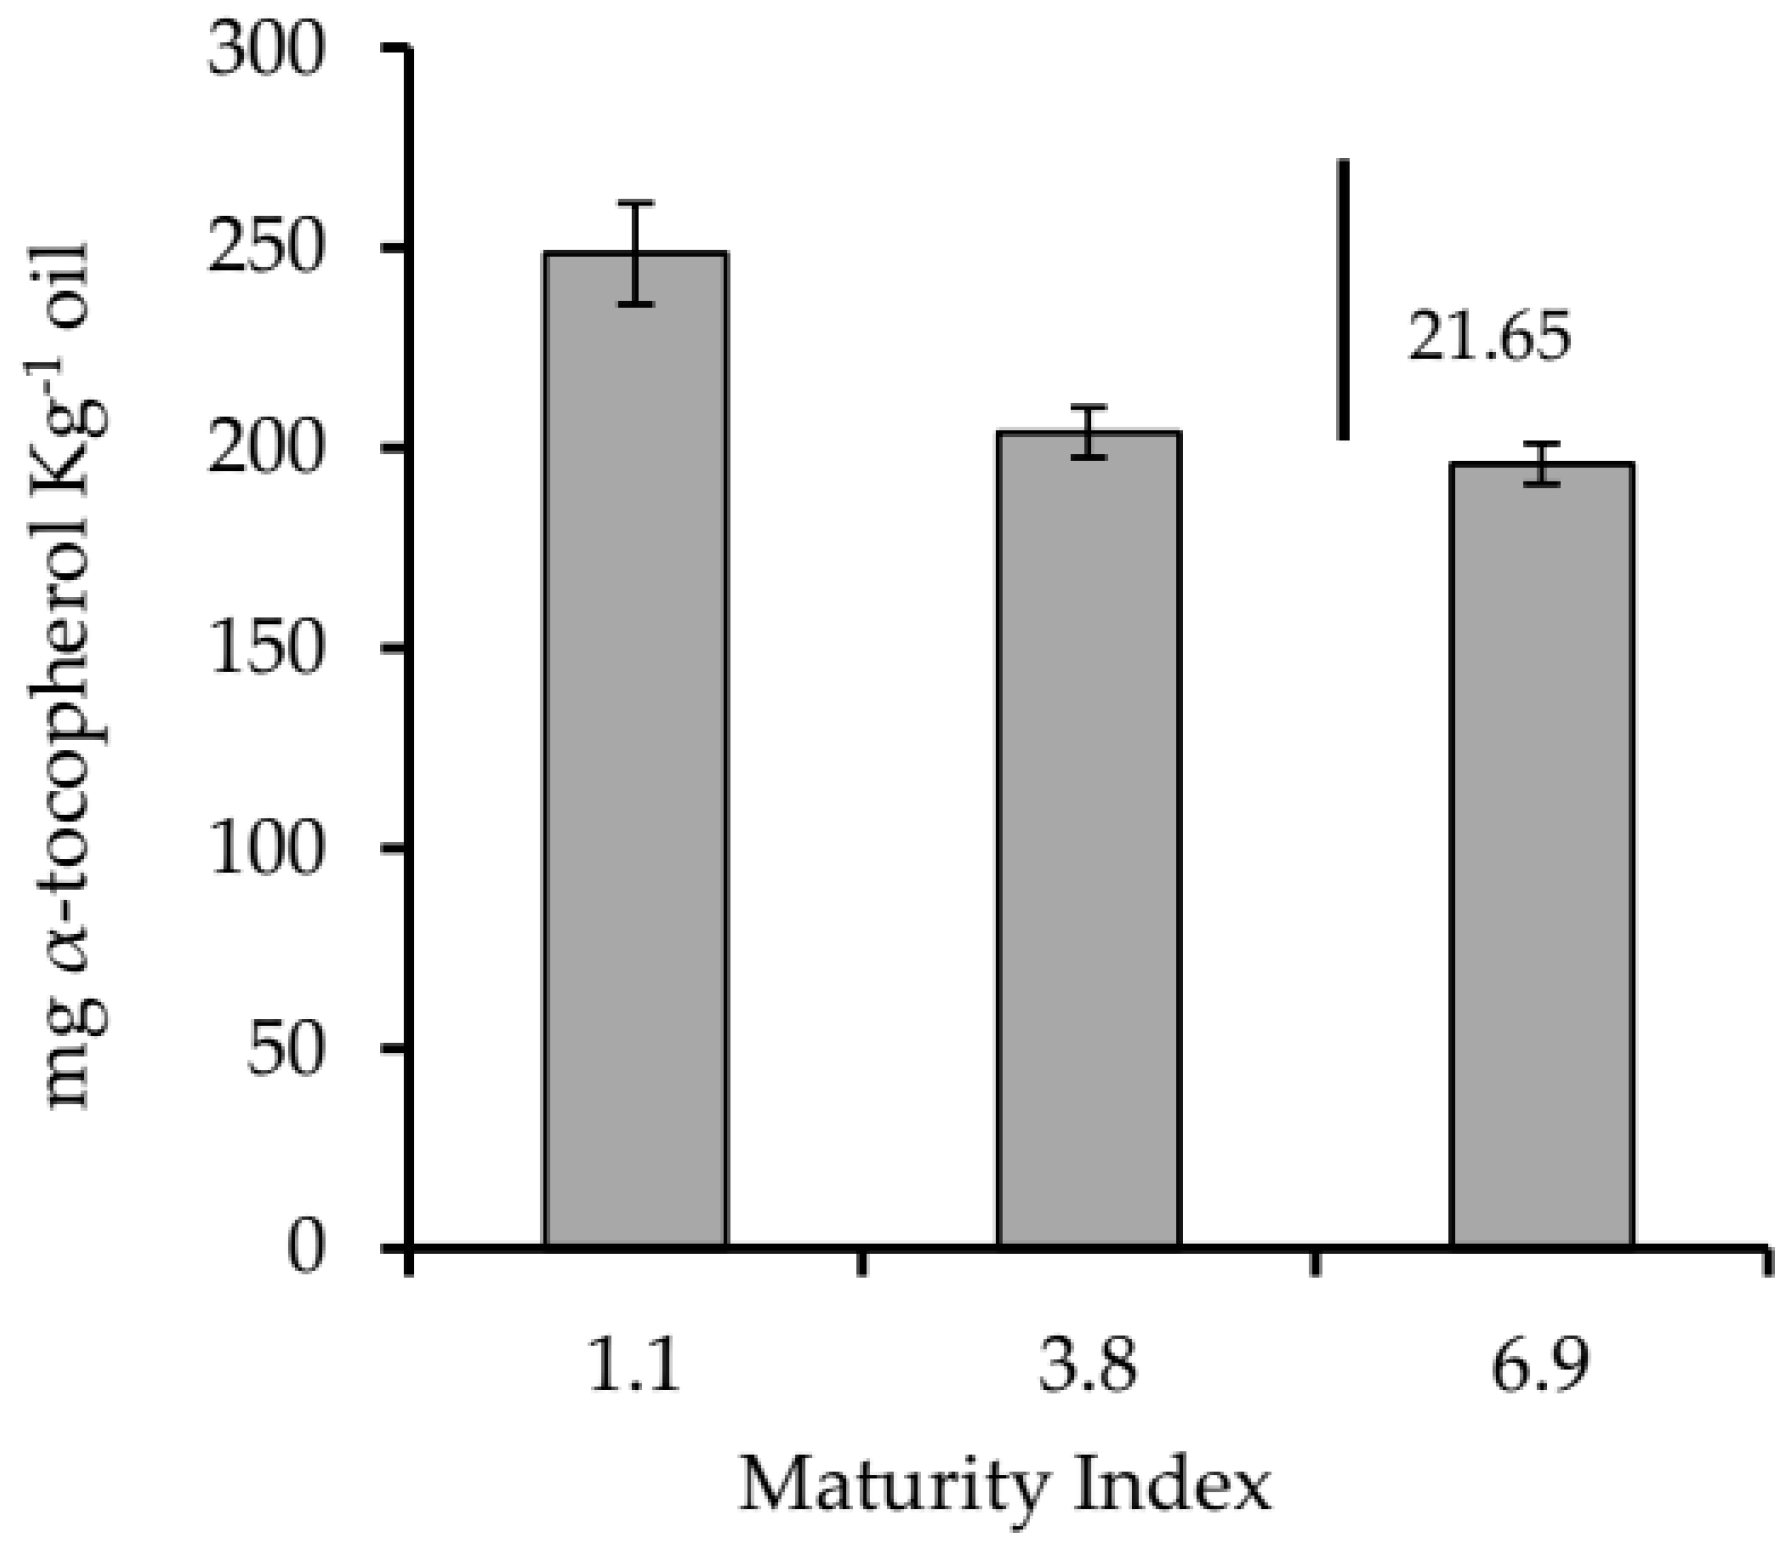
α-tocopherol concentration in olive oil varied from 190 to 250 mg kg−1 (Figure 3) and these levels complied with other studies concerning monovarietal Koroneiki extra virgin olive oils [40,41]. In this study, at MI 6.9, α-tocopherol reduced by 0.8-fold from initial values, but slightly from MI 3.8. Similar reductions during ripening have been reported by others [20,42]. During olive fruit ripening, changes in composition and concentration of antioxidants in oil have been observed [43]. These changes have an impact on sensory attributes, stability during storage and nutritional value of olive oil, however, their concentration might be ascribed to many factors, such as cultivar, cultivation practices and environmental factors [12].

3.4. Principal Component Analyses and Relationships among Olive Attributes

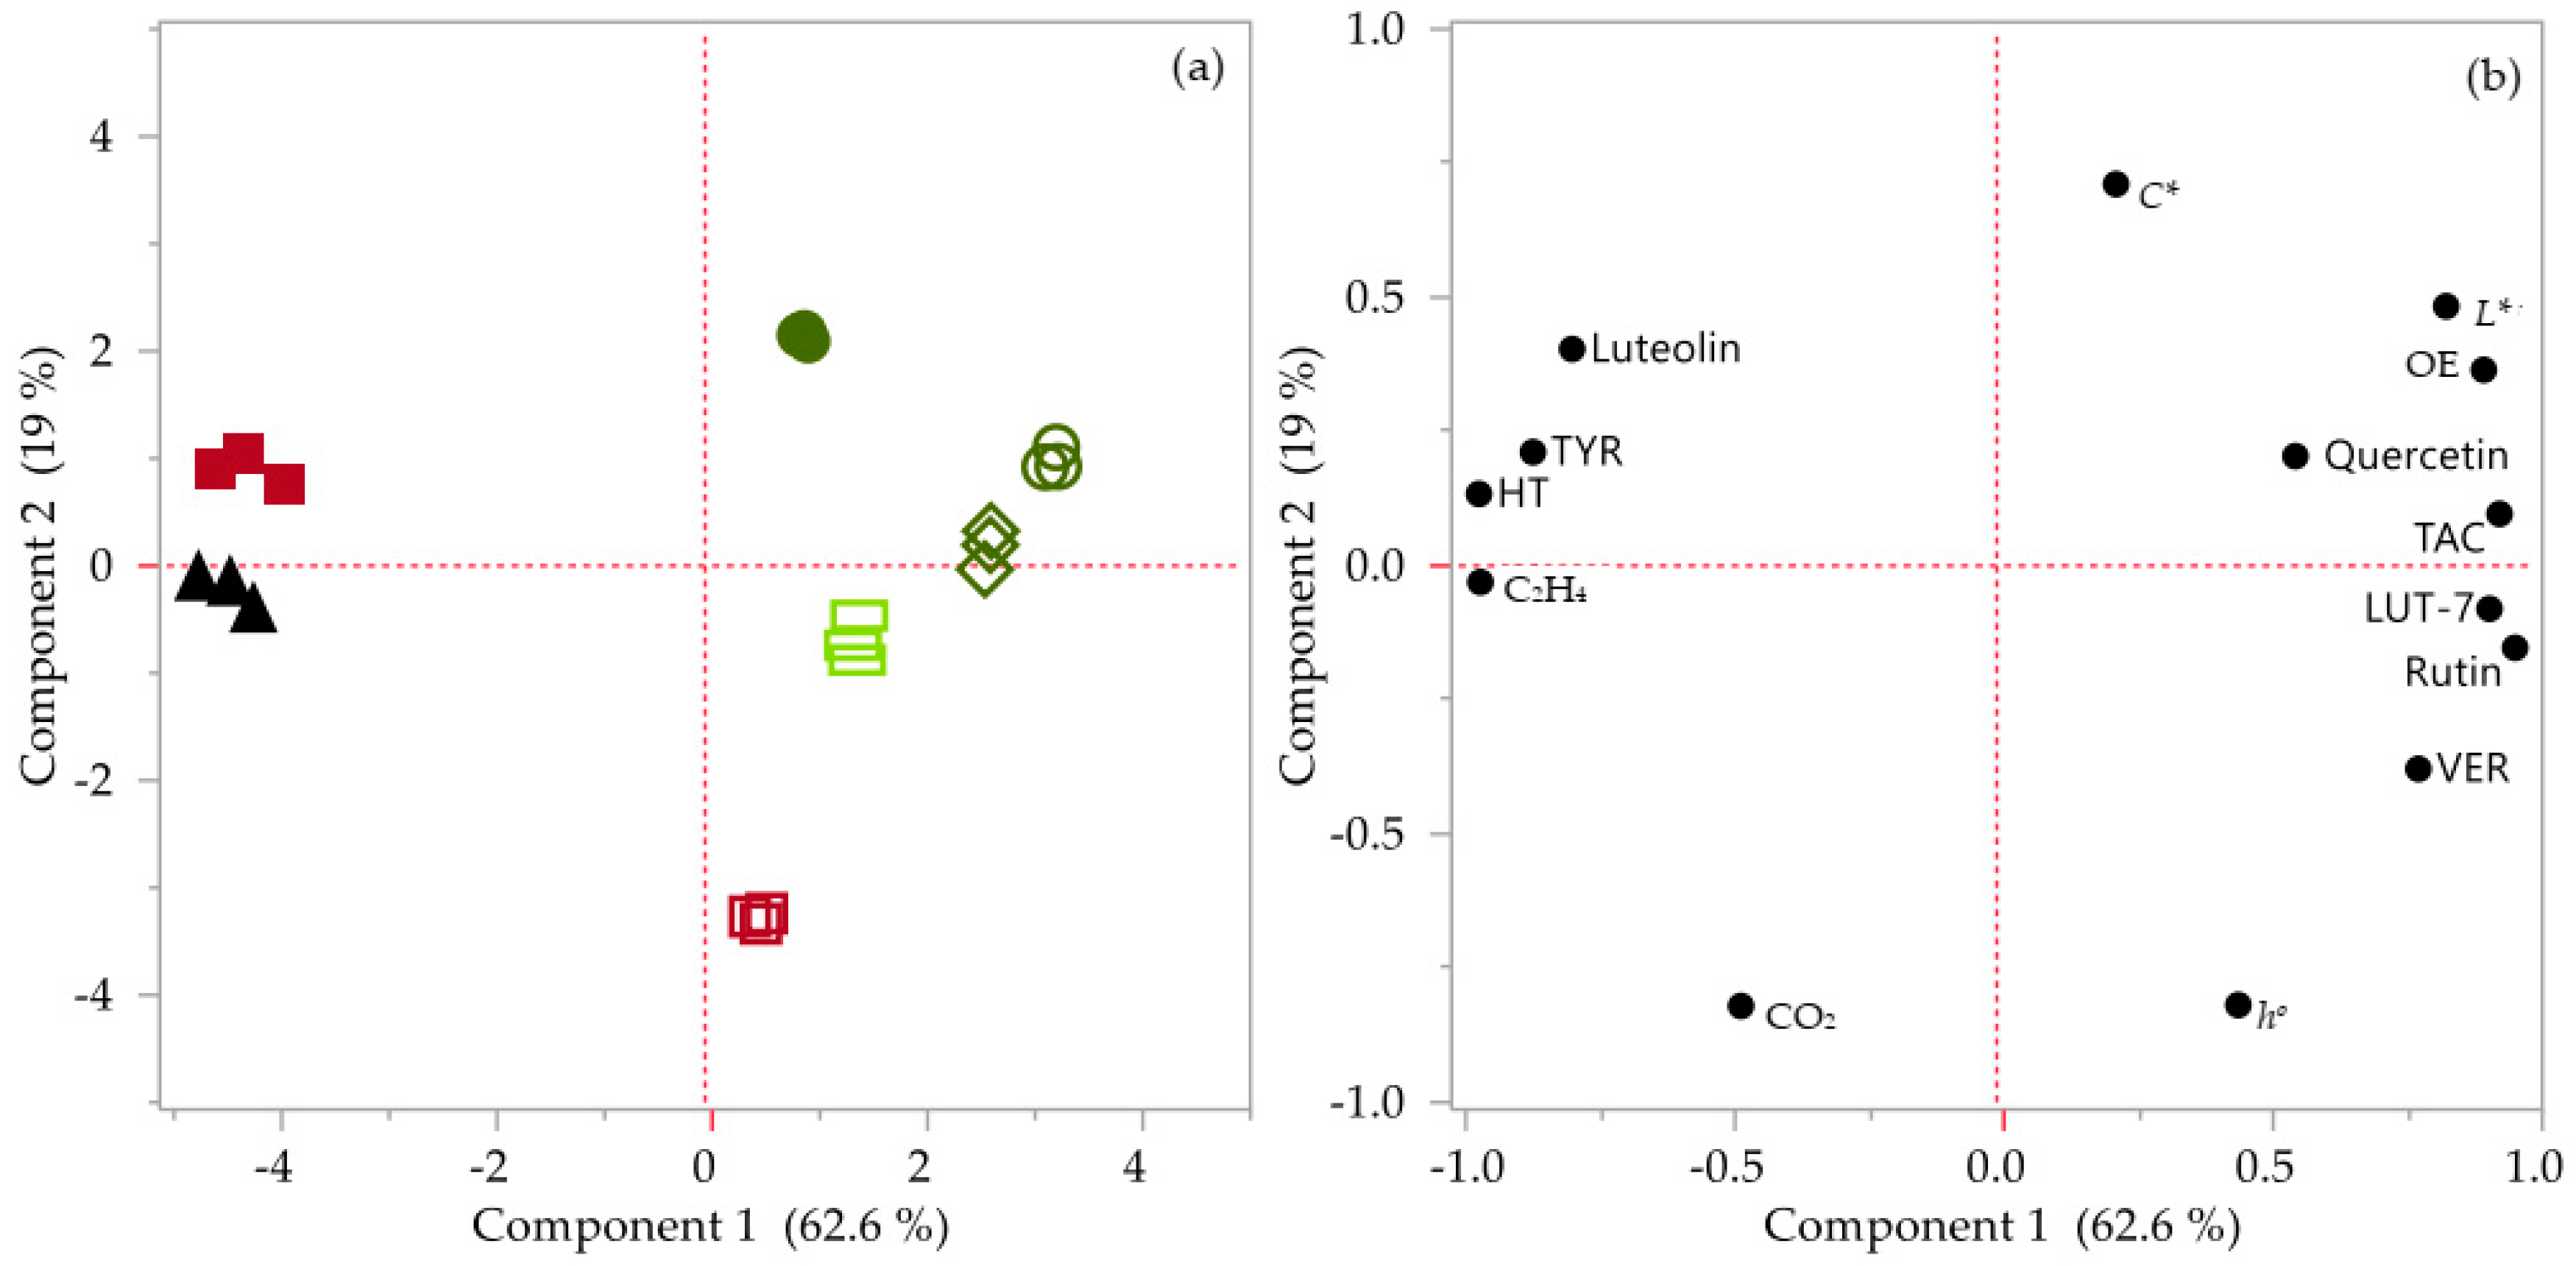
The PCA was performed for all variables determined in both crop years, as presented in Figure 1 and Figure 2 and Table 1. PCA showed two interpretable components, explaining together 81.6% (eigenvalue 2.67) of the total variation (Figure 4). In the score plot, all samples were separated clearly according to their MI (Figure 4a).
Correlations among the variables are summarized in the load plot (Figure 4b) and are represented in Table S1. Strong relationships were found among the attributes following a similar pattern of change during olive fruit ripening. In detail, significant, positive and strong correlations were found between HT and Tyr (r = 0.957), HT and C2H4 (r = 0.926), HT and luteolin (r = 0.906), Tyr and luteolin (r = 0.940), OE and TAC (r = 0.900), OE and L* (r = 0.904) and Lut-7 and rutin (r = 0.965). These relationships were supported by PCA since luteolin, HT, Tyr and C2H4 were shown to be situated close together near the left axis of load plot, while OE, L*, TAC, Lut-7 and rutin were shown to be situated close together near the right axis.
Another PCA for all variables determined in A crop year (including FAs) is presented in Figure S1 and confirmed the higher olive oil quality at early ripening stages or low MIs, being similar to a previous work [13].

4. Conclusions

The aim of the current study was to evaluate the physiological and quality characteristics during ripening of Koroneiki olives in two successive crop years of full production, A and B. Olives were harvested at different MIs and peel color parameters (L*, and C*), respiration and ethylene production rates, TAC and phenolic compounds were measured in olives, and the fatty acid profile and a-tocopherol content were determined in oil. According to the results, respiration and ethylene productions rates, HT concentration and linoleic acid in oil increased by advanced MIs. However, TAC, OE, Lut-7 and linolenic acid values decreased during maturation progression. Practically, olives of low MI were rich in antioxidants and therefore the oil derived from olives harvested at early stages acquired high-quality traits, high stability during storage and long self-life. At MI 4, all determined variables corresponded to oil of high quality. However, more studies are needed to develop objective and easy-to-use descriptions for harvest timing decision under different environmental conditions and cultivation practices in order to obtain oil of high quality.

Supplementary Materials

The following are available online at https://www.mdpi.com/2073-4395/11/1/122/s1, Table S1. Pairwise correlations among peel color parameters, CO2 and C2H4 production rates, phenolic compounds and total antioxidant capacity (TAC), in Koroneiki, olives of different maturity indices (MI), in crop years A and B. Figure S1. Principal Component Analysis (PCA) in Koroneiki olives according to the variables of peel color parameters (L*, and C*), CO2 and C2H4 production rates, phenolic compounds (oleuropein (OE), verbascoside (VER), hydroxytyrosol (HT), tyrosol (TYR), luteolin-7-O-glucoside (LUT-7), rutin, luteolin and quercetin), total antioxidant capacity (TAC) and fatty acids (palmitic (PA), palmitoleic (PO), stearic (ST), oleic (OL), vaccenic (VA), linoleic (LL), linolenic (LN), arachidic (AR), gondoic (GO)) affected by maturity index (MI), in crop year A. In PCA: a, Score plot; b, Load plot. In a: open circle, olives at MI 0.9; open rhombus, olives at MI 1.4; open rectangle, olives at MI 2.1; open square, olives at MI 4. In b: circle indicates the position of each variable in load plot. Numbers in parentheses correspond to the percentage of the total variance explained by each component.

Author Contributions

Conceptualization, M.K. and E.T.; methodology, M.K. and E.T.; software, M.K.; validation, M.K., G.O. and E.T.; formal analysis, M.K.; investigation, M.K. and E.T.; data curation, M.K. and E.T.; writing—original draft preparation, M.K.; writing—review and editing, M.K., G.O. and E.T.; visualization, M.K.; supervision, E.T. All authors have read and agreed to the published version of the manuscript.

Funding

This research received no external funding.

Institutional Review Board Statement

Not applicable.

Informed Consent Statement

Not applicable.

Data Availability Statement

The data presented in this study are available on request from the corresponding author.

Conflicts of Interest

The authors declare no conflict of interest.

References

  1. Loumou, A.; Giourga, C. Olive groves: The life and identity of the Mediterranean. Agric. Hum. Values 2003, 20, 87–95. [Google Scholar] [CrossRef]
  2. Conde, C.; Delrot, S.; Gerós, H. Physiological, biochemical and molecular changes occurring during olive development and ripening. J. Plant Physiol. 2008, 165, 1545–1562. [Google Scholar] [CrossRef] [PubMed]
  3. Trichopoulou, A.; Lagiou, P.; Kuper, H.; Trichopoulos, D. Cancer and Mediterranean Dietary Traditions. Cancer Epidemiol. Biomark. Prev. 2000, 9, 869–873. [Google Scholar]
  4. Sanchez, J.; Harwood, J. Biosynthesis of triacylglycerols and volatiles in olives. Eur. J. Lipid Sci. Technol. 2002, 104, 564–573. [Google Scholar] [CrossRef]
  5. Rotondi, A.; Bendini, A.; Cerretani, L.; Mari, M.; Lercker, G.; Toschi, T.G. Effect of Olive Ripening Degree on the Oxidative Stability and Organoleptic Properties of Cv. Nostrana di Brisighella Extra Virgin Olive Oil. J. Agric. Food Chem. 2004, 52, 3649–3654. [Google Scholar] [CrossRef]
  6. Emmanouilidou, M.G.; Koukourikou-Petridou, M.; Gerasopoulos, D.; Kyriacou, M.C. Evolution of physicochemical constitution and cultivar-differential maturity configuration in olive (Olea europaea L.) fruit. Sci. Hortic. 2020, 272, 109516. [Google Scholar] [CrossRef]
  7. Uceda, M.; Frias, L. Evolution of the fruit oil content, oil composition and oil quality. In Proceedings of the International Olive Oil Council, Cordoba, Spain, 6–17 October 1975; pp. 125–130. [Google Scholar]
  8. Vinha, A.F.; Ferreres, F.; Silva, B.M.; Valentão, P.; Gonçalves, A.; Pereira, J.A.; Oliveira, M.B.; Seabra, R.M.; Andrade, P.B. Phenolic profiles of Portuguese olive fruits (Olea europaea L.): Influences of cultivar and geographical origin. Food Chem. 2005, 89, 561–568. [Google Scholar] [CrossRef]
  9. Garcia, J.M.; Yousfi, K. Non-destructive and objective methods for the evaluation of the maturation level of olive fruit. Eur. Food Res. Technol. 2005, 221, 538–541. [Google Scholar] [CrossRef]
  10. Anastasopoulos, E.; Kalogeropoulos, N.; Kaliora, A.C.; Kountouri, A.; Andrikopoulos, N.K. The influence of ripening and crop year on quality indices, polyphenols, terpenic acids, squalene, fatty acid profile, and sterols in virgin olive oil (Koroneiki cv.) produced by organic versus non-organic cultivation method. Int. J. Food Sci. Technol. 2011, 46, 170–178. [Google Scholar] [CrossRef]
  11. Dag, A.; Harlev, G.; Lavee, S.; Zipori, I.; Kerem, Z. Optimizing olive harvest time under hot climatic conditions of Jordan Valley, Israel. Eur. J. Lipid Sci. Technol. 2014, 116, 169–176. [Google Scholar] [CrossRef]
  12. Dag, A.; Kerem, Z.; Yogev, N.; Zipori, I.; Lavee, S.; Ben-David, E. Influence of time of harvest and maturity index on olive oil yield and quality. Sci. Hortic. 2011, 127, 358–366. [Google Scholar] [CrossRef]
  13. Kafkaletou, M.; Tsantili, E. Oil content and composition in relation to leaf photosynthesis, leaf sugars and fruit sugars in maturing Koroneiki olives–The mannitol effect on oil. J. Appl. Bot. Food Qual. 2016, 89, 1–10. [Google Scholar] [CrossRef]
  14. Pardo, J.E.; Tello, J.; Suárez, M.; Rabadán, A.; De Miguel, C.; Álvarez-Orti, M. Variety Characterization and Influence of Olive Maturity in Virgin Olive Oils from the Area Assigned to the Protected Designation of Origin “Aceite de la Alcarria” (Spain). Agronomy 2020, 10, 38. [Google Scholar] [CrossRef] [Green Version]
  15. Tsantili, E.; Kafkaletou, M.; Roussos, P.A.; Christopoulos, M.V. Phenolic compounds, maturation and quality in fresh green olives for table use during exposure at 20 °C after preharvest ReTain treatment. Sci. Hortic. 2012, 140, 26–32. [Google Scholar] [CrossRef]
  16. McGuire, R.G. Reporting of Objective Color Measurements. HortScience 1992, 27, 1254–1255. [Google Scholar] [CrossRef] [Green Version]
  17. Benzie, I.F.F.; Strain, J.J. [2] Ferric reducing/antioxidant power assay: Direct measure of total antioxidant activity of biological fluids and modified version for simultaneous measurement of total antioxidant power and ascorbic acid concentration. In Methods in Enzymology; Lester, P., Ed.; Academic Press: London, UK, 1999; Volume 299, pp. 15–27. [Google Scholar]
  18. Tsantili, E. Quality attributes and their relations in fresh black ripe ‘Kalamon’ olives (Olea europaea L.) for table use–phenolic compounds and total antioxidant capacity. Int. J. Food Sci. Technol. 2014, 49, 657–665. [Google Scholar] [CrossRef]
  19. Wagner, K.-H.; Elmadfa, I. Effects of tocopherols and their mixtures on the oxidative stability of olive oil and linseed oil under heating. Eur. J. Lipid Sci. Technol. 2000, 102, 624–629. [Google Scholar] [CrossRef]
  20. Ranalli, A.; Tombesi, A.; Ferrante, M.L.; De Mattia, G. Respiratory rate of olive drupes during their ripening cycle and quality of oil extracted. J. Sci. Food Agric. 1998, 77, 359–367. [Google Scholar] [CrossRef]
  21. Fernández-Bolaños, J.; Heredia, A.; Vioque, B.; Castellano, J.M.; Guillén, R. Changes in cell-wall-degrading enzyme activities in stored olives in relation to respiration and ethylene production Influence of exogenous ethylene. Z. Lebensm.-Unters. Forsch. 1997, 204, 293–299. [Google Scholar] [CrossRef]
  22. Tsantili, E.; Christopoulos, M.V.; Pontikis, C.A.; Kaltsikes, P.; Kallianou, C.; Komaitis, M. Texture and Other Quality Attributes in Olives and Leaf Characteristics after Preharvest Calcium Chloride Sprays. HortScience 2008, 43, 1852–1856. [Google Scholar] [CrossRef] [Green Version]
  23. Kafkaletou, M.; Fasseas, C.; Tsantili, E. Increased firmness and modified cell wall composition by ethylene were reversed by the ethylene inhibitor 1-methylcyclopropene (1-MCP) in the non-climacteric olives harvested at dark green stage–Possible implementation of ethylene for olive quality. J. Plant Physiol. 2019, 238, 63–71. [Google Scholar] [CrossRef] [PubMed]
  24. Ryan, D.; Robards, K. Critical Review. Phenolic compounds in olives. Analyst 1998, 123, 31R–44R. [Google Scholar] [CrossRef]
  25. Morelló, J.-R.; Motilva, M.a.-J.; Tovar, M.a.-J.; Romero, M.a.-P. Changes in commercial virgin olive oil (cv Arbequina) during storage, with special emphasis on the phenolic fraction. Food Chem. 2004, 85, 357–364. [Google Scholar] [CrossRef]
  26. Amiot, M.J.; Fleuriet, A.; Macheix, J.J. Importance and evolution of phenolic compounds in olive during growth and maturation. J. Agric. Food Chem. 1986, 34, 823–826. [Google Scholar] [CrossRef]
  27. Gómez-Rico, A.; Fregapane, G.; Salvador, M.D. Effect of cultivar and ripening on minor components in Spanish olive fruits and their corresponding virgin olive oils. Food Res. Int. 2008, 41, 433–440. [Google Scholar] [CrossRef]
  28. Alagna, F.; Geu-Flores, F.; Kries, H.; Panara, F.; Baldoni, L.; O’Connor, S.E.; Osbourn, A. Identification and characterization of the iridoid synthase involved in oleuropein biosynthesis in olive (Olea europaea) fruits. J. Biol. Chem. 2016, 291, 5542–5554. [Google Scholar] [CrossRef] [Green Version]
  29. Bouaziz, M.; Jemai, H.; Khabou, W.; Sayadi, S. Oil content, phenolic profiling and antioxidant potential of Tunisian olive drupes. J. Sci. Food Agric. 2010, 90, 1750–1758. [Google Scholar] [CrossRef]
  30. Alagna, F.; Mariotti, R.; Panara, F.; Caporali, S.; Urbani, S.; Veneziani, G.; Esposto, S.; Taticchi, A.; Rosati, A.; Rao, R.; et al. Olive phenolic compounds: Metabolic and transcriptional profiling during fruit development. BMC Plant Biol. 2012, 12, 162. [Google Scholar] [CrossRef] [Green Version]
  31. Visioli, F.; Bellomo, G.; Galli, C. Free Radical-Scavenging Properties of Olive Oil Polyphenols. Biochem. Biophys. Res. Commun. 1998, 247, 60–64. [Google Scholar] [CrossRef]
  32. Romani, A.; Mulinacci, N.; Pinelli, P.; Vincieri, F.F.; Cimato, A. Polyphenolic Content in Five Tuscany Cultivars of Olea europaea L. J. Agric. Food Chem. 1999, 47, 964–967. [Google Scholar] [CrossRef]
  33. O’Donoghue, E.M.; Huber, D.J.; Timpa, J.D.; Erdos, G.W.; Brecht, J.K. Influence of avocado (Persea americana) Cx-cellulase on the structural features of avocado cellulose. Planta 1994, 194, 573–584. [Google Scholar] [CrossRef]
  34. Ortega-García, F.; Blanco, S.; Peinado, M.Á.; Peragón, J. Phenylalanine ammonia-lyase and phenolic compounds in leaves and fruits of Olea europaea L. cv. Picual during ripening. J. Sci. Food Agric. 2009, 89, 398–406. [Google Scholar] [CrossRef]
  35. Morelló, J.-R.; Romero, M.-P.; Ramo, T.; Motilva, M.-J. Evaluation of L-phenylalanine ammonia-lyase activity and phenolic profile in olive drupe (Olea europaea L.) from fruit setting period to harvesting time. Plant Sci. 2005, 168, 65–72. [Google Scholar] [CrossRef]
  36. Briante, R.; La Cara, F.; Febbraio, F.; Patumi, M.; Nucci, R. Bioactive derivatives from oleuropein by a biotransformation on Olea europaea leaf extracts. J. Biotechnol. 2002, 93, 109–119. [Google Scholar] [CrossRef]
  37. Baiano, A.; Gambacorta, G.; Terracone, C.; Previtali, M.A.; La Notte, E. Characteristics of drupes, phenolic content and antioxidant capacity of Italian olive fruits. J. Food Lipids 2009, 16, 209–226. [Google Scholar] [CrossRef]
  38. Simopoulos, A.P. The Importance of the Omega-6/Omega-3 Fatty Acid Ratio in Cardiovascular Disease and Other Chronic Diseases. Exp. Biol. Med. 2008, 233, 674–688. [Google Scholar] [CrossRef] [PubMed]
  39. Parvini, F.; Zeinanloo, A.A.; Ebrahimie, E.; Tahmasebi-Enferadi, S.; Hosseini-Mazinani, M. Differential expression of fatty acid desaturases in Mari and Shengeh olive cultivars during fruit development and ripening. Eur. J. Lipid Sci. Technol. 2015, 117, 523–531. [Google Scholar] [CrossRef]
  40. Psomiadou, E.; Tsimidou, M.; Boskou, D. α-Tocopherol Content of Greek Virgin Olive Oils. J. Agric. Food Chem. 2000, 48, 1770–1775. [Google Scholar] [CrossRef]
  41. Allalout, A.; Krichène, D.; Methenni, K.; Taamalli, A.; Oueslati, I.; Daoud, D.; Zarrouk, M. Characterization of virgin olive oil from Super Intensive Spanish and Greek varieties grown in northern Tunisia. Sci. Hortic. 2009, 120, 77–83. [Google Scholar] [CrossRef]
  42. Garcia, B.; Magalhães, J.; Fregapane, G.; Salvador, M.D.; Paiva-Martins, F. Potential of selected Portuguese cultivars for the production of high quality monovarietal virgin olive oil. Eur. J. Lipid Sci. Technol. 2012, 114, 1070–1082. [Google Scholar] [CrossRef]
  43. Gutierrez-Rosales, F.; Romero, M.P.; Casanovas, M.; Motilva, M.J.; Mínguez-Mosquera, M.I. Metabolites Involved in Oleuropein Accumulation and Degradation in Fruits of Olea europaea L.: Hojiblanca and Arbequina Varieties. J. Agric. Food Chem. 2010, 58, 12924–12933. [Google Scholar] [CrossRef] [PubMed]
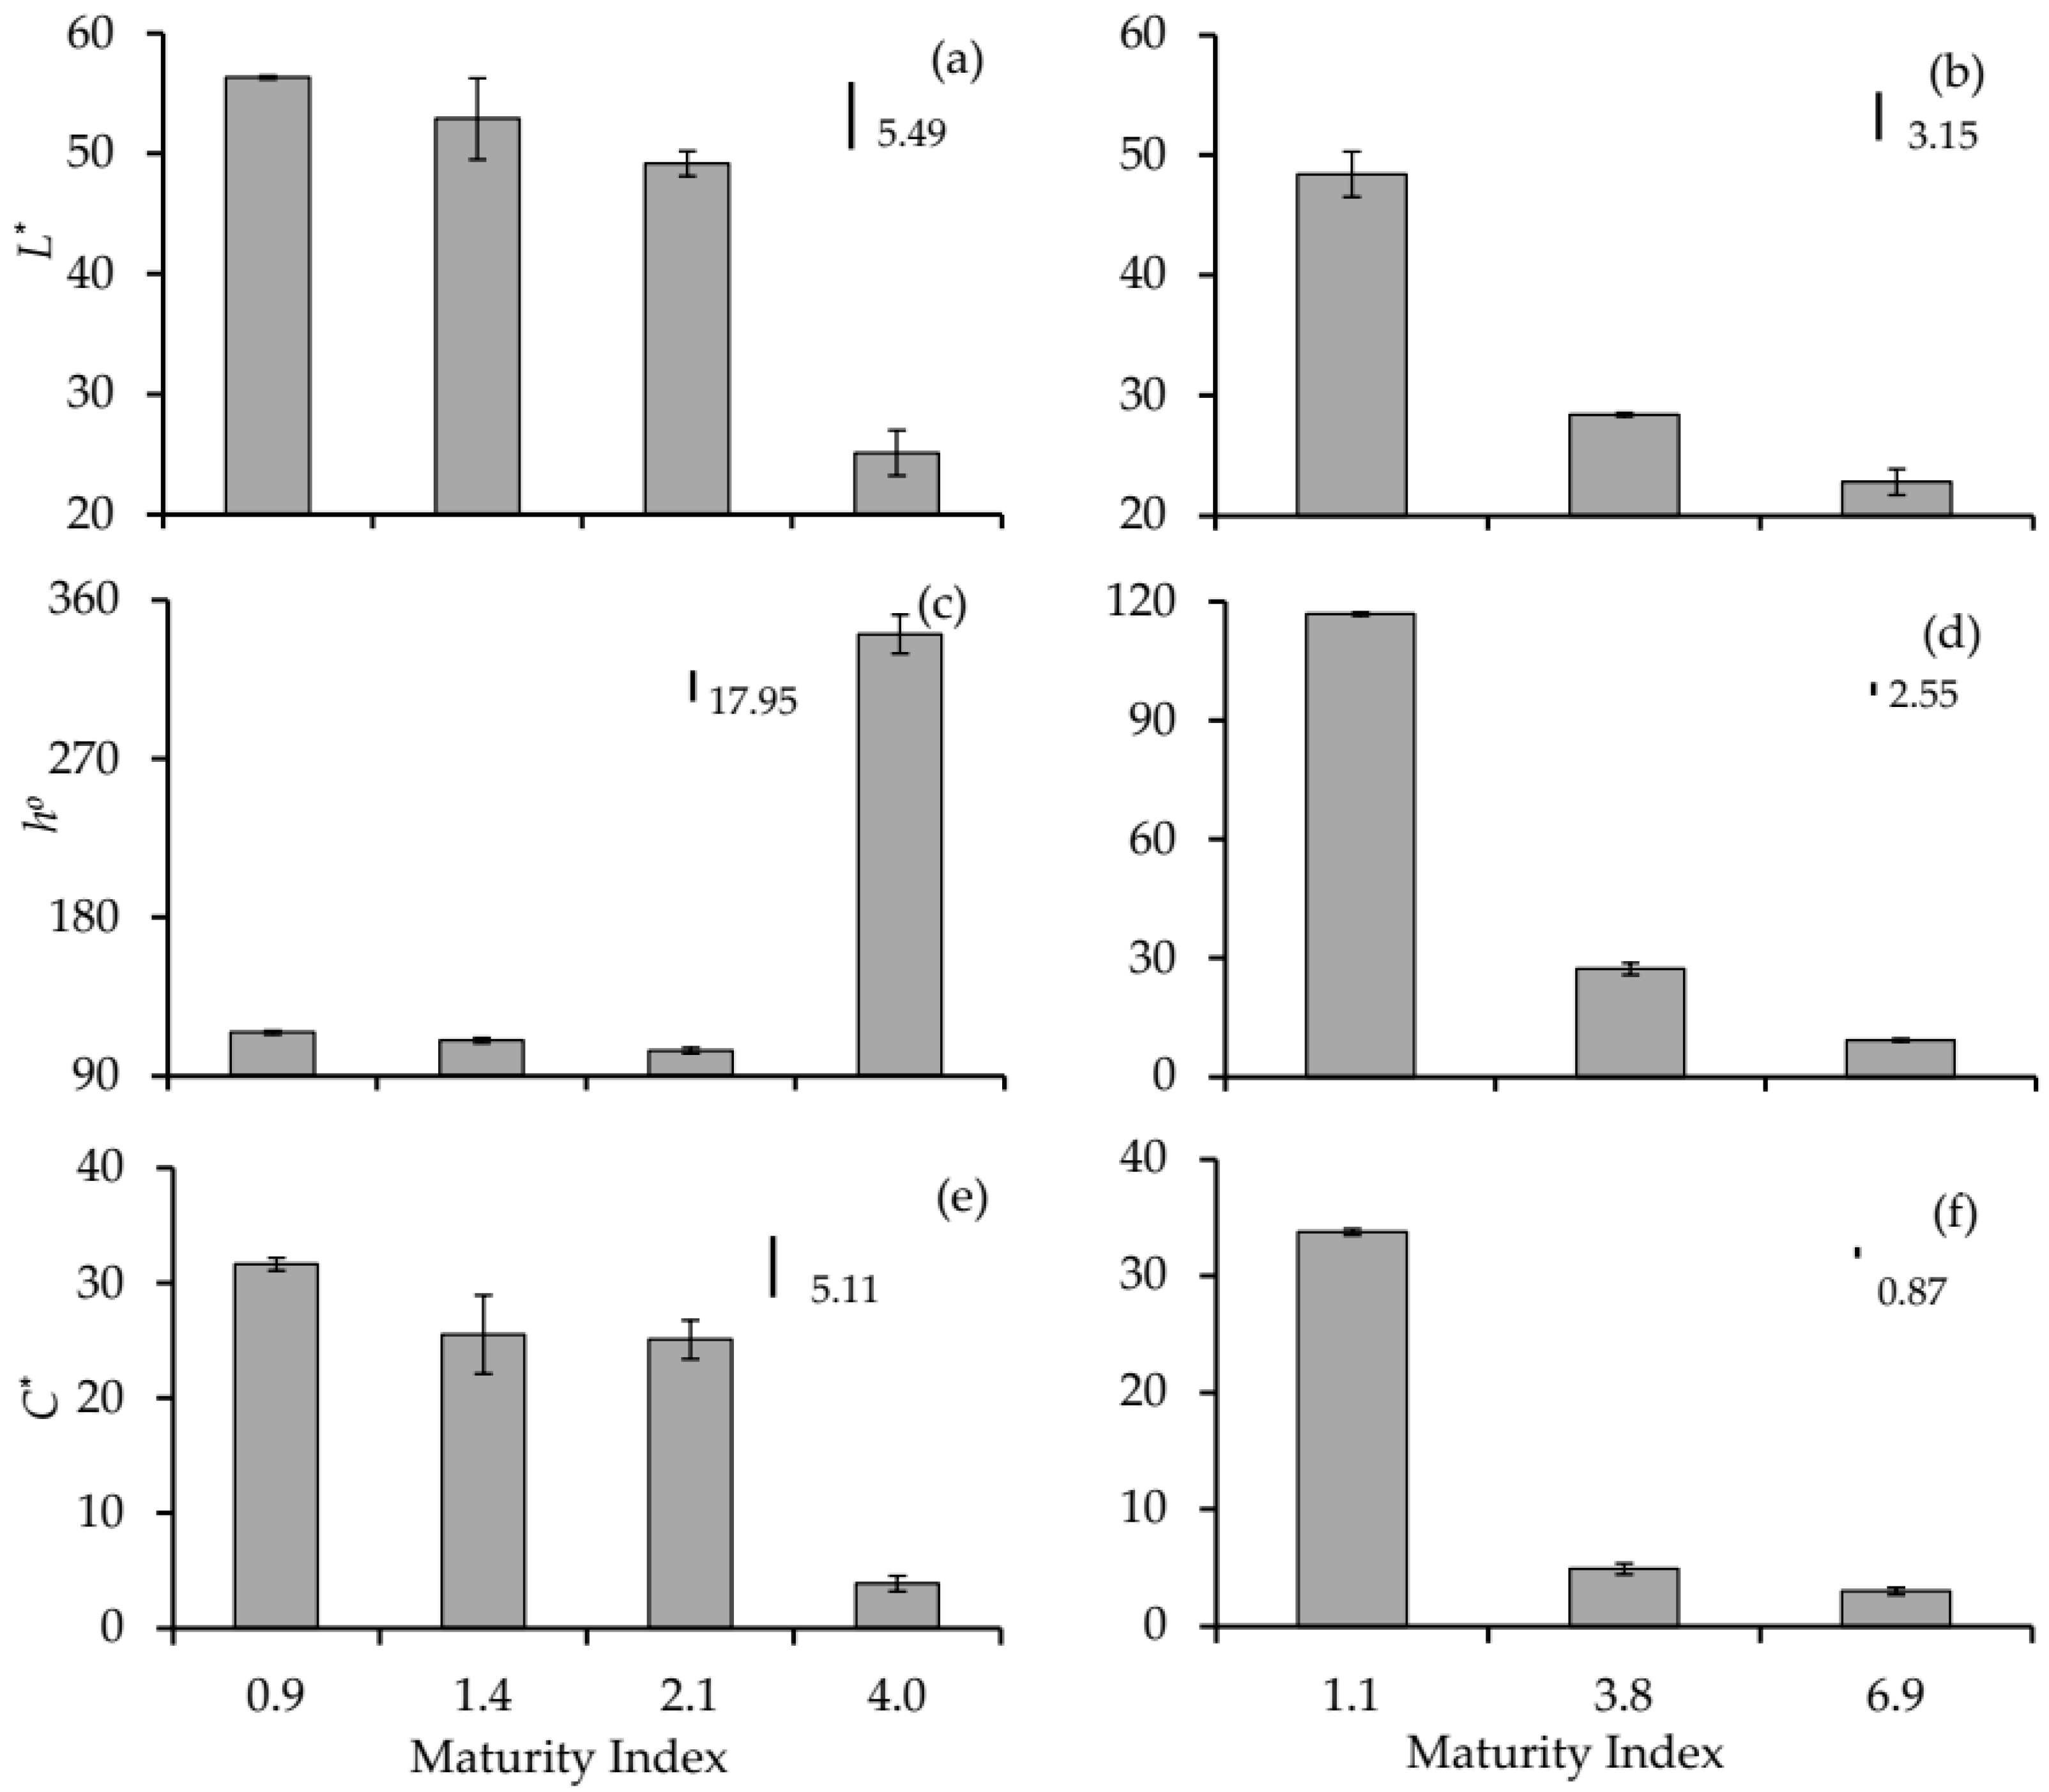
Figure 1. Effect of maturity index (MI) on color parameters L*, and C*, depicted in (a,b), (c,d), (e,f), respectively in Koroneiki olives. Left column, crop year A; right column, crop year B. Bars without numbers correspond to standard deviations; bars with numbers to HSD (Tukey’s honest significant difference), values at p = 0.05. In all figures and for all color parameters, p < 0.001.
Agronomy 11 00122 g001
Figure 2. Effect of maturity index (MI) on respiration production rates depicted in (a,b), and ethylene production rates in (c,d), in Koroneiki olives. Left column, crop year A; right column, crop year B. Bars without numbers correspond to standard deviations; bars with numbers to HSD (Tukey’s honest significant difference) values at p = 0.05. In all figures, p < 0.001.
Agronomy 11 00122 g002
Figure 3. Effect of maturity index (MI) on α-tocopherol content in oil derived from Koroneiki olives. Bars without numbers correspond to standard deviations; the bar with number corresponds to HSD (Tukey’s honest significant difference) values at p = 0.05. p < 0.001.
Agronomy 11 00122 g003
Figure 4. Principal Component Analysis (PCA) in Koroneiki olives according to the variables of peel color parameters (L*, and C*), CO2 and C2H4 production rates, phenolic compounds (oleuropein (OE), verbascoside (VER), hydroxytyrosol (HT), tyrosol (TYR), luteolin-7-O-glucoside (LUT-7), rutin, luteolin and quercetin) and total antioxidant capacity (TAC) affected by maturity index (MI), in crop years A and B. In PCA—a, Score plot; b, Load plot. In (a)—open and filled shapes correspond to crop year A and B, respectively; open circle, olives at MI 0.9; open rhombus, olives at MI 1.4; open rectangle, olives at MI 2.1; open square, olives at MI 4; filled circle, olives at MI 1.1; filled square, olives at MI 3.8; filled triangle, olives at MI 6.9. In (b)—circle indicates the position of each variable in load plot. Numbers in parentheses correspond to the percentage of the total variance explained by each component.
Agronomy 11 00122 g004
Table 1. Content of individual phenolic compounds, oleuropein (OE), verbascoside (Ver), hydroxytyrosol (HT), tyrosol, luteolin-7-O-glucoside (Lut-7), rutin, quercetin, luteolin, as well as, total antioxidant capacity (TAC), estimated by FRAP assay, in the flesh of Koroneiki olive fruit of different maturity indices (MI), in crop years A and B.
Crop yeaMIOE
(mg g−1)
Ver
(mg g−1)
HT
(μg g−1)
Tyr
(μg g−1)
Lut-7
(mg g−1)
Rutin
(mg g−1)
Quercetin
(μg g−1)
Luteolin
(μg g−1)
TAC
(μmol g−1)
A0.99.89 ± 0.16 10.32 ± 0.0139.70 ± 1.3420.14 ± 1.940.37 ± 0.010.35 ± 0.0226.29 ± 2.1517.85 ± 0.44178.75 ± 0.98
1.410.63 ± 0.140.33 ± 0.0245.26 ± 1.1828.95 ± 0.770.34 ± 0.010.33 ± 0.0120.18 ± 1.6710.10 ± 1.75163.10 ± 1.87
2.16.36 ± 0.280.31 ± 0.0149.95 ± 1.5318.82 ± 2.590.30 ± 0.010.26 ± 0.0110.41 ± 1.3010.89 ± 0.81155.02 ± 1.20
4.04.05 ± 0.090.32 ± 0.01100.95 ± 5.7316.90 ± 1.300.18 ± 0.010.25 ± 0.019.94 ± 1.787.46 ± 1.18160.13 ± 2.81
HSD 20.480.028.114.660.020.044.583.014.85
p3***ns*********************
B1.110.49 ± 0.350.18 ± 0.01100.16 ± 9.6517.54 ± 5.110.12 ± 0.0090.17 ± 0.0096.65 ± 1.7015.17 ± 1.16172.06 ± 2.83
3.80.80 ± 0.030.21 ± 0.02429.90 ± 14.90154.05 ± 18.510.03 ± 0.0050.05 ± 0.00314.81 ± 2.1543.15 ± 4.72123.47 ± 3.69
6.90.34 ± 0.060.16 ± 0.01328.48 ± 17.5588.33 ± 7.630.02 ± 0.0020.02 ± 0.0033.98 ± 0.6027.83 ± 7.37128.73 ± 4.13
HSD0.520.0436.1029.880.010.014.0612.789.00
p***ns*********************
1 Numbers are means of three replicates ± SD. 2 HSD, Tuckey’s honest significance difference values at p = 0.05. 3 p, Probabilities. ns, not significant. ***, Significant at p < 0.001.
Table 2. Content of fatty acids (FAs), in the oil derived of Koroneiki olive fruit of different maturity indices (MI), in crop year A.
MIPalmitic
C16:0
(%)
Palmitoleic
C16:1 n-9
(%)
Stearic
C18:0
(%)
Oleic
C18:1 n-9
(%)
Vaccenic
C18:1 n-11
(%)
Linoleic
C18:2 n-9, 12
(%)
Linolenic
C18:3 n-9, 12, 15
(%)
Arachidic
C20:0
(%)
Gondoic
C20:1 n-11
(%)
SFA
Cv:0
(%)
MUFA
Cv:1
(%)
PUFA
Cv:n (n ≥ 1)
(%)
UFA/SFAω-6/ω-3
0.911.16 ± 0.58 10.84 ± 0.032.92 ± 0.1076.18 ± 0.761.89 ± 0.095.20 ± 0.070.80 ± 0.010.52 ± 0.040.31 ± 0.0314.61 ± 0.6979.24 ± 0.656.01 ± 0.085.85 ± 0.336.44 ± 0.11
1.411.02 ± 0.920.84 ± 0.042.93 ± 0.3176.35 ± 1.501.50 ± 0.145.52 ± 0.120.75 ± 0.010.55 ± 0.080.34 ± 0.0214.51 ± 1.2779.05 ± 1.376.28 ± 0.125.92 ± 0.637.27 ± 0.19
2.110.46 ± 0.710.87 ± 0.072.70 ± 0.3376.64 ± 0.801.81 ± 0.185.73 ± 0.270.75 ± 0.040.41 ± 0.080.36 ± 0.0313.66 ± 1.1279.70 ± 0.966.49 ± 0.316.34 ± 0.627.63 ± 0.04
4.09.85 ± 0.820.87 ± 0.092.48 ± 0.4576.07 ± 1.511.94 ± 0.127.13 ± 0.130.66 ± 0.030.48 ± 0.090.34 ± 0.0412.82 ± 1.3579.24 ± 1.447.81 ± 0.136.85 ± 0.8310.68 ± 0.56
HSD 22.010.160.543.140.350.440.070.190.082.973.010.481.640.78
p3nsnsnsns*******nsnsnsns***ns***
1 Numbers are means of three replicates ± SD. 2 HSD, Tuckey’s honest significance difference values at p = 0.05. 3 p, Probabilities. ns, not significant. *, Significant at p < 0.05. ***, Significant at p < 0.001.
Publisher’s Note: MDPI stays neutral with regard to jurisdictional claims in published maps and institutional affiliations.