Article

Process Optimization for Ultrasound-Assisted Starch Production from Cassava (Manihot esculenta Crantz) Using Response Surface Methodology

by
Widiastuti Setyaningsih
*,
Karmila
,
Rohmah Nur Fathimah
and
Muhammad Nur Cahyanto
Department of Food and Agricultural Product Technology, Faculty of Agricultural Technology, Gadjah Mada University, Jalan Flora, Bulaksumur, Yogyakarta 55281, Indonesia
*
Author to whom correspondence should be addressed.
Agronomy 2021, 11(1), 117; https://doi.org/10.3390/agronomy11010117
Submission received: 29 November 2020 / Revised: 4 January 2021 / Accepted: 7 January 2021 / Published: 9 January 2021
(This article belongs to the Special Issue Extraction and Analysis of Natural Product in Plant)

Abstract

:
Ultrasound-assisted extraction (UAE) has been optimized to improve the current cassava starch production by conventional maceration for the extraction method. Evaluation of several extraction parameters disclosed significant effects (p < 0.05) by three studied factors (ultrasound power, x1; pulse duty-cycle, x2; and solvent to sample ratio, x3). Subsequently, a Box-Behnken design (BBD) in conjunction with response surface methodology (RSM) was employed to optimise the three factors at three levels: x1 (30, 60, 90%), x2 (0.3, 0.6, 0.9 s−1), and x3 (10:1, 20:1, 30:1). The model built for the RSM was validated through the coefficient of determination (R2 > 0.95), prediction error (2.12%), and lack-of-fit (0.71) values. The model validation suggested that the RSM was adequate for the observed data at the 95.0% confidence level. The optimum yield of cassava starch extraction was achieved by applying 90% for ultrasound power, pulse duty-cycle of 1.0 s−1, and solvent to sample ratio of 30:1 with 10 min extraction time. Finally, the UAE produced starch with a purity of 88.36% and a lower viscosity than the commercial sample due to the granules’ size alteration. Hence, apart from speeding up the extraction process, UAE was worthwhile for the starch modification that could maintain the viscosity at a lower value (1920 cP) than the commercial starch (1996 cP) at the highest studied temperature treatment of 70 °C.

Graphical Abstract

1. Introduction

Cassava (Manihot esculenta Crantz) is an essential tropical crop that serves as a staple food for populations in Asia and Africa. The demand for cassava is not only limited to fresh but also processed products such as dried cassava, flour, and starch. These derived products of cassava are more favorable to the longer shelf life compare to the fresh ones because the deterioration can be suppressed by decreasing the water content [1,2]. Additionally, fresh cassava attains a reasonable level of cyanide, reaching 800 ppm [3,4]. Hence, cassava processing is worth achieving the desired quality of the derived products [2]. Cassava starch is the highest demand for derived products in the global market [5,6], with the production of roughly 40% of the total cassava products [4].
Starch is popularly used as a raw material in food and non-food industries. It is widely utilized in food industries as a gelling agent, thickener, coating, and texture forming to produce snacks, bread, sauces, and sweeteners. Meanwhile, in non-food industries, cassava starch serves as the main ingredient for paper, textile, glue, medicine, bioethanol, and other industrial products [7,8,9].
To provide cassava starch for the industries, a conventional approach to extract the starch is available by the maceration method at ambient temperature. However, the production yield is limited. The small-scale industries merely produce 18–22 g starch from 100 g cassava tuber, whilst larger-scale industries provide 20–25 g starch from 100 g cassava tuber. Not only delivering low production yield, the drawback of applying conventional maceration as the extraction method is a time-consuming process up to 24 h [5]. As conventional maceration required a high amount of solvent, some of which employing organic solvents, could lead to an environmental problem.
Several proposed alternatives for the extraction method that are faster and environmentally friendly have been developed to replace conventional maceration, including the ultrasound-assisted extraction (UAE). This extraction technique utilizes the cavitation effect caused by ultrasonic waves in a liquid medium for breaking down the cell wall [10,11,12]. As the starch granules in cassava are trapped by cellulose fibers bound with pectin in the cell walls [13], UAE thereby triggers the rapid release of analytes into the extraction solvent [14].
The use of ultrasound in the starch extraction process, as reported by Bernardo et al. [15], results in an increase in the yield of starch from sweet potato (Dioscorea bulbífera) in a relatively short time (15 min). Another study by González-Lemus et al. [16] observed similar results that starch from frozen yam showed an increased yield of more than 45% compared to the conventional method. UAE application for starch from purple sweet potato by Sit et al. [17] disclosed that it not only increased the yield and shortened the extraction time, but the functional properties of the resulting extract were also better. The UAE influenced the physicochemical and functional characteristics of the produced starch [18]. However, with different matrices, the UAE application for starch production requires specific optimum conditions [19].
In the starch extraction process with UAE, several important factors affect its efficiency, which include the ratio of the sample to the solvent, ultrasound power, pulse duty-cycle, and extraction time [17,20,21]. The period per second that ultrasound is delivered producing cavitation, is hereby defined as pulse duty-cycle. Increasing the pulse duty-cycle can increase the sonochemical effect, thereby facilitating the air bubbles formation [22]. Ultrasound power is a variable that affects cavitation occurrence and is calculated as % of the power delivered to the transducers. Higher power produces faster ultrasonic wave propagation in the medium [23]. Therefore, high ultrasonic power application increases the extraction yield, as more molecular breakdown was found to cause a higher release of starch molecules from the granule into the medium [24]. Rising the solvent to sample ratio can increase the mass transfer activity resulting in a higher yield [25]. Applying a proper extraction time is also important as a longer extraction time can achieve more yield [11,26].
In order to simultaneously evaluate the aforementioned extraction factors, chemometrics, namely the Box-Behnken design (BBD), was applied and followed by response surface methodology (RSM) for determining the optimum extraction conditions. Evaluation of the extraction process was carried out by analyzing the physical and chemical properties of the starch produced by UAE, including pH, starch level, viscosity, and granules characterization.

2. Materials and Methods

2.1. Sample and Sample Preparation

The raw material used in this study was a fresh-harvested cassava tuber at the age of 9 months. This cassava tuber belongs to a sweet local variety of Java, namely Ketan. It was supplied directly from the farmer in Wonosobo, Central Java, Indonesia (GPS coordinates 7°23′38.6″ S 109°53′35.9″ E). Prior to the extraction process, the cassava was processed into flour. The first stage involved washing with running water for soil and dirt removal. Afterward, the skin was peeled, and the flesh was sliced into thin chips and dried in a cabinet dryer (50 °C) for 24 h. Furthermore, the dry chips were ground into powder. The grinding process produced flour with an average size of 60 mesh. The cassava flour was then stored in a closed plastic container with silica gel until it was used as a sample for extraction.

2.2. Extraction of Cassava Starch

Ultrasound-assisted extraction (UAE) was performed using the ultrasonic probe UP200St 200 W, 26 kHz (Hielscher, Germany). A sample of 15 g cassava flour was weighed and placed in a beaker glass. A specific amount of distilled water, corresponding to the experimental design, was poured into the beaker as an extraction solvent. The mixture was then extracted for 10 min at room temperature using UAE. In order to understand the effect of extraction factors on cassava starch production efficiency, three variables were evaluated, i.e., solvent to sample ratio (10:1–30:1), ultrasound power (30–90%), and pulse duty-cycle (0.3–0.9 s−1). The resulting solution was then filtered by filter cloth to remove the solid material. The extract was deposited overnight and dried in a cabinet dryer (AM-TD24, Yogyakarta, Indonesia) at 50 °C for 24 h. The starch obtained was calculated through the following equation:
Starch   yield   ( % ) = w 2 w 1 × 100
where w1 is the sample weight and w2 is the weight of starch extracted by UAE.

2.3. Experimental Design

Box-Behnken design (BBD) was used to evaluate the extraction process variables. In consideration of the difference in the unit, level, and range between each factor, the levels were normalized into a range of −1 to +1 to get a uniform response. The independent variables and their levels are presented in Table 1. The whole design consisting of 15 experiments, including three center points, which were performed in random order and replication, was listed in Table 2.
Furthermore, the determination of the optimum extraction conditions was performed by response surface methodology (RSM). The responses were the starch yield, which was then evaluated as the basis for developing a mathematical model with a second-order polynomial function,
y = β 0 + i = 1 k β i x i + i = 1 k β i i x i 2   + i = 1 k j = 1 ,   j i k β i j x i x j
where x1, x2, …, xk is the UAE factor affecting the efficiency of the extraction process, y; β0, βii (i = 1, 2, …, k), and βij (i = 1, 2, …, k; j = 1, 2, …, k) are unknown parameters; k is the number of studied independent factors.

2.4. Model Validation and Verification

The obtained model was evaluated for its suitability towards the process being carried out based on the resulting lack-of-fit value and the standard error. The lack-of-fit test was designed to determine the adequacy of the selected model in describing the observed data, or a more complex model is required. The test was performed by comparing the variability of the current model to the variability of the experiments with resetting factors. The model was stated to have high compatibility if the p-value of the ANOVA test results larger than 0.05. Additionally, the standard error value was used to measure the variation in estimation statistically.

2.5. Kinetics Study

A kinetics study was used to determine the effect of extraction time on the starch yield. The optimum conditions attained in the previous stage were used for kinetic evaluation by varying the extraction time from 3 to 25 min. The experiment was conducted using a randomized block design in duplicate.

2.6. Starch Characterization

Starch obtained under the developed condition was evaluated for the physical and chemical quality based on the Indonesian National Standard for cassava starch (SNI 3451-2011) [27]. The studied parameters were pH, starch content, fineness, viscosity, and granule structure.
The measurement of pH was performed by potentiometry using a digital pH meter (ST5000-F Ohaus, Parsippany, NJ, USA). The sample of 2.5 g cassava flour was dissolved in 50 mL of distilled water and homogenized. Prior to measuring the sample solution, the pH meter was calibrated with buffer solutions of pH 4, 7, and 10).
Starch content in cassava starch was estimated according to the Nelson-Somogyi method [28] with modification. Cassava starch (2.5 g) was dissolved in 250 mL of distilled water, and a volume of 20 mL of 30% HCl was added. Subsequently, the solution was heated under reflux for 2.5 h. The heated solution was then cooled down and neutralized by adding 6 mL of 40% NaOH. The sample solution was transferred into a 500 mL volumetric flask and completed to the mark with distilled water. It was then filtered with a Whatman cellulose filter paper, and 2 mL of the filtered solution was taken and diluted in a 100 mL volumetric flask. The resulting solution (i) was later sent to a reducing sugar analysis. Cassava starch (1.0 g) was dissolved in 50 mL of distilled water, and a few drops of Pb-acetate was added until the solution was no longer cloudy. A dilution was then carried out by taking a 50 mL sample solution and adjusted to 100 mL. Following this, Na-oxalate was added with a half amount of Pb-acetate to obtain a clear solution. It was then filtered with a Whatman cellulose filter paper, and 50 mL of the filtered solution was taken and diluted in a 100 mL volumetric flask. The resulting solution (ii) was also sent to a reducing sugar analysis.
The analysis of reducing sugar was performed priory by taking 1 mL of each solution of (i) and (ii), and 1 mL of Nelson’s reagent (Nelson A:B = 25:1) was added in the test tube, then heated in boiling water for 20 min. Nelson A was prepared by dissolving 12.5 g Na2CO3, 12.5 g potassium-sodium tartrate, 10 g NaHCO3, and 100 g Na2SO4 in 500 mL distilled water; while Nelson B was prepared by dissolving 7.5 g CuSO4.5H2O in 50 mL of distilled water and a drop of H2SO4 was added. Afterward, the mixture solution was cooled to reach room temperature, and 1 mL of arsenomolybdate was added. It was then homogenized until the precipitates dissolved completely. Subsequently, 7 mL of distilled water was added into the solution and homogenized again. The absorbance of the solution was then measured by a spectrophotometer (GENESYS 10S UV-Vis, Thermo Scientific, Waltham, MA, USA) at 540 nm to determine the concentration of reducing sugars versus a standard curve prepared with glucose (0, 20, 40, 60, 80, 100 mg L−1). The calculation of the starch content was as follows:
Starch = 0.9 × ( Reducing   sugar   ( i )   Reducing   sugar   ( i i ) )      
The fineness of the cassava starch was measured as the fraction retained on a 100 mesh sieve. The viscosity of the cassava starch was measured using a viscometer (Brookfield LVDP-11+Pro, Middleboro, MA, USA). The cassava starch (5 g) was dissolved in 100 mL distilled water and then cooked in a pan filled with boiling water until the starch suspension temperature reached 60, 65, and 70 °C. Once the desired temperature was reached, the sample suspension was injected into the viscometer. The characterization of the granules was carried out by an optical microscope (Olympus BX51, Tokyo, Japan). A pinch of the sample was placed in the object-glass then added with 2 drops of congo red dye solution. The observations of starch granules were performed with magnifications of 520× and 1300×.

2.7. Data Analysis

Data analysis for the experimental design and RSM to obtain optimum conditions was performed using STATGRAPHICS Centurion XVI (Statgraphics Technologies, Inc., The Plains, VA, USA). The Analysis ToolPak from Excel Microsoft Office Professional Plus 2013 was also utilized to analyze single factor experiments. An analysis of variance (ANOVA, p = 0.05) was used to determine the significance of the variable influence. A posthoc ANOVA was performed using the least significant difference (LSD, p = 0.05) to test the significant difference among the means.

3. Results and Discussion

3.1. Evaluation of Extraction Factors on Starch Yield

Extraction factors that are likely to influence cassava starch extraction efficiency using UAE, including ultrasound power (x1, 30–90%), pulse duty-cycle (x2, 0.3–0.9 s−1), and solvent to sample ratio (x3, 10:1–30:1) were studied. With the aid of Box-Behnken design (BBD), the effect of the process variables and their interactions were determined. The BBD and the responses, expressed as the starch yield (%), are provided in Table 2.
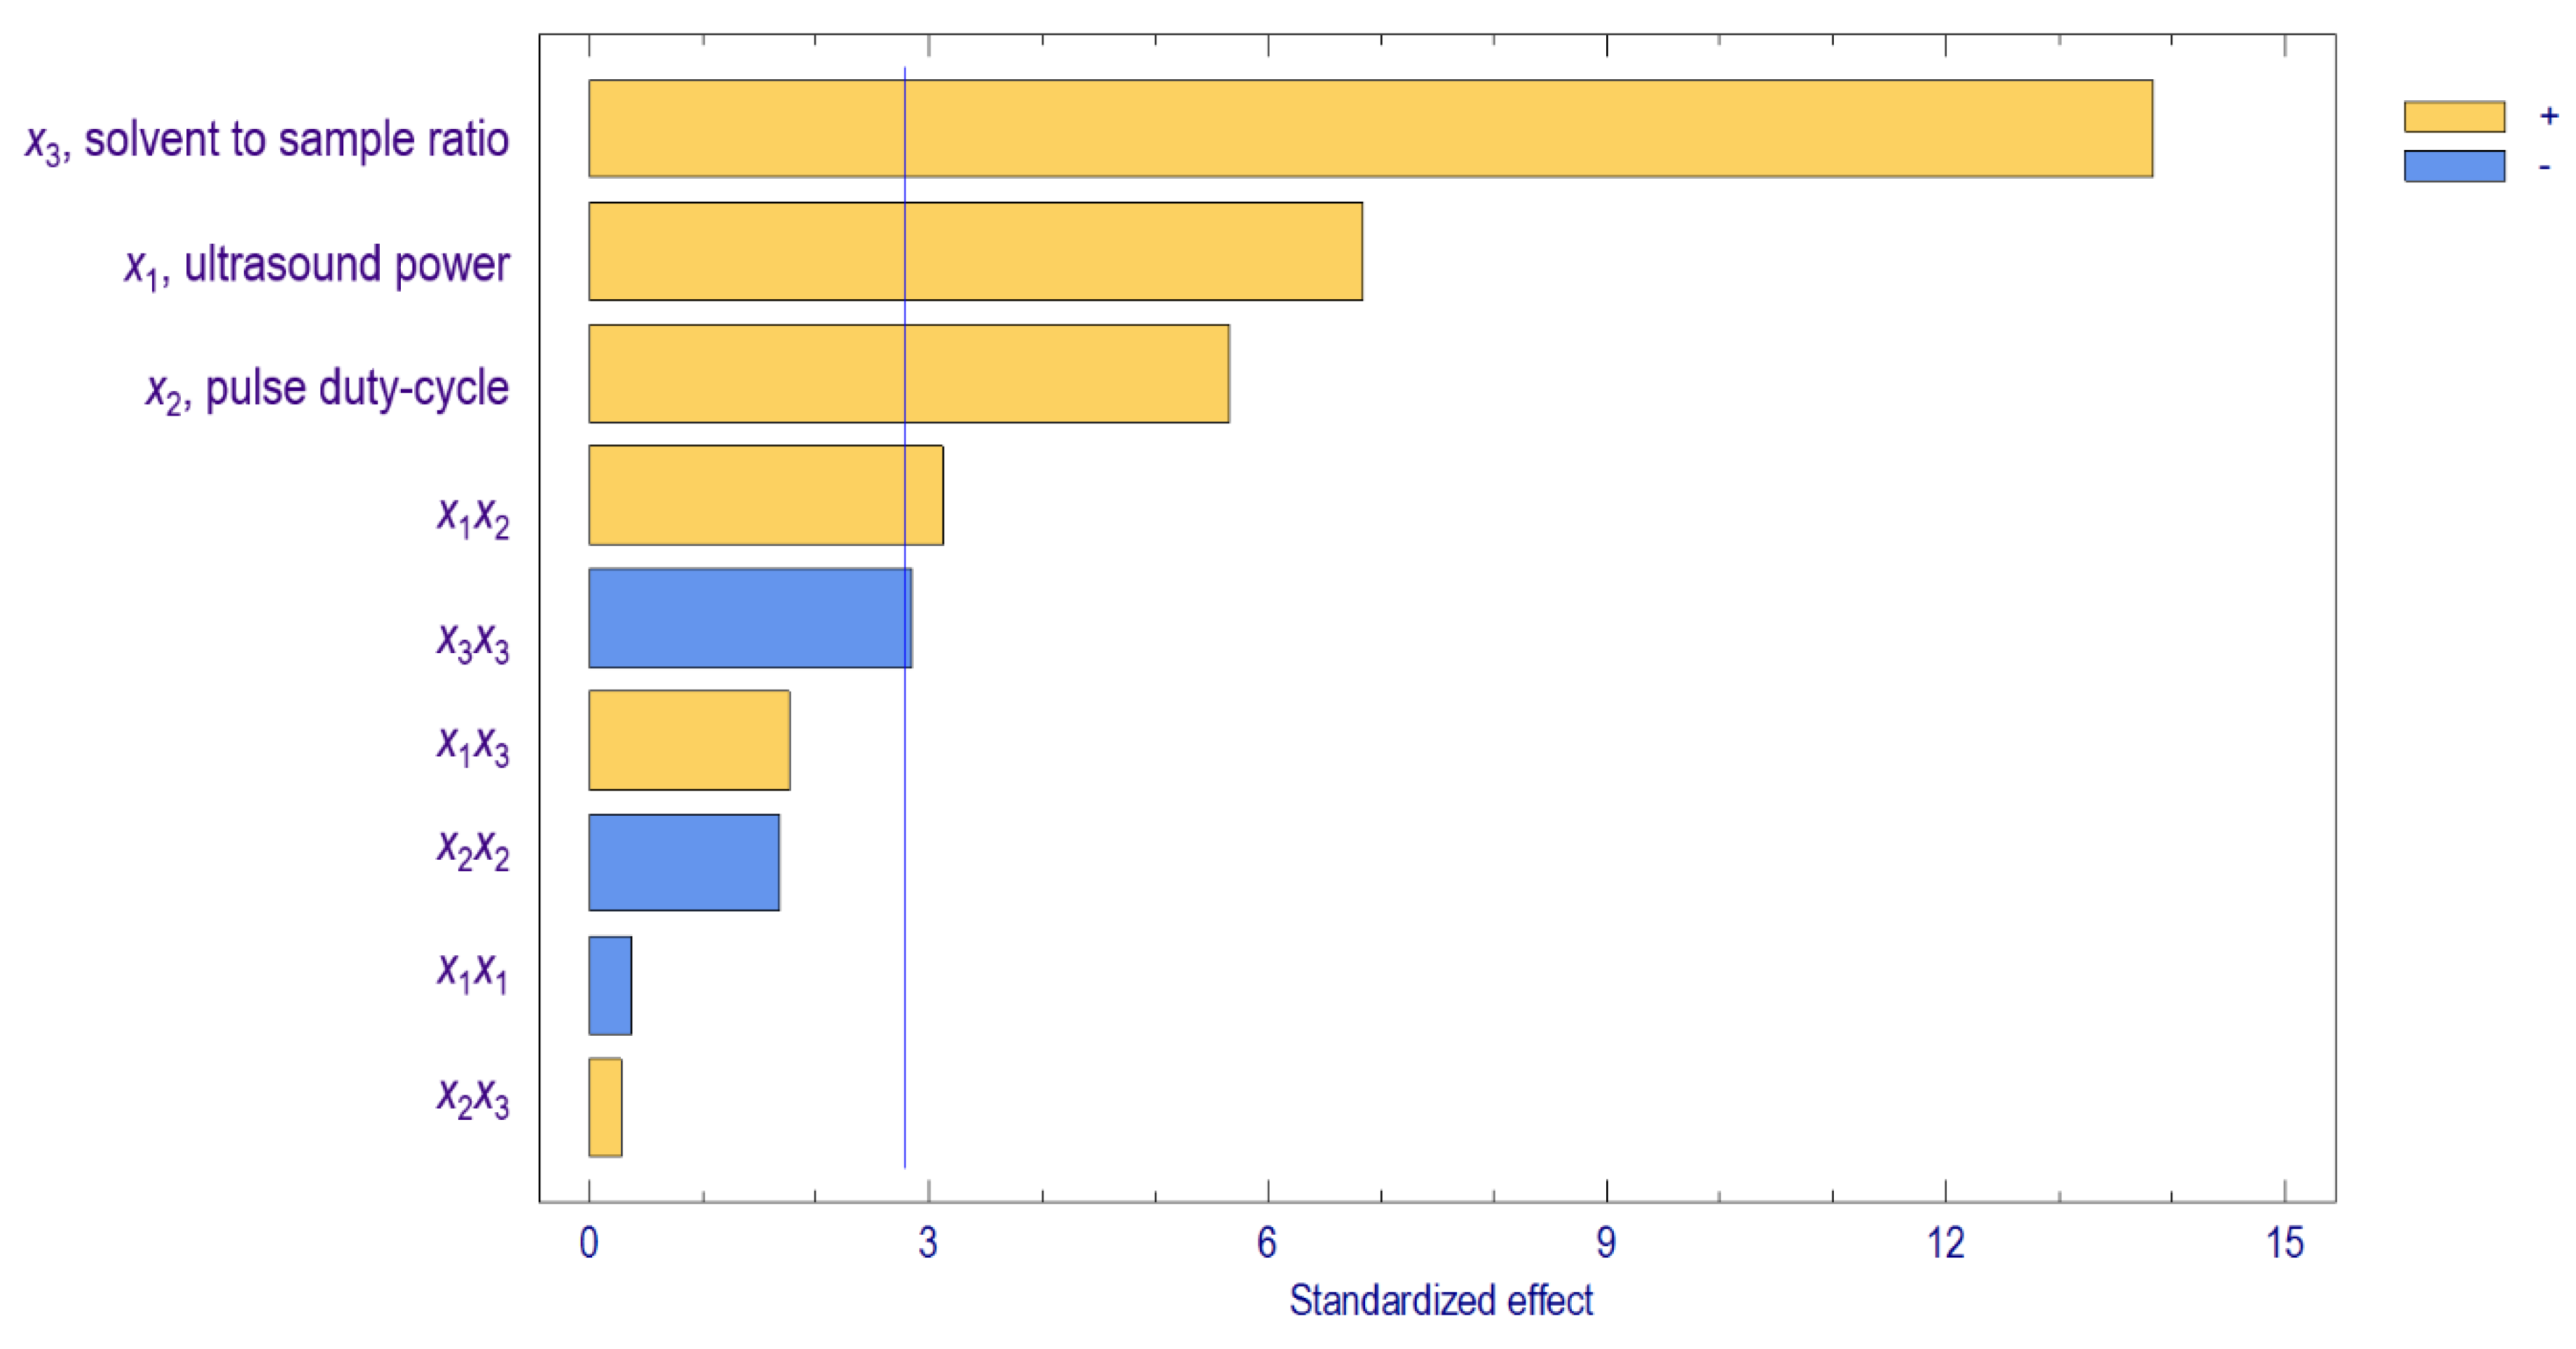
The significance of factors toward the extraction yield was calculated by ANOVA. The Pareto chart (Figure 1.) illustrates the standardized effect of the main and interaction between factors as well as the quadratic effect on the extraction yield. The bar crossing the vertical line corresponds to factors that significantly affected the cassava starch extraction using UAE (p < 0.05). All three main variables (x1, x2, and x3) were known to have a significant effect on the response, alongside one interaction factor (x1x2), and one quadratic factor (x3x3).
In regards to the Pareto chart, solvent to sample ratio showed a positive effect ( Agronomy 11 00117 i001) and had the most significant influence on the amount of the extracted starch. A former study on ultrasound-assisted alkali extractions of polysaccharides from wheat straw reported that the ratio of solvent to sample affected the extraction recovery [29]. This finding was also confirmed by another report revealing the increase of solvent to sample ratio from 10 to 40 could recover 1.5× polysaccharides from BaChu mushroom [30]. Increasing the ratio of solvent to sample will increase the amount of extracted starch. This result was in accordance with the mass transfer principle, where a greater ratio between the solid material and the solvent causes a higher concentration gradient, which is the driving force in solvent extraction [31]. A higher concentration gradient leads to a greater amount of starch extracted from cassava flour that diffuses into the solvent more effectively, thus promoting a higher starch yield. In contrast, the quadratic effect of solvent to sample ratio negatively influenced ( Agronomy 11 00117 i002) the starch yield. This occurrence indicated that some restriction was applied when increasing the solvent to sample ratio to a certain point to reach a higher starch yield. A higher ratio than the optimum solvent to sample ratio will not significantly enhance the extraction yield because the starch has been completely recovered from cassava flour. Additionally, the use of excessive solvent also caused the waste of solvent.
Ultrasound power, pulse duty-cycle, and the interaction between these two factors demonstrated a positive effect, which increased the value of these factors that result in a higher amount of extracted cassava starch. Ultrasound power is a variable that affects the occurrence of cavitation. The application of a greater power accelerated the ultrasonic wave propagation process in the medium [23,32]. Chemat et al. [10] explained that when cavitation bubbles are generated close to the cell surfaces in plants, these bubbles will burst and destroy the plant cell walls during the compression period, thereby releasing the cell contents into the medium.

3.2. The Prediction Capability of the Predicted Model

Based on the ANOVA, a quadratic polynomial regression model was generated using variables having significant influence in the extraction efficiency in order to avoid high variability values. The equation for the fitted model was:
y = 31.4867   +   3.6062 x 1   +   3.00375 x 2   +   7.34438 x 3   +   2.35 x 1 x 2     2.23 x 3 x 3
where y is the starch yield (%) and xi (x1, ultrasound power; x2, pulse duty-cycle; x3, solvent to sample ratio).
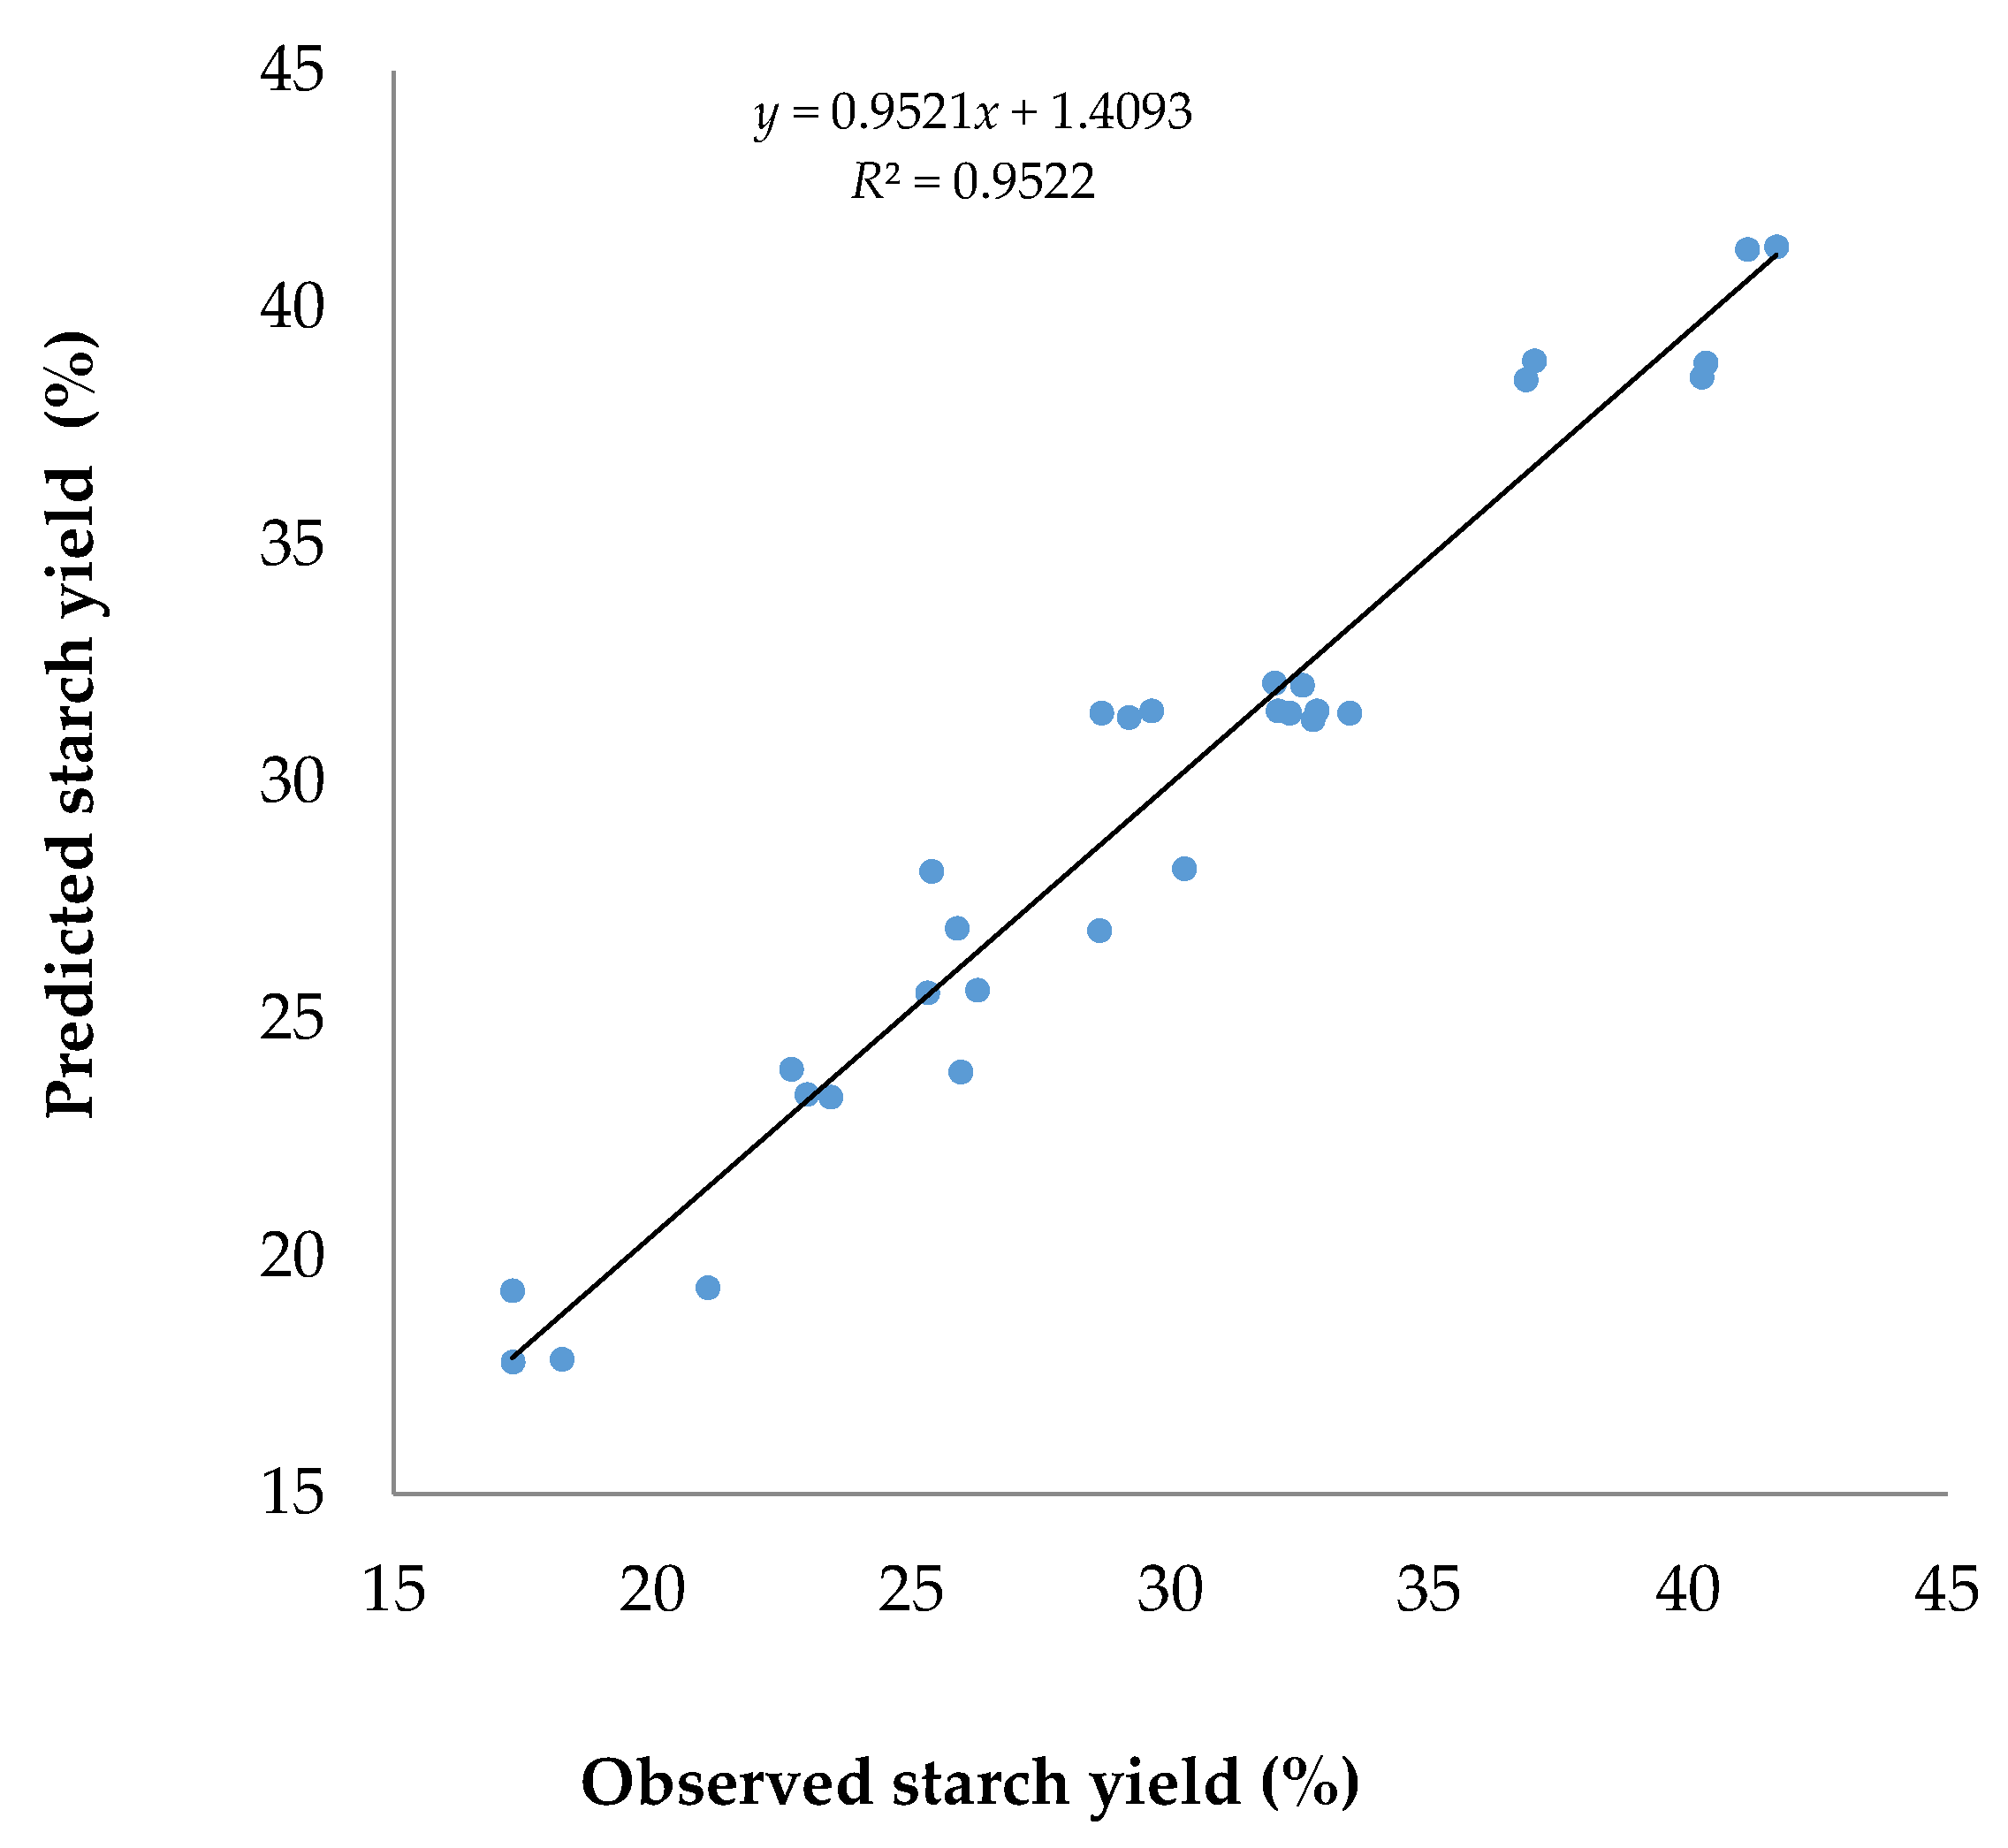
A lack-of-fit test was carried out to determine whether the selected model was adequate in describing the observed data or a more complex model was necessitated. The results displayed that the p-value for lack-of-fit (0.7181) was higher than 0.05; hence the model was satisfactory in explaining the observed data at a 95% confidence level. A comparison between the experimental and the predicted values, as shown in Figure 2, indicated a very good agreement proved by the coefficient of determination (R2) at 0.95. Therefore, the model could be used to estimate the response for the optimization.

3.3. Optimization of Extraction Conditions

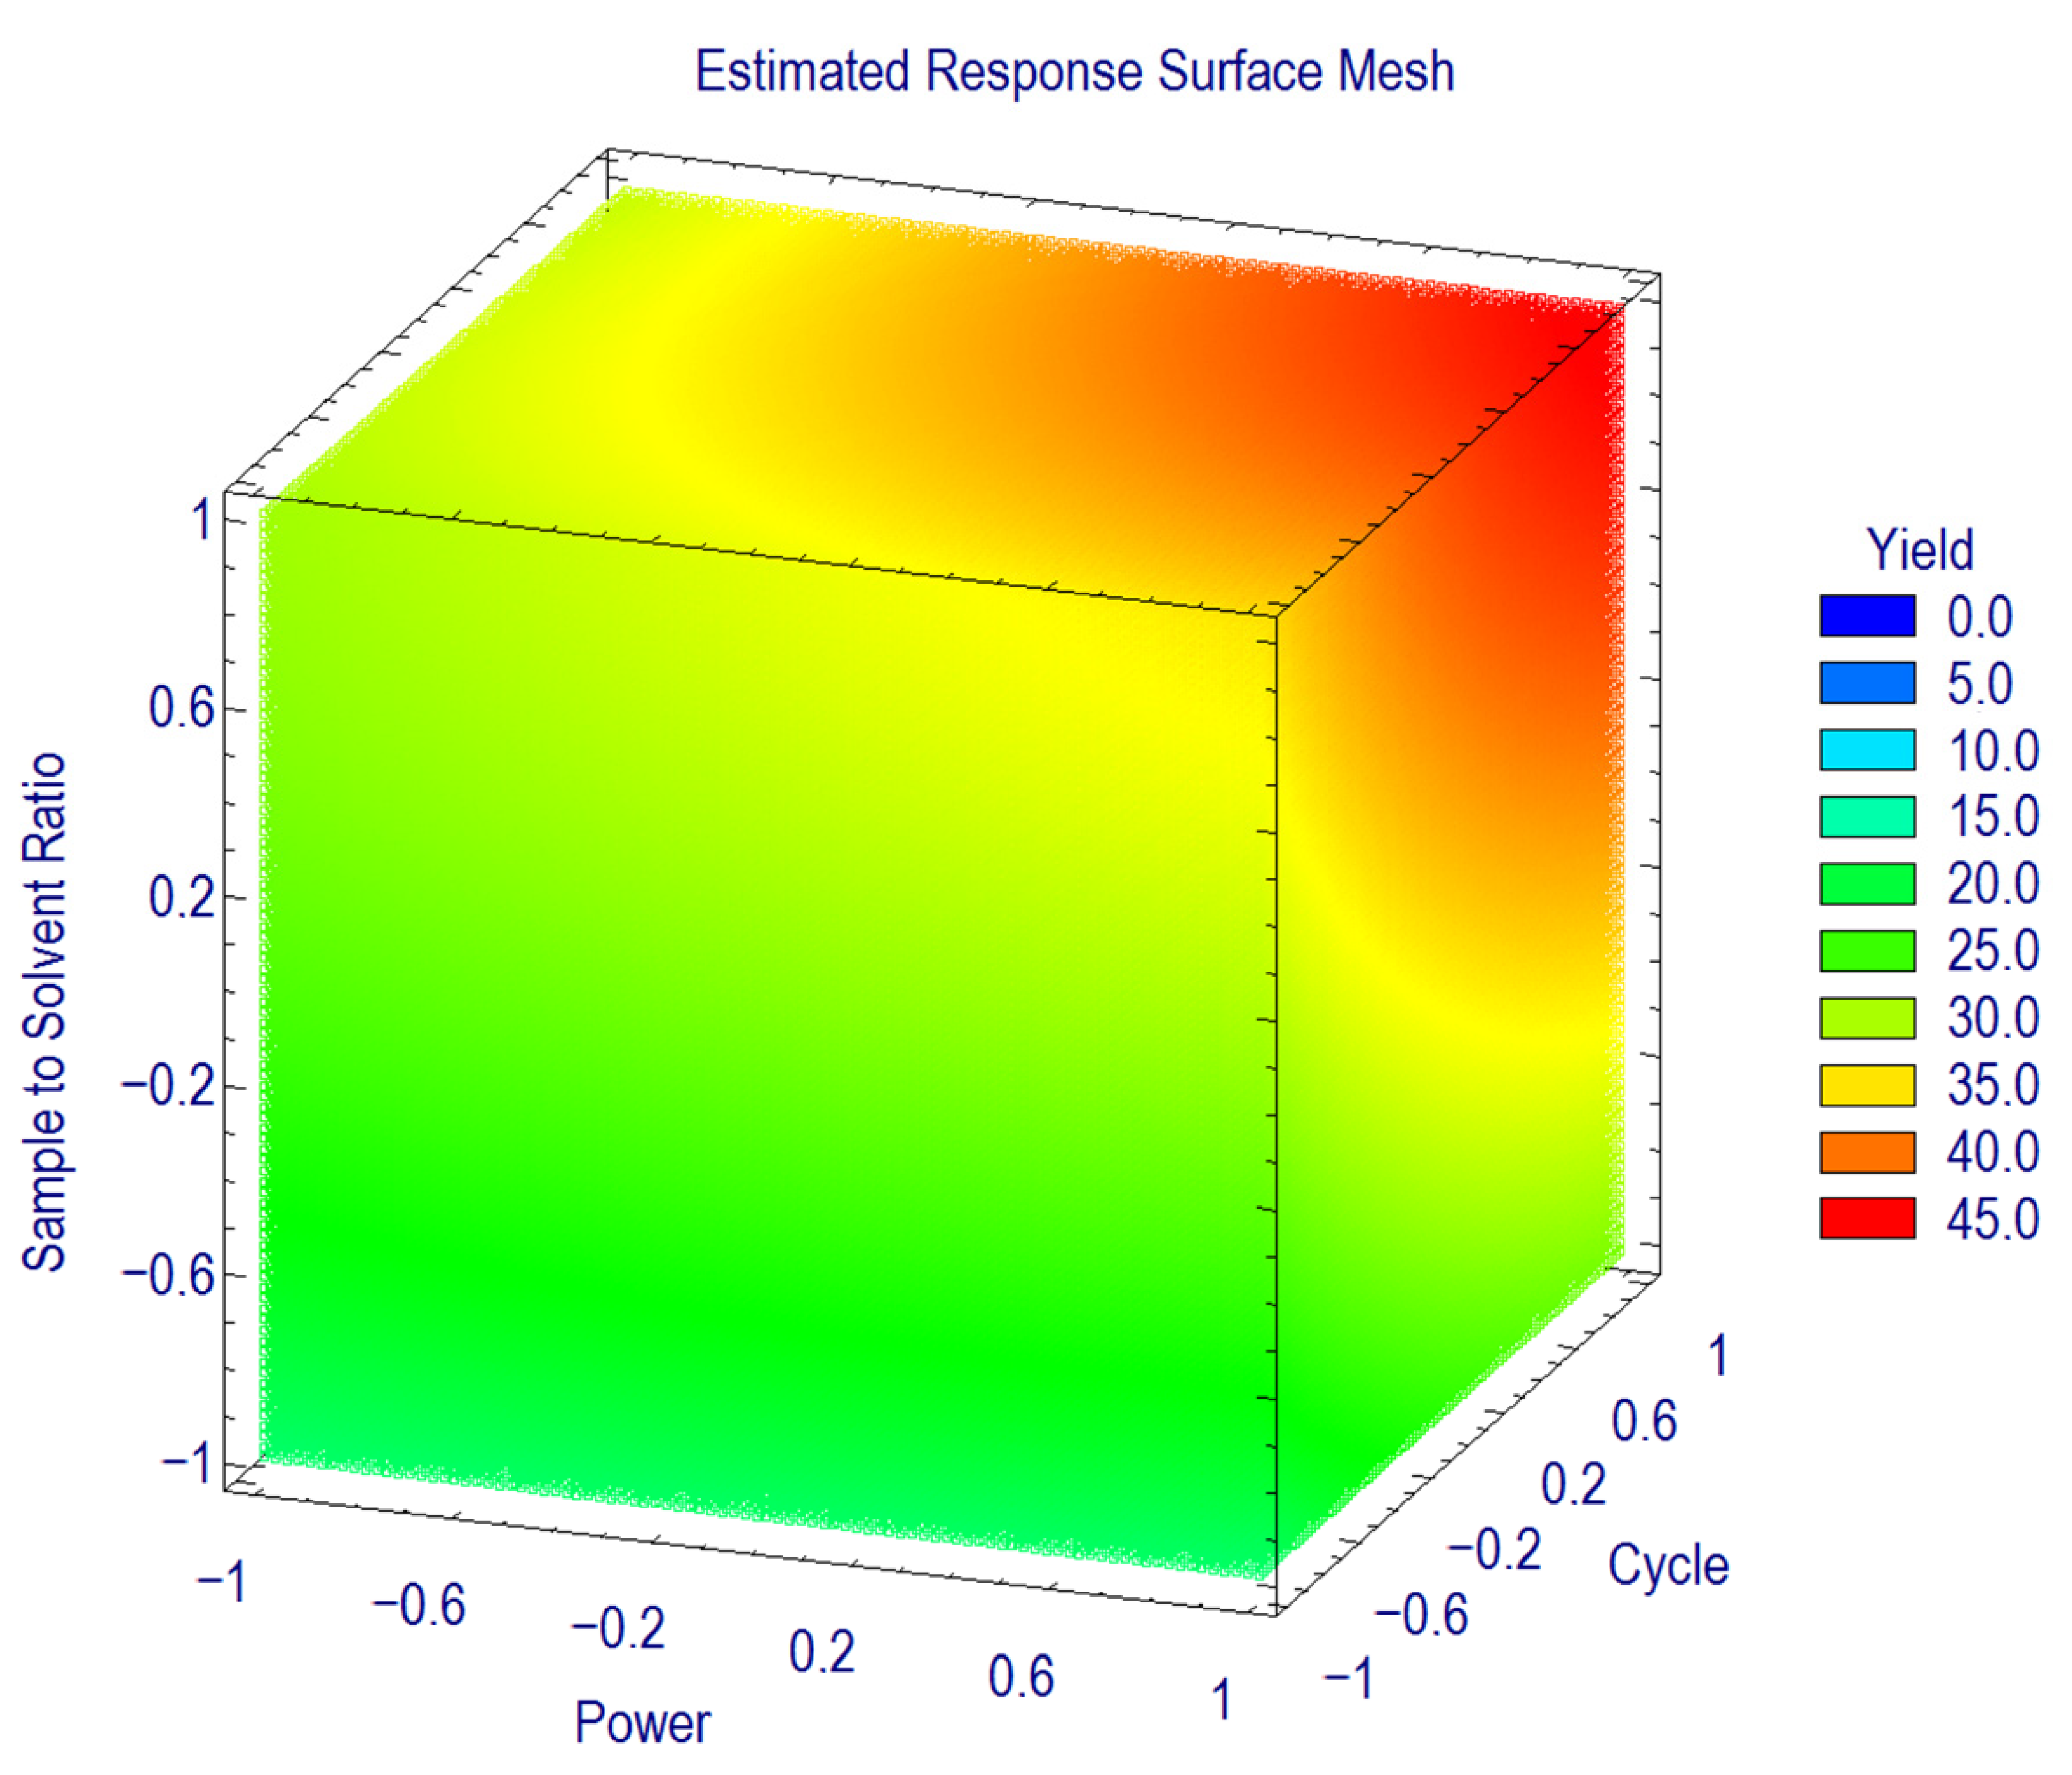
On the basis of the obtained model, a three-dimensional mesh plot was constructed to predict the relationship between the independent and dependent variables. Using response surface methodology (RSM), predictive plotting of the optimum condition based on the extraction yield was carried out by varying the extraction factors. Figure 3 depicts the relationships between the response value (y, response) and the independent variables (x1, ultrasound power; x2, pulse duty-cycle; x3, solvent to sample ratio). As can be observed, a high point was found at which the optimum extraction yield was obtained at coordinate +1 for both ultrasound power and pulse duty-cycle while +0.987224 for the ratio sample to solvent. Based on RSM, extraction of cassava starch using UAE can be done optimally by applying the following conditions, ultrasound power of 90%, pulse duty-cycle of 0.9 s−1, and 30:1 for the solvent to sample ratio. However, the proposed optimum condition for ultrasound power and pulse duty-cycle were located at the maximum studied level (+1). It was indicating that there was a possibility for better extraction conditions outside the studied level. Therefore, it was necessary to conduct further optimization for ultrasound power and pulse duty-cycle to ascertain the optimum point in the extraction process.

3.4. Further Optimization

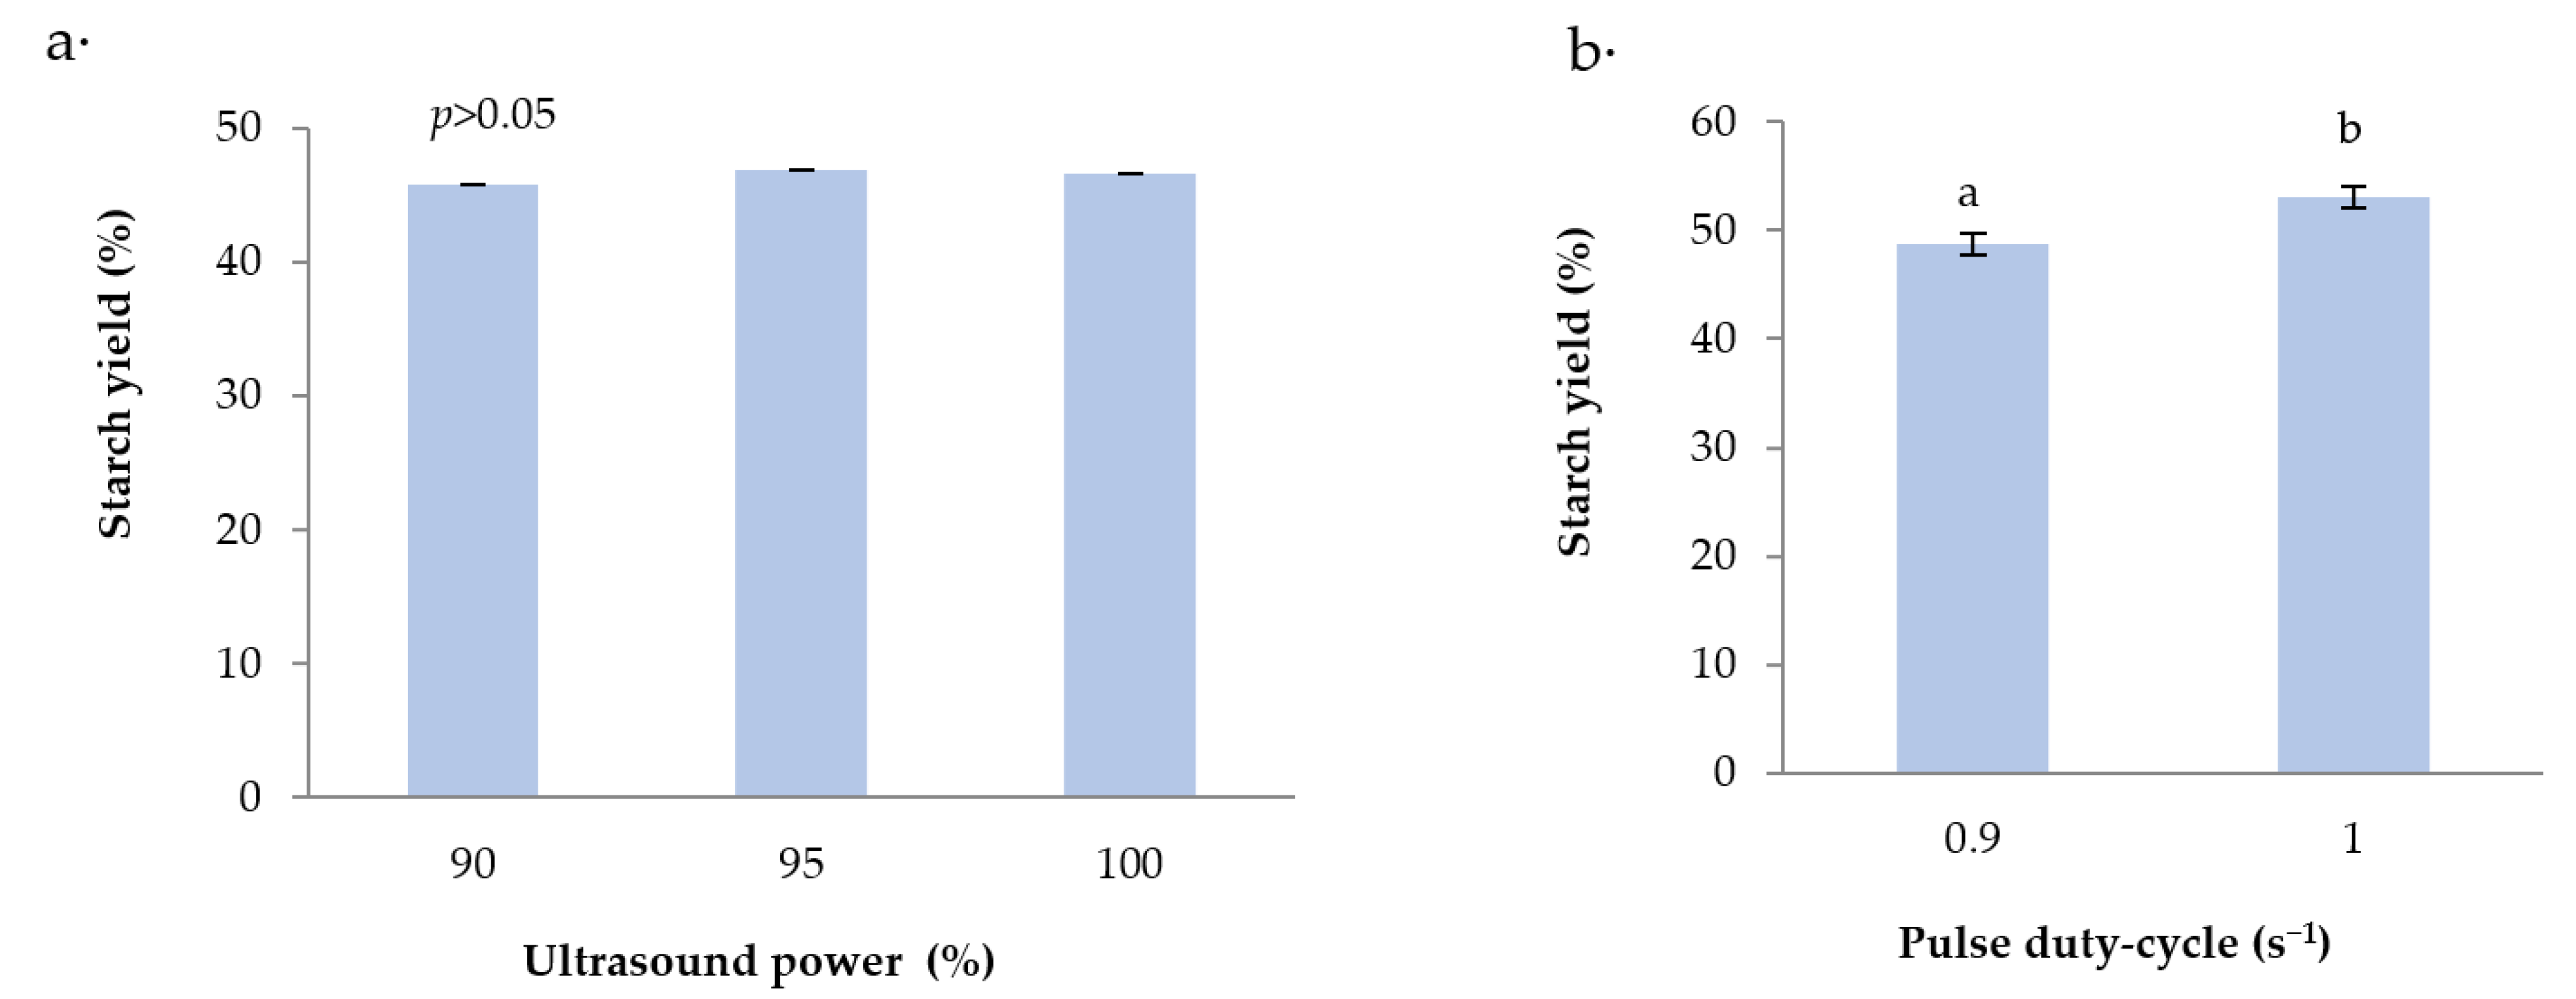
Proceeded optimization was carried out because the optimized condition was located in the corner coordinate (+1.0, +0.987224, +1.0) of the design domain. It was studied that ultrasound power and pulse duty-cycle hold a significant effect (p < 0.05) on the extraction process efficiency. The further optimization was carried out by comparing the starch produced at a higher level to the one evaluated by BBD (ultrasound power: 90, 95, and 100%; pulse duty-cycle: 0.9, 1.0 s−1). The result demonstrated no significant difference (p > 0.05) between the starch yield produced with different ultrasound power (Figure 4a). On the other hand, increasing the pulse duty-cycle to its maximum capacity significantly (p < 0.05) increased the starch yield (Figure 4b). Therefore, the selection extraction condition for the ultrasound power and pulse duty-cycle were 90% and 1 s−1, respectively.

3.5. Kinetics Study

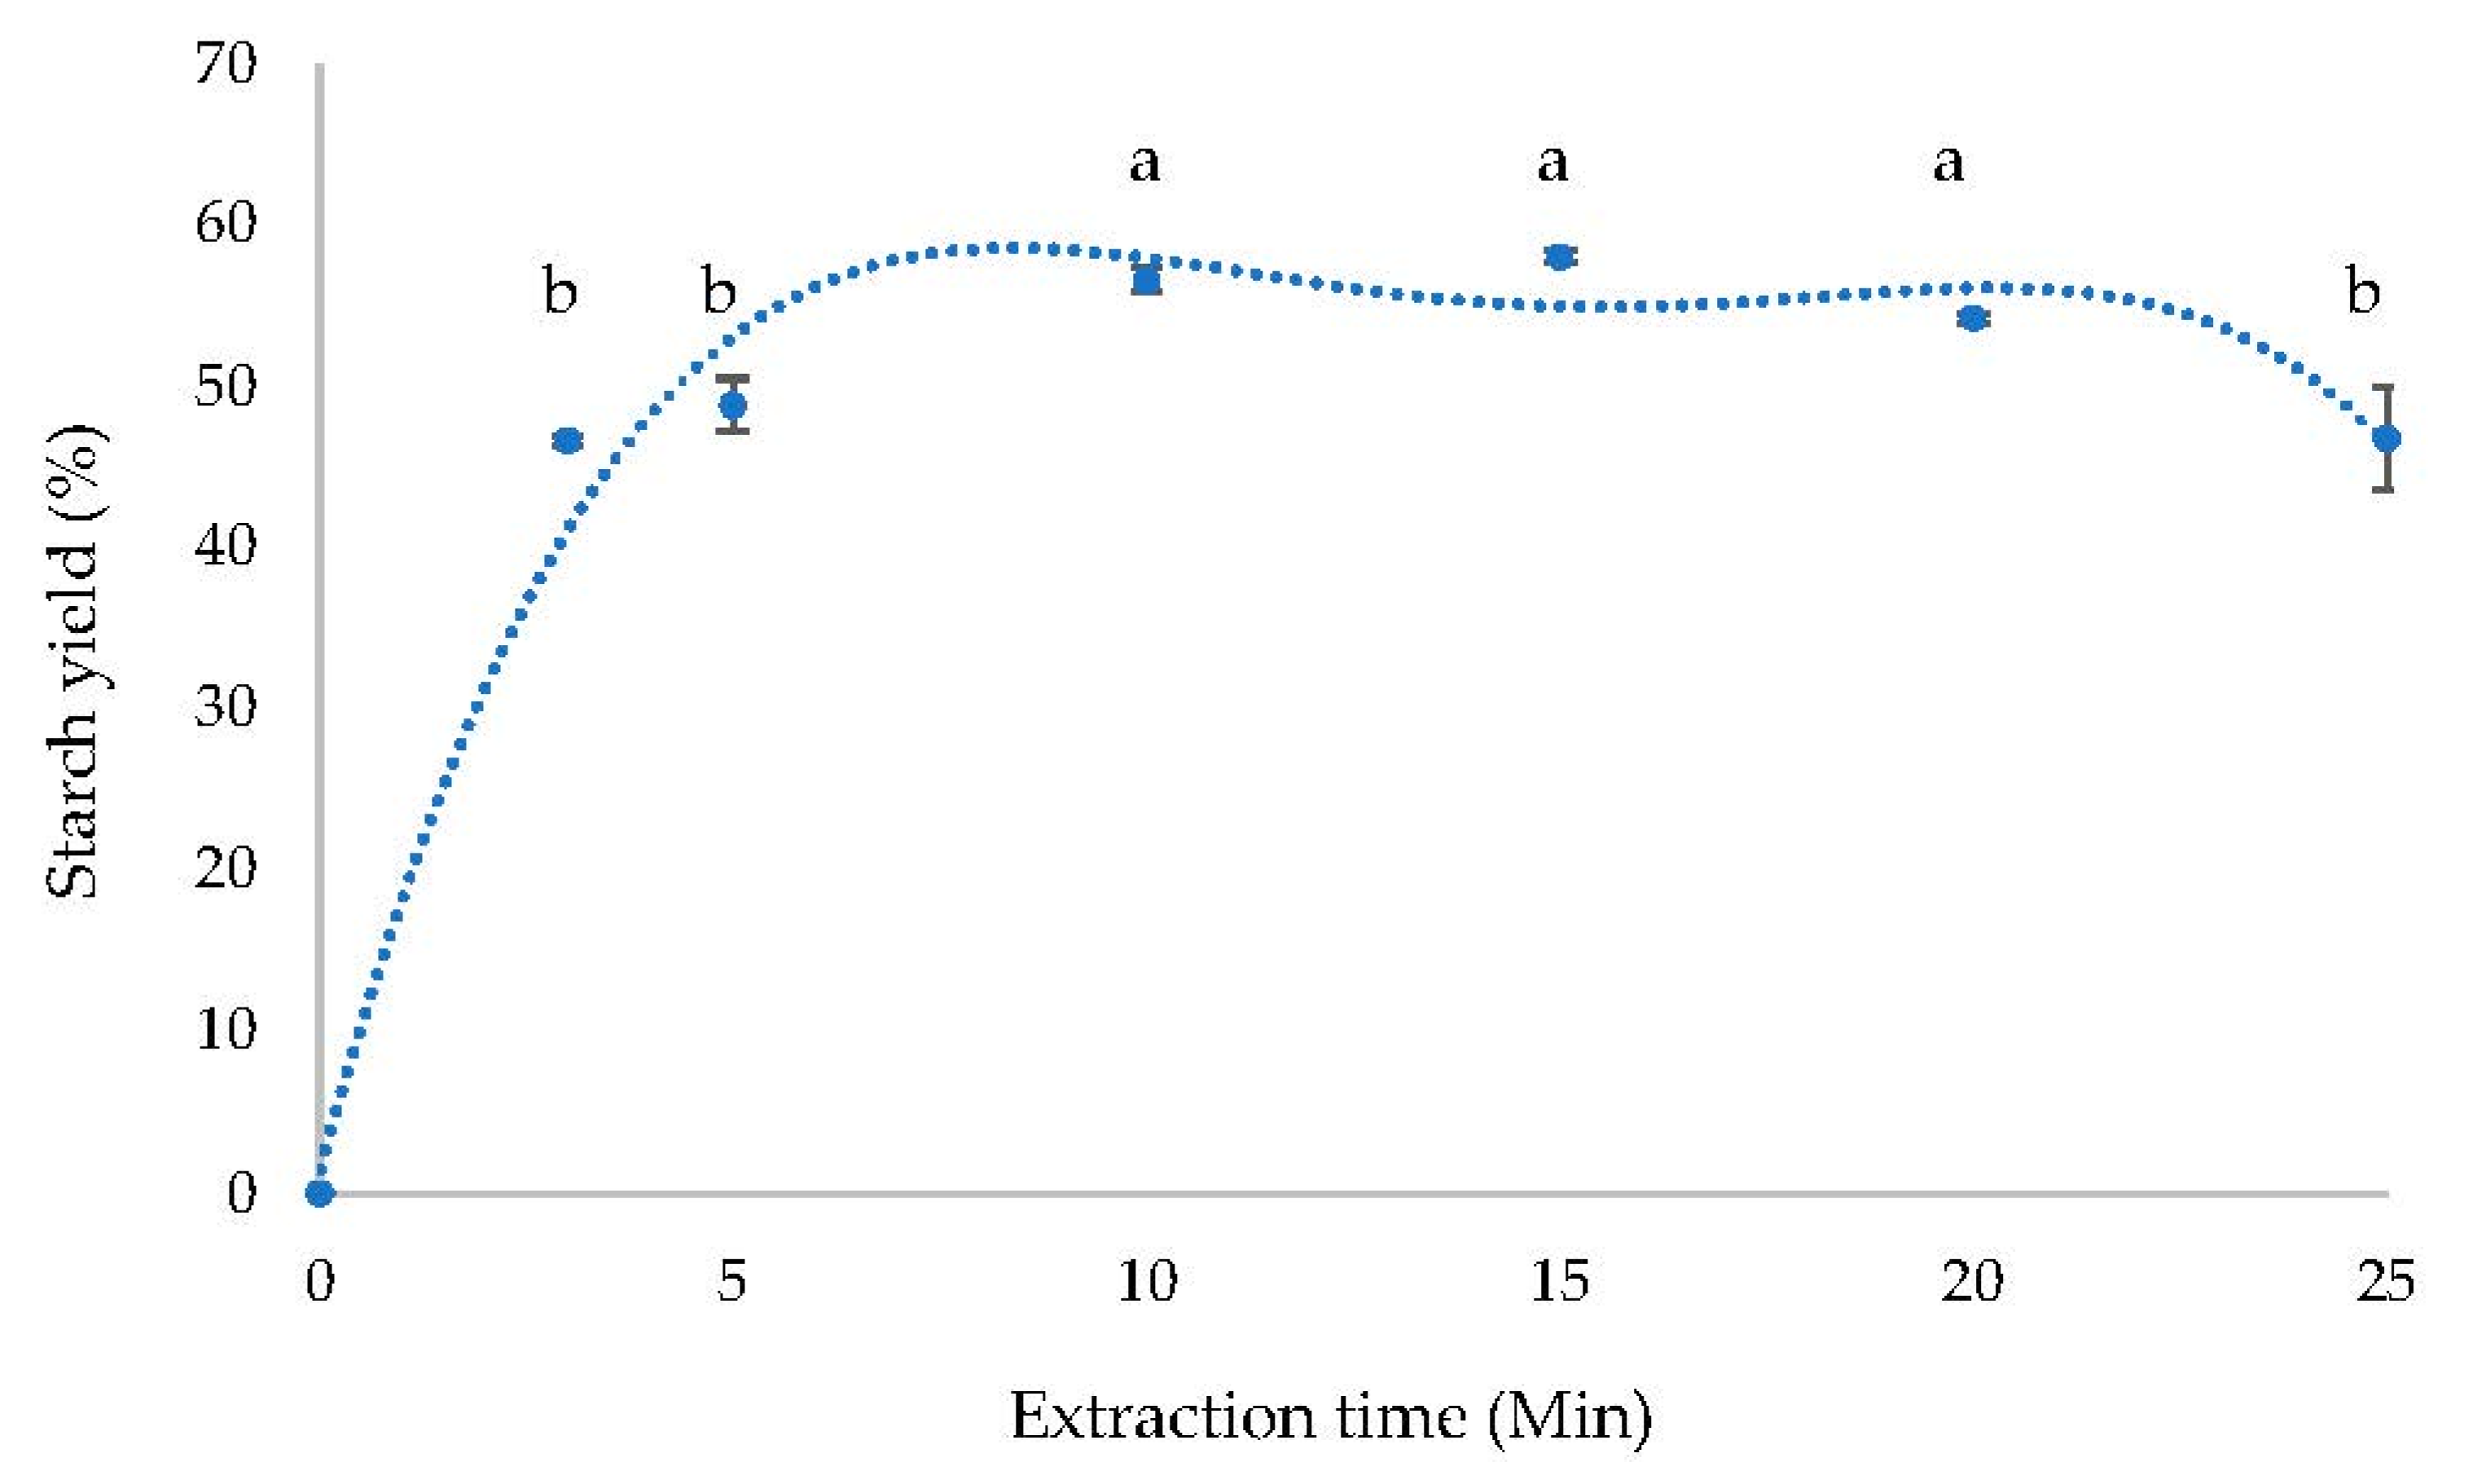
The assessment for the extraction rate was carried out using predetermined optimum conditions (ultrasound power 90%; pulse duty-cycle 1.0 s−1; and solvent to sample ratio 30:1) at ambient temperature. The starch yield (%) was measured after varying the extraction time from 3 to 25 min. As shown in Figure 5, running different extraction times caused a significant change in the yield of the extracted starch. A significant increase in extraction yield was observed until a plateau was reached at 10 min extraction time, before decreasing in 25 min. A rise of temperature that was triggered by the cavitation throughout the extraction time could most likely endorse the decline of the yield. The increase in temperature caused changes in medium characteristics, therefore inhibiting ultrasonic wave propagation and reducing the number of cavitation bubbles [11,16]. The 10 min extraction time achieved the highest extraction yield (56.57%) with high precision (RSD 0.75). Consequently, it was concluded that the optimum extraction time was 10 min.

3.6. Ultrasound-Produced Starch Characterization

3.6.1. pH

The pH test was used to determine the acidity level of the produced starch. pH is one of the important parameters for starch, as it influences the gelation process during the product application. The pH of the ultrasound-produced cassava starch was 4.33 ± 0.01, while the commercial starch presented a pH of 5.01 ± 0.03. The result was in accordance with a study by Rahman [33], that the pH of commercial cassava starch ranges between 4.12 and 6.52.

3.6.2. Starch Content

The starch content for the ultrasound-produced starch (88.36%) optimized in this study presented a higher purity of starch than the commercial sample (84.85%). The resulting amount was satisfactory to meet the requirement regulated by the Indonesian National Standard for cassava starch (SNI-3451-2011) [27], where it has to be at least 75%. Hence, the ultrasound-produced starch has fulfilled the minimum limit and is therefore superior to the other product on the market.

3.6.3. Viscosity

Starch viscosity is related to the swelling power and solubility parameters. The starch granules expand when they are heated in water. The heating process weakens and eventually breaks the hydrogen bonds between the starch molecules in the amorphous area, resulting in the hydration of starch granules. Consecutively, the granule will keep expanding and increase the viscosity to its maximum hydration volume [34].
The result showed a significant difference (p < 0.05) between ultrasound-produced starch and commercial samples, as presented in Table 3. The presence of cavitation caused a significantly lower viscosity of ultrasound-produced starch compared to the commercial sample. These results are in line with research by Iida et al. [35], which stated that sonication reduced the starch viscosity in several samples, including potato, tapioca, and sweet potato. The low viscosity characteristic is known to be advantageous in the application process because it stablizes during high-temperature heating [35,36]. Naturally, starch viscosity increases with continuous high-temperature heating treatment. However, this trait is undesirable in some applications, such as in spray drying, which is highly encumbered by the paste formed during the heating process. As reported by Zisu et al. [37], ultrasound treatment could maintain the viscosity at a low value.

3.6.4. Optical Characteristics

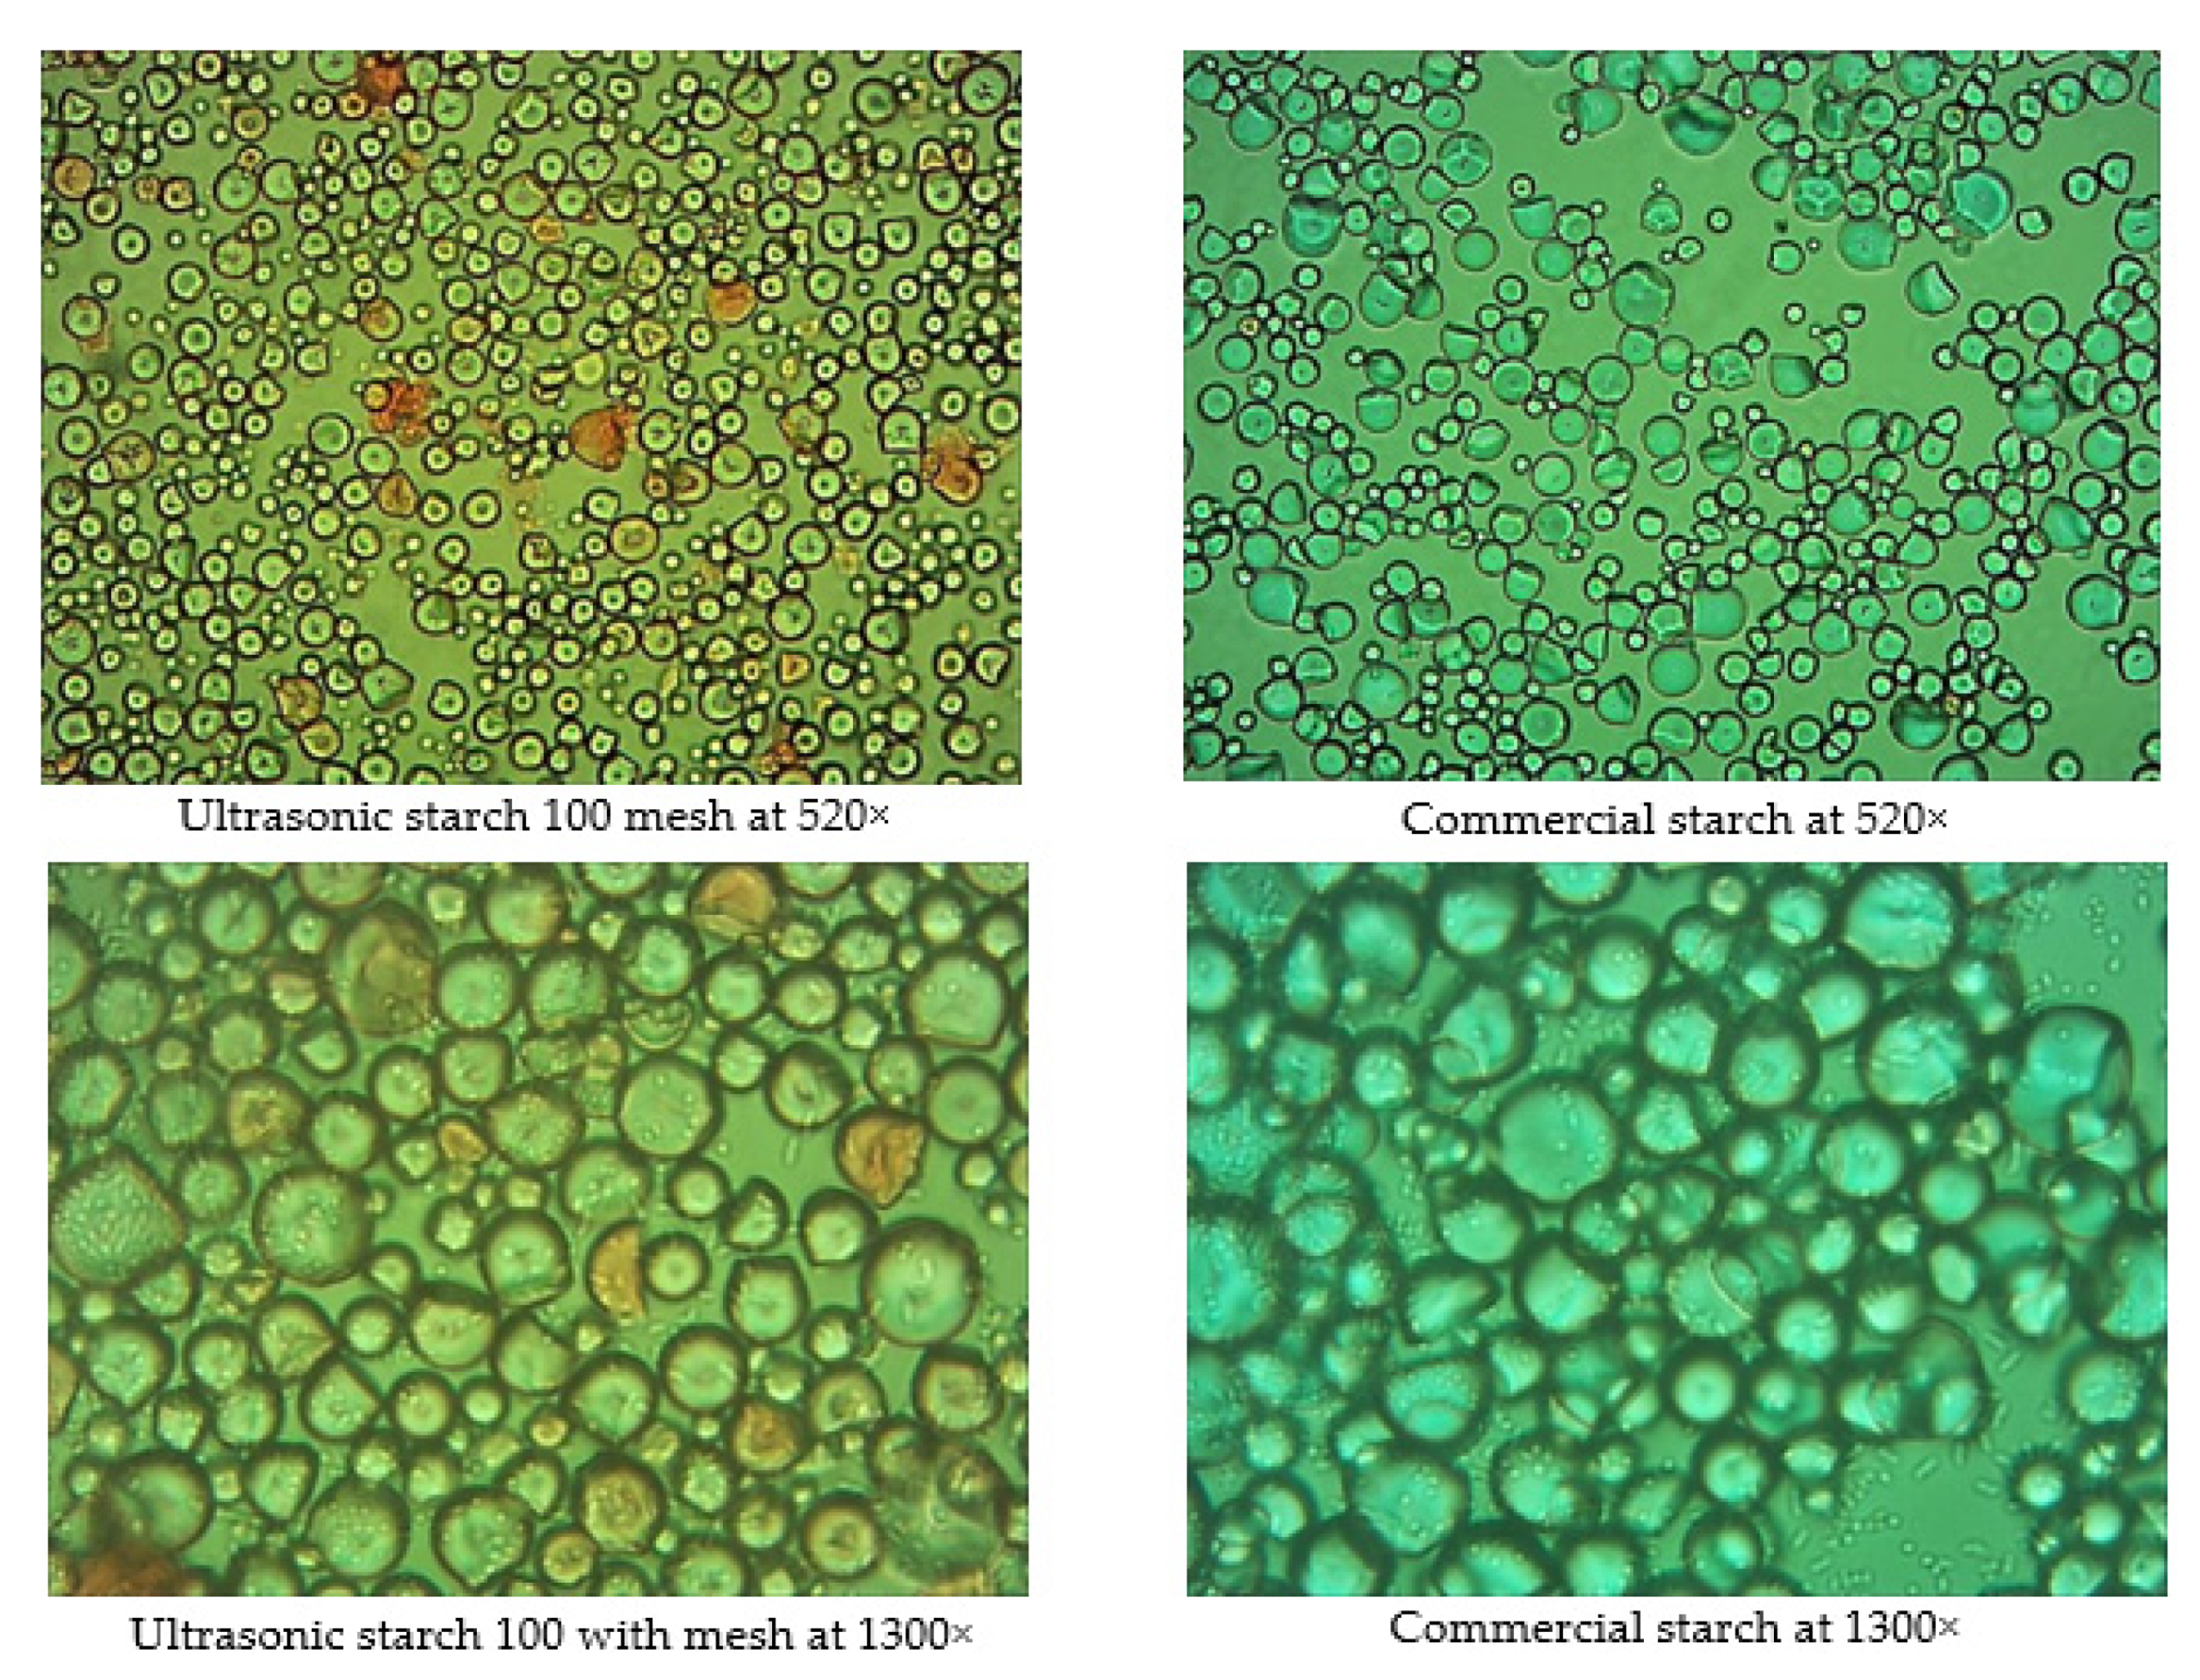
Microscopic observation of starch granules demonstrated no noticeable difference in the shape between the ultrasound-produced starch and the commercial starch (Figure 6.) However, it was clear that ultrasound significantly reduced granule size and damage to the granule. Cavitation force in the medium surrounding the granule was recognized as the cause of the granule size reduction. The sudden collapse of cavitation bubbles shocks and cause ruptures in the starch granules. Studies of different starches treated with ultrasound by other researchers reported the same result [38,39,40]. The rupture that occurs in the starch granules was proven to be beneficial in the starch modification process. The penetration of chemical agents, catalysts, and enzymes was enhanced in the presence of either pores, cracks, or holes due to starch modification [41,42].

4. Conclusions

An optimum extraction condition of cassava starch using ultrasound-assisted extraction (UAE) was studied. It was observed that the three main variables (ultrasound power, pulse duty-cycle, and solvent to sample ratio) demonstrated a significant effect on the extraction process. To obtain an optimal starch yield, the following extraction conditions were required: ultrasound power 90%, pulse duty-cycle 1.0 s−1, and solvent to sample ratio 30:1. The kinetics study showed that 10 min extraction resulted in the highest yield (56.57%). The physical-chemical characteristics were evaluated, disclosing the ultrasound-produced starch purity of 88.36%, pH 4.33, and lower viscosity than the commercial sample. UAE produced smaller and partially damaged granules of the resulting starch compared to the commercial sample. Hence, apart from speeding up the extraction process, UAE was also advantageous in the starch modification favorable to the product applications, which undergo a high-temperature treatment. The reported results would benefit scale-up research on the applications of UAE in food industries to extract starch from cassava flour as well as further research on starch modification by UAE.

Author Contributions

Conceptualization, W.S. and M.N.C.; methodology, W.S. and K.; validation, M.N.C.; investigation, K.; writing—original draft preparation, W.S. and R.N.F.; writing—review and editing, W.S. and M.N.C.; visualization, R.N.F.; supervision, W.S. and R.N.F.; funding acquisition, W.S. All authors have read and agreed to the published version of the manuscript.

Funding

The APC was funded by Universitas Gadjah Mada through Final Project Recognition Program (Rekognisi Tugas Akhir, RTA) 2020 with assignment number 2488/UN1.P.III/DIT-LIT/PT/2020.

Acknowledgments

This report forms part of the research activity carried out by Karmila at Laboratory of Chemistry and Biochemistry facilitated by the Department of Food and Agricultural Product Technology.

Conflicts of Interest

The authors declare no conflict of interest.

References

  1. Wheatley, C.C.; Chuzel, G.; Zakhia, N. CASSAVA | Uses as a Raw Material. In Encyclopedia of Food Sciences and Nutrition; Elsevier: Amsterdam, The Netherlands, 2003; pp. 969–974. [Google Scholar]
  2. Chisenga, S.M.; Workneh, T.S.; Bultosa, G.; Alimi, B.A. Progress in research and applications of cassava flour and starch: A review. J. Food Sci. Technol. 2019, 56, 2799–2813. [Google Scholar] [CrossRef] [PubMed]
  3. Mtunguja, M.K.; Laswai, H.S.; Kanju, E.; Ndunguru, J.; Muzanila, Y.C. Effect of genotype and genotype by environment interaction on total cyanide content, fresh root, and starch yield in farmer-preferred cassava landraces in Tanzania. Food Sci. Nutr. 2016, 4, 791–801. [Google Scholar] [CrossRef] [PubMed]
  4. Breuninger, W.F.; Piyachomkwan, K.; Sriroth, K. Tapioca/Cassava Starch. In Starch; Elsevier: Amsterdam, The Netherlands, 2009; pp. 541–568. [Google Scholar]
  5. Eckhoff, S.R.; Watson, S.A. Corn and Sorghum Starches: Production, 3rd ed.; Elsevier Inc.: Amsterdam, The Netherlands, 2009; ISBN 9780127462752. [Google Scholar]
  6. Johnson, R.; Moorthy, S.N.; Padmaja, G. Production of high fructose syrup from cassava and sweet potato flours and their blends with cereal flours. Food Sci. Technol. Int. 2010, 16, 251–258. [Google Scholar] [CrossRef] [PubMed]
  7. Nand, A.V.; Charan, R.P.; Rohindra, D.; Khurma, J.R. Isolation and properties of starch from some local cultivars of cassava and taro in Fiji. South Pacific J. Nat. Appl. Sci. 2008, 26, 45. [Google Scholar] [CrossRef] [Green Version]
  8. Mweta, D.E.; Labuschagne, M.T.; Koen, E.; Benesi, I.R.M.; John, D.; Saka, K. Some properties of starches from cocoyam (Colocasia esculenta) and cassava (Manihot esculenta Crantz.) grown in Malawi. African J. Food Sci. 2008, 2, 102–111. [Google Scholar]
  9. Vanier, N.L.; El Halal, S.L.M.; Dias, A.R.G.; Da Rosa Zavareze, E. Molecular structure, functionality and applications of oxidized starches: A review. Food Chem. 2017, 221, 1546–1559. [Google Scholar] [CrossRef]
  10. Chemat, F.; Huma, Z.; Khan, M.K. Applications of ultrasound in food technology: Processing, preservation and extraction. Ultrason. Sonochem. 2011, 18, 813–835. [Google Scholar] [CrossRef]
  11. Chemat, F.; Rombaut, N.; Sicaire, A.G.; Meullemiestre, A.; Fabiano-Tixier, A.S.; Abert-Vian, M. Ultrasound assisted extraction of food and natural products. Mechanisms, techniques, combinations, protocols and applications. A review. Ultrason. Sonochem. 2017, 34, 540–560. [Google Scholar] [CrossRef]
  12. Zhang, Q.-W.; Lin, L.-G.; Ye, W.-C. Techniques for extraction and isolation of natural products: A comprehensive review. Chin. Med. 2018, 13, 20. [Google Scholar] [CrossRef] [Green Version]
  13. Rahman, S.M.M.; Rakshit, S.K. Effect of Endogenous and Commercial Enzyme on Improving Extraction of Sweet Potato Starch. In Proceedings of the 2004 ASAE Annual Meeting, Ottawa, Canada, 1–4 August 2004. [Google Scholar]
  14. Azmir, J.; Zaidul, I.S.M.; Rahman, M.M.; Sharif, K.M.; Mohamed, A.; Sahena, F.; Jahurul, M.H.A.; Ghafoor, K.; Norulaini, N.A.N.; Omar, A.K.M. Techniques for extraction of bioactive compounds from plant materials: A review. J. Food Eng. 2013, 117, 426–436. [Google Scholar] [CrossRef]
  15. Bernardo, C.O.; Ascheri, J.L.R.; Chávez, D.W.H.; Carvalho, C.W.P. Ultrasound Assisted Extraction of Yam (Dioscorea bulbífera) Starch: Effect on Morphology and Functional Properties. Starch Stärke 2018, 70, 1700185. [Google Scholar] [CrossRef]
  16. González-Lemus, L.B.; Calderón-Domínguez, G.; Salgado-Cruz, M.d.l.P.; Díaz-Ramírez, M.; Ramírez-Miranda, M.; Chanona-Pérez, J.J.; Gϋemes-Vera, N.; Farrera-Rebollo, R.R. Ultrasound-assisted extraction of starch from frozen jicama (P. erosus) roots: Effect on yield, structural characteristics and thermal properties. CyTA J. Food 2018, 16, 738–746. [Google Scholar] [CrossRef] [Green Version]
  17. Sit, N.; Misra, S.; Deka, S.C. Yield and Functional Properties of Taro Starch as Affected by Ultrasound. Food Bioprocess Technol. 2014, 7, 1950–1958. [Google Scholar] [CrossRef]
  18. Jambrak, A.R.; Herceg, Z.; Šubarić, D.; Babić, J.; Brnčić, M.; Brnčić, S.R.; Bosiljkov, T.; Čvek, D.; Tripalo, B.; Gelo, J. Ultrasound effect on physical properties of corn starch. Carbohydr. Polym. 2010, 79, 91–100. [Google Scholar] [CrossRef]
  19. Bendicho, C.; Lavilla, I. Ultrasound-Assisted Metal Extractions; Elsevier Inc.: Amsterdam, The Netherlands, 2013; ISBN 9780124095472. [Google Scholar]
  20. Setyaningsih, W.; Saputro, I.E.; Palma, M.; Barroso, C.G. Optimization of the ultrasound-assisted extraction of tryptophan and its derivatives from rice (Oryza sativa) grains through a response surface methodology. J. Cereal Sci. 2017, 75, 192–197. [Google Scholar] [CrossRef]
  21. Krishnakumar, T.; Rawson, A. Optimization of Ultrasound-Assisted Extraction (UAE) of Starch from Cassava (Manihot esculenta Grantz) Using Response Surface Methodology (RSM); ICAT-CTCRI: Tamil Nadu, India, 2016. [Google Scholar]
  22. Mandal, S.C.; Mandal, V.; Das, A.K. Classification of Extraction Methods, in: Essentials of Botanical Extraction; Elsevier Inc.: Amsterdam, The Netherlands, 2015; pp. 83–136. [Google Scholar]
  23. Suhaimi, S.H.; Hasham, R.; Hafiz Idris, M.K.; Ismail, H.F.; Mohd Ariffin, N.H.; Abdul Majid, F.A. Optimization of Ultrasound-Assisted Extraction Conditions Followed by Solid Phase Extraction Fractionation from Orthosiphon stamineus Benth (Lamiace) Leaves for Antiproliferative Effect on Prostate Cancer Cells. Molecules 2019, 24, 4183. [Google Scholar] [CrossRef] [Green Version]
  24. Zhang, H.; Li, M.; Li, J.; Zhu, C. Effect of ultrasound pretreatment on enzymolysis and physicochemical properties of corn starch. Adv. Eng. Res. 2018, 164, 572–576. [Google Scholar]
  25. Jia, X.; Zhang, C.; Hu, J.; He, M.; Bao, J.; Wang, K.; Li, P.; Chen, M.; Wan, J.; Su, H.; et al. Ultrasound-assisted extraction, antioxidant and anticancer activities of the polysaccharides from Rhynchosia minima root. Molecules 2015, 20, 20901–20911. [Google Scholar] [CrossRef] [Green Version]
  26. Charpe, T.W.; Rathod, V.K. Kinetics of ultrasound assited extrction of wedelolactone from Eclipta alba. Braz. J. Chem. Eng. 2016, 33, 1003–1010. [Google Scholar] [CrossRef] [Green Version]
  27. Standar Nasional Indonesia. BSN SNI 3451:2011 Tapioka; Standar Nasional Indonesia: Jakarta, Indonesia, 2011; pp. 1–38. [Google Scholar]
  28. Nelson, N. A photometric adaptation of the Somogyi method for the determination of glucose. J. Biol. Chem. 1944, 153, 375–380. [Google Scholar] [CrossRef]
  29. Ebringerová, A.; Hromádková, Z. An overview on the application of ultrasound in extraction, separation and purification of plant polysaccharides. Cent. Eur. J. Chem. 2010, 8, 243–257. [Google Scholar] [CrossRef]
  30. XuJie, H.; Na, Z.; SuYing, X.; ShuGang, L.; BaoQiu, Y. Extraction of BaChu mushroom polysaccharides and preparation of a compound beverage. Carbohydr. Polym. 2008, 73, 289–294. [Google Scholar] [CrossRef]
  31. Elboughdiri, N. Effect of time, solvent-solid ratio, ethanol concentration and temperature on extraction yield of phenolic compounds from olive leaves. Eng. Technol. Appl. Sci. Res. 2018, 8, 2805–2808. [Google Scholar] [CrossRef]
  32. Carrera, C.; Ruiz-Rodríguez, A.; Palma, M.; Barroso, C.G. Ultrasound assisted extraction of phenolic compounds from grapes. Anal. Chim. Acta 2012, 732, 100–104. [Google Scholar] [CrossRef] [PubMed]
  33. Rahman, A.M. Mempelajari Karakteristik Kimia Dan Fisik Tepung Tapioka Dan Mocal (Modified Cassava Flour) Sebagai Penyalut Kacang Pada Produk Kacang Salut. Ph.D. Thesis, IPB University, Dramaga, Indonesia, 2007; pp. 34–81. [Google Scholar]
  34. Stevenson, D.L.; Kennedy, J.F. Starch conversion technology: Edited by C. M. A. Beynum and J. A. Roels, Marcel Dekker Inc., New York, 1985. pp. 362. ISBN 0-8247-7194-X. Br. Polym. J. 1987, 19, 417. [Google Scholar] [CrossRef]
  35. Iida, Y.; Tuziuti, T.; Yasui, K.; Towata, A.; Kozuka, T. Control of viscosity in starch and polysaccharide solutions with ultrasound after gelatinization. Innov. Food Sci. Emerg. Technol. 2008, 9, 140–146. [Google Scholar] [CrossRef]
  36. Ashokkumar, M. Applications of ultrasound in food and bioprocessing. Ultrason. Sonochem. 2015, 25, 17–23. [Google Scholar] [CrossRef]
  37. Zisu, B.; Schleyer, M.; Chandrapala, J. Application of ultrasound to reduce viscosity and control the rate of age thickening of concentrated skim milk. Int. Dairy J. 2013, 31, 41–43. [Google Scholar] [CrossRef]
  38. Manchun, S.; Nunthanid, J.; Limmatvapirat, S.; Sriamornsak, P. Effect of ultrasonic treatment on physical properties of tapioca starch. Adv. Mater. Res. 2012, 506, 294–297. [Google Scholar] [CrossRef]
  39. Liu, J.; Wang, Y.; Fang, G.; Man, Y.; Liu, Y. Effect of Ultrasound-Assisted Isolation on Yield and Properties of High-Amylose Starch from Amylomaize. Starch Staerke 2019, 71, 1800292. [Google Scholar] [CrossRef]
  40. Herceg, I.L.; Jambrak, A.R.; Šubarić, D.; Brnčić, M.; Brnčić, S.R.; Badanjak, M.; Tripalo, B.; Ježek, D.; Novotni, D.; Herceg, Z. Texture and pasting properties of ultrasonically treated corn starch. Czech J. Food Sci. 2010, 28, 83–93. [Google Scholar] [CrossRef]
  41. Zhu, F. Composition, structure, physicochemical properties, and modifications of cassava starch. Carbohydr. Polym. 2015, 122, 456–480. [Google Scholar] [CrossRef]
  42. Wu, Y.; Du, X.; Ge, H.; Lv, Z. Preparation of microporous starch by glucoamylase and ultrasound. Starch Stärke 2011, 63, 217–225. [Google Scholar] [CrossRef]
Figure 1. Pareto chart for the standardized effects of studied variables (x1, ultrasound power; x2, pulse duty-cycle; x3, solvent to sample ratio). The vertical line crossing the bars notifies the corresponding factor has a statistically significant effect for a 95% confidence level. Agronomy 11 00117 i001 indicates a positive effect while Agronomy 11 00117 i002 indicates a negative effect.
Agronomy 11 00117 g001
Figure 2. Predictions of regression models.
Agronomy 11 00117 g002
Figure 3. 3D estimated response surface mesh for the studied ultrasound-assisted extraction (UAE) factors.
Agronomy 11 00117 g003
Figure 4. Further optimization: (a) effect of ultrasound power and (b) effect of pulse duty-cycle on the starch yield (%). Note: Bars with different description letters indicate a significant difference (p < 0.05).
Agronomy 11 00117 g004
Figure 5. Extraction kinetics of cassava starch extraction using UAE. Different description letters indicate a significant difference (p < 0.05).
Agronomy 11 00117 g005
Figure 6. The shape of starch granules observed for ultrasound-produced starch and commercial sample.
Agronomy 11 00117 g006
Table 1. Extraction variables and their levels.
VariableCode−10+1Unit
Ultrasound powerx1306090%
Pulse duty-cyclex20.30.60.9s−1
Solvent to sample ratiox310:120:130:1(v/w)
Table 2. Box-Behnken design with the observed responses.
Runx1x2x3Starch Yield (%)
11−1030.26
2−11025.87
311037.02
410141.70
5−10−121.06
600032.82
701140.25
80−1132.00
900029.63
10−1−1026.27
1101−122.97
120−1−118.24
13−10129.19
1400032.07
1510−122.67
1610−125.94
1710141.13
18−1−1025.30
1900032.29
201−1025.38
21−11028.62
22−10132.74
2300028.66
240−1132.54
2501−123.43
2600033.45
2711040.33
2801136.86
290−1−117.30
30−10−117.29
Table 3. Comparison of the viscosity of ultrasonic and commercial starch.
Temperature (°C)Viscosity (cP)
Ultrasonic ResultsCommercial
602.4 ± 0.062.0 ± 0.10
651868.0 ± 2.881972.0 ± 2.51
701920.0 ± 0.571996.0 ± 5.51
Publisher’s Note: MDPI stays neutral with regard to jurisdictional claims in published maps and institutional affiliations.