Article

Indicative Value of the Dominant Plant Species for a Rapid Evaluation of the Nutritional Value of Soils

by
Ana Cano-Ortiz
1,
Carmelo M. Musarella
2,*,
José C. Piñar Fuentes
1,
Carlos J. Pinto Gomes
3,
Ricardo Quinto-Canas
4,5,
Sara del Río
6 and
Eusebio Cano
1
1
Department of Animal and Plant Biology and Ecology, Section of Botany, University of Jaén, Las Lagunillas s/n, 23071 Jaén, Spain
2
Department of AGRARIA, “Mediterranea” University of Reggio Calabria, Località Feo di Vito, 89122 Reggio Calabria, Italy
3
Department of Landscape, Environment and Planning, Institute for Mediterranean Agrarian and Environmental Sciences (ICAAM), School of Science and Technology, University of Évora (Portugal), Rua Romão Ramalho, No. 59, 7000-671 Évora, Portugal
4
Faculty of Sciences and Technology, Campus de Gambelas, University of Algarve, 8005-139 Faro, Portugal
5
Centre of Marine Sciences (CCMAR), Campus de Gambelas, University of Algarve, 8005-139 Faro, Portugal
6
Department of Biodiversity and Environmental Management (Botany), Faculty of Biological and Environmental Sciences, Campus de Vegazana s/n, Mountain Livestock Farming Institute (Joint Center CSIC-ULE), University of León, E-24071 León, Spain
*
Author to whom correspondence should be addressed.
Agronomy 2021, 11(1), 1; https://doi.org/10.3390/agronomy11010001
Submission received: 30 November 2020 / Revised: 16 December 2020 / Accepted: 17 December 2020 / Published: 22 December 2020
(This article belongs to the Special Issue Soil Quality Evaluation Using Biological Properties)

Abstract

:
A study was conducted on 14 grassland communities located in the south of the Iberian Peninsula and their edaphology, which is identified as specific plant associations. The edaphic study of each association allows a rapid evaluation of the nutrient content in the soil without the need for laboratory edaphic analysis. For each phytosociological relevé and soil, samplings were carried out. The field data were subjected to various statistical analysis—canonical correspondence analysis (CCA), Bayesian networks, and decision trees—to establish nutrient content. When the abundance value of the species is 9 in the Van der Maarel scale, there is an increase in the values of several soil parameters. In the case of Hordeum leporinum, when the Van der Maarel index is 9, the Kc (exchangeable potassium in cmol/kg) undergoes the greatest variation, to a value of up to 0.729 cmol/kg. The application of the decision tree to this species reveals that the soil attributes with the greatest influence in the classification are conductivity, %_si (silt texture), pH, and pF 15 atm (pressure at 15 atmospheres (water retention capacity) in %). Indeed, this interlaced edaphic and phytosociological study provides us with a high-value tool to obtain quick information on the content of nutrients in the soil.

1. Introduction

The great diversity of Mediterranean grazings and their use in livestock and agriculture has been analyzed in olive areas in Spain, Italy, and Portugal, with a focus on the Iberian Peninsula [1,2,3]. Pastures and grasslands are relevant as plant covers, because they prevent soil erosion [4]. Each plant association of pasture or grassland has few or more dominant species thanks to the type and quantity of soil nutrient [5]. Hence, the interest of knowing these plant communities relates to fast and correct agricultural management, enabling the avoidance or reduction of the economic cost of laboratory analysis as well as the use of fertilizers and herbicides. The great abundance of floristic and phytosociological studies [6,7,8,9,10,11,12,13,14,15], and the lack of studies that correlate plant associations with soils, allows proposing a new applied model, through which quick information on the nutritional status of soils is obtained.
The treatment traditionally given to grasslands in rain-fed crops differs in the various Mediterranean countries, as the overuse of herbicides in Spain has led to a loss of floristic diversity compared to the grasslands in Italy and Portugal [16]. Cano-Ortiz established soil nutrient values for the most abundant and characteristic taxa in several pastureland and grassland associations of the Italy and Iberian Peninsula [17]. On the other hand, in Italy, Taffetani and Rismondo investigated a bioindicator system for the evaluation of the environmental quality of agro-ecosystems [18]. Several authors studied grassland plant associations in Italy [19,20,21], while others conducted a phytosociological survey on the spring nitrophilic ruderal aspects dominated by Hordeum leporinum Link [=Hordeum murinum L. subsp. leporinum (Link) Arcang.] in Spain, Portugal, and Italy [22,23,24,25,26]. Cano-Ortiz et al. [16] studied the communities of the alliance Hordeion leporini in the western Mediterranean and described new syntaxa at association and alliance level in Italy, which was recently reported also by others [27,28,29] who confirmed the optimal distribution for the alliance Securigero securidacase-Dasypirion villosi in the central Italian Peninsula. The communities with H. leporinum, Glebionis coronaria (L.) Spach (=Chrysanthemum coronarium L.), Glebionis discolor (d’Urv.) E. Cano et al. (=Chrysanthemum coronarium L. var. discolor) [30], Malva neglecta Wallr., Anisantha diandra (Roth) Tutin ex Tzvelev (=Bromus diandrus Roth), Papaver rhoeas L., Raphanus raphanistrum L., Triticum vagans (Jord. & Fourr.) Greuter (=Aegilops geniculata Roth), and Taeniatherum caput-medusae (L.) Nevski include typical meditarrean grasslands with subnitrophilous or nitrophilous character and spring development, but which may radiate to submediterranean and central European territories. Although they have a Mediterranean optimum, these plant associations can also be found in eurosiberian zones (central Europe) and in the central Pyrenees (Spain) and central Apennines (Italy). These latter territories in Italian submediterranean environments (such as the Gargano region) [31] host species such as the calcicolous Dasypyrum villosum (L.) P. Candargy from southeast Europe, which is very frequent in Italy [32] and absent from Spain and Portugal [26,33,34]. The distribution area of Securigera securidaca (L.) Degen & Dörfl. is from southern Europe to southeast France, whereas Crepis sancta (L.) Bornm. is found in the samplings taken in Italy, with a biogeographical area in the eastern Mediterranean region and southeast Europe. All the plant associations of D. villosum are grassland formations with a dense cover and high biomass that thrive in environments with high amounts of organic matter [21]. The average value obtained in the soil analysis for the communities present in Italy is 6.149% of oxidizable organic matter (OOM) and 0.274% of total nitrogen (Nt), whereas the pH is always alkaline over 8: these values differ from those obtained in Spain and Portugal [23].
Bayesian networks are a probabilistic approach used to depict a set of related uncertainties. They are based on the theory of probability (Bayes theorem) and graph theory, and they represent models of reality. Among other applications, Bayesian networks have been used to resolve the uncertainty characterising fluctuations in the financial markets, making decisions involving medical diagnoses and in the study of natural ecosystems. However, and to the best of our knowledge, they have not been widely used in the discipline of plant biology, and they have been used much less in the analysis of plant–soil relations.
Bayesian networks have both a qualitative and quantitative dimension. In their qualitative aspect, it can be understood as a graphic representation (a graph or network) of relation series on variables dependence; the type of networks obtained are called directed acyclic graphs, where each node represents a variable, and the arcs show the relation between the nodes. The advantage of this type of representation is that it allows the relations of conditional dependence and independence between the variables to be codified, which facilitates the interpretation and the calculations on the model.
The quantitative approach is based on the uncertainty associated to each variable in a Bayesian network, which is resolved according to the theory of probability. Thus, each variable in a model has a limited number of possible states (or levels), and each one is associated to a value or probability of that state occurring. These probabilities can change if there is prior evidence for any of the variables in the model. In this case, when we know the value taken by a certain variable in the model, this information is propagated through the network, and the values associated to other variables are recalculated using the Bayes theorem as the basic operator. This is what is called “evidence propagation”. Thanks to the principles of conditional dependence and independence codified by the structure of the graph and the algorithms developed to operate on them, the calculations can be made much faster than if the whole set of variables in the model needed to be processed.
There are currently different software packages available to create models of Bayesian networks. In our case, we used the program Bayesia Lab 3.1 (http://www.bayesia.com). The classifier used to characterize each node was naive Bayes, as this assumes a strong independence between the characteristics in the classification process, which is the process of assigning a class mark to each instance (in our case plant species) described by a series of attributes (which in our model correspond to soil parameters).
In this work, we demonstrate how Bayesian networks can act as an exploratory tool to anticipate and recommend a formula for more effective future decisions for managing vegetation cover in sustainable agriculture [23].
Although several authors have worked on edaphic nutrients [35,36,37,38], there are only a few studies in which the phytosociological method for studying plant associations connected with the use of artificial intelligence: so, this study is really new. Consequently, knowledge of the ecology, structure, function, and floristic composition allows us to know the composition of the soil with high detection. The aim of this work is to demonstrate the value of plant associations as nutrient indicators so that they can be used in a sustainable ordination of crops by seeking the optimum nutrient values. Through pasture or grassland plant associations, we can know exactly whether or not there is a lack of any nutrient in the soil. This is important in agricultural management, so as not to abuse the application of fertilizers to the soil, which in most of the cases end up polluting lakes, rivers, swamps, and the agricultural product.

2. Materials and Methods

This work considered 14 plant–community types: AcH*: Anacyclo clavati-Hordeetum leporini; ArH*: Anacyclo radiati-Hordeetum leporini; BH*: Bromo scoparii-Hordeetum leporini; LR*: Linario spartei-Raphanetum raphanistri; PD*: Papaveri rhoeadis-Diplotaxietum virgatae; ArP*: Anacyclo radiati-Papaveretum rhoeadis; ArChr*: Anacyclo radiati-Chrysanthemetum coronari; RChr*: Resedo albae-Chrysanthemetum coronari; UM*: Urtico urentis-Malvetum neglectae; PA*: Plantago bellardi-Aegilopetum geniculatae; TT*: Trifolio cherleri-Taeniatheretum capitis-medusae; TP*: Trifolio cherleri-Plantaginetum bellardii; FS*: Fedio cornucopiae-Simapietum mairei; and CS*: Carduo bourgeani-Silybetum mariani (* represents the dominant species in the association, according to [39]). Each community was selected to be both physiognomically and ecologically homogeneous, and each contains one or more dominant species. For sampling, ecologically homogeneous plots were selected in grazing areas and olive groves in Jaén (Spain) and Évora (Portugal). The sampling is decided by the homogeneous–physiognomic character of the community, ensuring that the samplings were distributed in the study area (see distribution map). Regarding the edaphic sampling, a soil sample of 1 kg was extracted, while the measurements of the root system of the dominant species were previously carried out. The plot selection was made at those points where the main species of the plant association was dominant; next, the minimum area was obtained to establish the size of the plot, which ranges between 0.5, 1, and 2 m2, depending on the type of plant association. The sampling was repeated 20 times in different areas for each plant association, all with the same dominant species, for a total of 280 botanical relevés following the Braun–Blanquet [39] abundance–dominance index, which was subsequently transformed into Van der Maarel indices [40]. The edaphic sampling was carried out taking into account the depth of the root system of the dominant species and therefore of the rhizosphere. These samples were analyzed in the agri-food laboratories of Córdoba and Granada, according to the protocol established by the Institute for Research, Agricultural and Fisheries Training (IFAPA). Twelve soil parameters were analyzed in the laboratory for each of the 20 samples per plant association, as follows: cation-exchange capacity (CEC; cmol/kg); carbonates (%); assimilable phosphorus (Pa; p.p.m.); exchangeable magnesium (Mgc; cmol/kg); total nitrogen (Nt; %); exchangeable potassium (K; cmol/kg); pF 15 atmospheres (%); clay texture (%_cl); silt texture (%_si); sand texture (%_sa); EC: conductivity in dS/m; pH. The data used in this work are partially coming also from [22,23]. These 12 parameters are the most representative, according to [16] (Table 1 and Table 2). A total of 280 soil samples were analyzed: one for each botanical relevé. The plant species that were present only in the plant association were eliminated from the subsequent statistical analysis to avoid noise (Figure 1).

2.1. Statistical Analysis

To verify the influence of the independent variables (edaphic factors), which condition the presence, absence, and abundance in each of the dependents (species), we applied a canonical correspondence analysis (CCA) in order to establish the influence of the various parameters (12 parameters, see Table 2) in each species and site (communities). This was done using the XLSTAT 2009.3© program (B 429 102 767 RCS Paris—France).

2.2. Bayesian Statistics and Decision Trees

After obtaining the parameters with the greatest influence on each species, we selected the species to which to apply a classification analysis by expert systems (decision trees) according to Braun-Blanquet [39]. Decision trees are prediction models from the realm of artificial intelligence that are used to classify plant–soil relations. Programs that simulate human reasoning are known by the name of “expert systems”.
To obtain the plant–soil relations, we also created decision trees for some of the most representative species, now using expert systems procedures. As mentioned in the Materials and Methods section, the information gain was first obtained for each one as an assessor of attributes before subsequently launching the classification algorithm (J48) to create the tree.
One of the techniques we followed to classify and represent plant–soil relations was to create decision trees. These trees were created by obtaining the Information Gain (IG) for each species, which is defined in [17] as the amount of information provided by a soil attribute for a particular plant species. Thus, we can deduce that the higher the value of IG, the more information is provided by the soil parameter to delimit the abundance of the species, and the greater the number of soil parameters with IG, the more demanding is the species in the choice of soil in which it grows [41].
A decision tree has certain inputs, which may be an object or situation described by means of a set of attributes. Based on these, it returns a response derived from the inputs that can be used as a decision criterion. The inputs and outputs can take either discrete or continuous values.
In our work, the decision trees were obtained using the data mining program Weka (http://www.cs.waikato.ac.nz/ml/weka/). This was done by first preparing a series of data matrices with all the relevés from a country, but for each matrix including only the Van der Maarel indices for a chosen species and all the soil attribute values. Then, the matrix was uploaded to Weka, and information gain was obtained as the evaluator of the attributes; the value of this parameter indicated the information provided by each soil attribute according to the presence of the species in question. Then, we launched the classifier (in our case, the algorithm C4.5, -J48 in the Weka software) to build the decision tree, but including only the relevant soil attributes; that is, those for which the information gain was different from zero, and which therefore provided certain information and avoided noise.
Thus, each of the decision trees built runs a customized test of all the leaves to reach the decision. The decision trees shown contain internal nodes, leaf nodes, and arcs. An internal node contains a test of some values of one of the properties (in our case, the range of soil attribute values); a leaf node represents the value that will be returned by the decision tree (Van der Maarel index for the species in question); and finally, the branches show the possible path available according to the decision made [17].

3. Results

For each plant association, the average value of the 20 samples is represented for each soil parameter, obtaining a table of average soil values per plant association (independent variables). The table of average soil parameters is compared with the average values of abundance indices for all the most abundant species (dependent variables): Tcm = Taeniatherum caput-medusae; Pb = Plantago bellardii All.; Hl = Hordeum leporinum; Bh = Bromus hordeaceus L.; Pr = Papaver rhoeas; Ar = Anacyclus radiatus Loisel; Chco = Glebionis discolor; Rr = Raphanus raphanistrum; Mn = Malva neglecta; Sam = Sinapis alba L. subsp. mairei (H. Lindb.) Maire; Ag = Aegilops geniculata Roth, Xg = Xolantha guttata (L.) Raf.; Sim = Silibum marianum (L.) Gaert., etc. (Table 3).
The edaphic analysis obtained from the studied associations reveals a variability in the value of the different edaphic parameters. The values obtained in Table 3 represent mean values of the 20 edaphic samplings carried out for each association: the associations being dominated by Chrysanthemum coronarium, Hordeum leporinum, Malva neglecta, and Silybum marianum, which have high values of total nitrogen, assimilable phosphorus, assimilable potassium, and pH. However, the associations LR, TT, and TP that are located in siliceous substrates present low pH and very low assimilable phosphorus values.
In order to determine which parameters have a direct influence on each of the dominant species in each association, we established a prior canonical correspondence analysis among the dominant species in the 12 independent variables (soil factors). Obviously, the dominant species used are located in optimal edaphic environments. However, these same species can be companions in other associations due to other edaphic conditions. Figure 2 shows that texture, pH, EC (conductivity), and OOM are the parameters that have the highest loading on species presence and abundance. The plant associations TP* Trifolio cherleri-Plantaginetum bellardii (Spain), TT* Trifolio cherleri-Taeniatheretum caput-medusae (Spain), LR* Linario-Raphanetum raphanistri (Spain), and PA* Plantago bellardi-Aegilopetum geniculatae (Portugal) are at the right of Figure 2, and %_ar, together with acid/neutral pH, are the variables that condition their presence. In contrast conductivity, OOM, basic pH, carbonate etc., condition the rest of the associations (left side of Figure 2).
The following plant associations are those that have served to establish the edaphic attributes (nutritional value of the soil): TP* belongs to the phytosociological alliance Tuberarion guttatae, which is described as pure grasslands developed in lithosols of acid pH, with low nitrogen content and in organic matter; TT* and PA* have been included in Taenatherio caput-medusae-Aegilopion geniculatae (to this phytosociological alliance belong associations with variable pH and with average values of nitrogen and organic matter); while LR* is included in the Alysso granatensis-Brassicion barrelieri phytosociological alliance, which is differentiated from the previous ones by needing soils with some sand content [42].
The plant associations AcH*, ArH*, BH*, PD*, FS*, and ArP* with abundance of the Hordeum leporinum species are included in the Hordeion leporini phytosociological alliance, which brings together grassland plant associations developed on acidic and basic pH soils with content in nitrogen and organic matter greater than those of Taeniathero-Aegilopion geniculatae. The phytosociological alliance Hordeion leporini dominates most rainfed crops, especially olive groves, as well as the UM* and RChr plant associations that belong to the Malvenion neglectae phytosociological alliance [25,26]. Finally, plant associations such as CS*, belonging to the Silybo-Urticion phytosociological alliance, appear in the crops with low frequency, which includes the plant associations that present the greatest amount of organic matter.

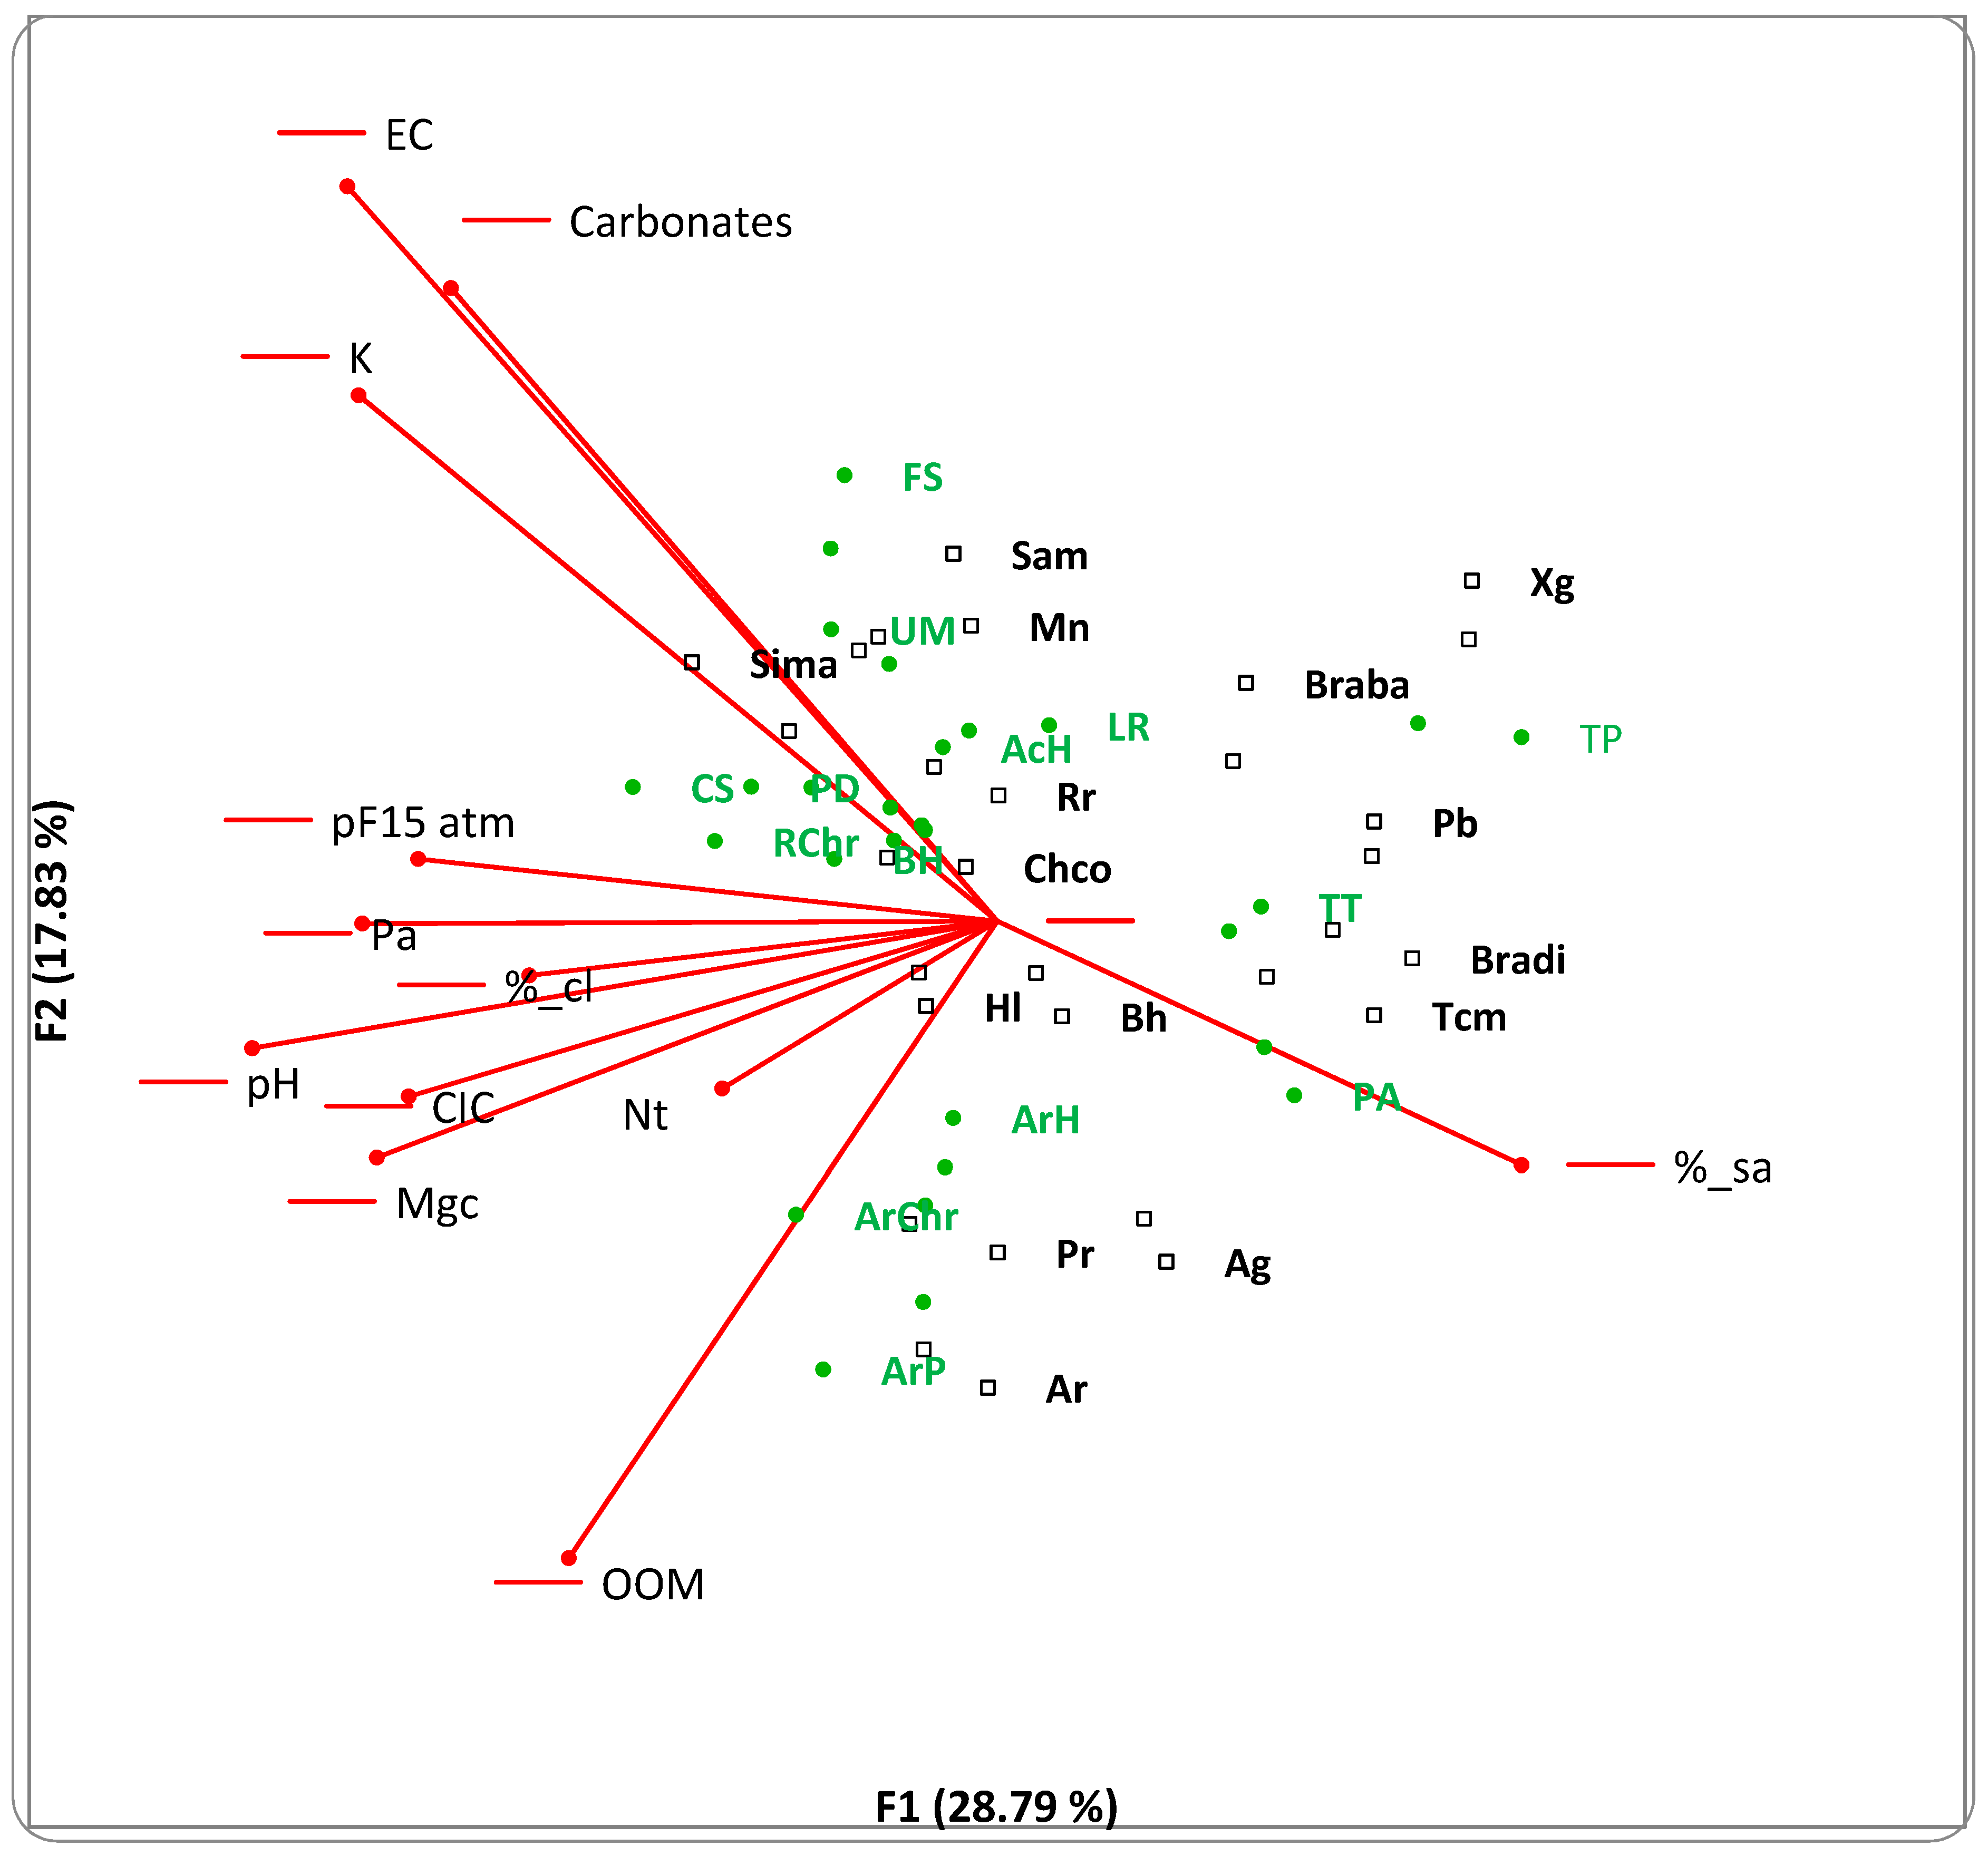
3.1. Bayesian Analysis
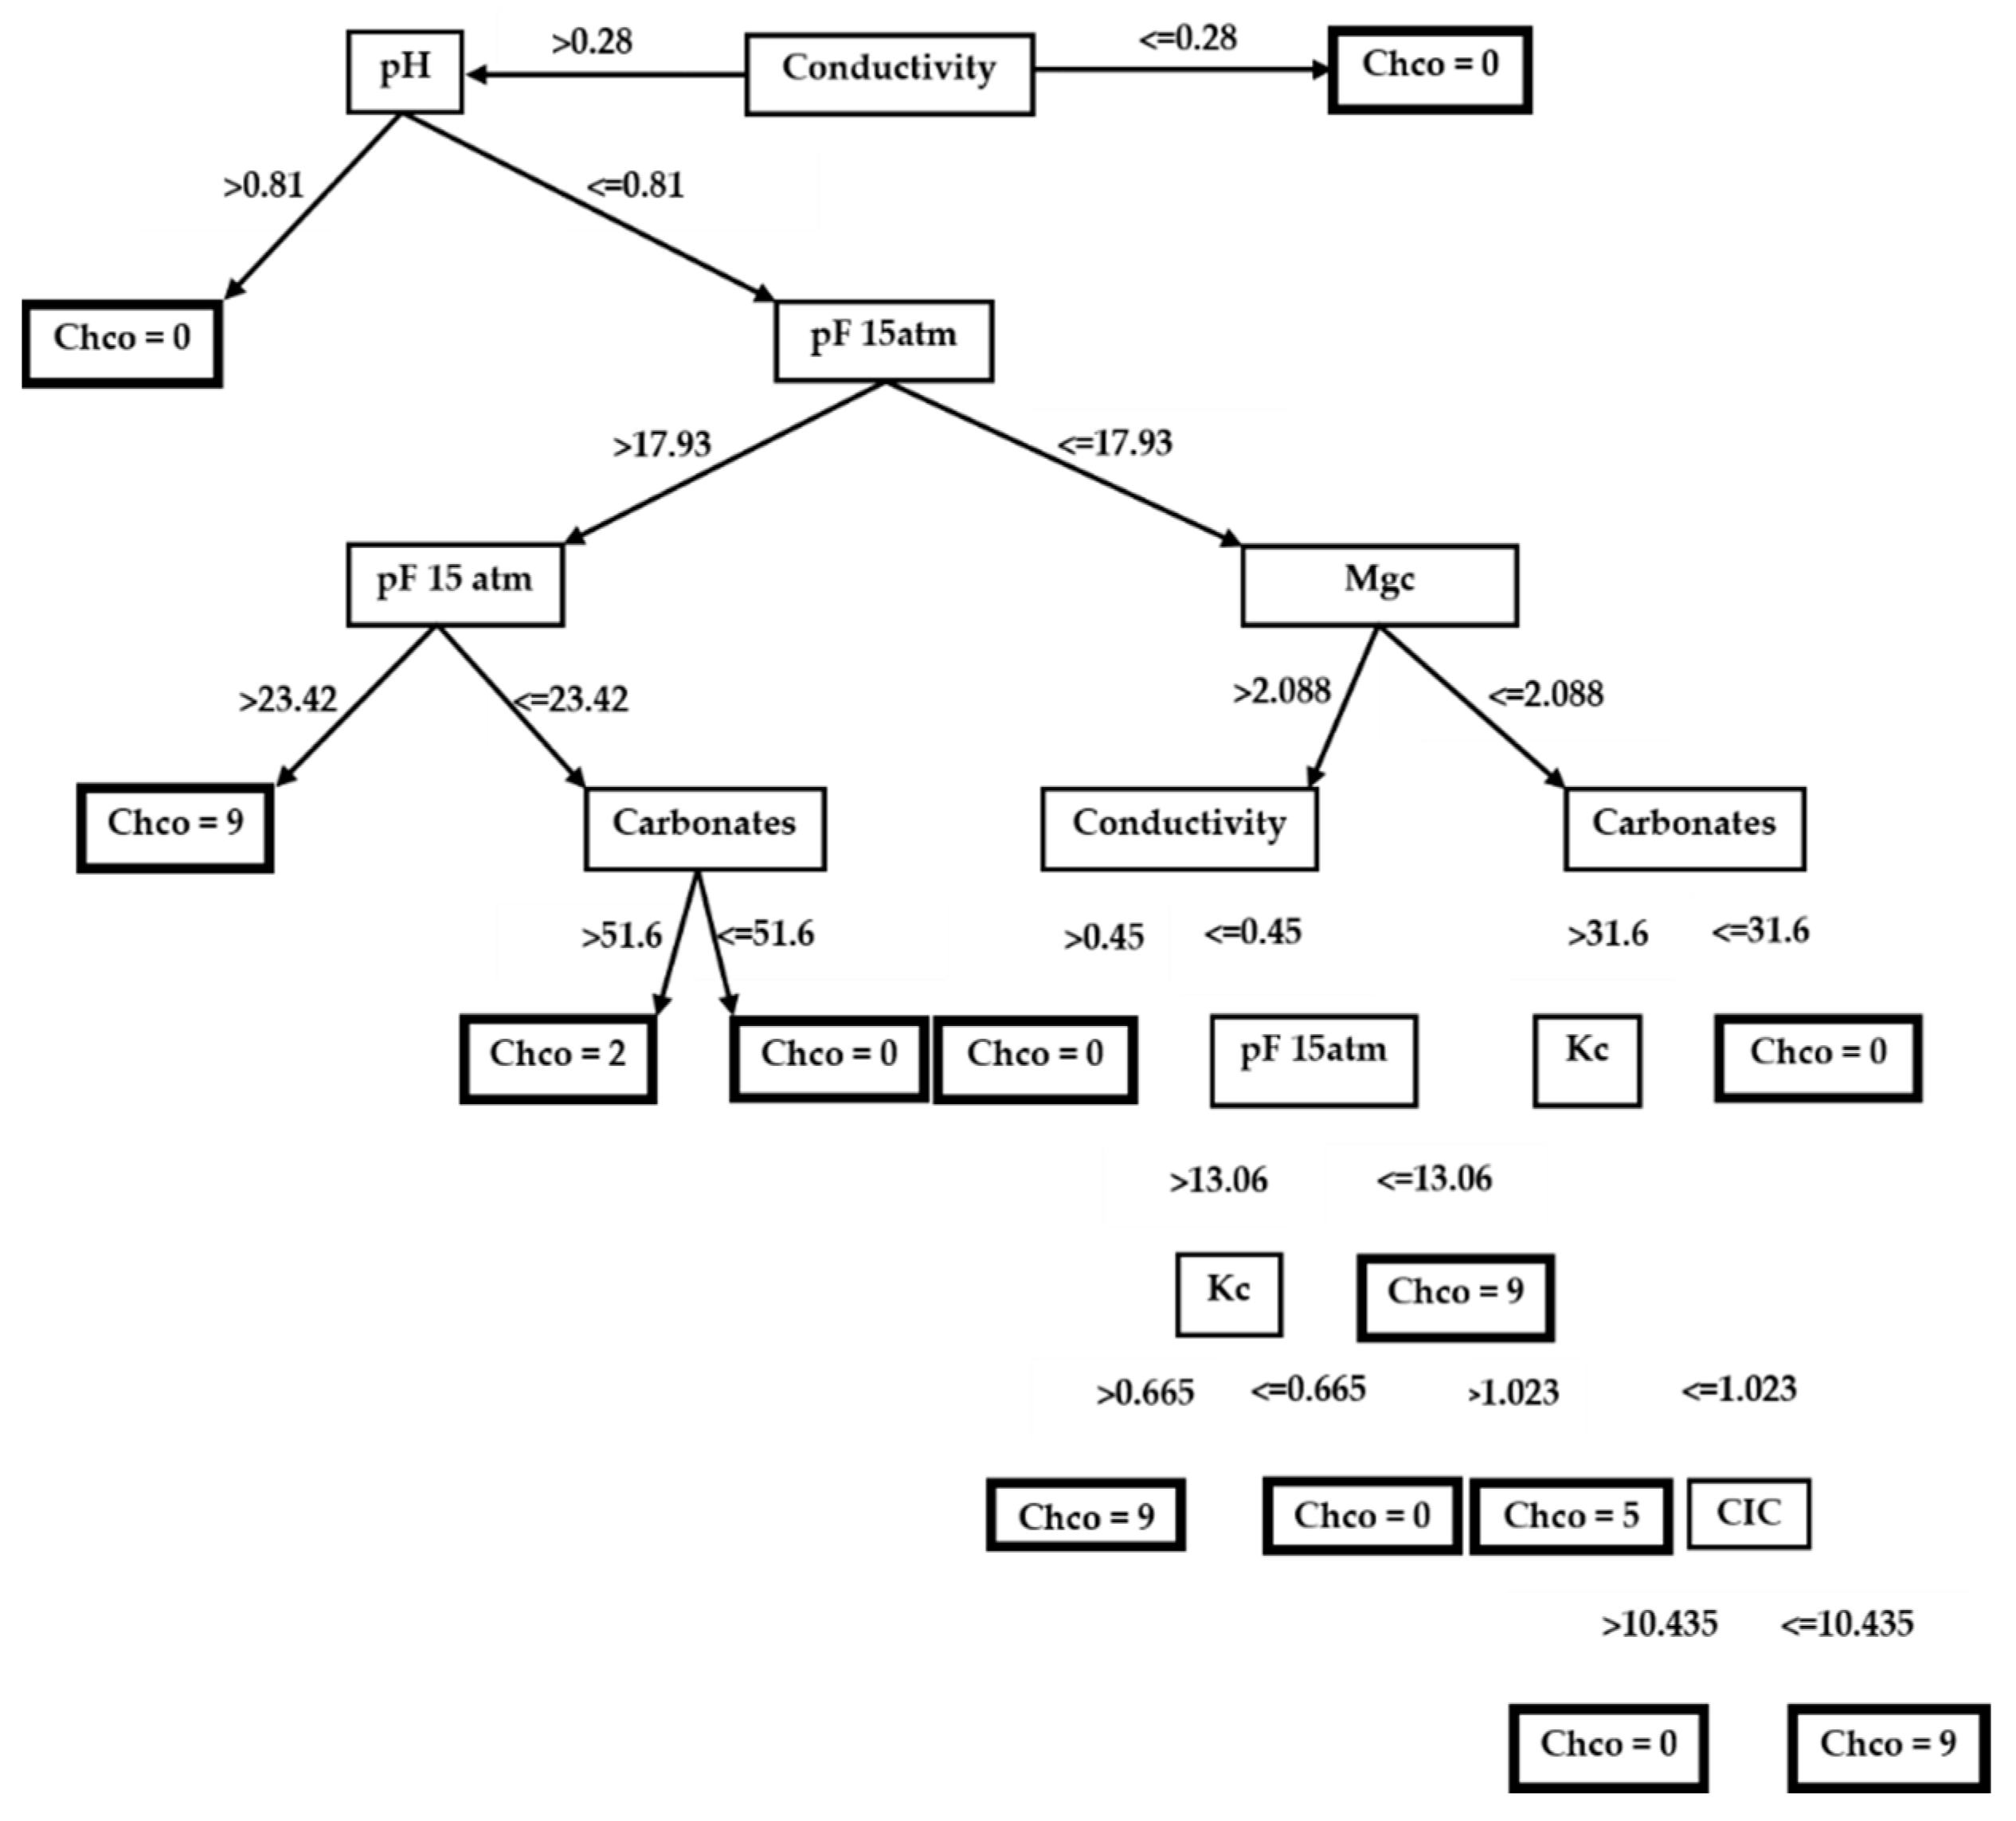
We created directed acyclic graphs and tables of probabilities for the species that give the name to each association, and for which they provide more information, considering that by selecting the highest Van der Maarel index for that species, the values for the soil parameters studied are located at clearly delimited intervals in over 80% of cases.
In the case of the association Anacyclo radiati-Hordeetum leporini, Hordeum leporinum initially has a Van der Maarel index of 9 in 68.25% of cases, 8 in 20.63%, and 7 in 11.11% of cases. With these species’ abundances, the soil parameters move within specific ranges: conductivity has values of 0.620 mmhos/cm or less in 91.67% of cases; Nt has values of 0.130% or less in 44.05%; Pa has values of 13.575 p.p.m. or less in 58.33%; and Kc has values of 0.729 cmol/kg or less in 48.81% of cases.
When we establish the prior evidence that this species has a Van der Maarel index of 9, it can be seen that it is mainly the proportion of Kc that shows the widest variation, with 63.37% of cases with values of 0.729 cmol/kg.
In the association Carduo bourgaeani-Silybetum mariani, the species Silybum marianum has the following proportions with the following Van der Maarel abundance indices: a Van der Maarel index of 2 in 10.83% of cases; 3 in 5.83%, 5 in 20.83%, 7 in 5.83%, 8 in 10.83%, and 9 in 45.83%. In this case, the absolute of Silybum marianum with an abundance value of 9 brings us to 45.83%. For these species, abundance values and these proportions, the soil parameters studied move within certain ranges; it is significant that Pa values in 61.25% of cases are 30.750 p.p.m. or less, Kc values are 1.067 cmol/kg or less in 56.25%, Nt values are 0.162% in 86.25%, and OOM values are 2.435% or less in 82.25% of cases. After propagating the prior evidence that S. marianum has an abundance of 9 in 100% of cases, we can see how the percentages for the aforementioned soil attributes increase considerably for the same values.
With regard to the association Trifolio cherleri-Plantaginetum bellardii, the species Plantago bellardii initially has a Van der Maarel index of 3 in 36% of cases, 5 in 16%, 7 in 31%, 8 in 6%, and 9 in 11%. With the abundance distribution of this species, the soil parameters appear in specific ranges, so in 41.25% of cases, the value of Kc is 0.144 cmol/kg or less, Pa is 0.9500 p.p.m. or less in 86.25%, %_ar is over 86.255 in 73.448% of cases, and pF 15 atm is 5.285 or less in 86.25% of cases. If we select 100% of the cases in which the species has a Van der Maarel index of 9, then Pa, Nt, and OOM increase the percentage of the previously mentioned values, although in 47.73% of cases, Kc has values of 0.185 cmol/kg or less.

3.2. Decision Trees

We did not build a decision tree in cases where values for Information Gain (IG) equal to 0 were obtained for all the attributes in a species, only in cases in which IG was more than zero.
Based on the results of our previous analyses, we selected some species to make their decision trees: Plantago bellardii, Taeniatherum caput-medusae, Hordeum leporinum, and Glebionis discolor.

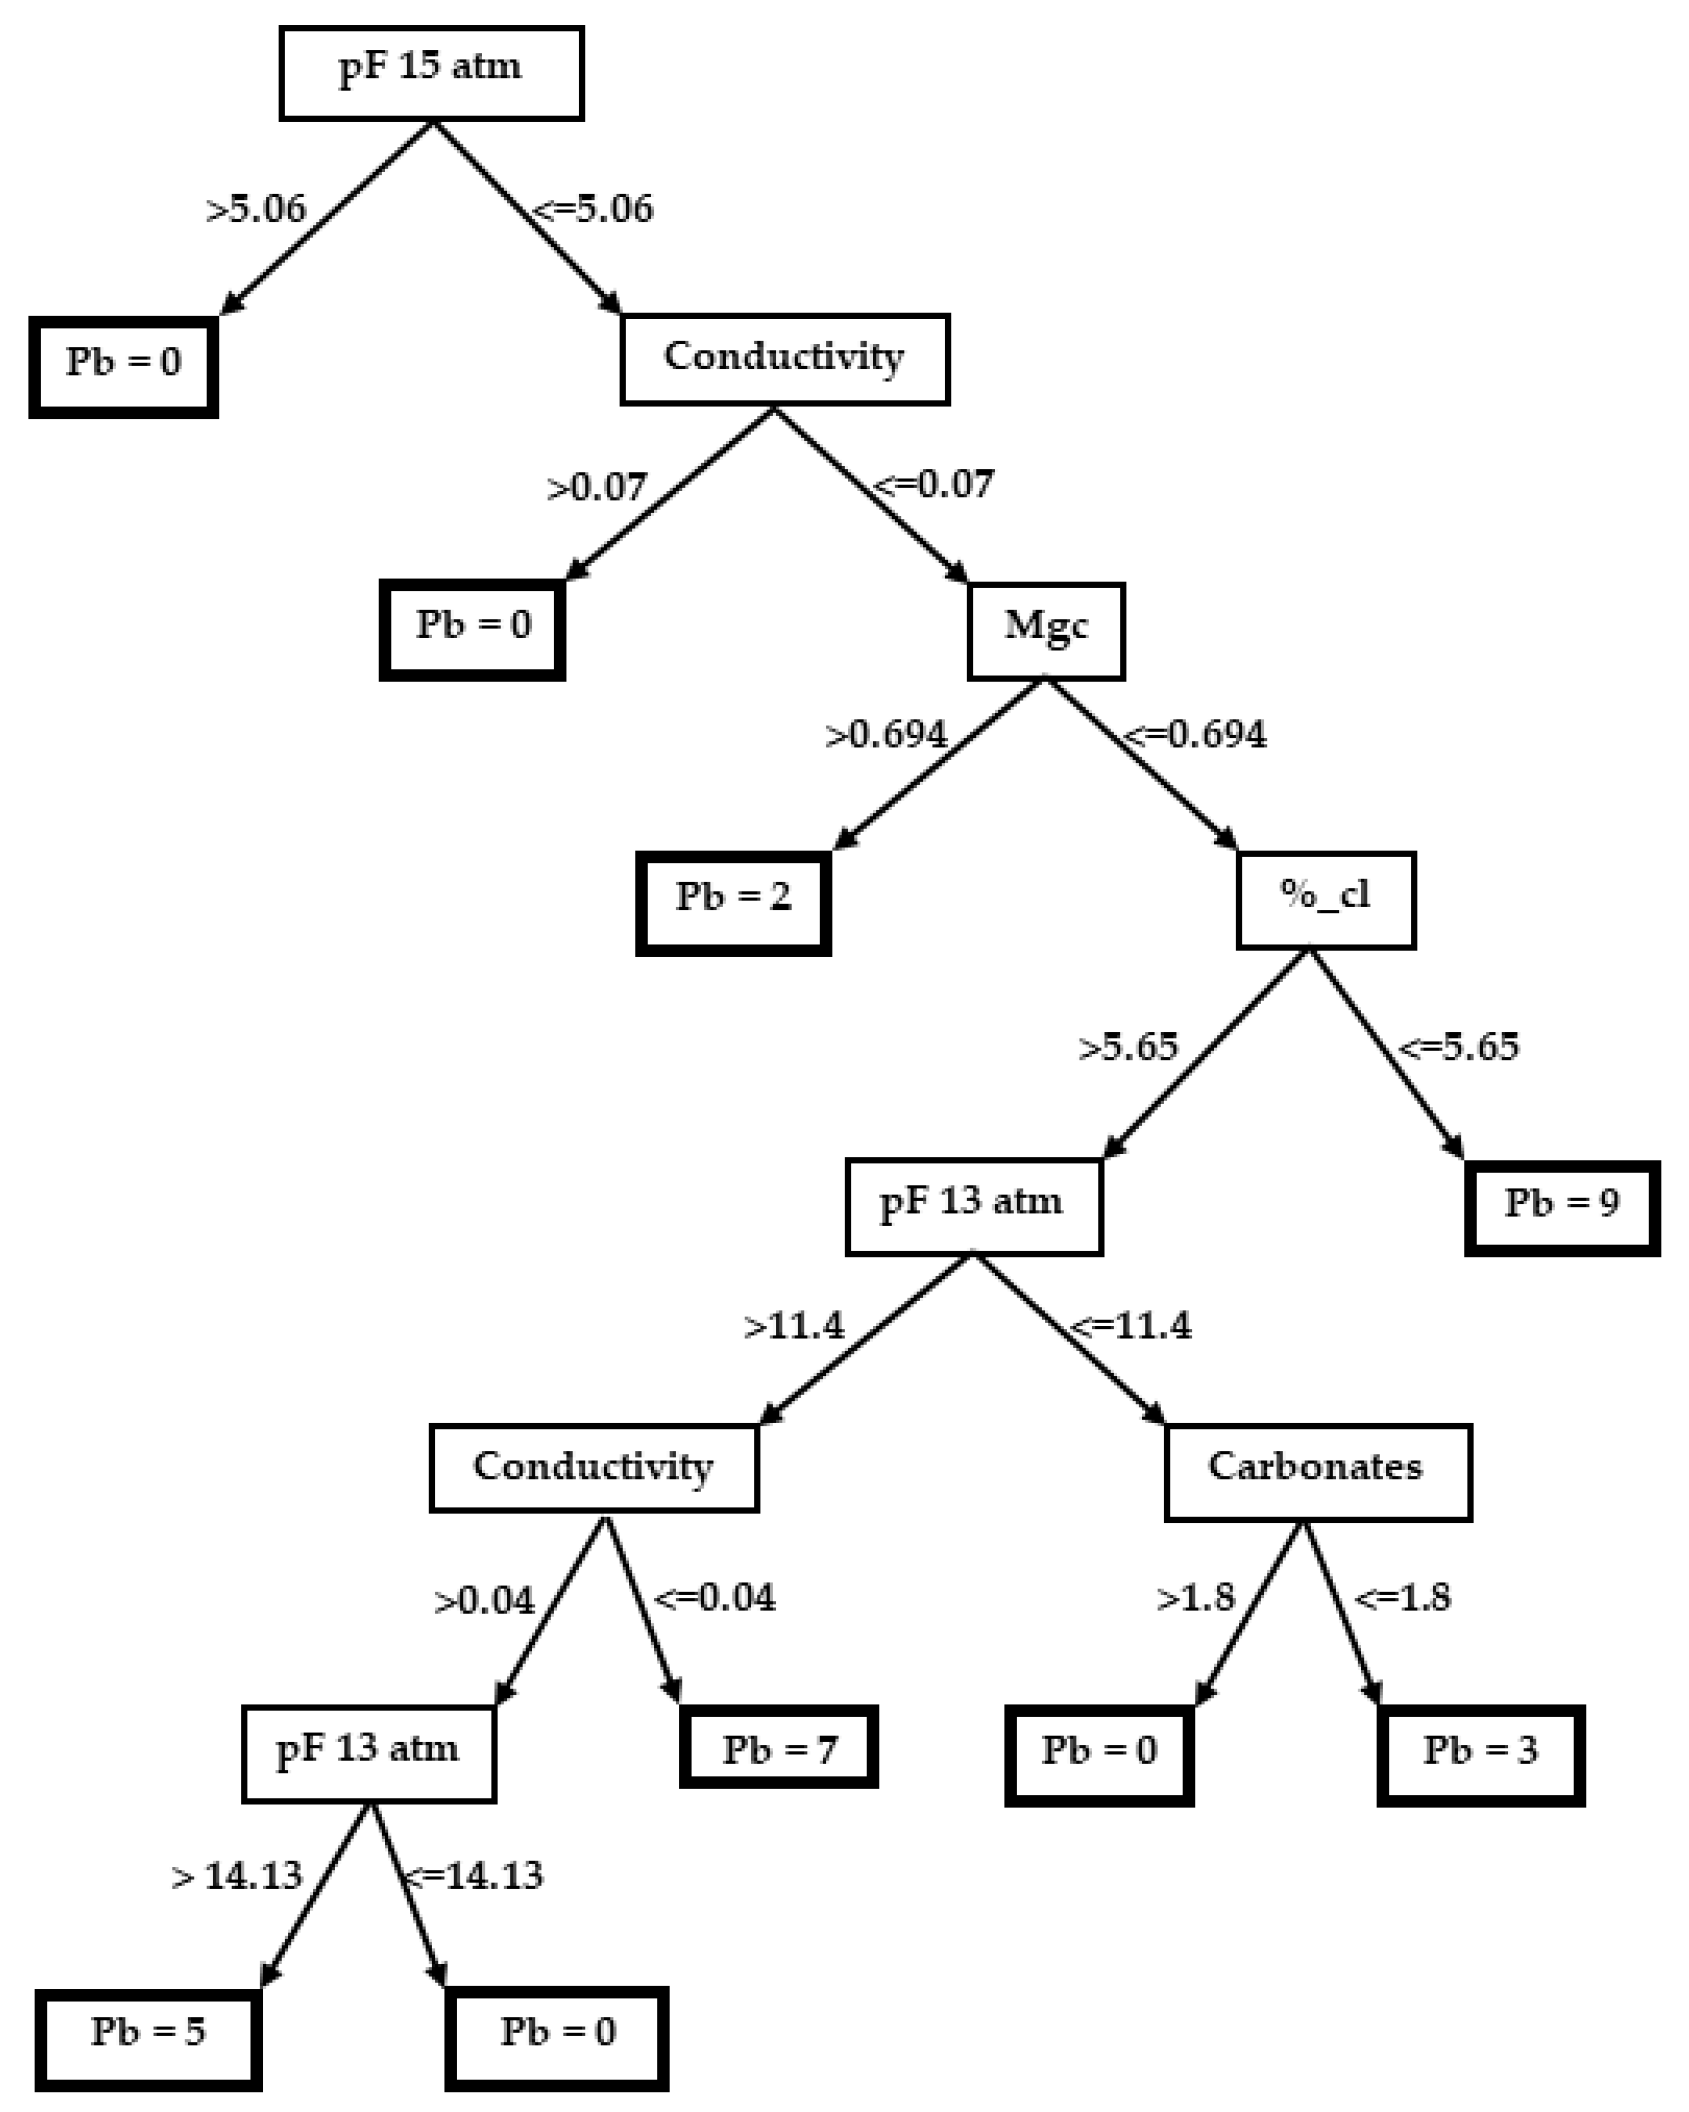
3.2.1. Plantago bellardii

The parameters with the greatest influence for the classification of the species P. bellardii are conductivity, %_sa, pF 15 atm, pH, carbonates, Kc, CEC, pF 13 atm, Mgc, %_si, %_cl, and Pa. The parameter with the most influence is conductivity. The species is not present on its tree for values of pF 15 atm of over 5.06%, pF 15 atm of 5.06% or less, conductivity of 0.07 mmhos/cm or less, Mgc of 0.694 cmol/kg or less, %_cl of 5.65% or less. P. bellardii has an abundance of 9 in the Van der Maarel indices.
The soil attributes ordered by Information Gain for the species P. bellardii are 0.275 EC (conductivity); 0.248 %_sa; 0.245 pF 15 atm; 0.237 pH; 0.226 carbonates; 0.219 Kc; 0.167 CEC; 0.16 pF 13 atm; 0.159 Mgc; 0.154 %_lim; and 0.131 %_cl; 0.129 Pa (Figure 3).

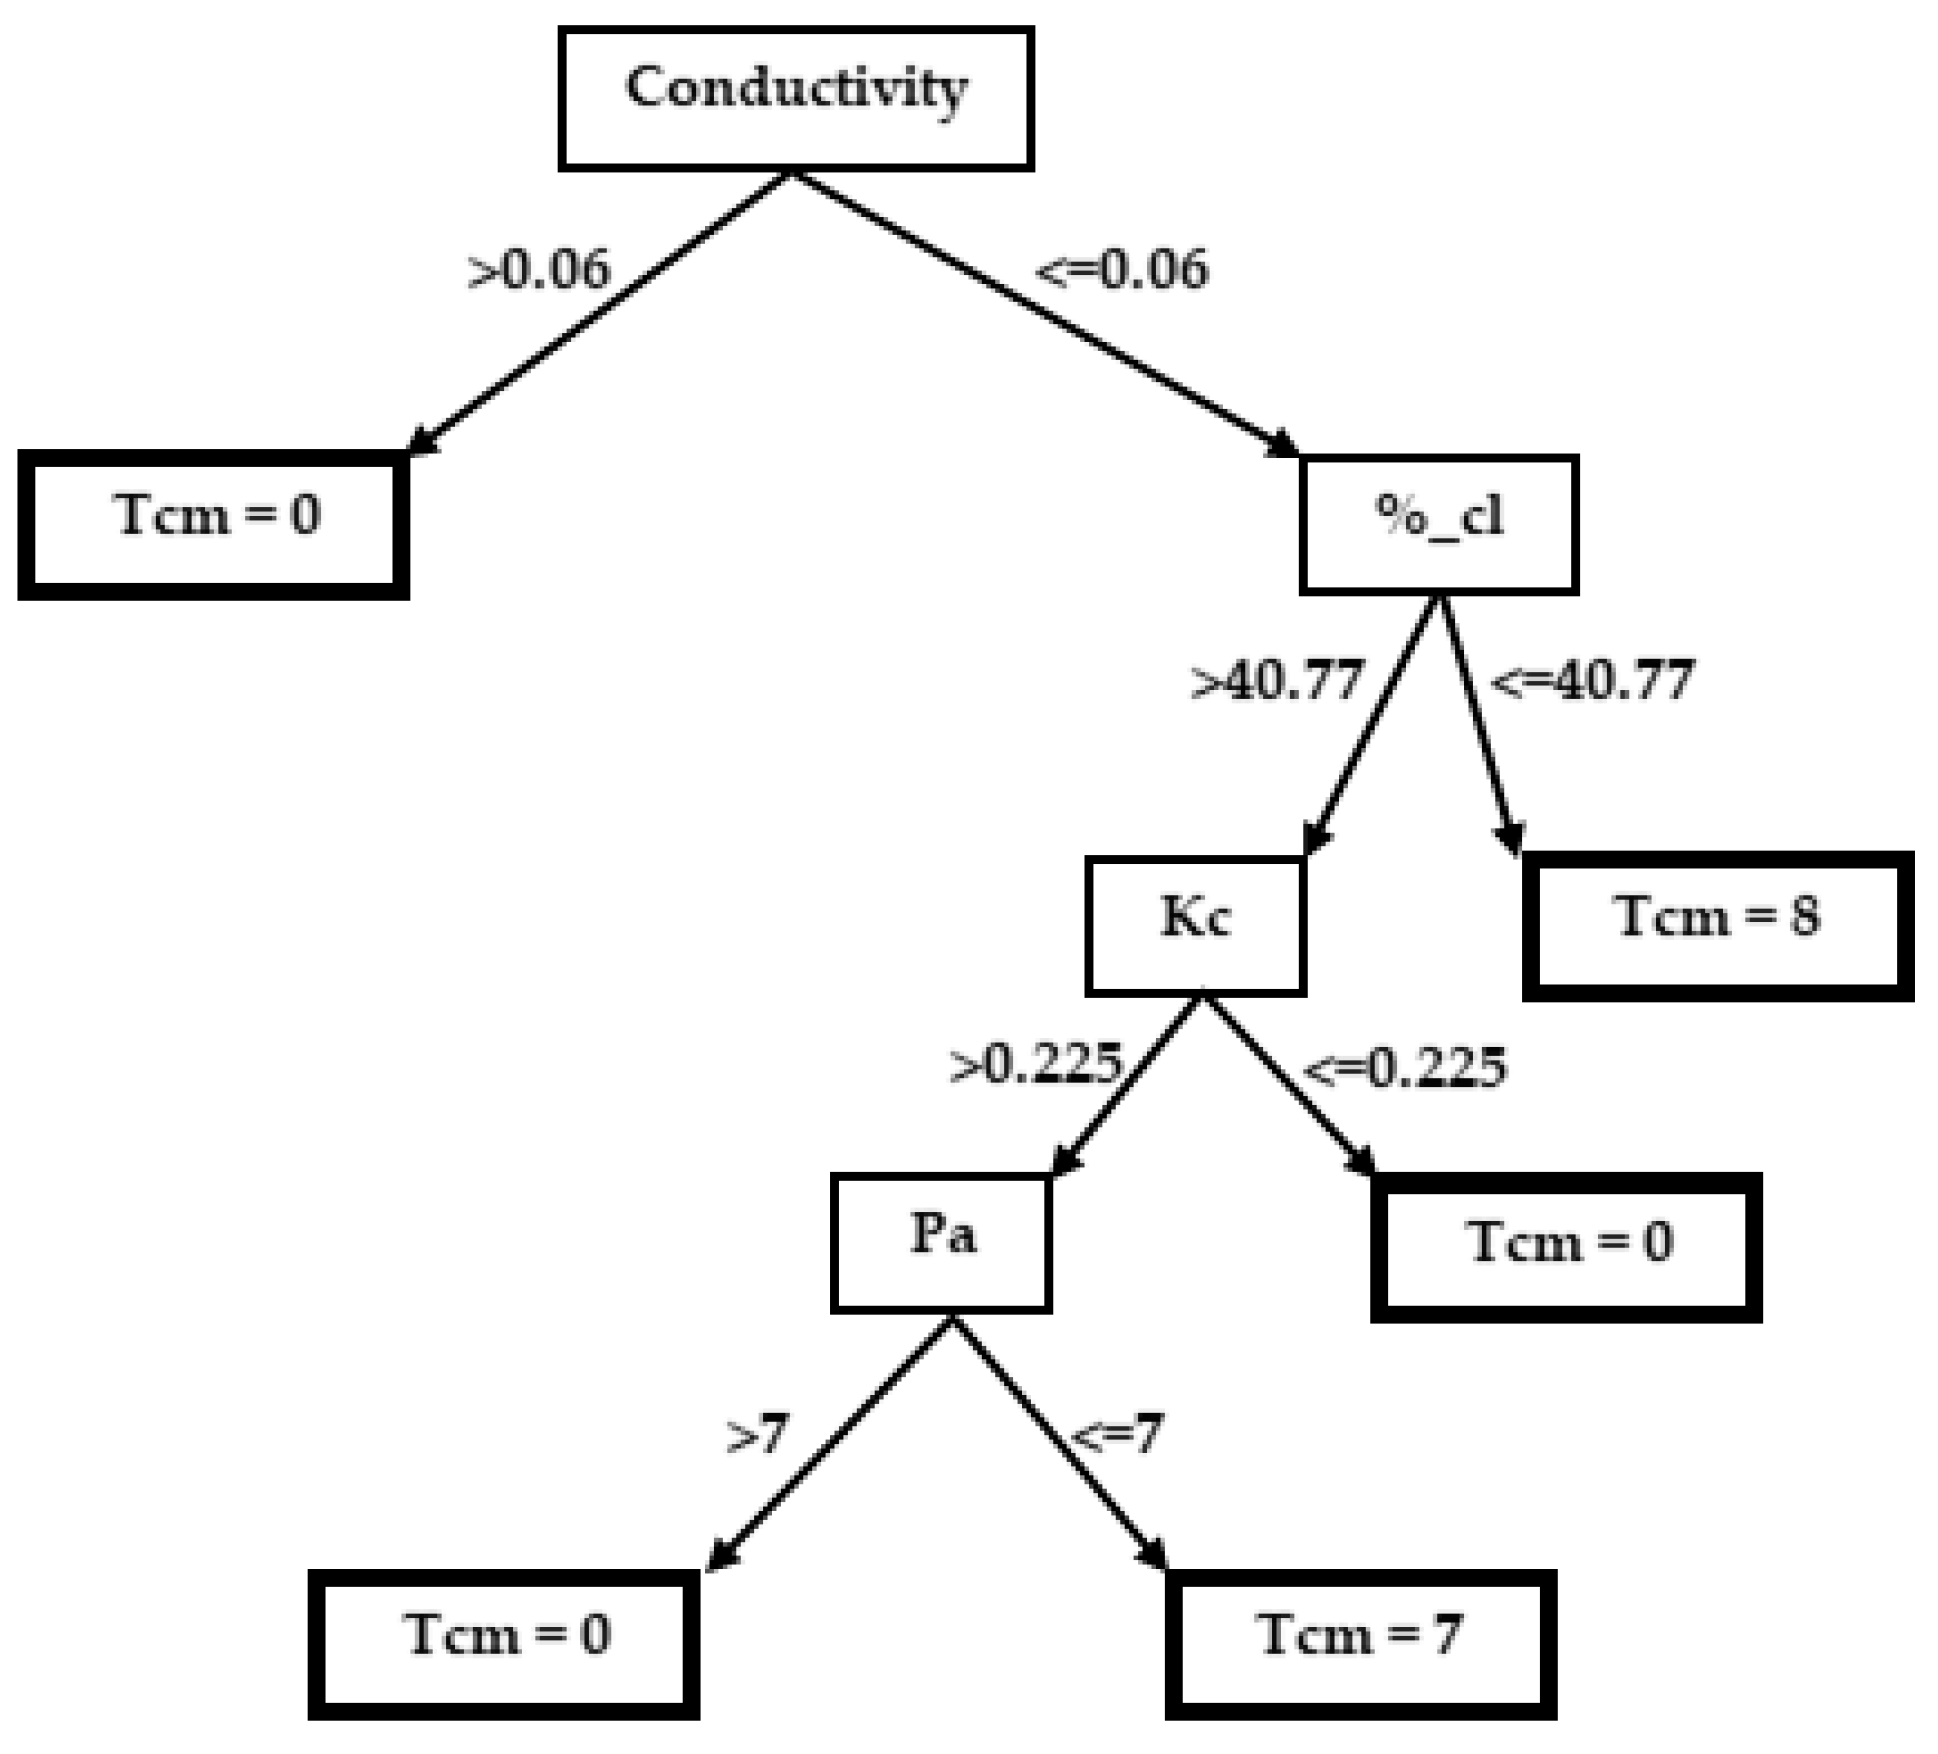
3.2.2. Taeniatherum caput-medusae

In the case of Taeniatherum caput-medusae, the parameters that have the greatest influence on the classification of this species according to the information gain are carbonates, with a value of 0.239, followed by conductivity, pH, Pa, Kc, pF 15 atm, and %_cl. The decision tree shows that this species is not found when conductivity acquires values of over 0.06 mmhos/cm, Tcm = 0, but if it has values of 0.06 mmhos/cm or less and %_cl of 40.77% or less, the abundance value for this species rises to 8 in the Van der Maarel index; if %_cl is over 40.77%, Kc over 0.225 cmol/kg and Pa 7 p.p.m. or less, the species abundance is Tcm = 7.
The soil attributes ordered by information gain for the species T. caput-medusae are 0.239 carbonates; 0.218 EC (conductivity); 0.211 pH; 0.184 Pa; 0.142 Kc; 0.123 pF 15 atm; and 0.12 %_cl (Figure 4).

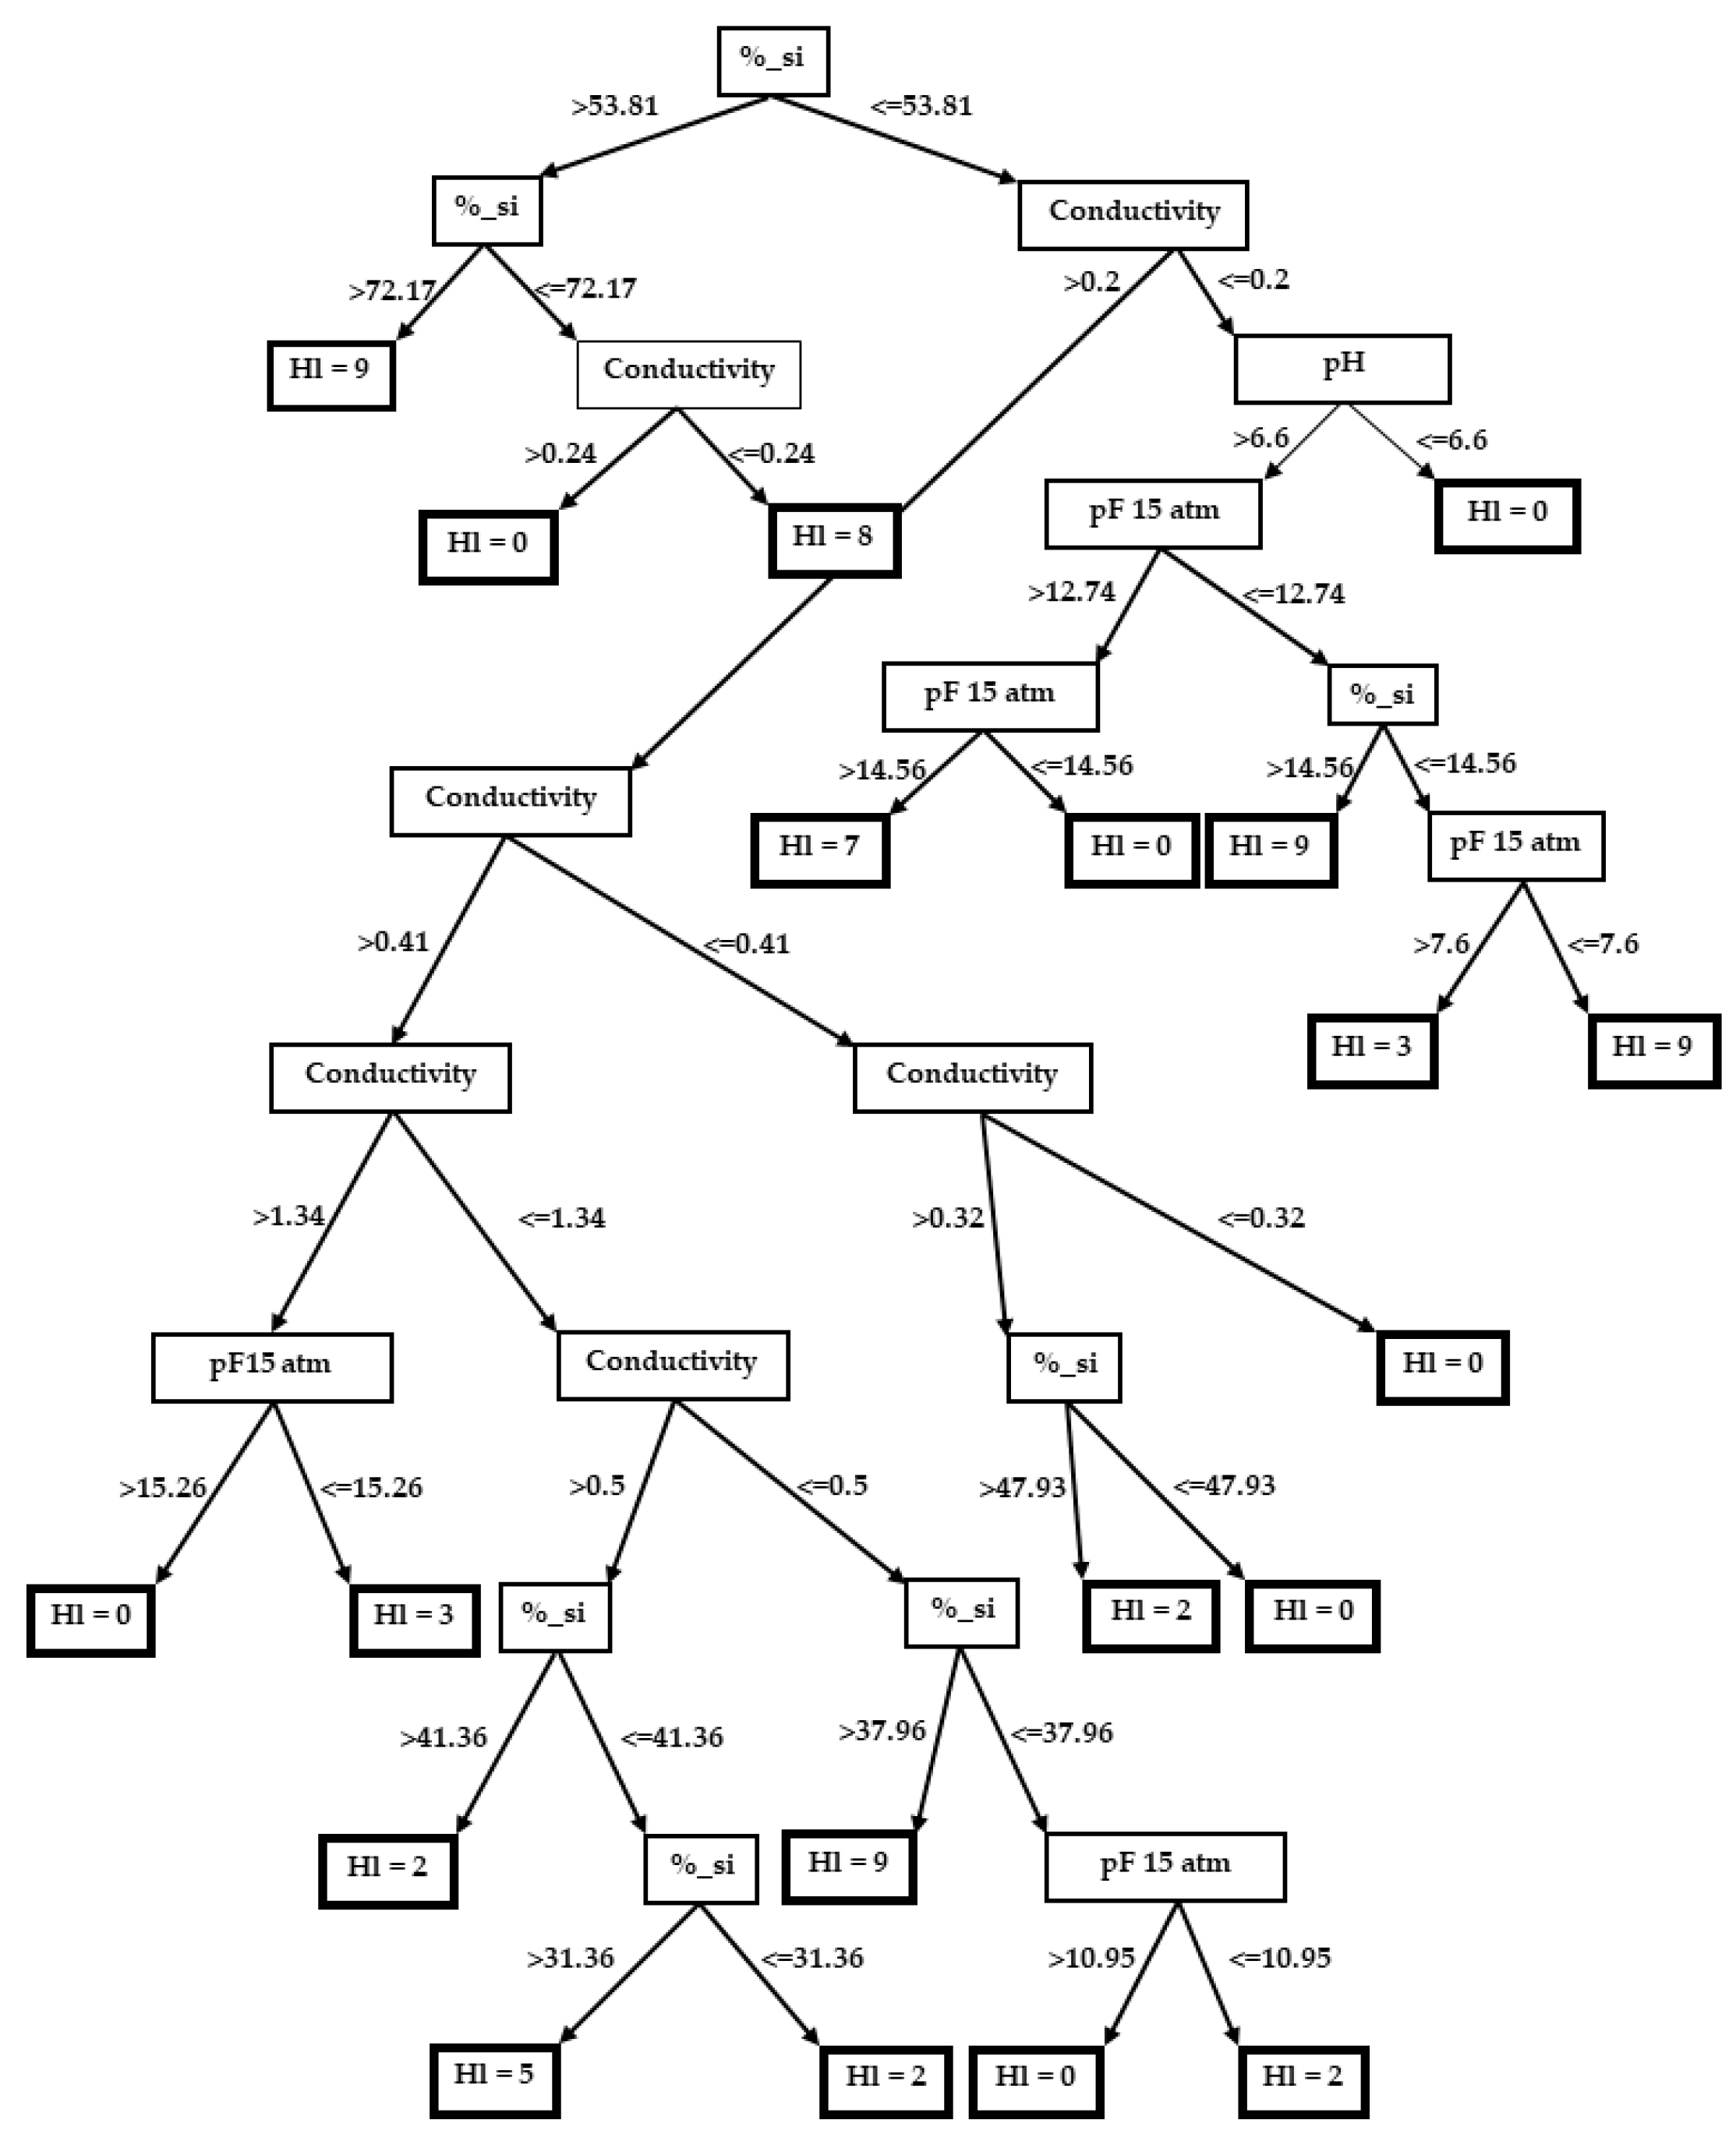
3.2.3. Hordeum leporinum

The soil attributes that have the greatest influence on the classification of these species are conductivity, %_si, pH, and pF 15 atm, with conductivity exerting the greatest influence. The decision tree for this species shows that different paths can be taken to reach a Van der Maarel value of 9 for Hordeum leporinum, so that if we start with a %_si of over 72.17%, we reach an abundance of 9 for H. leporinum (Van der Maarel), and if %_si is over 53.81% and less than or equal to 72.17%, and conductivity is over 0.24 mmhos/cm, this species is not present. The other methods for obtaining the maximum abundance value for this species is the path of %_si < = 53.81.
The soil attributes ordered by information gain for the species H. leporinum are 0.285 EC (conductivity); 0.148%_si; 0.119 pH; 0.11 pF 15 atm; 0.0 OOM; 0.0 Mgc; 0.0 CEC; 0.0 Pa; 0.0 carbonates; 0.0%_cl; 0.0 Sieve_2 mm; 0.0%_sa; 0.0 Nt; 0.0 pF 13 atm; and 0. 0 Kc (Figure 5).

3.2.4. Glebionis discolor (=Chrysanthemum coronarium var. discolor)

According to the information gain for the soil attributes, conductivity has the greatest influence on the classification of Glebionis discolor. The participation of the rest of the soil parameters and their different abundance values in this species can be seen in its decision tree.
The attributes ordered by information gain for the species G. discolor are 0.1881 EC (conductivity); 0.1755 pH; 0.1455 Kc; 0.1451 carbonates; 0.1369 Mgc; 0.1064 pF 15 atm; 0.925 CEC; 0.912%_sa; 0.896%_si; 0.0 Pa; 0.0 pF13 atm; 0.0%_cl; 0.0 OOM; and 0.0 Sieve_2mm; 0.0 Nt (Figure 6).

3.3. Soil Attributes of the Other Species Studied

Sylibum marianum (Spain). This species is classified by nine soil parameters out of the 16 studied that have the greatest influence in this order: Kc, conductivity, carbonates, Mgc, pH, pF 15 atm, %_sa, %_cl, and CEC. The decision tree for this species shows the values for these soil parameters that lead to a range of species abundances. The attributes ordered by information gain for the species S. marianum are 0.2166 Kc; 0.2158 EC (conductivity); 0.1976 carbonates; 0.1585 Mgc; 0.1416; pH; 0.1407 pF 15 atm; 0.1273; %_sa; 0.1266; %_cl; 0.984 CEC; 0.0 Pa; 0.0 Sieve_2 mm; 0.0 Nt; 0.0 pF 13 atm; and 0.0 OOM.
Avena barbata (Italy). The soil parameters that provide information for the classification of the species A. barbata are P, Na, electrical conductivity, and pH. The most influential of all these is P. The corresponding decision tree shows that the species is not present for values of P of 11.2 p.p.m. or less, and that A. barbata is present for values of P over 11.2 p.p.m., pH of 8.15 or less and Na of 0.43 cmol/kg or less, and with a Van der Maarel abundance value of 9. The attributes ordered by information gain for the species A. barbata (Italy) are 0.673 Pa; 0.444 Na; 0.378 EC (conductivity); 0.31 pH; 0.0%_si; 0.0 OOM; 0.0 Mgc; 0.0 CEC; 0.0 carbonates; 0.0 pF 13 atm; 0.0%_cl; 0.0 pF 15 atm; 0.0 Nt; and 0.0%_sa.

4. Discussion

Joint phytosociological and edaphic studies are not frequent, but there are many separate studies of both aspects. In this work, a clear relationship is established between the plant association and the soil on which it is found. The rapid identification of the dominant species and its abundance–dominance index presents the necessary information to know if there are nutritional deficiencies in the soil; this is fundamental for a sustainable and effective management of the crop, which allows favoring the use of vegetal covers and restricting the use of herbicides, less use of fertilizers and protection from the contamination of lakes, rivers, swamps, and crops. Many authors have worked on plant associations from the floristic point of view [4], others established relationships between plant associations and substrate [5,6,16,22,23,24], or works are being done on the value of plant covers to mitigate climate change [40], and certain species are even used as indicators of heavy ion pollutants in the soil [43]. There are also more studies with a strictly edaphic character [37].
The plant–soil relationship has been studied by different authors [44], revealing the relationship between certain species and some edaphic parameters: although soil fertility is often established using edaphic analysis techniques [45,46], there are no studies on the influence of nutrients on the abundance of species. For these reasons, vegetation covers, breakages, soil erosion, and water resources are studied to evaluate the environmental impact, such as soil loss and increased evapotranspiration [47,48,49]. In all cases, the authors made a diagnosis without deep knowledge about the plant–soil relationship, which moreover did not result, as in other work where for example in a contaminated soil with heavy metal, a close relationship was observed [43]. However, this last point is extremely interesting in our study, since it allows us to establish the influence of the substrate on the abundance–dominance of the species and vice versa: in such a way that, knowing the abundance of the species (decision trees), we know the type and amount of nutrients present in the soil. It is a hybrid method between phytosociology and edaphology, which is of interest to environmental and agricultural agencies, because it enhances sustainable agricultural development [50], avoiding impacts [51] and mitigating climate change, which is causing an irregularity in production and food security. While Peter et al. [52] propose the use of Google Earth to select the best biotopes for cultivation, this tool is useful but not satisfactory; the use of bioclimatic maps and the phytosociological study of plant covers is necessary to obtain the amount and type of nutrients ground. Cover crops are necessary to maintain the richness of rhizobacteria, which intervene in the assimilation of nutrients and in plant growth [53,54]. The cover crop acts as a protective element of the soils, which reduces evapotranspiration, minimizing crop irrigation [55,56], and not being necessary the breakages that destroy the soil mycorrhizae that allow the nitrogen entry into nodular systems [57,58,59,60,61]. Nitrogen fixation by mycorrhizal fungi is essential for sustainable cultivation to be productive [62,63,64]: for this, it is essential to know certain edaphic parameters, since within the Fabaceae family, there are species indifferent edaphic to pH, being able to be acidophilic exclusively or basophilic. Jakubus and Graczyk [65] studied the variability of edaphic microelements in fields with Lupinus albus L., oscillating the soil pH between 6.5–7.0, soils in which some of the associations that we study growth (TP, TT, PA and LR): favoring this type of cover crop, it would not be necessary to carry out organic and inorganic fertilizations [66].
However, [17] established an in-depth study of certain pasture and grassland plant associations, correlating the abundance of a certain species with the types and amounts of nutrients in the soil, using various statistical techniques: among which we highlight Bayesian networks and decision trees. As we can see in the results obtained, the amount and type of nutrients condition the presence of a species with a higher or lower abundance–dominance index. Consequently, knowing the value of the abundance–dominance index, it is possible to know what type and amount of nutrients exist in the soil. The greater or lesser abundance–dominance of a species is due to edaphic attributes. These are more influential than others, and this means that there are various routes that culminate in an abundance value of the species. As an example, in the specific case of Plantago bellardii, it is fundamentally conditioned by pF15 atm, conductivity, and pH. In the case of Hordeum leporinum, it is the silt texture that determines high or low values of this species.

5. Conclusions

This work demonstrates the importance of the soil–plant relation. The combination of phytosociological and soil analyses highlights the advances in the knowledge of the soil ecology of the plants. The study of the plant–soil relation using new methodologies that consider phytosociological, soil, and statistical aspects provides important information on the nutritional status of the soil. This is essential for improving crop yields, which can be achieved quickly by knowing the abundance of the dominant species in the plant association. Both the Bayesian analysis and the decision trees clearly establish the soil values for the abundance of a particular species. Therefore, if we know the abundance of a plant, we also know the amount of nutrients present in the soil. In this study, we have used several species, and we have observed that the soil attributes that most affect the presence or absence and abundance of a species, ordered according to the Information Gain (IG), are different for each species (decision trees). A species’ abundance values, taking into account prior evidence, indicate the soil nutrients (Bayesian analysis).
This is a new method, in which the knowledge of plant communities becomes very important. These plant communities are dominated by a certain species, which is a domain that is a consequence of the values acquired by different edaphic parameters. In the decision trees that we present for several species, dominant in a given association, edaphic nutrient values are established for a given abundance of the species. This fact acquires a high value in agriculture, since knowing the vegetal association and the abundance of the dominant species, we deduce the nutritional state of the soil.
We are sure that it is a work that improves the ability to predict changes in the plant community, in response to soil modification: this is very valuable to support the decision of environmental and agricultural agencies and decide interventions in the soil on the nutrient content.

Author Contributions

Conceptualization, A.C.-O. and E.C.; Data curation, A.C.-O., C.M.M., J.C.P.F., C.J.P.G., R.Q.-C., S.d.R. and E.C.; Formal analysis, A.C.-O., C.M.M., J.C.P.F., C.J.P.G., S.d.R. and E.C.; Funding acquisition, E.C.; Investigation, A.C.-O. and E.C.; Methodology, A.C.-O. and E.C.; Project administration, E.C.; Resources, A.C.-O. and E.C.; Supervision, A.C.-O., C.M.M. and E.C.; Validation, A.C.-O., C.M.M., S.d.R. and E.C.; Visualization, A.C.-O., C.M.M., R.Q.-C. and E.C.; Writing—original draft, A.C.-O., C.M.M. and E.C.; Writing—review and editing, C.M.M., J.C.P.F., C.J.P.G., R.Q.-C. and S.d.R. All authors have read and agreed to the published version of the manuscript.

Funding

This research received no external funding.

Acknowledgments

The authors are very grateful to the two anonymous referees for their suggestions and corrections for improving the original manuscript.

Conflicts of Interest

The authors declare no conflict of interest.

References

  1. Cano-Ortiz, A.; Pinto Gomes, C.J.; Cano, E. Current situation of the Gaudinio fragilis—Hordeion bulbosi alliance in the Iberian Peninsula. Acta Bot. Gall. 2009, 156, 19–31. [Google Scholar] [CrossRef] [Green Version]
  2. Perrino, E.V.; Ladisa, G.; Calabrese, G. Flora and plant genetic resources of ancient olive groves of Apulia (southern Italy). Genet. Resour. Crop Evol. 2014, 61, 23–53. [Google Scholar] [CrossRef]
  3. Perrino, E.V.; Magazzini, P.; Musarella, C.M. Management of grazing “buffalo” to preserve habitats by Directive 92/43 EEC in a wetland protected area of the Mediterranean coast: Palude Frattarolo, Apulia, Italy. Euro-Mediterr. J. Environ. Integr. 2020, in press. [Google Scholar]
  4. García Fuentes, A.; Cano, E. Malas Hierbas del Olivar Giennense; Instituto de Estudios Giennenses: Jaén, Spain, 1996; 213p. [Google Scholar]
  5. Pastor Muñoz-Cobo, M. Estudio de Diversos Métodos de Manejo del Suelo Alternativos al Laboreo en el Cultivo del Olivo; Instituto de Estudios Giennenses: Jaén, Spain, 1991; 302p. [Google Scholar]
  6. Saavedra Saavedra, M.M.; Pastor Muñoz-Cobo, M. Sistemas de Cultivo en Olivar; Agrícola Española, S.A., Ed.; Manejo de mals hierbas y herbicidas: Madrid, Spain, 2002; 429p. [Google Scholar]
  7. Giusso del Galdo, G.; Marcenò, C.; Musarella, C.M.; Sciandrello, S. La vegetazione costiera della R.N.O. “Torre Salsa” (Siculiana—AG). Inf. Bot. Ital. 2008, 40, 73–89. [Google Scholar]
  8. Mendes, P.; Meireles, C.; Vila-Viçosa, C.; Musarella, C.M.; Pinto-Gomes, C. Best management practices to face degraded territories occupied by Cistus ladanifer shrublands—Portugal case study. Plant Biosyst. 2015, 149, 494–502. [Google Scholar] [CrossRef] [Green Version]
  9. Signorino, G.; Cannavò, S.; Crisafulli, A.; Musarella, C.M.; Spampinato, G. Fagonia cretica L. In Schede per una Lista Rossa della Flora vascolare e crittogamica Italiana. Inf. Bot. Ital. 2011, 43, 381–458. [Google Scholar]
  10. Puglisi, M.; Sciandrello, S.; Musarella, C.M.; Spampinato, G.; Privitera, M.; Tomaselli, V. Bryosociological remarks on garrigue environments in Apulia Region (Southern Italy). Plant Sociol. 2019, 56, 43–52. [Google Scholar] [CrossRef]
  11. Quinto-Canas, R.; Mendes, P.; Cano-Ortiz, A.; Musarella, C.M.; Pinto-Gomes, C. Forest fringe communities of the southwestern Iberian Peninsula. Rev. Chapingo Ser. Cienc. 2018, 24, 415–434. [Google Scholar] [CrossRef]
  12. Sciandrello, S.; Musarella, C.M.; Puglisi, M.; Spampinato, G.; Tomaselli, V.; Minissale, P. Updated and new insights on the coastal halophilous vegetation of southeastern Sicily (Italy). Plant Sociol. 2019, 56, 81–98. [Google Scholar] [CrossRef]
  13. Spampinato, G.; Musarella, C.M.; Cano-Ortiz, A.; Signorino, G. Habitat, occurrence and conservation status of the Saharo-Macaronesian and Southern-Mediterranean element Fagonia cretica L. (Zygophyllaceae) in Italy. J. Arid Land 2018, 10, 140–151. [Google Scholar] [CrossRef] [Green Version]
  14. Spampinato, G.; Sciandrello, S.; del Galdo, G.; Puglisi, M.; Tomaselli, V.; Cannavò, S.; Musarella, C.M. Contribution to the knowledge of Mediterranean wetland biodiversity: Plant communities of the Aquila Lake (Calabria, Southern Italy). Plant Sociol. 2019, 56, 53–68. [Google Scholar] [CrossRef]
  15. Fanfarillo, E.; Latini, M.; Iberite, M.; Bonari, G.; Nicolella, G.; Rosati, L.; Salerno, G.; Abbate, G. The segetal flora of winter cereals and allied crops in Italy: Species inventory with chorological, structural and ecological features. Plant Biosyst. 2020, 154, 935–946. [Google Scholar] [CrossRef]
  16. Cano-Ortiz, A.; Biondi, E.; Pinto-Gomes, C.J.; Del Río González, S.; Cano, E. Soil and phytosociological characterization of grasslands in the western Mediterranean. Am. J. Plant Sci. 2014, 5, 3213–3240. [Google Scholar] [CrossRef] [Green Version]
  17. Cano-Ortiz, A. Bioindicadores ecológicos y manejo de cubiertas vegetales como herramienta para la implantación de una agricultura sostenible. Ph.D. Thesis, University of Jaén, Jaén, Spain, 2007. [Google Scholar]
  18. Taffetani, F.; Rismondo, M. Bioindicator system for the evaluation of the environmental quality of agro-ecosystems. Fitosociologia 2009, 46, 3–22. [Google Scholar]
  19. Baldoni, M.; Biondi, E.; Loiotile, A. La vegetazione infestante i vigneti nelle Marche. Fitosociologia 2001, 38, 63–68. [Google Scholar]
  20. Biondi, E.; Baldoni, M. La vegetazione di margine stradale dell’ordine Brometalia rubenti-tectori nell’Italia Centrale. Ann. Bot. 1991, 49 (Suppl. 8), 214–217. [Google Scholar]
  21. Biondi, E.; Bagella, S.; Casavecchia, S.; Pinzi, M.; Vagge, I. La vegetazione a Dasypyrum villosum (L.) P. Candargy lungo le coste dell’Italia Settentrionale. Doc. Phytosociol. 1999, 19, 439–446. [Google Scholar]
  22. Cano-Ortiz, A.; Pinto-Gomes, C.J.; Esteban Ruiz, F.J.; Rodríguez Torres, A.; Goñi, J.; De la Haza, I.; Cano, E. Biodiversity of Hordeion leporini in Portugal: A phytosociological and edaphic análisis. Acta Bot. Gall. 2009, 156, 33–48. [Google Scholar] [CrossRef] [Green Version]
  23. Cano-Ortiz, A.; Pinto-Gomes, C.J.; Esteban Ruiz, F.J.; Cano, E. Determination of the nutritional state of soils by means of the phytosociological method and different statistical techniques (Bayesian statistics and decision trees) in Spain. Acta Bot. Gall. 2009, 156, 607–624. [Google Scholar] [CrossRef] [Green Version]
  24. Cano-Ortiz, A.; Pinto-Gomes, C.J.; Cano, E. Contribution to the study of the Taeniathero-Aegilopion geniculatae alliance in Portugal. Acta Bot. Gall. 2010, 157, 599–610. [Google Scholar] [CrossRef] [Green Version]
  25. Quinto-Canas, R.; Mendes, P.; Cano-Ortiz, A.; Musarella, C.M.; Pinto-Gomes, C. The Agrostion castellanae Rivas Goday 1957 corr. Rivas Goday & Rivas-Martínez 1963 alliance in the southwestern Iberian Peninsula. Plant Sociol. 2018, 55, 21–29. [Google Scholar] [CrossRef]
  26. Rivas-Martínez, S. La vegetación de Hordeion leporini en España. Doc. Phytosoc. 1978, 9, 377–392. [Google Scholar]
  27. Di Pietro, R.; Theurillat, J.P.; Capelo, J.; Fernández-González, F.; Terzi, M.; Carni, A.; Mucina, L. Nomenclature and syntaxonomic notes on some high-rank syntaxa of the European grassland vegetation. Lazaroa 2015, 36, 79–106. [Google Scholar] [CrossRef]
  28. Fanfarillo, E.; Moretti, M.; Abbate, G. The anthropogenic grasslands of the Securigero securidacae-Dasypyrion villosi in central mediterranean areas: Synecology, distribution and syntaxonomy. Ann. Bot. 2019, 9, 1–38. [Google Scholar] [CrossRef]
  29. Perrino, E.V.; Tomaselli, V.; Signorile, G.; Angiulli, F.; Silletti, G. Vegetation to Crambe hispanica L. in Apulia Region (Vegetazione a Crambe hispanica L. in Puglia). Fitosociologia 2011, 48, 99–107. [Google Scholar]
  30. Cano, E.; Musarella, C.M.; Cano-Ortiz, A.; Piñar Fuentes, J.C.; Spampinato, G.; Pinto Gomes, C.J. Morphometric analysis bioclimatic distribution of Glebionis coronaria s.l. (Asteraceae) in the Mediterranean area. PhytoKeys 2017, 81, 103–126. [Google Scholar] [CrossRef] [PubMed]
  31. Perrino, E.V.; Tomaselli, V.; Costa, R.; Pavone, P. Conservation status of habitats (Directive 92/43 EEC) of coastal and low hill belts in a mediterranean biodiversity hot spot (Gargano—Italy). Plant Biosyst. 2013, 147, 1006–1028. [Google Scholar] [CrossRef]
  32. Perrino, E.V.; Calabrese, G. Endangered segetal species in southern Italy: Distribution, conservation status, trends, actions and ethnobotanical notes. Genet. Resour. Crop. Evol. 2018, 65, 2107–2134. [Google Scholar] [CrossRef]
  33. Pesaresi, S.; Galdenzi, D.; Biondi, E.; Casavecchia, S. Bioclimate of Italy: Application of the worldwide bioclimatic classification system. J. Maps 2014, 10, 538–553. [Google Scholar] [CrossRef]
  34. Pesaresi, S.; Biondi, E.; Casavecchia, S. Bioclimates of Italy. J. Maps 2017, 13, 955–960. [Google Scholar] [CrossRef]
  35. Sirsat, M.S.; Cernadas, E.; Fernández-Delgado, M.; Khan, R. Classification of agricultural soil parameters in India. Comput. Electron. Agric. 2017, 135, 269–279. [Google Scholar] [CrossRef]
  36. De Freitas, W.K.; Portz, A.; de Carvalho Peres, A.A.; Martinez Tarré, R.; de Melo Campos, M. Soil nutrient content and plant phytosociology in agroforestry systems of the Rio de Janeiro State highlands, Brazil. Acta Sci. Biol. Sci. 2018, 40, e35368. [Google Scholar] [CrossRef] [Green Version]
  37. Mansouri, M.; Dumont, B.; Leemans, V.; Destain, M.-F. Bayesian methods for predicting LAI and soil water Content. Precision. Agric. 2014, 15, 184–201. [Google Scholar] [CrossRef] [Green Version]
  38. Suchithra, M.S.; Pai, M.L. Improving the prediction accuracy of soil nutrient classification by optimizing extreme learning machine parameters. Inf. Process. Agric. 2019, 7, 72–82. [Google Scholar] [CrossRef]
  39. Braun-Blanquet, J.; Fitosociología, J. Bases para el Estudio de las Comunidades Vegetales; Ediciones Blume: Madrid, Spain, 1979. [Google Scholar]
  40. Van der Maarel, E. Transformation of cover-abundance values in phytosociology and its effects on community similarity. Vegetatio 1979, 39, 97–114. [Google Scholar]
  41. Cano, E.; Cano-Ortiz, A.; Musarella, C.M.; Piñar Fuentes, J.C.; Ighbareyeh, J.M.H.; Leiva Gea, F.; del Río, S. Mitigating Climate Change Through Bioclimatic Applications and Cultivation Techniques in Agriculture (Andalusia, Spain). In Sustainable Agriculture, Forest and Environmental; Jhariya, M.K., Banerjee, A., Meena, R.S., Yadav, D.K., Eds.; Springer Nature: Singapore, 2019; pp. 31–69. [Google Scholar]
  42. Rivas-Martínez, S.; Díez, T.E.; Fernandez-González, F.; Izco, J.; Loidi, J.; Lousã, M.; Penas, A. Vascular Plant Communities of Spain and Portugal. Part II. Itinera Geobotánica 2002, 15, 433–922. [Google Scholar]
  43. Perrino, E.V.; Brunetti, G.; Farrag, K. Plant communities of multi-metal contaminated soils: A case study in National Park of Alta Murgia (Apulia Region—Southern Italy). Int. J. Phytoremed. 2014, 16, 871–888. [Google Scholar] [CrossRef]
  44. Bank, R.R. Intraspecific and interspecific pair-wise seedling competition between exotic annual grasses and native perennials: Plant-soil relationship. Plant Soil 2010, 326, 331–343. [Google Scholar] [CrossRef]
  45. Shiwakoti, S.; Zheljazkov, V.D.; Gollany, H.T.; Kleber, M.; Xing, B. Macronutrients in Soil and Wheat as Affected by a Long-Term Tillage and Nitrogen Fertilization in Winter Wheat–Fallow Rotation. Agronomy 2019, 9, 178. [Google Scholar] [CrossRef] [Green Version]
  46. Ordoñez, J.C.; Van Bodegom, P.M.; Witte, J.P.H.; Wright, I.J.; Reich, P.B.; Aerts, R. A global study of relationships between leaf traits, climate and soil measures of nutrient fertility. Glob. Ecol. Biogeogr. 2009, 18, 137–149. [Google Scholar] [CrossRef]
  47. López-Felices, B.; Aznar-Sánchez, J.A.; Velasco-Muñoz, J.F.; Piquer-Rodríguez Mª. Contribution of irrigation ponds to the sustainability of agriculture. A review of worldwide research. Sustainability 2020, 12, 5425. [Google Scholar] [CrossRef]
  48. Zhang, X.; Zhao, W.; Wang, L.; Liu, Y.; Feng, Q.; Fang, X.; Liu, Y. Distribution of Shrubland and Grassland Soil Erodibility on the Loess Plateau. Int. J. Environ. Res. Public Health 2018, 15, 1193. [Google Scholar] [CrossRef] [Green Version]
  49. Pastor, J.; Lacasta, C.; Hernández, A.J. Evaluación de las cubiertas vegetales en el olivar de una zona semiárida del centro de España. Edafología 2000, 7, 165–175. [Google Scholar]
  50. Jeong, J.; Zhang, X. Model Application for Sustainable Agricultural Water Use. Agronomy 2020, 10, 396. [Google Scholar] [CrossRef] [Green Version]
  51. Maffia, A.; Pergola, M.; Palese, A.M.; Celano, G. Environmental Impact Assessment of Organic vs. Integrated Olive-Oil Systems in Mediterranean Context. Agronomy 2020, 10, 416. [Google Scholar] [CrossRef] [Green Version]
  52. Peter, B.G.; Messina, J.P.; Lin, Z.; Snapp, S.S. Crop climate suitability mapping on the cloud: A geovisualization application for sustainable agriculture. Sci. Rep. 2020, 10, 15487. [Google Scholar] [CrossRef]
  53. Bhattacharyya, C.; Banerjee, S.; Acharya, U.; Mitra, A.; Mallick, I.; Haldar, A.; Haldar, S.; Ghosh, A.; Ghosh, A. Evaluation of plant growth promotion properties and inductionof antioxidative defense mechanism by tea rhizobacteria of Darjeeling, India. Sci. Rep. 2020, 10, 15536. [Google Scholar] [CrossRef]
  54. Sahib, M.R.; Pervaiz, Z.H.; Williams, M.A.; Saleem, M.; DeBolt, S. Rhizobacterial species richness improves sorghum growth and soil nutrient synergism in a nutrient-poor greenhouse soil. Sci. Rep. 2020, 10, 15454. [Google Scholar] [CrossRef]
  55. Igor, B.; Leon Josip, T.; Paulo, P. Agriculture Management Impacts on Soil Properties and Hydrological Response in Istria (Croatia). Agronomy 2020, 10, 282. [Google Scholar] [CrossRef] [Green Version]
  56. He, J.; Jin, Y.; Turner, N.C.; Li, F.-M. Irrigation during Flowering Improves Subsoil Water Uptake and Grain Yield in Rainfed Soybean. Agronomy 2020, 10, 120. [Google Scholar] [CrossRef] [Green Version]
  57. Caser, M.; Demasi, S.; Victorino, Í.M.M.; Donno, D.; Faccio, A.; Lumini, E.; Bianciotto, V.; Scariot, V. Arbuscular Mycorrhizal Fungi Modulate the Crop Performance and Metabolic Profile of Saffron in Soilless Cultivation. Agronomy 2019, 9, 232. [Google Scholar] [CrossRef] [Green Version]
  58. Zhang, R.; Wang, C.; Teng, W.; Wang, J.; Lyu, X.; Dong, S.; Kang, S.; Gong, Z.; Ma, C. Accumulation and Distribution of Fertilizer Nitrogen and Nodule-Fixed Nitrogen in Soybeans with Dual Root Systems. Agronomy 2020, 10, 397. [Google Scholar] [CrossRef] [Green Version]
  59. Dhalaria, R.; Kumar, D.; Kumar, H.; Nepovimova, E.; Kuča, K.; Torequl Islam, M.; Verma, R. Arbuscular Mycorrhizal Fungi as Potential Agents in Ameliorating Heavy Metal Stress in Plants. Agronomy 2020, 10, 815. [Google Scholar] [CrossRef]
  60. Allito, B.B.; Ewusi-Mensah, N.; Logah, V. Legume-Rhizobium Strain Specificity Enhances Nutrition and Nitrogen Fixation in Faba Bean (Vicia faba L.). Agronomy 2020, 10, 826. [Google Scholar] [CrossRef]
  61. Kalembasa, S.; Szukała, J.; Faligowska, A.; Kalembasa, D.; Symanowicz, B.; Becher, M.; Gebus-Czupyt, B. Quantification of Biologically Fixed Nitrogen by White Lupin (Lupins albus L.) and Its Subsequent Uptake by Winter Wheat Using the 15N Isotope Dilution Method. Agronomy 2020, 10, 1392. [Google Scholar] [CrossRef]
  62. Nagaraj, K.; Vanishree, S.; Muthukumar, T. Genotypic variation in response and dependency of Cajanus cajan (L.) Millsp., on arbuscular mycorrhizal fungi in a tropical Alfisol. Plant Biosyst. 2020, 1–13. [Google Scholar] [CrossRef]
  63. Püschel, D.; Janoušková, M.; Voříšková, A.; Gryndlerová, H.; Vosátka, M.; Jansa, J. Arbuscular mycorrhiza stimulates biological nitrogen fixation in two Medicago spp. through improved phosphorus acquisition. Front Plant Sci. 2017, 8, 390. [Google Scholar] [CrossRef] [Green Version]
  64. van der Heijden, M.G.A.; de Bruin, S.; Luckerhoff, L.; van Logtestijn, R.S.P.; Schlaeppi, K. A widespread plant-fungal-bacterial symbiosis promotes plant biodiversity, plant nutrition and seedling recruitment. ISME J. 2016, 10, 389–399. [Google Scholar] [CrossRef] [Green Version]
  65. Jakubus, M.; Graczyk, M. Microelement Variability in Plants as an Effect of Sewage Sludge Compost Application Assessed by Different Statistical Methods. Agronomy 2020, 10, 642. [Google Scholar] [CrossRef]
  66. Liu, L.; Li, C.; Zhu, S.; Xu, Y.; Li, H.; Zheng, X.; Shi, R. Combined Application of Organic and Inorganic Nitrogen Fertilizers Affects Soil Prokaryotic Communities Compositions. Agronomy 2020, 10, 132. [Google Scholar] [CrossRef] [Green Version]
Figure 1. Location of the associations studied in Spain and Portugal.
Agronomy 11 00001 g001
Figure 2. Canonical correspondence analysis (CCA) (axes F1 and F2: 46.62%). This figure shows the dominant species of each plant association, together with the associations and edaphic attributes. CCA analysis. Ag = Aegilops geniculata Roth; Ar = Anacyclus radiatus Loisel; Bh = Bromus hordeaceus L.; Chco = Glebionis discolor (d’Urv.) E. Cano et al. (=Chrysanthemum coronarium L. var. discolor d’Urv.); Hl = Hordeum leporinum Link; Mn = Malva neglecta Wallr.; Pr = Papaver rhoeas L.; Pb = Plantago bellardii All.; Rr = Raphanus raphanistrum L.; Sam = Sinapis alba L. subsp. mairei (H. Lindb.) Maire; Sima = Silibum marianum (L.) Gaert.; Tcm = Taeniatherum caput-medusae (L.) Nevski; Xg = Xolantha guttata (L.) Raf.; AcH: Anacyclo clavati-Hordeetum leporini. ArH: Anacyclo radiati-Hordeetum leporini. ArP: Anacyclo radiati-Papaveretum rhoeadis. ArChr: Anacyclo radiati-Chrysanthemetum coronarii. BH: Bromo scoparii-Hordeetum leporini. CS: Carduo bourgeani-Silybetum mariani. FS: Fedio cornucopiae-Simapietum mairei. LR: Linario spartei-Raphanetum raphanistri. PD: Papaveri rhoeadis-Diplotaxietum virgatae. PA: Plantagini bellardii-Aegilopetum geniculatae. RChr: Resedo albae-Chrysanthemetum coronarii. TT: Trifolio cherleri-Taeniatheretum capitis-medusae. TP: Trifolio cherleri-Plantaginetum bellardii. UM: Urtico urentis-Malvetum neglectae. (See acronyms of edaphic factors in Table 2).
Agronomy 11 00001 g002
Figure 3. Decision tree for Pb = Plantago bellardii All. The numbering inside the boxes represents the abundance–dominance index converted to Van der Maarel [40]. The other numbering corresponds to the range of values of the edaphic attributes.
Agronomy 11 00001 g003
Figure 4. Decision tree for Tcm = Taeniatherum caput-medusae. The numbering inside the boxes represents the abundance–dominance index converted to Van der Maarel [40]. The other numbering corresponds to the range of values of the edaphic attributes.
Agronomy 11 00001 g004
Figure 5. Decision tree for Hl = Hordeum leporinum. The numbering inside the boxes represents the abundance–dominance index converted to Van der Maarel [40]. The other numbering corresponds to the range of values of the edaphic attributes.
Agronomy 11 00001 g005
Figure 6. Decision tree for Chco = Glebionis discolor (=Chrysanthemum coronarium var. discolor). The numbering inside the boxes represents the abundance–dominance index converted to Van der Maarel [40]. The other numbering corresponds to the range of values of the edaphic attributes.
Agronomy 11 00001 g006
Table 1. Dominant species, countries, localities, dates of sampling, soil type and pH, pasture or grassland management, and references of the plant associations studied.
Plant AssociationDominant SpeciesCountryLocalityDateSoil Type and pHPasture or Grassland ManagementReference
AcHHordeum leporinumSpainJaénSpring 2005Cambisols, basicPasturage[22]
ArHHordeum leporinumPortugalEvoraSpring 2005Cambisols, acids and neutralTillage and herbicides[17]
BHHordeum leporinumSpainJaénSpring 2005Regosols, acidsPasturage[22]
LRRaphanus raphanistrumSpainJaénSpring 2005Cambisols, neutralTillage and herbicides[17]
PDDiplotaxis virgataSpainJaénSpring 2005Cambisols, basic and neutralTillage and herbicides[17,26]
ArPPapaver rhoeasPortugalEvoraSpring 2005Cambisols, neutralTillage and herbicides[17]
ArChrGlebionis coronariaPortugalEvoraSpring 2005Cambisols, neutralTillage and herbicides[16]
RChrGlebionis coronariaSpainJaénSpring 2005Cambisols, basicTillage and herbicides[17,26]
UMMalva neglectaSpainJaénSpring 2005Cambisols, indifferent pHTillage and herbicides[17]
PATriticum vagansPortugalEvoraSpring 2005Regosols, neutralPasturage[24]
TTTaeniatherum caput-medusaeSpainJaénSpring 2005Regosols, acidsPasturage[24]
TPPlantago bellardiiSpainJaénSpring 2005Regosols, acidsPasturage[17]
FSSinapis alba subsp. maireiSpainJaénSpring 2005Cambisols, basicTillage and herbicides[17]
CSSylibum marianumSpainJaénSpring 2005Cambisols, basic and neutralTillage and herbicides[17]
AcH: Anacyclo clavati-Hordeetum leporini. ArH: Anacyclo radiati-Hordeetum leporini. BH: Bromo scoparii-Hordeetum leporini. LR: Linario spartei-Raphanetum raphanistri. PD: Papaveri rhoeadis-Diplotaxietum virgatae. ArP: Anacyclo radiati-Papaveretum rhoeadis. ArChr: Anacyclo radiati-Chrysanthemetum coronarii. RChr: Resedo albae-Chrysanthemetum coronarii. UM: Urtico urentis-Malvetum neglectae. PA: Plantagini bellardii-Aegilopetum geniculatae. TT: Trifolio cherleri-Taeniatheretum capitis-medusae. TP: Trifolio cherleri-Plantaginetum bellardii. FS: Fedio cornucopiae-Simapietum mairei. CS: Carduo bourgeani-Silybetum mariani [17].
Table 2. Standard error for the edaphic parameters of the associations studied. CEC = cation-exchange capacity in cmol/kg; Nt = total nitrogen in %; Pa = assimilable phosphorous in ppm; Mgc = exchangeable magnesium in cmol/kg; Kc = exchangeable potassium in cmol/kg; %_Carb = carbonates in %; %_cl = clay texture in %; %_sa = sand texture in %; %_si = silt texture in %; pF 15 atm = pressure at 15 atmospheres (water retention capacity) in %; EC: conductivity in ds/m; pH.
Plant AssociationCECNtPaMgcKc%_Carb%_Cl%_ Sa%_SipF 15 AtmECpH
AcH0.5770.0071.5950.2170.3862.6413.0782.1903.8292.4350.0900.048
ArH0.6640.0122.2420.2770.0352.7161.8432.9351.7800.6590.0790.145
BH0.9640.0208.4200.1760.1011.6301.1643.4742.6530.8190.0120.146
LR0.6880.0040.7130.1230.0210.5721.9412.6331.5490.6640.1480.218
PD0.9210.0054.1040.2690.0663.4321.8901.5731.1910.8960.0130.025
ArP0.7420.2162.6070.2800.0564.2632.5252.8402.1450.8420.0090.134
ArChr0.9890.0343.2950.2010.1492.2231.9543.3811.7331.1040.0120.054
RChr1.0230.0318.5580.3060.4452.8692.9673.3033.0481.3250.1020.036
UM1.4600.06411.4500.2610.2904.3482.4344.1892.9441.5860.1290.124
PA0.6780.0091.8420.2400.0292.0342.2452.5112.1240.8190.0070.091
TT1.1270.0071.9890.1990.0150.1561.4094.1703.3260.7490.0010.074
TP0.3430.0052.1600.0580.0100.0911.0871.6781.7350.3550.0010.056
FS0.8580.0075.0760.7310.1182.6412.6142.2651.8401.0020.1800.042
CS1.0070.0246.5310.2020.2242.3032.0502.6052.1580.7240.0630.074
AcH: Anacyclo clavati-Hordeetum leporini. ArH: Anacyclo radiati-Hordeetum leporini. BH: Bromo scoparii-Hordeetum leporini. LR: Linario spartei-Raphanetum raphanistri. PD: Papaveri rhoeadis-Diplotaxietum virgatae. ArP: Anacyclo radiati-Papaveretum rhoeadis. ArChr: Anacyclo radiati-Chrysanthemetum coronarii. RChr: Resedo albae-Chrysanthemetum coronarii. UM: Urtico urentis-Malvetum neglectae. PA: Plantagini bellardii-Aegilopetum geniculatae. TT: Trifolio cherleri-Taeniatheretum capitis-medusae. TP: Trifolio cherleri-Plantaginetum bellardii. FS: Fedio cornucopiae-Simapietum mairei. CS: Carduo bourgeani-Silybetum mariani [17].
Table 3. Soil parameters of the herbaceous communities in the study. CEC = cation-exchange capacity in cmol/kg; Nt = total nitrogen in %; Pa = assimilable phosphorous in ppm; Mgc = exchangeable magnesium in cmol/kg; Kc = exchangeable potassium in cmol/kg; %_Carb = carbonates in %; %_cl = clay texture in %; %_sa = sand texture in %; %_si = silt texture in %; pF 15 atm = pressure at 15 atmospheres (water retention capacity) in %; EC: conductivity in ds/m; pH.
Plant AssociationCECNtPaMgcKc%_Carb%_Cl%_Sa%_SipF 15 AtmECpH
AcH15.30.19.71.60.747.5317.720.461.715.20.358.2
ArH9.10.113.91.80.28.1019.762.417.88.60.207.4
BH10.50.115.41.00.34.4914.554.231.28.20.127.4
LR6.60.04.80.80.22.5917.264.218.57.30.216.6
PD14.30.015.32.31.049.2840.019.940.019.10.288.0
ArP10.80.114.71.80.412.3825.345.628.913.00.167.6
ArChr12.30.126.92.10.67.5319.755.824.411.90.197.7
RChr11.60.120.92.71.435.5724.237.837.914.20.497.9
UM10.80.136.11.61.231.9621.246.032.713.10.567.7
PA10.50.15.61.70.23.5925.844.929.211.80.107.5
TT9.60.05.11.00.11.6413.564.921.46.60.046.1
TP5.20.05.20.50.11.449.675.414.84.70.046.0
FS12.20.013.12.80.852.1835.124.240.618.70.688.0
CS11.80.127.12.21.326.6125.545.628.412.00.448.18
AcH: Anacyclo clavati-Hordeetum leporini. ArH: Anacyclo radiati-Hordeetum leporini. BH: Bromo scoparii-Hordeetum leporini. LR: Linario spartei-Raphanetum raphanistri. PD: Papaveri rhoeadis-Diplotaxietum virgatae. ArP: Anacyclo radiati-Papaveretum rhoeadis. ArChr: Anacyclo radiati-Chrysanthemetum coronarii. RChr: Resedo albae-Chrysanthemetum coronarii. UM: Urtico urentis-Malvetum neglectae. PA: Plantagini bellardii-Aegilopetum geniculatae. TT: Trifolio cherleri-Taeniatheretum capitis-medusae. TP: Trifolio cherleri-Plantaginetum bellardii. FS: Fedio cornucopiae-Simapietum mairei. CS: Carduo bourgeani-Silybetum mariani [17].
Publisher’s Note: MDPI stays neutral with regard to jurisdictional claims in published maps and institutional affiliations.

