Article

Impact of Water Stress on Microbial Community and Activity in Sandy and Loamy Soils

by
Sylwia Siebielec
1,*,
Grzegorz Siebielec
2,
Agnieszka Klimkowicz-Pawlas
2,
Anna Gałązka
1,
Jarosław Grządziel
1 and
Tomasz Stuczyński
3
1
Department of Microbiology, Institute of Soil Science and Plant Cultivation—State Research Institute, Czartoryskich 8, 24-100 Pulawy, Poland
2
Department of Soil Science Erosion and Land Protection, Institute of Soil Science and Plant Cultivation—State Research Institute, Czartoryskich 8, 24-100 Pulawy, Poland
3
Faculty of Science and Health, The John Paul II Catholic University of Lublin, Konstantynów 1 H, 20-708 Lublin, Poland
*
Author to whom correspondence should be addressed.
Agronomy 2020, 10(9), 1429; https://doi.org/10.3390/agronomy10091429
Submission received: 14 August 2020 / Revised: 13 September 2020 / Accepted: 17 September 2020 / Published: 19 September 2020
(This article belongs to the Special Issue Climate Change, Agriculture, and Food Security)

Abstract

:
Prolonged drought and extreme precipitation can have a significant impact on the activity and structure of soil microbial communities. The aim of the study was to assess the impact of drought length on the dynamics of mineral nitrogen, enzyme activities and bacterial diversity in two soils of different texture (sand and silt loam, according to USDA classification). An additional objective was to evaluate the effect of compost on the alleviation of soil microbial responses to stress conditions, i.e. alternating periods of drought and excessive soil moisture. The pot study was carried out in a greenhouse under controlled conditions. Compost was added at an amount equal to 3% of soil to the sandy soil, which was characterised by a significantly lower water retention capacity. Specific levels of water stress conditions were created through application of drought and soil watering periods. For each soil, four levels of moisture regimes were set-up, including optimal conditions kept at 60% of field water holding capacity, and three levels of water stress: The low level—2 week period without watering; the medium level—1 month drought period followed by watering to full but short-term soil saturation with water; and the high level—2 month drought period followed by full and long-term saturation with the same total amount of water, as in other variants. The soil water regime strongly modified the activities of dehydrogenases and acid and alkaline phosphatase, as well as the bacterial diversity. Loamy soil exhibited greater resistance to the inhibition of soil enzymatic activity. After irrigation, following both a 1 month and 2 month drought, the enzyme activities and nitrification largely recovered in soil with a loamy texture. Drought induced substantial shifts in the functional diversity of bacterial communities. The use of such C substrates, as carboxylic and acetic acids, was strongly inhibited by water deficit. Water deficit induced changes in the relative abundances of particular phyla, for example, an increase in Acidobacteria or a decrease in Verrucomicrobia. The study clearly proves the greater susceptibility of microbial communities to drought in sandy soils and the important role of exogenous organic matter in protecting microbial activity in drought periods.

1. Introduction

Analysis of climatic data in recent years indicates that climate change is currently occurring, with an increase in temperature, no change in total precipitation and more frequent extreme events [1]. This situation has negative effects on the soil water balance. Hyncica and Huth observed that the ratio of solid to total precipitation significantly declines over large parts of Europe [2]. In the past, winter precipitation used to be a significant source of water for plant growth. Scenarios of climate change predict a decrease in average precipitation from May to October, i.e. during the period of intensive plant growth. The recent trends in temperature and precipitation sums and distribution over the growing season generate risks of soil drought, especially in light sandy soils. Summer precipitation is currently decreasing over a substantial part of Europe, and this is accompanied by the intensification of extreme precipitation events [3]. Soil can either not retain most of the water during intensive rainfall events or such events cause excessive soil moisture, depending on the texture and land relief. Grillakis reported that drought conditions are expected to exacerbate in Europe, with Eastern Europe and Mediterranean regions being the most affected areas [4].
For example, in 2015, the climatic water balance, i.e. the difference between rainfall and evapotranspiration, was extremely negative in the period from June to August across almost the entirety of Poland. National monitoring of agricultural drought in Poland revealed that a substantial threat of agricultural drought was recorded in 2010, 2011, 2013, 2015, 2017 and 2018 [5]. In each of these years, drought affected at least 10 crops. Particularly unfavourable conditions concerning water resources for arable crops occurred in 2015 and 2018, in which a water deficit was recorded for all 14 monitored crops [5].
Prolonged drought causes a significant loss in yield of susceptible crops and economic outcomes. At the same time, it can also have a significant impact on the activity and structure of the soil microbial communities [6,7,8]. A negative impact of soil drought on soil microorganisms might further enhance the susceptibility of crops to drought conditions. According to Milosevic et al. [9], microorganisms can support plant resistance to drought through a number of different mechanisms, for example: By producing polysaccharides that improve soil structure and water holding capacity; by producing deaminase, indoleacetic acid (IAA) and proline, which induce drought stress tolerance in crops; and by improving water circulation trough fungal mycelia. Furthermore, Nguyen et al. [10] documented that deleterious effects of prolonged drought on plant productivity had resulted from negative impacts on microbial abundance and community structure, and the linked reduction of nutrient availability.
It can also be assumed that sudden and significant changes in soil moisture, e.g. intensive rain after long drought, can significantly affect the functionality of microorganisms and the processes they control. Previous studies indicate that alternating periods of drought and excessive soil moisture might have a strong effect on soil biology [11]. According to Gleeson et al. [12], under conditions of soil saturation with water, after a long period of drought, lysis of microbial cells, connected with the release of intracellular enzymes, occurs. In such conditions, the rate of mineralisation of both carbon and nitrogen increases. Gianfreda and Bollag [13] showed that a decrease in soil water content can also lead to the formation of hypertonic osmotic pressure, resulting in a decrease in microbial activity or the drying of bacterial cells.
The main aim of the study was to assess the impact of drought length on the dynamics of mineral nitrogen and the enzyme activities in two soils of different texture. We also deeply investigated the impact of water stress on bacterial diversity, as fungal diversity has been reported as more resistant to drought [14]. An additional objective was to evaluate the effect of compost addition to soil on the alleviation of microbial responses to stress conditions, i.e. alternating periods of drought and excessive soil moisture.

2. Materials and Methods

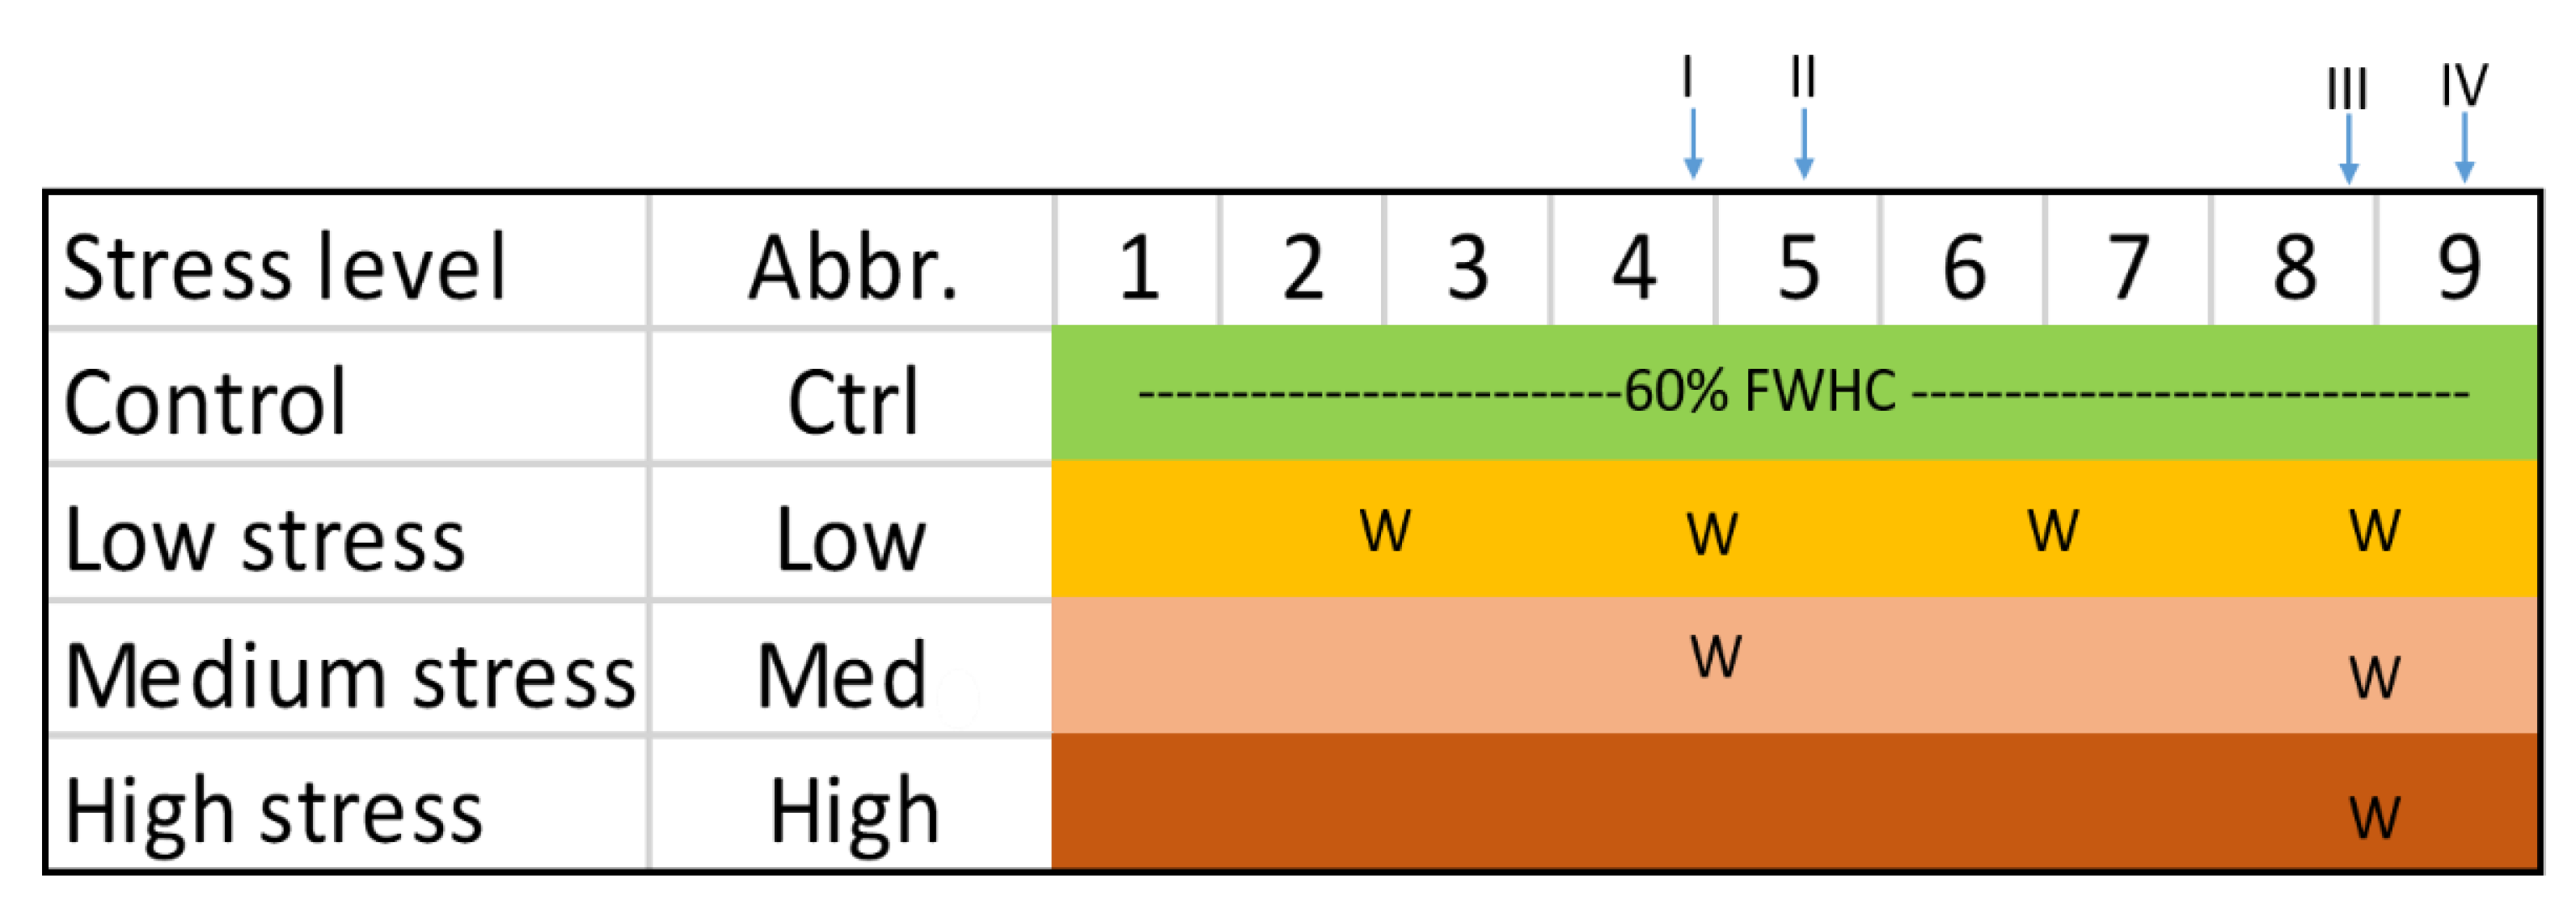
2.1. Experimental Setup

The pot study was carried out in a greenhouse under controlled conditions (supplemental light and 27/20 °C day/night temperatures) in 3 L plastic pots with three replicates for each combination. The pot study involved two soils of different texture (sand and silt loam, according to USDA classification), collected from arable land nearby Pulawy, Poland. The clay content of the soil was 1 and 5% in sand and silt loam, respectively. The soils substantially differed in terms of soil organic carbon (SOC) content, with 5.7 and 21.6 g kg−1 in sand and silt loam, respectively. The initial soil pH of both soils was neutral, with 6.5 and 6.6 in water suspension for sand and silt loam, respectively. Soils were sieved through 2 mm sieves and homogenised prior to the experiment.
Compost was collected from the GWDA company, Piła, Poland; it contained 30.7% organic matter and had a pH of 6.1. It was produced based on a mixture of sewage sludge and selectively collected green municipal waste, as well as waste from the food industry and agriculture. The compost is certified as a soil improver.
The experimental scheme is shown in Figure 1. Specific levels of water stress conditions were created through application of drought and soil watering periods. For each soil, four levels of moisture regime were set-up, including optimal conditions (Ctrl) (kept at 60% of field water holding capacity, FWHC, over the entire experiment) and three levels of water stress. The low level (Low) of stress conditions for microorganisms was represented by 2 week periods without watering, the medium level (Med) was created by a 1 month drought period followed by watering to full but short-term soil saturation with water, while the high-stress conditions (High) were represented by a 2 month drought period followed by full and long-term saturation with the same total amount of water, as in other variants. In the Low variant, the soil was watered on days 12, 26, 40 and 60 of the experiment. In the Med variant, soil irrigation was done on days 26 and 60, whereas in the High variant, irrigation was only performed on day 60. In the Low variant, we added the amount of water needed to reach the moisture level of the Ctrl soil. In the Med and High variants, the same total volumes of water as in the Low variant were introduced to the soil.
Soil amendment with compost was tested in the experiment to verify its contribution to mitigating the susceptibility of microorganisms to drought. Compost was added at the amount equal to 3% of soil only to the sandy soil, which was characterised by a significantly lower water retention capacity.
Soil moisture was maintained and recorded throughout the entire course of the experiment by pot weighing. Soil samples were collected four times, corresponding to Sampling time I, II, III and IV in the text, to represent periods of drought (end of drought period, right before watering), as well as periods of soil saturation with water (4 days after watering events) (Figure 1).
The first soil sampling (I) was performed at the end of the drought period after 1 month, the second (II) 4 days after soil watering, the third (III) at the end of the drought period after 2 months of the experiment and the fourth sampling (IV) 4 days after soil watering. Moist soil samples were used in analysis of soil enzymes, biodiversity indices, nitrification and extractable nitrogen, whereas subsamples for chemical analysis were air-dried.

2.2. Chemical and Microbiological Analysis

Soil pH was measured in H2O using a combined glass electrode in a slurry with a 1:2 v/v soil/water ratio. Total organic carbon (OC) and nitrogen (N) were analysed by combustion with a CN analyser (Elementar, vario Macro cube). Mineral nitrogen (N) was measured after extraction with 1 M K2SO4, by continuous segmented flow spectrometry, using a QuAAtro39 analyser (Seal Analytical, Norderstedt, Germany).
The activities of three enzymes (dehydrogenases, and acidic and alkaline phosphatases) were measured using commonly used protocols to characterise the biochemical activity of the soil. Dehydrogenases were determined according to Casida et al. [15] using the colorimetric method, with TTC (triphenyltetrazolium chloride) as the substrate, after 24 h of incubation at 37 °C. Alkaline and acid phosphatase activities were measured by the colorimetric method using PNP (sodium p-nitrophenylphosphate) after 1 h of incubation at 37 °C at a wavelength of 410 nm [16].
The nitrification potential was determined according to the ISO 15685 method [17]. Moist soil subsamples (25 g) were mixed with mineral medium to form a slurry and shaken at 125 rpm for 24 h. The mineral medium consisted of 1.5 mM ammonium sulphate (NH4)2SO4 as substrate, 1 mM potassium phosphate buffer (KH2PO4 and K2HPO4) and 5.625 mM NaClO3. After incubation, 4 M KCl was added to the slurry, and the suspension was filtered (390-grade filter paper). Subsequently, the filtrate was mixed with the colour reagent containing sulphanilamide and N-(1-naphtyl)ethylene diamine dihydrochloride. The concentration of the formed NO2 was determined spectrophotometrically at a wavelength of 543 nm.
In order to evaluate the effect of water stress on the diversity of bacteria in the loamy soil samples, collected in sampling time I, III and IV were subjected to metabolic profile and genetic diversity analysis. Metabolic profile (phenotypic) assessment of soil samples was carried out using the BIOLOG EcoPlate® System (Biolog TM, Hayward, CA, USA). The method is based on the direct inoculation of BIOLOG plates, containing a range of carbon sources, with microbial suspension from soil. A change in the purple tetrazolium colour is an indicator of the degradation in a given carbon source. Each plate includes 96 wells containing 31 different carbon sources, plus a blank well, in three replications. The substrates in the wells represent five groups: Carbohydrates (n = 10), carboxylic acids (n = 9), amines and amides (n = 2), amino acids (n = 6) and polymers (n = 4). Freshly collected soil samples were taken (1 g) and suspended in a bottle containing sterile water (99 mL), followed by shaking for 20 min at 20 °C. The suspension was then left to settle for 30 min at 4 °C. Subsequently, the supernatant was filtered through a BagFilter® 400P (Interscience, Saint Nom La Breteche, France) to avoid transmission of the remaining plant and soil particles, which could affect further reads. Inoculation was accomplished by pipetting 120 µL of each sample into each well of the EcoPlate ™. Plates were incubated at 28 °C, for 168 h, and the absorbance at 590 nm was measured using a BIOLOG Microstation every 24 h. For further analysis, readings at 144 h were chosen as the most suitable ones, representing the optimum optical density. Average well colour development (AWCD) after 120 h of incubation was calculated for each plate, using the method described by Garland [18], as a mean of the optical density (OD590) from the individual wells.
For analysis of the genetic diversity of bacteria, total DNA was extracted from each soil sample using the FastDNA ™ SPIN Kit for soil (MPBiomedical, Santa Ana, CA, USA), and the V3–V4 region of the 16S rRNA gene was sequenced using 341F (5′-CCTACGGGNGGCWGCAG-3′) and 785R (5′-CTACHVGGGTATCTAATCC-3′) primers [19], in 2 bp × 250 bp paired-end technology using the Illumina MiSeq system. Demultiplexed fastq files were processed using the DADA2 (1.12) package [20] in R software (3.6.0) [21]. Forward and reverse reads were trimmed to 250 bp, and primer sequences were removed from all reads. The filtering parameters were as follows: maxN = 0, maxEE = 2 and 3 for forward and reverse reads, respectively, truncQ = 2. Sequences were de-replicated using derepFastq with default parameters, and the exact sequence variants were resolved using dada. RemoveBimeraDenovo was then used to remove chimeric sequences. After the filtration steps, 62% (mean = 50990) of the reads were left for further analysis. Taxonomy was assigned using the latest version of the RDP database (release 11.5) using a naïve Bayesian classifier [22], and the minBoot parameter was set to 80. The resulting taxonomy and reads-count tables constructed in DADA2 were appropriately converted and imported into the phyloseq package [23]. Alpha diversity measures were calculated with the use of the phyloseq package. Sequences belonging to the chloroplast or mitochondrial DNA were removed. Subsequently, for further analysis, the total number of reads for the individual taxa was converted into a percentage, assuming the sum of all taxa in the individual samples as 100%.

2.3. Statistical Analysis

The results were subjected to analysis of variance (ANOVA) using the software Statistica v. 13.0 (TIBCO Software Inc., Palo Alto, CA, USA). The significance of difference between the moisture regimes and between compost-treated and -untreated soils was identified using Tukey’s test (p < 0.05).
The Biolog Ecoplate-derived functional diversity indices of microorganisms activity, such as AWCD and the Shannon diversity index (H′), were calculated for data after 144 h. Variations in the impact of moisture stress on carbon source utilisation were assessed by using principal component analysis (PCA), with mean values of the AWCD and consumption of carbon source groups as response variables. The PCA is a mathematical protocol converting a set of observations of possibly correlated variables into linearly uncorrelated variables, so-called “principal components”. This approach is commonly used to describe patterns of variation within multi-dimensional datasets [24]. Prior to analysis, all data were centred and log-transformed. The PCA analyses and H′ calculations were performed using MVSP [25].

3. Results and Discussion

3.1. Impact of Water Stress on Nitrogen Forms and Nitrification Potential

The ammonia-N concentration was low in the Ctrl, regardless of the sampling time, indicating that NH4-N was converted into nitrate via nitrification. It could have also been driven by an increased N mineralisation rate as reported by Fuchslueger et al. [26]. The longer the period of drought, the higher the concentration of NH4-N in the soil, resulting from lower nitrification activity or increased mineralisation (samplings I and III). This was observed for both soil textures (Table 1). Watering eliminated the differences in NH4-N concentration between moisture regimes, particularly at sampling time IV. Compost amendment to the sandy soil did not increase NH4-N contents compared to nonamended soil (Table 1); its content drastically decreased after watering. This was the effect of the restimulated nitrification process and/or induced N2O emission under temporary anaerobic conditions. The latter was likely especially in loamy soil due to the finer texture impact on respiration during full saturation periods following rewetting (Table 1).
The nitrate content was dependent on the presence of compost and the stress level (Table 1). The addition of compost to sandy soil introduced an additional source of various forms of nitrogen, increasing the amount of ammonia in the soil that was readily converted to nitrates via nitrification. This resulted in a sharp increase in the nitrate-N content in compost-amended soil. Drought periods did not reduce the nitrate content as compared to the Ctrl, with constant moisture in the case of both soils. Watering after the 2 month drought period caused a sharp reduction in nitrates, as shown for sampling time IV, likely due to induced denitrification.
The nitrite contents were extremely low at optimal moisture (Ctrl), which indicates that there was no impairment of nitrification during both phases of the process. In periods of drought, the content of NO2-N increased, indicating the inhibition of the nitrite-to-nitrate transformation (the second phase of nitrification). Soil irrigation after drought periods enabled the recovery of the activity of this phase, as proved by the NO2-N content (Table 1).
The soil nitrification potential (NP) is a highly sensitive parameter which reflects the response of soil microorganisms to environmental factors, e.g., temperature, moisture or soil contamination [12,27,28]. It describes the potential activity of a specialised group of autotrophic bacteria—ammonia-oxidising bacteria dominated by the two genera Nitrosomonas and Nitrosospira—responsible for the first phase of nitrification [29,30]. The presented results clearly indicate that drought stress and rewetting significantly affected the activity of the nitrifying bacteria (Table 2), regardless of the type of soil.
In the loamy soil, at an optimum moisture level (Ctrl), nitrification potential was at the similar level of 6.85–8.87 µg NO2·g d.w.−1 during the entire duration of the experiment. Application of the 1 month drought stress caused almost a 70% reduction in NP activity. After the first rewetting (sampling II), the NP values increased in soils subjected to low and medium water stress, up to the level observed in the Ctrl. Only in the soil exposed to High water stress, the nitrification activity remained inhibited due to the lack of irrigation (Table 2). Similar relationships were found after 2 months of the experiment; shortly before the second rewetting, the NP activity was 50–60% lower in relation to the Ctrl. Soil rewetting after 2 months caused an increase in the NP to the level of activity found at the optimal moisture, including High stress (Table 2). Nitrification potential was also significantly affected in sandy soil (Table 2). However, the resistance and resilience of sandy soil to moisture stress were lower than those in loamy soil; 30 (sampling I) and 60 (sampling III) days of water deficiency resulted in an 80% reduction in nitrification activity. The recovery of nitrifying bacterial activity observed after soil rehydration (samplings II and IV) was at the level of 40–60% of that of the control. Compost application to the sandy soils only slightly reduced the negative effects of drought on soil nitrifying bacteria and facilitated recovery after soil rewetting (Table 2).
Two fundamentally different mechanisms can be considered in order to explain the effects of rewetting on the transformation of nutrients and soil organic matter. The first is the effect on soil physical properties [31], while the second is the effect on microorganisms [32]. During drought periods, nutrient concentrations in the soil solution increase, forcing microbes to balance the increasing osmotic potential by accumulating or producing osmolytes, which could lead to large amounts of N being tied up in the microbial biomass. Rewetting of the dry soil introduces a water pulse and causes a sudden decrease in soil osmotic pressure: Microbes release accumulated osmolytes to avoid lysis and are triggered back from low activity or dormant states, resulting in peaks of C and nitrogen mineralisation and of nitrification [26,32]. It has also been reported that some ammonium-oxidising bacteria are well-adapted to extreme drought and become active within minutes of rewetting dry soil [12].

3.2. Impact of Water Stress on Enzyme Activities

In general, water deficit in soil is known to reduce enzyme activities [33,34]. The highest activity of dehydrogenases in loamy soil was recorded under the optimal moisture level. At the end of the 1 month drought period, there was a decrease in the enzymatic activity of dehydrogenases under all three stress levels, and a few days later, a noticeable increase was observed in rewetted soils (Low and Med stress); however, the activity was still lower than in the Ctrl. The same relationships were observed after 2 months of the experiment—prior to soil rewetting, the dehydrogenase activity was three times lower than that in the Ctrl. Soil rewetting induced an increase in dehydrogenase activity in all water stress experimental combinations. It should be noted, however, that soil rewetting did not provide the recovery of dehydrogenase activity to the level observed in the Ctrl (Table 3). We also observed that after 2 months (sampling III), there was no difference in dehydrogenase activity between Low, Med and High water stress, with three, one and zero rewetting events, respectively. The level of dehydrogenase activity was considerably higher in the loamy soil, whereas the magnitude of dehydrogenase inhibition was higher in the sandy soil. Even after soil rewetting, dehydrogenase activities were 78–93 and 88–93% lower than in the Ctrl at samplings II and IV, respectively (Table 3).
Slightly different responses were found for phosphatases. In loamy soil, phosphatases were most active in the Ctrl, as compared to the other water regimes. The only statistically significant differences were noticed after sampling I (end of the drought period after 1 month) and III, which occurred at the end of the 2 months drought period, before soil rewetting. Analysis of samples collected 4 days after rewetting (samplings II and IV) revealed no statistically significant differences between stress levels for both phosphatase activities in loamy soil, indicating full recovery of the activity, regardless of the length of the drought period (Table 3).
In sandy soil, rewetting after 1 month resulted in activities of acidic phosphatase at the level comparable to control soil, whereas after 2 months of water stress and subsequent rewetting, this enzyme performed weaker under water stress than in the Ctrl (Table 3). Alkaline phosphatase behaved differently in sandy soil, where its activity was significantly lower in samplings I and III at all water stress levels (Low, Med, High) and where it did reach the Ctrl level after both soil rehydration events (samplings II and IV). Similarly, as in our study, Sardans and Panuelas [35] observed that phosphatases were less affected by drought than other soil enzymes (urease and protease, involved in N cycling).
Siebielec at al. [36] documented the long-term stimulation of dehydrogenases and phosphatases activity by application of organic soil amendments—sewage sludge and digestate. This effect was also observed by other authors [37,38], being most pronounced in degraded soils [39]. Pascual et al. [38] also proved that under severe drought, soil microbial activity had remained significantly greater in organic amended soils. Similarly, the application of composted biodegradable waste significantly increased activities of a broad range of enzymes [40,41]. In our study, the compost addition to sandy soil significantly reduced inhibition of dehydrogenases caused by water deficiency, and enabled a much better recovery of the enzyme activity after soil rewetting (sampling IV)—45 to 74% of the Ctrl value instead of 6 to 12% of the activity under optimal moisture in soil without compost addition (Table 3). Soil amendment with compost did not affect acidic phosphatase. In the case of alkaline phosphatase, compost, in general, increased its activity in samplings III and IV, but did not support a full recovery of the activity (Table 3).

3.3. Impact of Water Stress on Functional Diversity of Bacteria

The use of Biolog EcoPlates enables the evaluation of changes in the structure of microbial populations. The use dynamics of 31 specific carbon substrates on Biolog EcoPlates provides data on the functional profile of microbial communities in response to various drivers [18,42]. It has been rarely applied to study the microbial response to drought in arable soils; however, Preece at al. [43] observed drought as a strong driver of diversity in microbial community physiological profiles in soil under tree plantations.
The analysis demonstrated that the microbial communities representing various moisture stress levels differed in their abilities to utilise carbon substrates. The AWCD values, expressing the average intensities of C use, were highest at the optimal moisture conditions at all sampling times and at the rewetted Low and Med levels at sampling IV (Figure 2). Even at Low water stress, where the soil was watered once between the start of the experiment and sampling I, the AWCD was reduced at sampling I (Low1M-I). Similarly, the AWCD was reduced after 2 months of the experiment at sampling III (Low2M-III), indicating that even two weeks of drought are sufficient to reduce microbial diversity and the pattern of C substrate utilisation (Figure 2). At low stress, only amino acids and carbohydrates (sampling I) or carbohydrates (sampling III) were intensively used.
Medium water stress (Med) led to a reduction in the AWCD and the Shannon diversity index after 1 month of drought (Med1M-I). The use of carbohydrates and polymers remained at high levels, while amino acids were hardly utilised. Another period of drought, following a single irrigation event, again resulted in low average C use and low or medium use across all C substrate groups. Rewetting the soil recovered the functional diversity; however, the bacteria were no longer fully capable of using carbohydrates and polymers.
The 2 months of drought strongly inhibited bacterial functions (High2M-III) (Figure 2). Although bacteria were still able to degrade carbohydrates and polymers, utilisation of any other groups of C sources was greatly reduced. In general, the use of carboxylic and acetic acids was most inhibited. The rewetting that caused temporary semi-anaerobic conditions resulted in a shift in the capability to partly degrade C into amines and amides, especially amino acids (mostly L-asparagine), and carbohydrates (mostly D-mannitol, N-Acetyl-d-glucosamine and α-d-lactose) (Figure 3). Interestingly, a 2 month drought (High2M-III) did not fully inhibit polymer degradation, represented here by the relatively complex C sources such as α-cyclodextrin, glycogen, Tween 40 and Tween 80 (Figure 2 and Figure 3). Saturation of soil with water (High2M-IV) strongly inhibited the capacity of microorganisms to degrade these compounds.
Based on PCA analysis, the tested stress levels and sampling times were mutually positioned considering the similarity of patterns of C substrates utilisation. Besides various C substrates, the Shannon diversity index was used for this analysis. The total variance explained by Axis 1 and Axis 2 was 89.8% (70.6 and 19.2%, respectively) (Figure 4). The PCA procedure revealed a relative similarity of the affinity to C substrates between control soils and rewetted soils under Low or Med stress at sampling IV (Low2M-IV and Med2M-IV). There were also significantly different patterns of C substrates utilisation in soils collected after droughts of various length at samplings I and III, located at the opposite side of Figure 4. High2M-IV (soil collected after rewetting the soil previously subjected to 2 months of drought) was different from all other variants, which was driven mostly by a shift in capability to degrade amino acids and polymers.

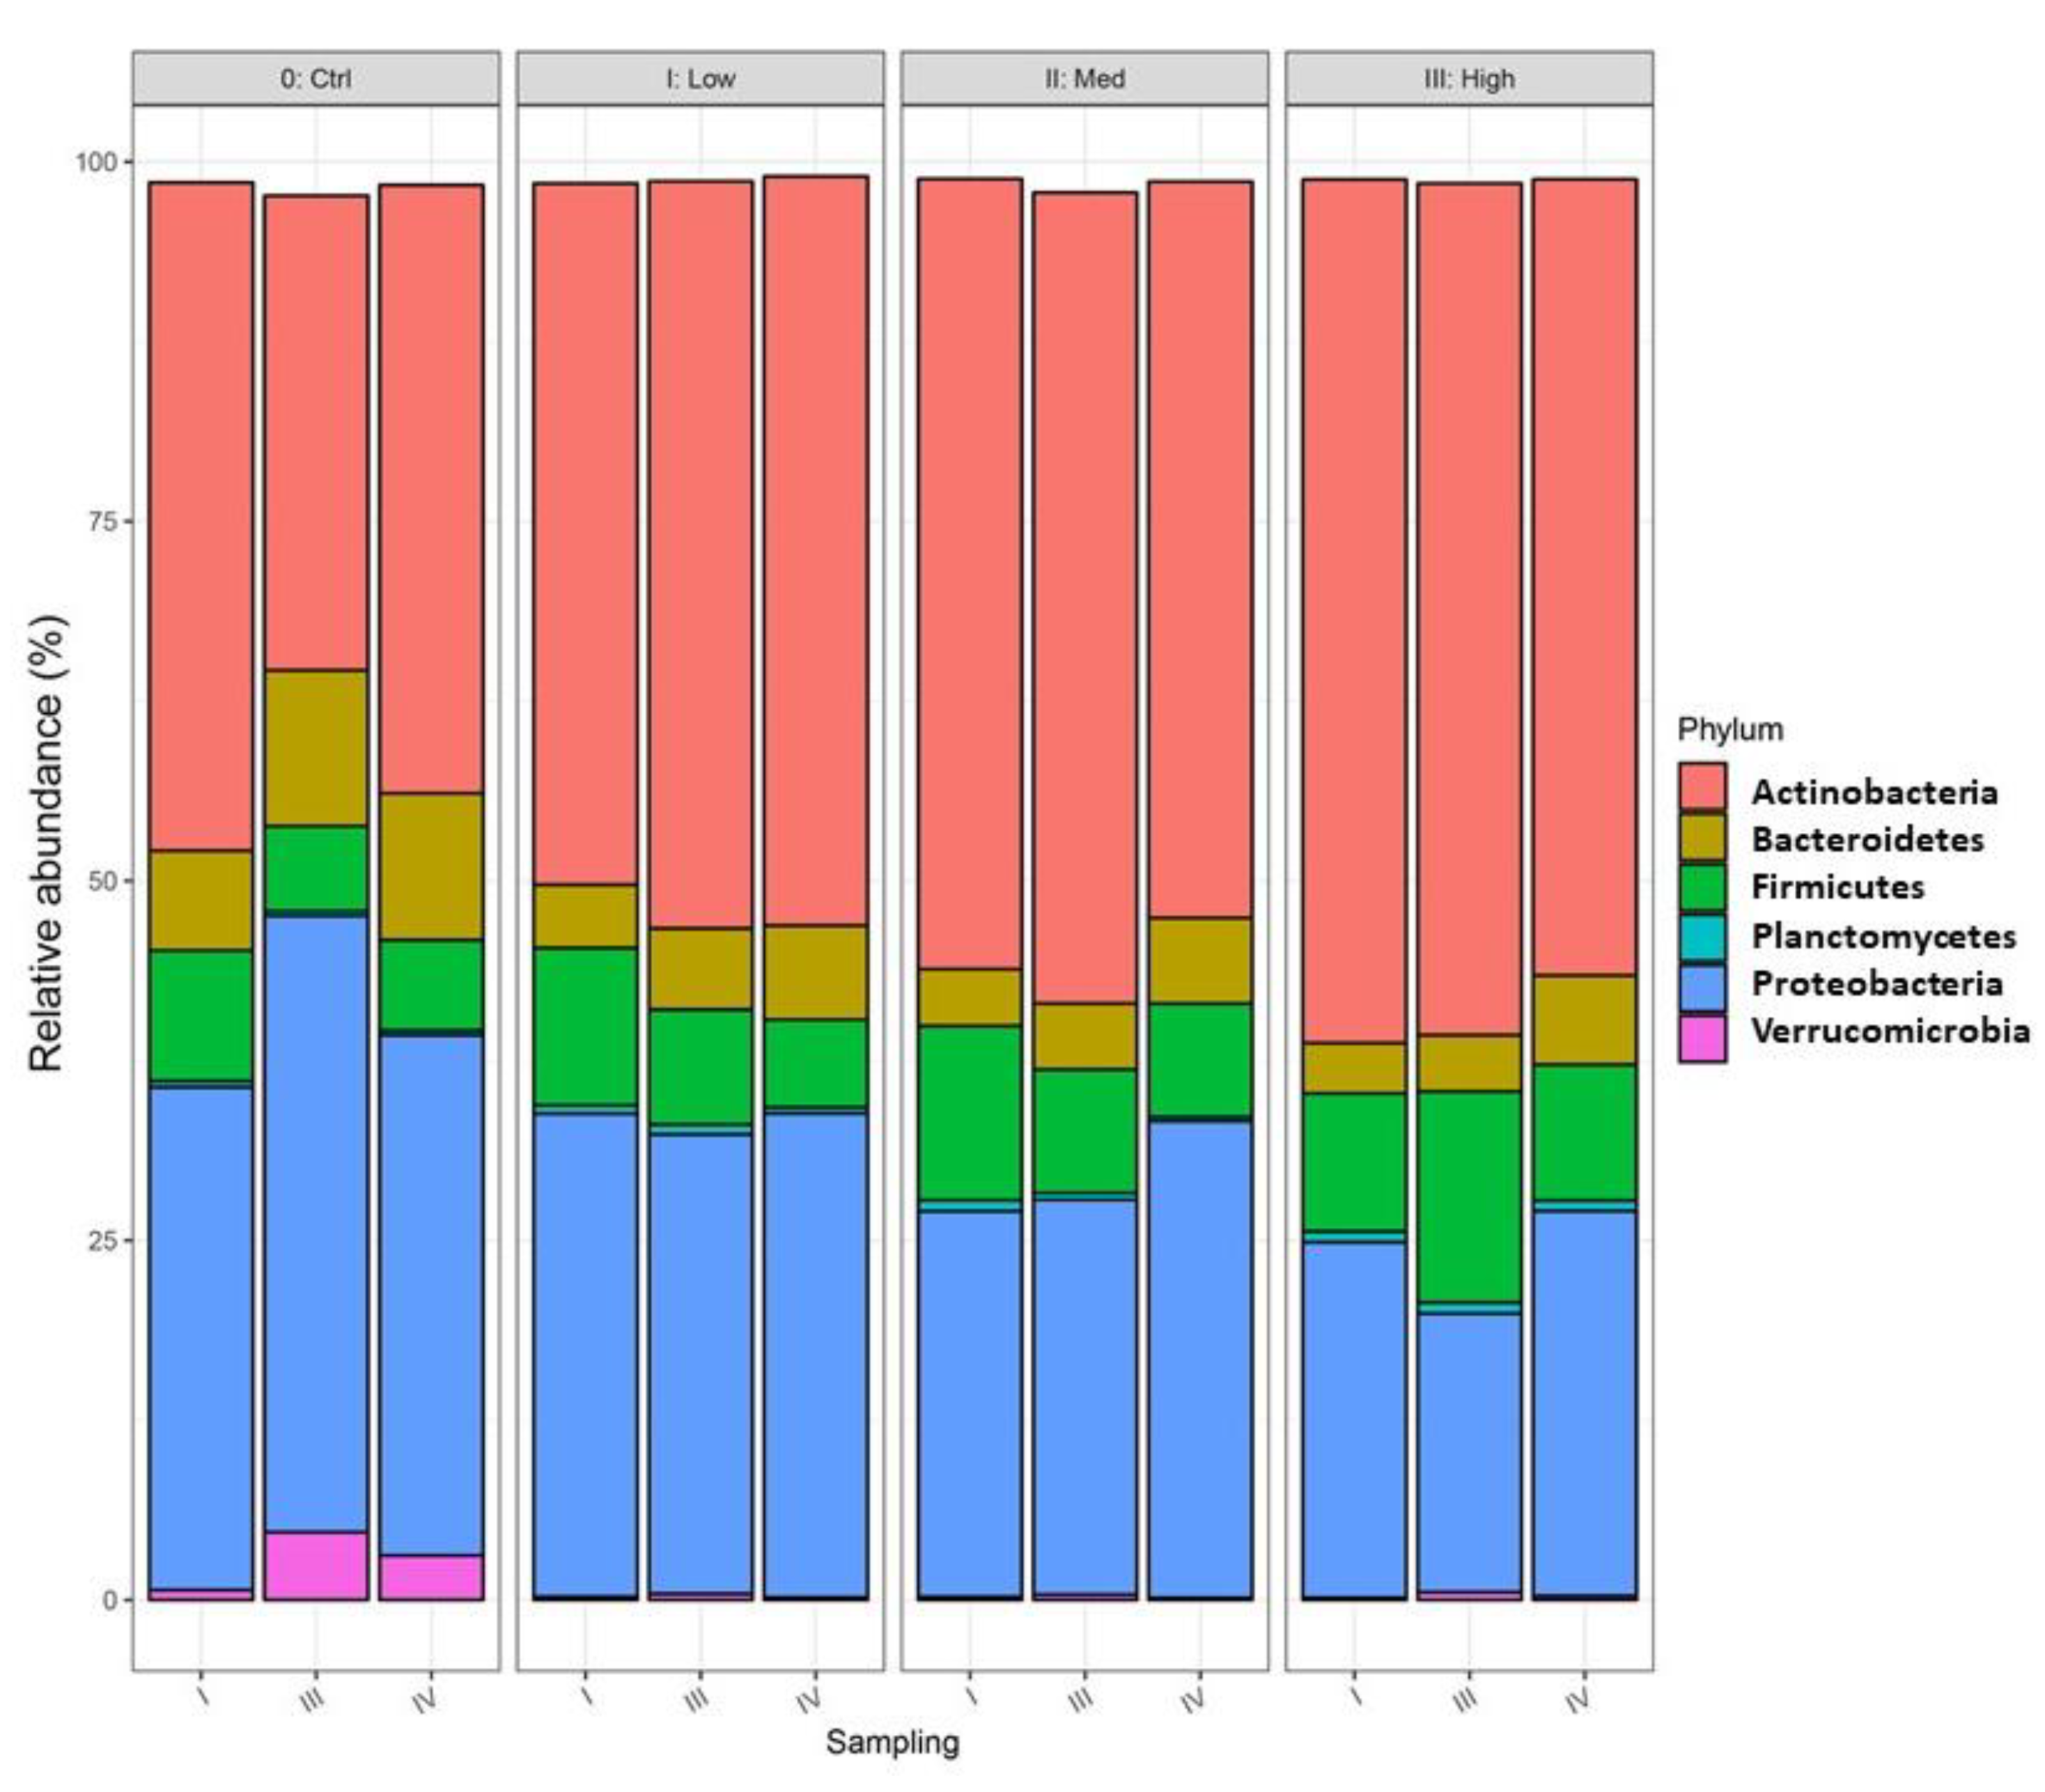
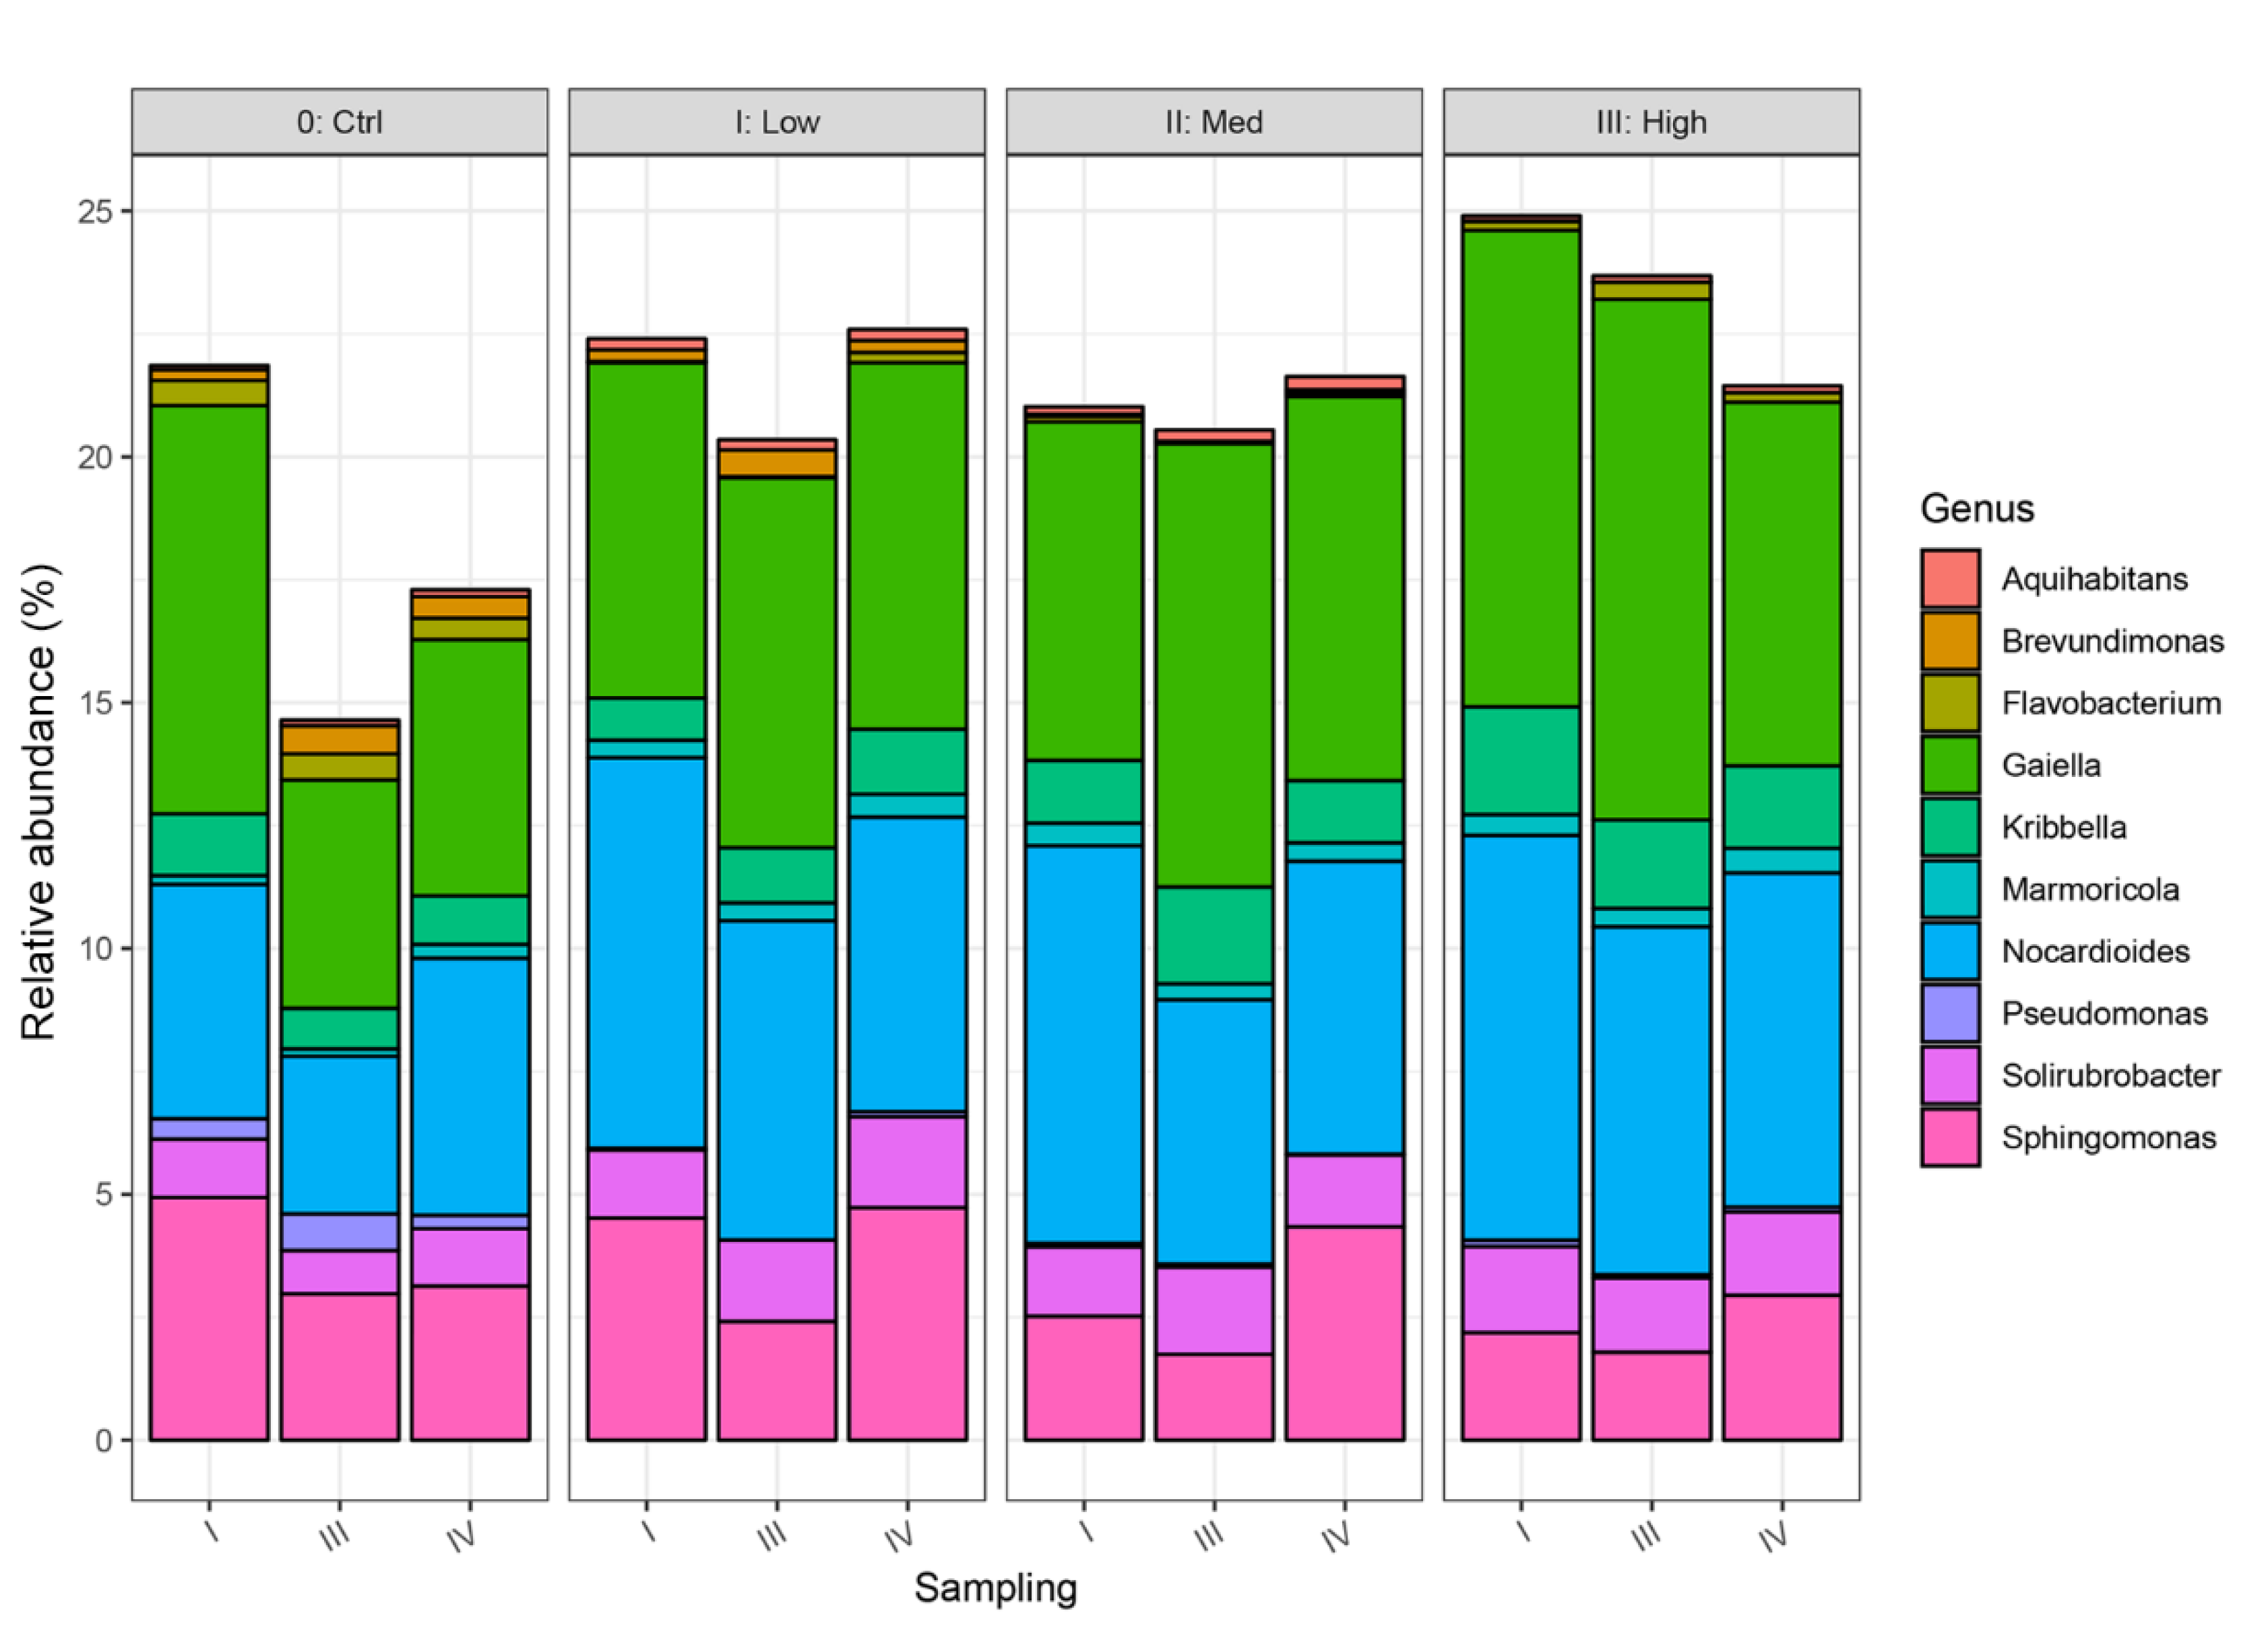
3.4. Impact of Water Stress on Genetic Diversity of Bacteria

The bacterial communities of the soil samples were dominated by six phyla: Actinobacteria, Bacteroidetes, Firmicutes, Planctomycetes, Protecobacteria and Verrucomicrobia, accounting for >95% of the total abundance (Figure 5). Under optimal soil moisture, Actinobacteria and Proteobacteria were represented by relatively equal percentages of the bacterial communities, with some fluctuations throughout the experiment. Bacteroidetes abundance slightly increased, while Firmicutes abundance slightly decreased at a moisture level of 60% of FWHC, while abundance of Verrucomicrobia fluctuated.
Actinobacteria decompose organic matter in soil, such as chitin and cellulose, contributing to N cycling; they proliferate under aerobic conditions [44]. In our study, Actinobacteria were most prevalent in soils at all drought stress levels. At High stress, the relative abundance of Actinobacteria was similar after 1 and 2 months of drought and then slightly declined after soil rewetting. Bacteria belonging to the phylum Proteobacteria have been identified as copiotrophs [45]. The longer the drought period, the lower the relative abundance of Proteobacteria in our experiment. Proteobacteria declined between 30 and 60 days of drought, being substituted by Firmicutes. In Van Horn’s et al. study [46], Firmicutes were dominant at high-salinity sites and increased in abundance with increasing moisture levels in soils of ice-free polar desert, proving their resistance to harsh conditions and relatively fast recovery. The high prevalence of this phyla in soil might be indicative of adaptation processes of the bacterial community to drought as Veach et al. [47] reported a higher abundance of Firmicutes under drought stress in soils that have previously been exposed to drought. Their data indicate that soils with a weaker drought history exhibit higher water-stress mortality. In our study, the 2 months of drought resulted in a decrease in water content to <5% of soil, but intensive watering recovered the percentage of Proteobacteria in soil to the level observed after 30 days of drought (High stress - sampling time I). Zeng et al. [48] found that Actinobacteria and Proteobacteria were significantly correlated with soil moisture in soils of the Loess Plateau, China.
Verrucomicrobia were particularly sensitive to water deficit—they contributed up to 5% of the total abundance in Ctrl soil, and dropped to <0.5% of the communities, in all drought treatments, regardless of the drought length (Figure 5). According to Bergmann et al. [49], the relative abundance of Verrucomicrobia was highest in grasslands and in subsurface soil horizons in samples collected across relatively undisturbed sites across North America, South America, Europe and Antarctica. The authors suggested that Verrucomicrobia occupy different ecological niches, but the environmental factors regulating their abundance were not sufficiently recognised.
Gaiella, Nocardioides and Sphingomonas were the most abundant genera in soil. However, their abundance varied and showed different patterns, depending on soil moisture fluctuations. At High water stress, Gaiella constituted more than 10% of the total microbial abundance, after 1 and 2 months of drought. Interestingly, Gaiella considerably declined after soil rewetting, when the soil water content shifted from 2 to 35% (Figure 6). Gaiella belongs to the phylum Actinobacteria and is involved in the N cycle [39].
Nocardioides remained at a relatively similar level regardless of the soil moisture. This phylum is known for its salt tolerance and the release of phosphatases [50]. The relative abundance of Sphingomonas increased after soil rewetting at each stress level. Members of the genus Sphingomonas are Gram-negative, strictly aerobic, chemoheterotrophic and do not form spores [51], indicating that they are not highly resistant to drought. Sphingomonas has the capacity to decompose persistent organic contaminants [52] and fix atmospheric nitrogen [53].
The abundance of Kribella was highest at High stress. This genus belongs to the family Nocardioidaceae and was first described by Park et al. [54]. It has been isolated from soil under an arid climate [55].

3.5. Soil pH Change Under Water Stress

The pH values of the loamy soil fluctuated during the experiment at optimal moisture. The pH was more stable in soils subjected to various levels of stress, but in general, it was lower than that in the Ctrl at sampling times I and III, which were concurrent with the end of each drought (Table 4). Zhang et al. [56] observed a strong soil pH decline as a result of drought, which, by consequence, alter biological processes of nutrient cycling. The observed drought-induced pH drop might have been partly responsible for inducing acid phosphatase activity in sampling III and IV (Table 3).
The pH values of the sandy soil varied, and the highest pH values both with and without compost amendment were recorded for soil maintained at optimal moisture for both sampling times at the end of the drought periods (I and III). After soil watering (samplings II and IV), these differences in pH between stress levels were not considerable. Furthermore, in general, the pH increased after soil watering, except for the Ctrl. In both soils, the drought periods led to the pH decrease, whereas watering resulted in a significant pH increase (Table 4).

4. Conclusions

The soil water regime strongly modified the activities of dehydrogenases and acid and alkaline phosphatase, as well as the bacterial diversity. Individual parameters showed different sensitivities to drought periods, and only some parameters and functional groups of bacteria recovered shortly after soil rewetting. Soil richer with colloidal clay exhibited greater resistance to the inhibition of soil enzymatic activity at soil water deficit. In sandy soil, even a drought period of 2 weeks resulted in drastic soil enzyme inhibition. After rewetting, following both a 1 month and a 2 month drought, soil enzyme activity and nitrification intensity largely recovered in soil with a loamy texture. Drought strongly affected soil nitrogen cycling by inhibiting nitrification. The longer the drought period, the greater the contents of both ammonia-N and nitrate-N, indicating a strong disturbance of N cycling due to the inhibition of certain microbial groups. On the other hand, intensive rewetting after 1 or 2 months of drought resulted in significant ammonia depletion, especially in loamy soil, likely due to gaseous losses of N.
Drought induced substantial shifts both in the intensity of soil C transformation and the functional diversity of bacterial communities in loamy soil. The use of some C substrates, for example, carboxylic and acetic acids, was strongly inhibited by water deficit. Interestingly, drought induced some changes in the relative abundances of particular phyla, for example, an increase in Acidobacteria or a decrease in Verrucomicrobia; however, these do not seem to be that dramatic as those in functional diversity, at least at the phylum level.
We also show the important role of exogenous organic matter in protecting microbial activity in drought periods. The addition of exogenous organic matter to the soil significantly alleviated the inhibition of the activity of microorganisms in drought periods. Similar to soil enzymes, resilience of nitrification was greater in loamy soil and after compost addition.
Further research is necessary to attribute shifts in particular microbially driven soil processes to the observed changes in functional and genetic diversity under water stress. Such information could be used to connect functional changes in bacterial communities with the diversity shifts resulting from drought conditions.

Author Contributions

Conceptualization, S.S. and G.S.; methodology, S.S., G.S. and A.K.-P.; validation, S.S.; investigation, S.S. (experiment, sampling and microbiological analysis), J.G. (genetic analysis), A.G. (functional analysis) and G.S. (chemical analysis); resources, G.S.; data curation, S.S.; writing—original draft preparation, S.S. and G.S.; writing—review and editing, T.S.; visualization, S.S., A.G. and J.G.; supervision, G.S.; project administration, S.S.; funding acquisition, S.S. All authors have read and agreed to the published version of the manuscript.

Funding

The research was supported by the internal grant of the Institute of Soil Science and Plant Cultivation—State Research Institute: 2.41—The evaluation of environmental effects of using exogenous organic matter in agriculture (2019–2021).

Acknowledgments

The authors greatly acknowledge Marlena Baćkowska for help in managing the greenhouse study, Emilia Grzęda for help in conducting the enzyme measurements and Piotr Gembal for measurement of nitrogen forms.

Conflicts of Interest

The authors declare no conflict of interest.

References

  1. Trenberth, K. Changes in precipitation with climate change. Clim. Res. 2011, 47, 123–138. [Google Scholar] [CrossRef] [Green Version]
  2. Hynčica, M.; Huth, R. Long-term changes in precipitation phase in Europe in cold half year. Atmos. Res. 2019, 227, 79–88. [Google Scholar] [CrossRef]
  3. Christensen, O.B.; Christensen, J.H. Intensification of extreme European summer precipitation in a warmer climate. Glob. Planet. Chang. 2004, 44, 107–117. [Google Scholar] [CrossRef]
  4. Grillakis, M.G. Increase in severe and extreme soil moisture droughts for Europe under climate change. Sci. Total Environ. 2019, 660, 1245–1255. [Google Scholar] [CrossRef] [PubMed]
  5. System of Monitoring of Agricultural Drought. 2020. Available online: http://www.susza.iung.pulawy.pl (accessed on 30 July 2020).
  6. Meisner, A.; Rousk, J.; Baath, E. Prolonged drought changes the bacterial growth response to rewetting. Soil Biol. Biochem. 2015, 88, 314–322. [Google Scholar] [CrossRef] [Green Version]
  7. Siebert, J.; Sünnemann, M.; Auge, H.; Berger, S.; Cesarz, S.; Ciobanu, M.; Guerrero-Ramírez, N.R.; Eisenhauer, N. The effects of drought and nutrient addition on soil organisms vary across taxonomic groups, but are constant across seasons. Sci. Rep. 2019, 9, 639. [Google Scholar] [CrossRef] [Green Version]
  8. Wang, S.; Cai, M.; Li, D.; Wu, B.; Li, J.; Huang, G.; Duan, H.; Wu, J. Heat waves intensify the effects of drought on bacterial diversity but not community composition in Solanum lycopersicum soil. J. Soils Sediments 2020. [Google Scholar] [CrossRef]
  9. Milosević, N.A.; Marinković, J.B.; Tintor, B.B. Mitigating abiotic stress in crop plants by microorganisms. Proc. Nat. Sci. Matica Serpska Novi. Sad 2012, 123, 17–26. [Google Scholar] [CrossRef]
  10. Nguyen, L.T.T.; Osanai, Y.; Anderson, I.C.; Bange, M.P.; Tissue, D.T.; Singh, B.K. Flooding and prolonged drought have differential legacy impacts on soil nitrogen cycling, microbial communities and plant productivity. Plant. Soil 2018, 431, 371–387. [Google Scholar] [CrossRef]
  11. Young, I.M.; Ritz, K. Tillage, habitat space and function of soil microbes. Soil Tillage Res. 2000, 53, 201–213. [Google Scholar] [CrossRef]
  12. Gleeson, D.B.; Herrmann, A.M.; Livesley, S.J.; Murphy, D.V. Influence of water potential on nitrification and structure of nitrifying bacterial communities in semiarid soils. Appl. Soil Ecol. 2008, 40, 189–194. [Google Scholar] [CrossRef]
  13. Gianfreda, L.; Bollag, J.M. Enzyme activity in soil. Soil Biol. Biochem. 1996, 8, 123–192. [Google Scholar]
  14. Preece, C.; Verbruggen, E.; Liu, L.; Weedon, J.T.; Peñuelas, J. Effects of past and current drought on the composition and diversity of soil microbial communities. Soil Biol. Biochem. 2019, 131, 28–39. [Google Scholar] [CrossRef]
  15. Casida, L.; Klein, D.; Santoro, T. Soil dehydrogenase activity. Soil Sci. 1964, 98, 371–376. [Google Scholar] [CrossRef]
  16. Tabatabai, M.A.; Bremner, J.M. Use of p-nitrophenylphosphate for assay of soil phosphatase activity. Soil Biol. Biochem. 1969, 1, 301–307. [Google Scholar] [CrossRef]
  17. ISO 15685. Soil Quality—Determination of Potential Nitrification and Inhibition of Nitrification—Rapid Test by Ammonium Oxidation; International Organisation for Standardisation: Geneva, Switzerland, 2004. [Google Scholar]
  18. Garland, J.L.; Mills, A.L. Classification and characterization of heterotrophic microbial communities on the basis of patterns of community-level sole-carbon-source utilization. Appl. Environ. Microbiol. 1991, 57, 2351–2359. [Google Scholar] [CrossRef] [Green Version]
  19. Klindworth, A.; Pruesse, E.; Schweer, T.; Peplies, J.; Quast, C.; Horn, M.; Glöckner, F.O. Evaluation of general 16S ribosomal RNA gene PCR primers for classical and next-generation sequencing-based diversity studies. Nucleic Acids Res. 2013, 41, e1. [Google Scholar] [CrossRef]
  20. Callahan, B.J.; McMurdie, P.J.; Rosen, M.J.; Han, A.W.; Johnson, A.J.A.; Holmes, S.P. DADA2: High-resolution sample inference from Illumina amplicon data. Nat. Methods 2016, 13, 581–583. [Google Scholar] [CrossRef] [Green Version]
  21. R Core Team. A Language and Environment for Statistical Computing; R Foundation for Statistical Computing: Vienna, Austria, 2018. [Google Scholar]
  22. Wang, Q.; Garrity, G.M.; Tiedje, J.M.; Cole, J.R. Naive Bayesian Classifier for Rapid Assignment of rRNA Sequences into the New Bacterial Taxonomy. Appl. Environ. Microbiol. 2007, 73, 5261–5267. [Google Scholar] [CrossRef] [Green Version]
  23. McMurdie, P.J.; Holmes, S. Phyloseq: An R package for reproducible interactive analysis and graphics of microbiome census data. PLoS ONE 2013, 8, e61217. [Google Scholar] [CrossRef] [Green Version]
  24. Abdi, H.; Williams, L. Principal components analysis. Wiley Interdiscip. Rev. Comput. Stat. 2010, 2, 439–459. [Google Scholar] [CrossRef]
  25. Kovach, W.L. MVSP—A Multivariate Statistical Package for Windows ver. 3.1; Kovach Computing Service: Pentraeth, UK, 1999. [Google Scholar]
  26. Fuchslueger, L.; Wild, B.; Mooshammer, M.; Takriti, M.; Kienzl, S.; Knoltsch, A.; Hofhansl, F.; Bahn, M.; Richter, A. Microbial carbon and nitrogen cycling responses to drought and temperature in differently managed mountain grasslands. Soil Biol. Biochem. 2019, 135, 144–153. [Google Scholar] [CrossRef] [Green Version]
  27. Maliszewska-Kordybach, B.; Klimkowicz-Pawlas, A.; Smreczak, B.; Janusauskaite, D. Ecotoxic effect of phenanthrene on nitrifying bacteria in soils of different properties. J. Environ. Qual. 2007, 36, 1635–1645. [Google Scholar] [CrossRef]
  28. Suszek-Łopatka, B.; Maliszewska-Kordybach, B.; Klimkowicz-Pawlas, A.; Smreczak, B. Influence of temperature on phenanthrene toxicity towards nitrifying bacteria in three soils with different properties. Environ. Poll. 2016, 216, 911–918. [Google Scholar] [CrossRef]
  29. Fuchslueger, L.; Kastl, E.M.; Bauer, F.; Kienzl, S.; Hasibeder, R.; Ladreiter-Knauss, T.; Schmidt, M.; Bahn, M.; Schloter, M.; Richter, A.; et al. Effect of drought on nitrogen turnover and abundances of ammonia-oxidizers in mountain grassland. Biogeosciences 2014, 11, 6003–6015. [Google Scholar] [CrossRef] [Green Version]
  30. Thion, C.; Prosser, J.I. Differential response of nonadapted ammonia-oxidising archea and bacteria to drying-rewetting stress. FEMS Microbiol. Ecol. 2014, 90, 380–389. [Google Scholar] [CrossRef] [PubMed]
  31. Bravo-Garza, M.R.; Bryan, R.B.; Voroney, P. Influence of wetting and drying cycles and maize residue addition on the formation of water stable aggregates in Vertisols. Geoderma 2009, 151, 150–156. [Google Scholar] [CrossRef]
  32. Xiang, S.-R.; Doyle, A.; Holden, P.A.; Schimel, J.P. Drying and rewetting effects on C and N mineralization and microbial activity in surface and subsurface California grassland soils. Soil Biol. Biochem. 2008, 40, 2281–2289. [Google Scholar] [CrossRef]
  33. Henry, H.A.L. Soil extracellular enzyme dynamics in a changing climate. Soil Biol. Biochem. 2012, 47, 53–59. [Google Scholar] [CrossRef]
  34. Steinwag, J.M.; Dukes, J.S.; Wallenstein, M.D. Modeling the effects of temperature and moisture on soil enzyme activity: Linking laboratory assays to continuous field data. Soil Biol. Biochem. 2012, 55, 85–92. [Google Scholar] [CrossRef]
  35. Sardans, J.; Peñuelas, J. Drought decreases soil enzyme activity in a Mediterranean Quercus ilex L. forest. Soil Biol. Biochem. 2005, 37, 455–461. [Google Scholar] [CrossRef]
  36. Siebielec, G.; Siebielec, S.; Lipski, D. Long-term impact of sewage sludge, digestate and mineral fertilizers on plant yield and soil biological activity. J. Clean. Prod. 2018, 187, 372–379. [Google Scholar] [CrossRef]
  37. Fernandes, S.A.; Bettiol, W.; Cerri, C.C. Effect of sewage sludge on microbial biomass, basal respiration, metabolic quotient and soil enzymatic activity. Appl. Soil Ecol. 2005, 30, 65–77. [Google Scholar] [CrossRef]
  38. Pascual, I.; Antolin, M.C.; Garcia, C.; Polo, A.; Sanchez-Diaz, M. Effect of water deficit on microbial characteristics in soil amended with sewage sludge or inorganic fertilizer under laboratory conditions. Bioresour. Technol. 2007, 98, 140–144. [Google Scholar] [CrossRef] [PubMed]
  39. Arif, M.S.; Riaz, M.; Shahzad, S.M.; Yasmeen, T.; Ashraf, M.; Siddique, M.; Mubarik, M.S.; Bragazza, L.; Buttler, A. Fresh and composted industrial sludge restore soil functions in surface soil of degraded agricultural land. Sci. Total Environ. 2018, 619, 517–527. [Google Scholar] [CrossRef]
  40. García-Gil, J.C.; Plaza, C.; Soler-Rovira, P.; Polo, A. Long-term effects of municipal solid waste compost application on soil enzyme activities and microbial biomass. Soil Biol. Biochem. 2000, 32, 1907–1913. [Google Scholar] [CrossRef]
  41. Crecchio, C.; Curci, M.; Pizzigallo, M.D.R.; Ricciuti, P.; Ruggiero, P. Effects of municipal solid waste compost amendments on soil enzyme activities and bacterial genetic diversity. Soil Biol. Biochem. 2004, 36, 1595–1605. [Google Scholar] [CrossRef]
  42. Garland, J.L. Analytical approaches to the characterization of samples of microbial communities using patterns of potential C source utilization. Soil Biol. Biochem. 1996, 28, 213–221. [Google Scholar] [CrossRef]
  43. Preece, C.; Farré-Armengol, G.; Peñuelas, J. Drought is a stronger driver of soil respiration and microbial communities than nitrogen or phosphorus addition in two Mediterranean tree species. Sci. Total Environ. 2020, 735, 139554. [Google Scholar] [CrossRef]
  44. Zhang, C.; Tayyab, M.; Abubakar, A.Y.; Yang, Z.; Pang, Z.; Islam, W.; Lin, Z.; Li, S.; Luo, J.; Fan, X.; et al. Bacteria with different assemblages in the soil profile drive the diverse nutrient cycles in the sugarcane straw retention ecosystem. Diversity 2019, 11, 194. [Google Scholar] [CrossRef] [Green Version]
  45. Fierer, N.; Bradford, M.A.; Jackson, R.B. Toward an ecological classification of soil bacteria. Ecology 2007, 88, 1354–1364. [Google Scholar] [CrossRef] [PubMed]
  46. Van Horn, D.J.; Okie, J.G.; Buelow, H.N.; Gooseff, M.N.; Barrett, J.E.; Takacs-Vesbach, C.D. Soil microbial responses to increased moisture and organic resources along a salinity gradient in a polar desert. Appl. Environ. Microbiol. 2014, 80, 3034–3043. [Google Scholar] [CrossRef] [Green Version]
  47. Veach, A.M.; Zeglin, L.H. Historical drought affects microbial population dynamics and activity during soil drying and re-wet. Microb. Ecol. 2020, 79, 662–674. [Google Scholar] [CrossRef] [PubMed]
  48. Zeng, Q.; Dong, Y.; An, S. Bacterial community responses to soils along a latitudinal and vegetation gradient on the Loess Plateau, China. PLoS ONE 2016, 11, e0152894. [Google Scholar] [CrossRef] [PubMed] [Green Version]
  49. Bergmann, G.T.; Bates, S.T.; Eilers, K.G.; Lauber, C.L.; Caporaso, J.G.; Walters, W.A.; Knight, R.; Fierer, N. The under-recognized dominance of Verrucomicrobia in soil bacterial communities. Soil Biol. Biochem. 2011, 43, 1450–1455. [Google Scholar] [CrossRef] [Green Version]
  50. Dastager, S.G.; Lee, J.C.; Ju, Y.J.; Park, D.J.; Kim, C.J. Nocardioides halotolerans sp. nov., isolated from soil on Bigeum Island, Korea. Syst. Appl. Microbiol. 2008, 31, 24–29. [Google Scholar] [CrossRef]
  51. Manandhar, P.; Zhang, G.; Lama, A.; Liu, F.; Hu, Y. Sphingomonas montana sp. nov., isolated from a soil sample from the Tanggula Mountain in the Qinghai Tibetan Plateau. Antonie van Leeuwenhoek 2017, 110, 1659–1668. [Google Scholar] [CrossRef]
  52. Coppotelli, B.M.; Ibarrolaza, A.; Del Panno, M.T.; Morelli, I.S. Effects of the inoculant strain Sphingomonas paucimobilis 20006FA on soil bacterial community and biodegradation in phenanthrene-contaminated soil. Microb. Ecol. 2008, 55, 173–183. [Google Scholar] [CrossRef]
  53. Xu, J.; Kloepper, J.W.; Huang, P.; McInroy, J.A.; Hu, C.H. Isolation and characterization of N2-fixing bacteria from giant reed and switchgrass for plant growth promotion and nutrient uptake. J. Basic Microbiol. 2018, 58, 459–471. [Google Scholar] [CrossRef]
  54. Park, Y.H.; Yoon, J.H.; Shin, Y.K.; Suzuki, K.; Kudo, T.; Seino, A.; Kim, H.J.; Lee, J.S.; Lee, S.T. Classification of ’Nocardioides fulvus’ IFO 14399 and Nocardioides sp. ATCC 39419 in Kribbella gen. nov., as Kribbella flavida sp. nov. and Kribbella sandramycini sp. nov. Int. J. Syst. Bacteriol. 1999, 49, 743–752. [Google Scholar] [CrossRef] [Green Version]
  55. Mohammadipanah, F.; Hamedi, J.; Goker, M.; Fiebig, A.; Pukall, R.; Sproer, C.; Klenk, H.-P. Kribbella shirazensis sp. nov., isolated from Iranian soil. Int. J. Syst. Evol. Microbiol. 2013, 63, 3369–3374. [Google Scholar] [CrossRef] [PubMed] [Green Version]
  56. Zhang, H.; Shi, L.; Lu, H.; Shao, Y.; Liu, S.; Fu, S. Drought promotes soil phosphorus transformation and reduces phosphorus bioavailability in a temperate forest. Sci. Total Environ. 2020, 732, 139295. [Google Scholar] [CrossRef] [PubMed]
Figure 1. Scheme of soil watering and sampling during the 9 weeks of the pot experiment; Arabic numerals—week of the experiment; W—watering day; Roman numerals—sampling day.
Agronomy 10 01429 g001
Figure 2. Average use of groups of carbon substrates based on readings in the 144 h of incubation. Ctrl, Low, Med, High—optimal moisture and low, medium and high water stress, respectively; 1M, 2M—month of the experiment; I, III, IV—sampling time.
Agronomy 10 01429 g002
Figure 3. Heat map of the metabolic profile of microorganisms based on the use of various C sources using the EcoPlate method after 144 h of incubation. Ctrl, Low, Med, High—optimal moisture and low, medium and high water stress, respectively; 1M, 2M—month of the experiment; I, III, IV—sampling time.
Agronomy 10 01429 g003
Figure 4. Principal component analysis (PCA) of metabolic activity parameters based on readings after 144 h of incubation of the EcoPlate. Ctrl, Low, Med, High—optimal moisture and low, medium and high water stress, respectively; 1M, 2M—month of the experiment; I, III, IV—sampling time.
Agronomy 10 01429 g004
Figure 5. Most abundant phyla in loamy soil as a result of water stress. Ctrl, Low, Med, High—optimal moisture and low, medium and high water stress, respectively; I, III, IV—sampling time.
Agronomy 10 01429 g005
Figure 6. Most abundant genus in loamy soil as result of water stress. Ctrl, Low, Med, High—optimal moisture and low, medium and high water stress, respectively; I, III, IV—sampling time.
Agronomy 10 01429 g006
Table 1. Mineral nitrogen forms as dependent on water stress and sampling time.
Stress LevelAmmonia-N (mg kg−1)Nitrite-N (mg kg−1)Nitrate-N (mg kg−1)
I 1IIIIIIVIIIIIIIVIIIIIIIV
Loamy soil
Ctrl0.27 c20.00 b0.06 c0.43 a0.07 c0.07 b0.11 c0.07 a87.4 a84.9 a14.2 b9.6 c
Low5.94 b0.00 b2.64 bc0.72 a3.45 b0.09 b2.12 b0.22 a165.7 a95.2 a137.1 a36.6 a
Med14.1 a0.00 b4.24 b0.00 a8.81 a0.04 b3.08 b0.07 a190.4 a43.1 a102.6 ab13.8 bc
High12.2 a8.74 a12.31 a0.00 a6.81 a6.72 a8.31 a0.10 a170.6 a50.4 a57.7 ab26.4 ab
Sandy soil
Ctrl1.95 b0.45 b0.60 c1.05 a0.25 a0.22 b0.67 a0.44 a154.4 a48.3 b60.8 b50.3 ab
Low4.72 a1.11 b2.19 b0.95 a0.59 a0.18 b0.34 a0.12 b132.0 a165.8 a212.7 a76.8 a
Med4.74 a0.77 b3.71 a1.20 a1.25 a0.15 b0.46 a0.08 b161.9 a35.3 b214.4 a24.6 bc
High4.16 a3.32 a4.96 a1.47 a1.19 a0.96 a0.79 a0.16 b171.0 a126.3 a86.4 b10.9 c
Sandy soil amended with compost
Ctrl1.17 b0.28 b0.63 c0.93 ab0.16 b0.14 b0.56 a0.51 a112.0 b65.2 b37.2 b54.9 ab
Low4.95 a0.60 b2.06 bc0.47 b0.68 ab0.21 b0.70 a0.11 a322.5 ab211.1 a361.3 a89.7 a
Med6.61 a0.32 b3.54 ab0.99 ab1.55 a0.09 b0.88 a0.16 a326.6 ab52.9 b327.7 a31.2 bc
High5.42 a3.78 a4.83 a1.27 a1.09 a1.22 a1.00 a0.14 a410.5 a167.0 a105.2 b5.5 c
1 Sampling time, 2 Means marked with the same letter did not differ significantly across the stress level within soil (p < 0.05, n = 3) according to the Tukey test.
Table 2. Nitrification potential as dependent on water stress and sampling time.
Stress LevelNitrification Potential (µg NO2−·g DM−1)
I 1IIIIIIV
Loamy soil
Ctrl7.47 a28.87 a6.89 a6.85 a
Low2.12 b8.36 a3.42 b8.77 a
Med2.12 b7.25 a2.89 b8.54 a
High2.50 b2.00 b2.03 b5.85 a
Sandy soil
Ctrl4.71 a6.08 a10.92 a8.66 a
Low1.17 b3.89 b1.41 b3.25 b
Med0.97 b4.19 b1.89 b3.36 b
High1.06 b1.01 c1.46 b3.19 b
Sandy soil amended with compost
Ctrl4.73 a5.78 a10.99 a9.28 a
Low1.22 b4.39 ab1.43 b3.70 b
Med0.98 b4.80 a1.77 b6.15 ab
High1.02 b1.57 b1.56 b4.13 b
1 Sampling time, 2 Means marked with the same letter did not differ significantly across the stress level within soil (p < 0.05, n = 3) according to the Tukey test.
Table 3. Soil enzyme activities as dependent on soil moisture and water stress.
Stress LevelDehydrogenases (μg g DM−1 24 h−1)Acidic Phosphatase (μg g DM−1 h−1)Alkaline Phosphatase (μg g DM−1 h−1)
I 1IIIIIIVIIIIIIIVIIIIIIIV
Loamy soil
Ctrl163.1 a2160.7 a159.3 a181.7 a19.2 a15.1 a151.8 a138.5 a8.1 a7.8 a61.4 a84.0 a
Low73.7 b101.6 b35.7 b95.3 b12.4 b14.9 a98.2 b146.6 a5.2 ab7.4 a44.8 b72.9 a
Med51.6 b97.8 c33.9 b81.1 b11.5 b13.9 a104.5 b146.6 a3.9 b5.1 a43.4 b68.3 a
High46.0 b60.2 c33.1 b78.9 b11.4 b12.4 a96.9 b121.6 a3.4 b4.1 a37.8 b59.9 a
Sandy soil
Ctrl45.9 a35.9 a42.0 a40.6 a3.4 a3.2 a30.5 a41.7 a2.4 a2.0 a16.6 a14.8 a
Low4.2 b7.8 b1.8 b2.7 b2.3 b2.8 a16.9 b23.8 b1.0 b1.3 b5.0 b5.7 b
Med3.1 b5.3 b3.7 b5.0 b2.2 b3.0 a18.5 b23.4 b1.0 b1.3 b5.1 b7.0 b
High3.4 b2.4 b3.0 b2.6 b2.1 b2.5 a17.8 b26.8 b1.1 b1.1 b3.8 b8.0 b
Sandy soil amended with compost
Ctrl49.4 a45.7 a35.1 a38.0 a3.4 a3.8 a28.4 a29.2 a3.0 a2.3 a32.6 a68.4 a
Low20.4 b27.2 ab6.7 c17.8 c2.1 b3.0 b16.1 b23.3 b1.4 b1.7 a7.9 a19.3 b
Med23.4 b22.0 b8.5 bc23.8 b2.2 b3.1 b16.6 b23.6 b1.6 b2.1 a16.8 a15.7 b
High22.2 b21.4 b11.5 b28.8 b2.3 b2.2 c17.6 b23.1 b1.7 b2.0 a12.8 a19.4 b
1 Sampling time, 2 Means marked with the same letter did not differ significantly across the stress level within soil (p < 0.05, n = 3) according to the Tukey test.
Table 4. Soil pH as dependent on water stress and sampling time.
Stress LevelSoil pH
I 1IIIIIIV
Loamy soil
Ctrl7.20 a26.57 ab6.63 a6.97 a
Low6.60 b6.53 ab6.40 ab6.63 b
Med6.43 bc6.63 a6.27 b6.60 b
High6.37 c6.47 c6.40 ab6.53 b
Sandy soil
Ctrl6.87 a7.03 a6.77 a6.70 c
Low6.70 ab6.87 b6.60 b6.73 bc
Med6.60 b7.07 a6.47 c6.90 ab
High6.57 b6.83 b6.43 c6.93 a
Sandy soil amended with compost
Ctrl6.87a7.03a6.97a6.93b
Low6.60b6.80b6.60b6.90b
Med6.53 b7.03 a6.63 b7.00 a
High6.57 b6.73 b6.67 b7.10 a
1 Sampling time, 2 Means marked with the same letter did not differ significantly across the stress level within soil (p < 0.05, n = 3) according to the Tukey test.

