Article

Agricultural and Forest Land-Use Impact on Soil Properties in Zagreb Periurban Area (Croatia)

1
Faculty of Agriculture, University of Zagreb, Svetosimunska 25, 10000 Zagreb, Croatia
2
Departamento de Ciencias Históricas y Geográficas, Universidad de Tarapacá, 18 de Septiembre, 2222, Arica 1010069, Chile
3
Environmental Management Laboratory, Mykolas Romeris University, LT-08303 Vilnius, Lithuania
*
Author to whom correspondence should be addressed.
Agronomy 2020, 10(9), 1331; https://doi.org/10.3390/agronomy10091331
Submission received: 24 August 2020 / Revised: 31 August 2020 / Accepted: 2 September 2020 / Published: 4 September 2020
(This article belongs to the Section Soil and Plant Nutrition)

Abstract

:
In urban areas, land use usually increases soil degradation. However, there are areas occupied by agriculture and woodlands with an essential role in provisioning food and other services such as water and climate regulation. The objective of this work was to assess the effect of long-term land use and soil management practices on peri-urban soils in Zagreb (Croatia). Samples were collected at depth 0–10 cm within intensively tilled cropland (CROP) and vineyard (VINE), traditional grass-covered orchard (ORCH), and forest (FOR). The results showed that bulk density was significantly higher in VINE and CROP than in ORCH and FOR. The opposite dynamic was observed in water-holding capacity, air-filled porosity, aggregate stability, organic matter, and soil organic matter stocks (SOCS). Soil water infiltration was higher in FOR plot compared to the other plots. Overall, land-use change had a substantial impact on soil properties and SOCS, especially in CROP and VINE soils. Tillage, pesticides, and fertilizer applications were presumably the reasons for altered soil quality properties. Intensively used areas (VINE and CROPS) may reduce soil ecosystems services such as the capacity for flood retention and C sequestration.

1. Introduction

Global demand for goods (e.g., food, energy) increases pressure on ecosystems [1,2]. The world’s population is expected to increase by 2 billion persons in the next 30 years, from 7.7 billion currently to 9.7 billion in 2050, and could peak at nearly 11 billion around 2100 [3]. Near the cities, both agricultural land and forests are being rapidly converted into urban areas as a consequence of urban sprawl. Urban sprawl is a global phenomenon with several negative impacts on the environment, such as landscape fragmentation, habitat loss, air pollution, greenhouse gas emissions, an increase of vulnerability to floods, urban heat island effect, and soil degradation (e.g., pollution and sealing). This land-use change is decreasing the ecosystem services drastically (e.g., air pollution regulation, water storage and infiltration, flood regulation, carbon sequestration, and food provided by these areas) [4,5,6]. For example, sealing hampers soil to retain water, sequester carbon (C), and affect the soil-atmosphere biogeochemical cycles [5,7]. Moreover, land use management has substantial impacts on soil properties, such as infiltration, bulk density (BD) and aggregate stability (AS) [8,9]. These soil properties have strong impact on soil quality and affect the hydrological response [10,11]. Human management, especially in urban and agricultural areas lead to soil degradation represents as factor responsible for decline in soil quality, which deteriorates soil properties by inadequate management, usually for human purposes [12]. Also, the conversion of agriculture areas to urbanized areas implies the loss of food production areas (e.g., orchards, vineyards or croplands) and a decrease in food security [13,14,15]. The reduction of forests and agricultural land close to the cities increases the demand for food if areas located from the city, amplifying the circular economy and the impact on global climate change [16,17].
Despite this trend, in several cities of the world, agriculture near urban areas are an important source of income and provision of food to local markets [18,19]. There are several socioeconomic and environmental benefits [17,20,21] to urban agriculture. However, there are several concerns as well, such as the impacts of pollution in food quality as a consequence of the air, soil, and water used in irrigation [22,23]. Other important aspects related to agriculture is the type of management carried out. Tillage and the use of agrochemicals are known to degrade soil properties and reduce soil quality when compared to forest soils [24,25]. Agriculture soils normally have a lower soil organic matter (OM) and capacity to retain C, hydraulic conductivity and aggregate stability than forest soils [8,9,26,27,28]. On the other hand, agriculture practices are known to increase overland flow and sediment transport [29,30]. There is a need for sustainable agriculture as a consequence of the detrimental impacts of conventional impose on land degradation and the services provided by agriculture lands. This should also be extended in urban agriculture areas, especially because these soils are already affected by other disturbances [17,31]. Therefore, it is crucial to minimize the impacts of urban agriculture on soil degradation as well as reduce the impacts of conventional practices in urban agriculture in water runoff. Agricultural and forested areas in urban areas are key to mitigate the impacts of floods since these are areas of water infiltration and retention [32,33,34]. Therefore, it is key to know the hydrological response to these areas. Also, they can and alleviate the urban effect on greenhouse emissions and increase soil organic C stocks (SOCS). Soils affected by conventional agriculture have low SOCS, as observed by previous works [35,36].
Agriculture practices in the urban areas affect soil physical, hydrological, and C sequestration. Therefore, comparing different land management practices is crucial to understand the impacts of urban agriculture on the capacity to mitigate floods and increase C sequestration in urban areas. This is especially important in areas such as Zagreb where there is a high frequency of extreme rainfall events, environmental hazards [37], and urban expansion [38].
Zagreb has an area of 64,125 ha. Forests, croplands, vineyards and orchards occupy 32.7%, 32.6%, 0.20% and 0.16% of the city area, respectively [39,40]. The large cover of forests and agricultural areas provide an important number of benefits such as food supply, disaster mitigation (e.g., water infiltration) and mitigate climate change (e.g., carbon sequestration or buffering temperature and humidity). Areas with high urbanization development are more vulnerable to environmental hazards [41,42] and significantly contribute to global climate change [6,43]. Moreover, Zagreb inhabitants produce local agricultural products, which changes the soil quality. The aim of this work is to study the impacts of agricultural and forest land use in peri-urban Stagnosols in Zagreb on the capacity to mitigate flood impacts and C sequestration. Although research on urban soils exist, those that address agricultural land use within a great proportion of the total area of a city in comparison with forests in peri-urban environments is uncommon. As such, this work is recognized as appropriate for a better understanding of the impacts of different disturbances on soil quality in specific peri-urban soil.

2. Materials and Methods
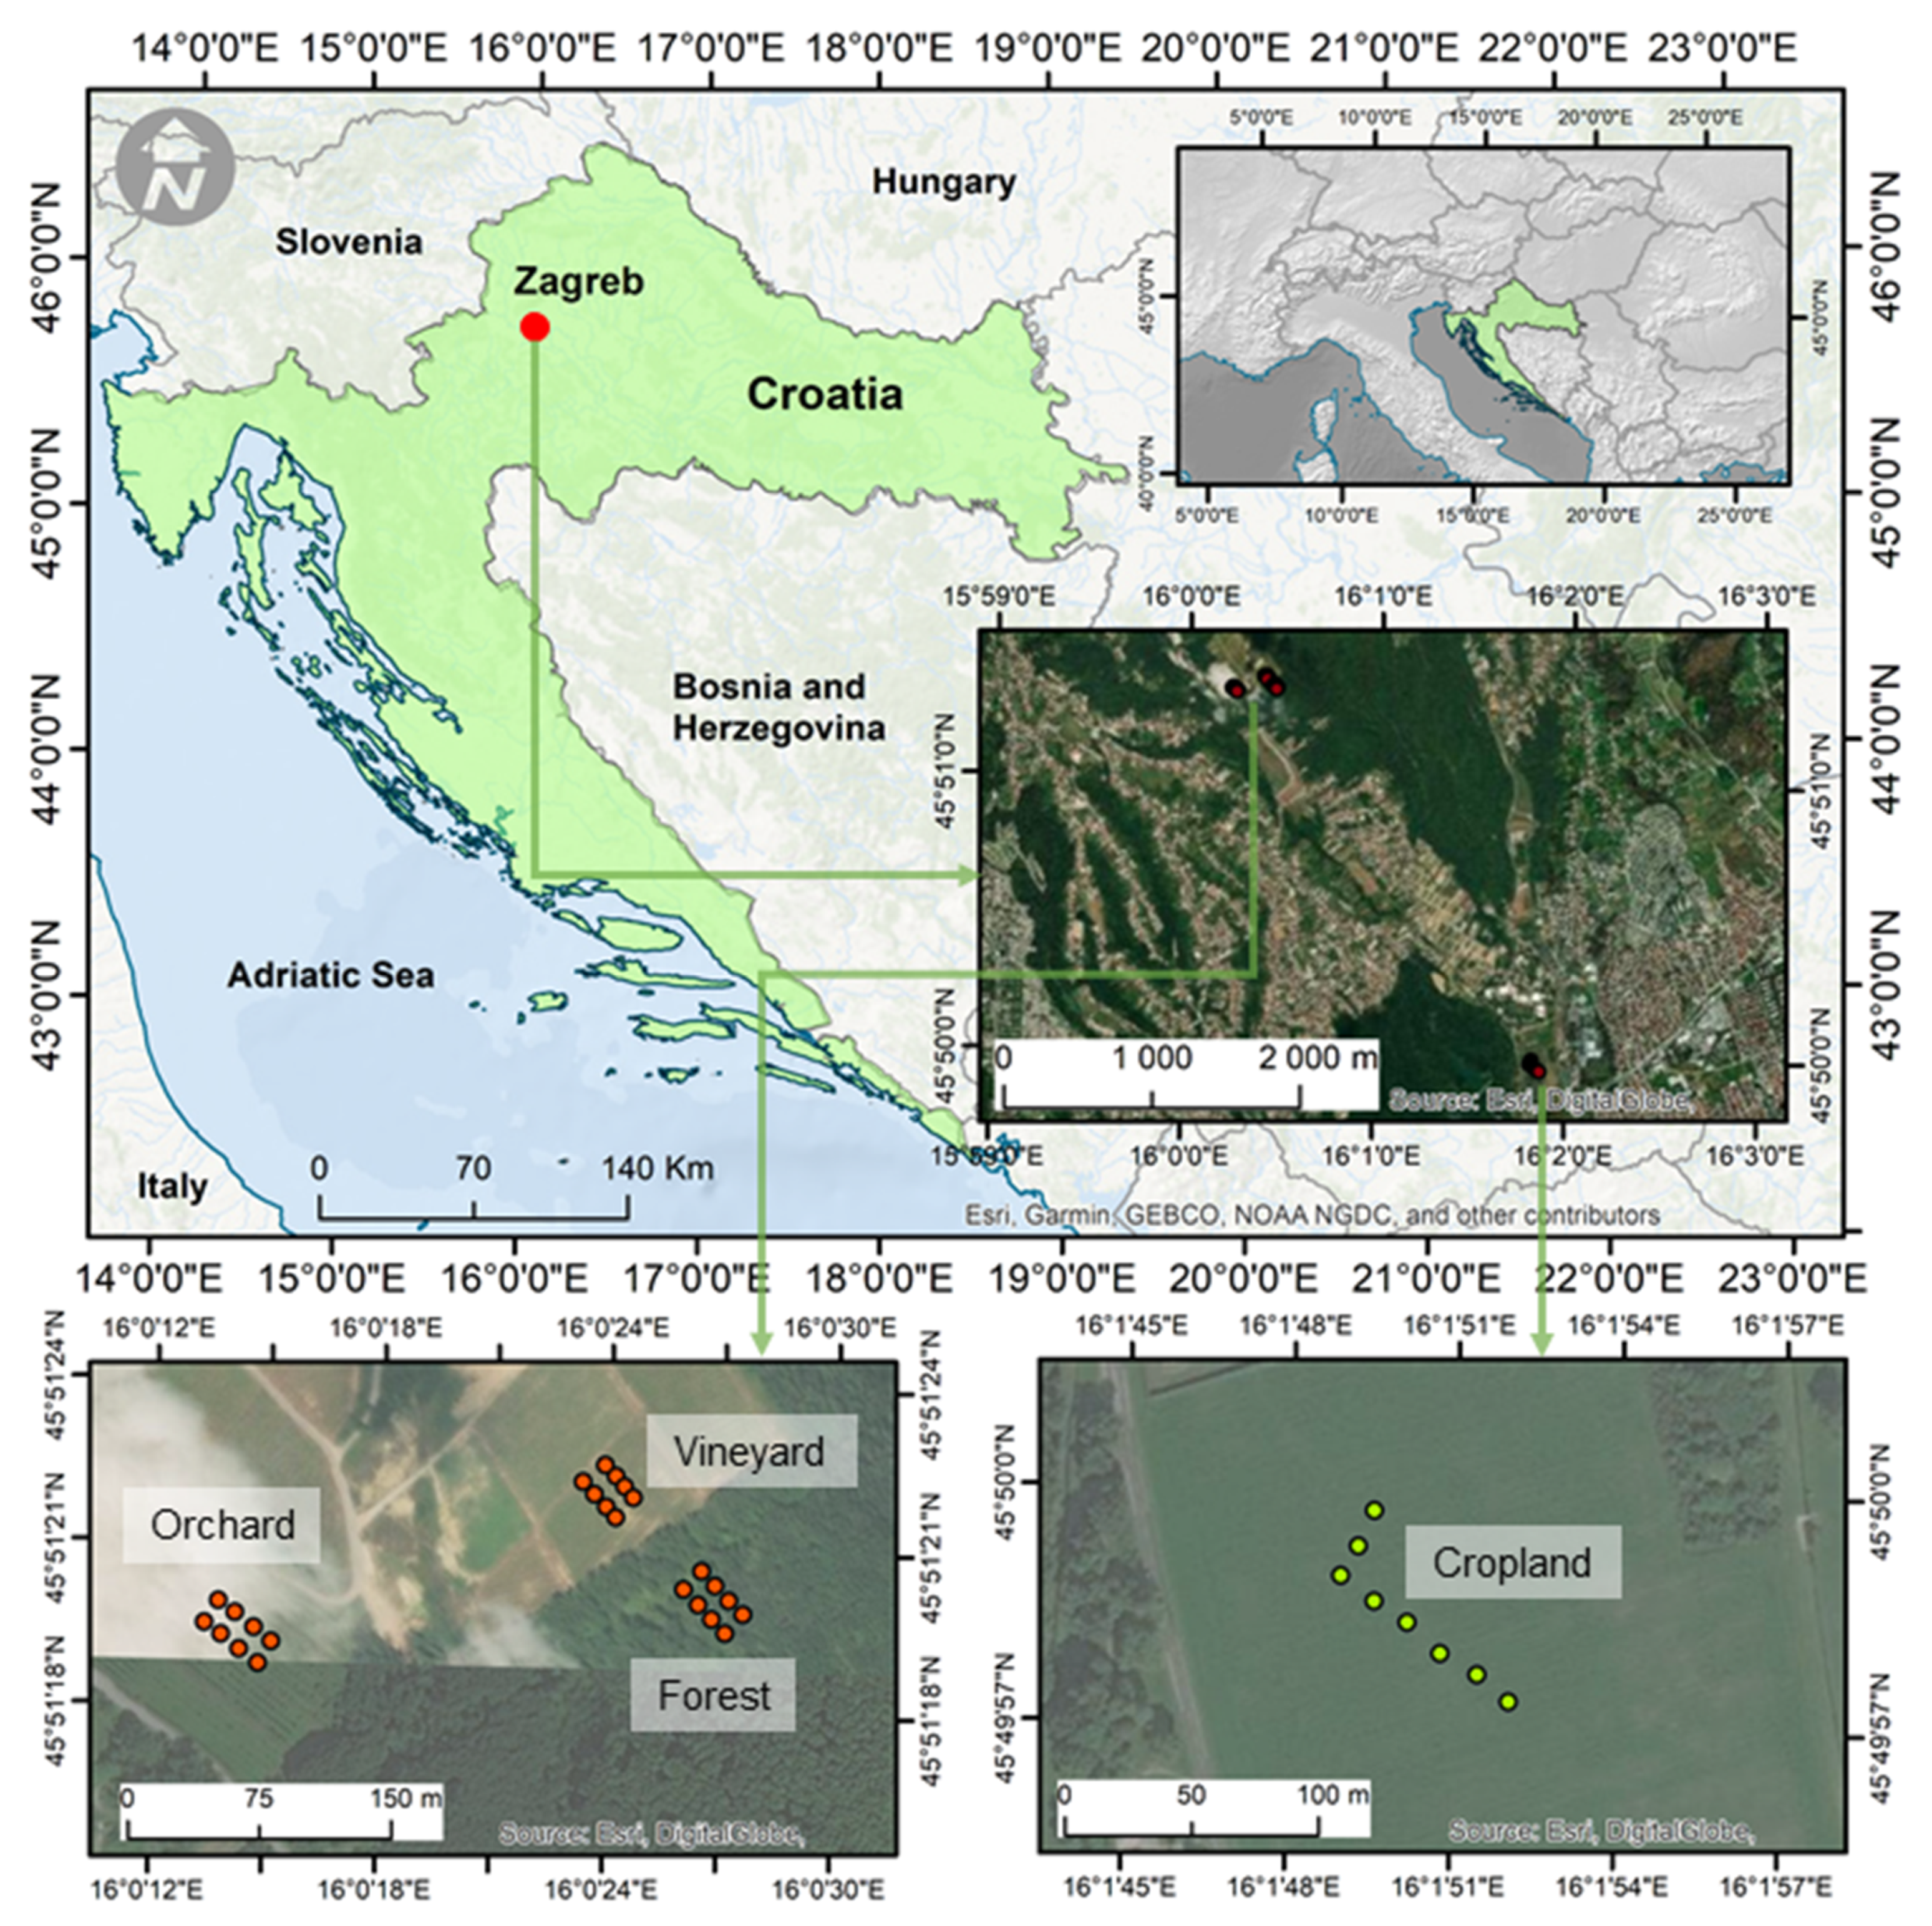
2.1. Study Area

Zagreb (Figure 1) is located at 45.8150° N, 15.9819° E, and has a temperate continental (Dfb) climate, according to Köppen [44]. The mean annual (1961–1990) precipitation is 852 mm, and the mean annual (1961–1990) temperature is 10.3 °C, ranging from 1.0 °C (January) to 22 °C (July). Zagreb population increased in the last years. The population in 2014 was 798,424 thousand inhabitants, while in 2018, there were 804,507 thousand inhabitants [45]. This dynamic contributed to urban sprawl phenomena and the expansion of urban areas into agricultural and forested areas. Urban development processes started to occur in the post-socialist period as a consequence of important political, economic, and social changes. During socialist times, there was no strategy of urban development. With capitalism, the change in the market laws and the aim of easy and fast profits, urban development increased [46]. This phenomenon is observed in other eastern European cities, as well [47]. The experimental site is located in the northwest part of Zagreb (Figure 1) (45° 51′ S; 16° 0′ E, 258 m.a.s.l.). Soils were classified as Stagnosols, Anthrosols created from Stagnosols and Dystric Cambisols [48]; the soil texture is silty clay loam (Table 1).

2.2. Treatments Description, Soil Sampling, and Laboratory Analysis

Four sites were selected for the experiment: forest (native vegetation, mostly dominated by Quercus robur) (FOR), (ii) orchard (mix of different species plums, apples and pears trees) (ORCH), (iii) cropland (CROP), and (iv) vineyard (VINE). FOR, ORCH and VINE plots had the same geomorphological characteristics, SW orientation, an inclination of 11%, and an elevation of 256 m.a.s.l. Nevertheless, in the nearby area, there was no area occupied by CROP with the same characteristics, and we had to select a plot with the same soil type that was close to the other plots. The CROP plot was flat and had an altitude of 136 m.a.s.l. We decided to include this plot because it is an important land-use type in this area (occupies 32.6% of the Zagreb area) and may have implications in terms of flood retention and C sequestration. Therefore, it is crucial to include it in this work.
ORCH is situated on terraces and is traditionally managed. The soil is grass-covered and has different types of fruits. Also, the soil is mulched with residues from the grass cuts. No tillage practices or insecticides were used here at least 20 years. Cropland is intensively managed with annual plowing followed by two diskings and roto-harrowing before sowing. Herbicides and insecticides are commonly used annually. Primary tillage for summer crops was implemented in the previous autumn (October or November), and supplementary tillage was applied in the following spring, prior to planting. Tillage practices for winter crops (primary and secondary) were carried out in September or October. The crops are grown following a typical rotation that included maize, soybean, winter wheat, oilseed rape, and alfalfa. The vineyard is managed with tillage based on an annual ripping and rotation digging in spring, followed by harrowing during the growing season. During the vegetation season and in the next one, natural vegetation-covered soil and mulching was performed with the residues left on the soil surface. Within the vines, the weeds were suppressed using herbicides. Chemical protection is commonly used. Such annual management has occurred here for more than 40 years.
Soils were collected in August 2018. Sampling points were identified with a GPS. Eight sampling points were selected in each land use area (Figure 1) (n = 32). Water infiltration measurements were carried out in the vicinity of sampling points with an automatic single ring device (DualHead infiltrometer, Decagon Devices, Pullman, WA, USA) [49]. Core soil sampling (8 per land-use class, 32 in total) was carried out at the 0–10 soil depths using 100 cm3 cylinders. Soil cores were wetted to measure water-holding capacity (WHC) and dried in an oven at 105 °C for 24 h to obtain the bulk density (BD) and air-filled porosity (AFP) according to Black [50]. Additional undisturbed samples (8 per land-use class, 32 in total) were sampled at the 0–10 cm depth. These samples were stored into rectangular boxes and used for the determination of the AS. Samples were broken gently in small pieces before sieving [51].
Aggregate stability was determined by a wet sieving apparatus (similar to [52]) by soaking 4 g of aggregates (diameter 0.4–0.5 mm) in distilled water for 3 min. After replacing cans with a dispersing solution (2 g NaOH/L) sieving continued until only the sand particles were left on the sieves. Both sets of cans were dried at 105 °C and weighted. Percentage of AS was obtained with the equation:
AS = W d s W d s + W d w
where AS is the percentage of stable water aggregates, Wds is the weight of aggregates dispersed in dispersing solution (g), and Wdw is the weight of aggregate dispersed in distilled water (g). Remains of the aggregate sizes were milled, sieved to a 2-mm mesh, and obtained for determination of soil organic matter and clay, silt and sand content.
Soil particle size distribution was determined by the pipette method with wet sieving (sand fractions) and sedimentation (silt and clay fractions) after soil dispersion with sodium pyrophosphate. Organic matter content was determined by acid potassium-dichromate digestion after the Tjurin method [53]. The SOCS concentrations were determined for depth 0–10 cm. The SOCS content was calculated from the organic matter using the following formula [54]:
S O C = S O M ÷ 1.724
Soil organic carbon stock, expressed for a 0–10 cm depth in t ha−1, was computed as the product of SOC concentration, bulk density, depth, and gravel using the following equation [55]:
S O C   s t o c k = S O C   c o n c e n t r a t i o n × B D × d × ( 1 C F )
where SOC is the organic carbon content (g g−1), BD the soil bulk density (g cm−3), d the thickness of the layer (cm), and CF the proportion (g g−1) of coarse (>2 mm) fragments in the layer.

2.3. Statistical Analysis
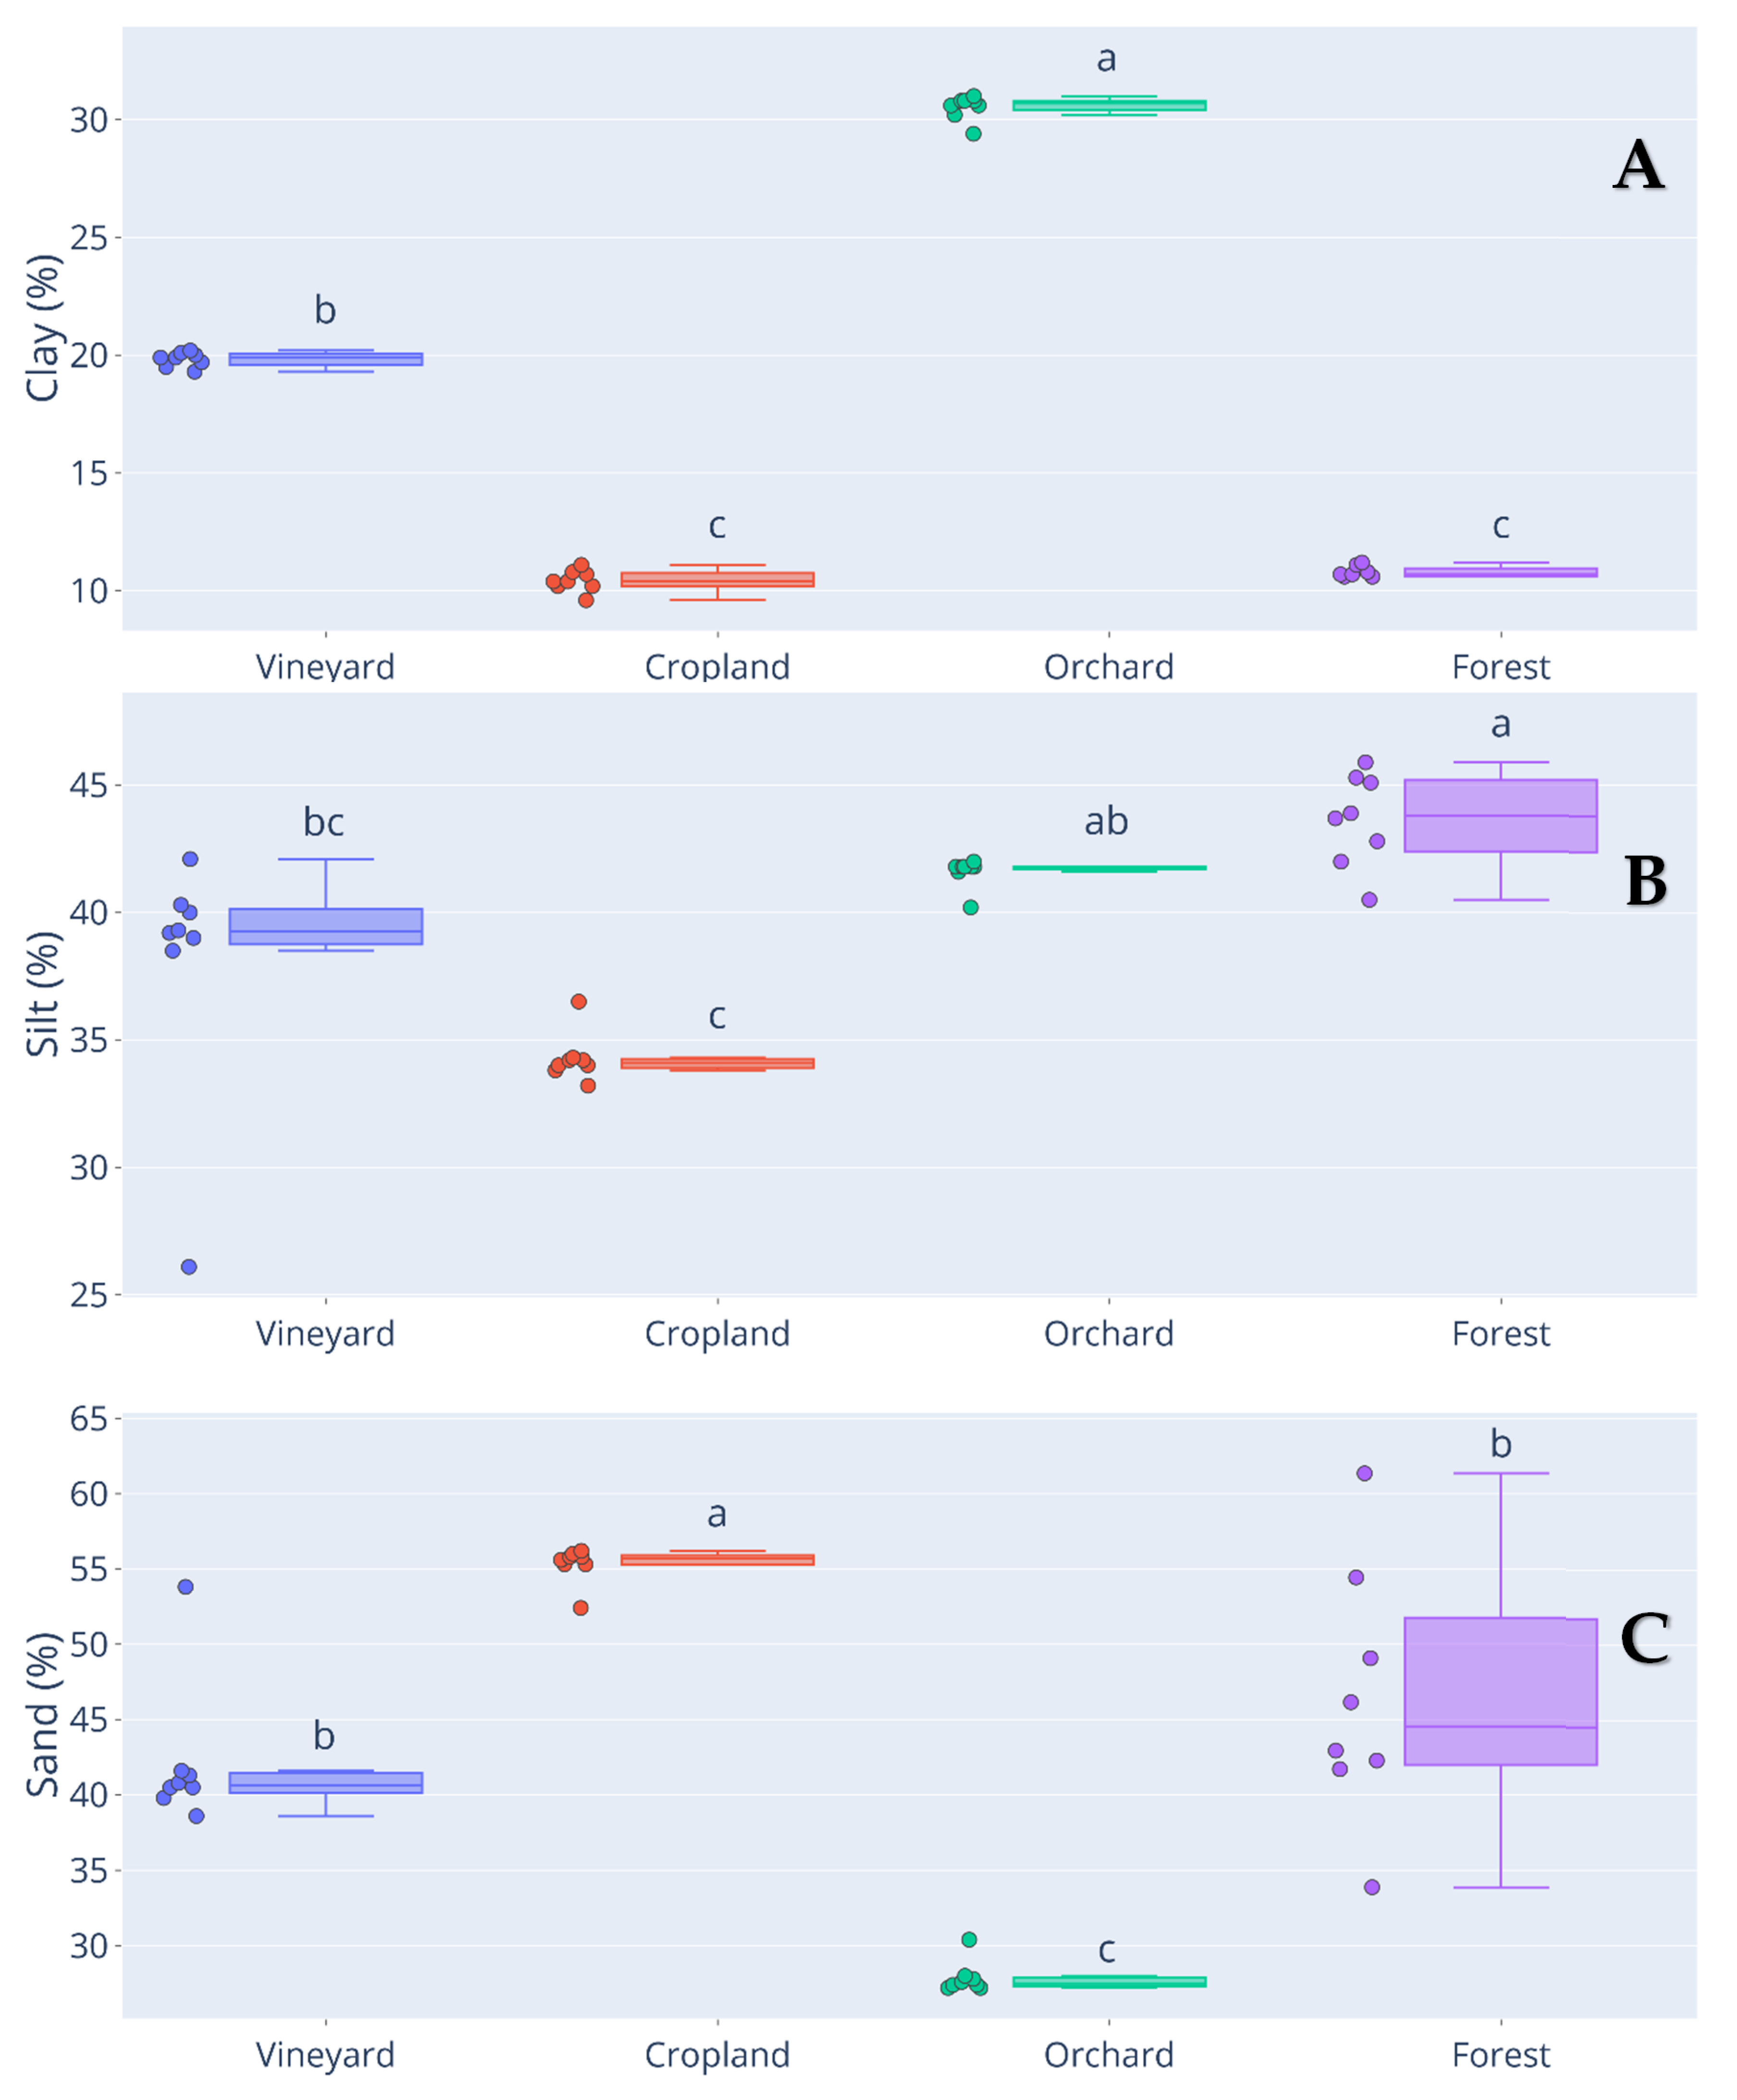
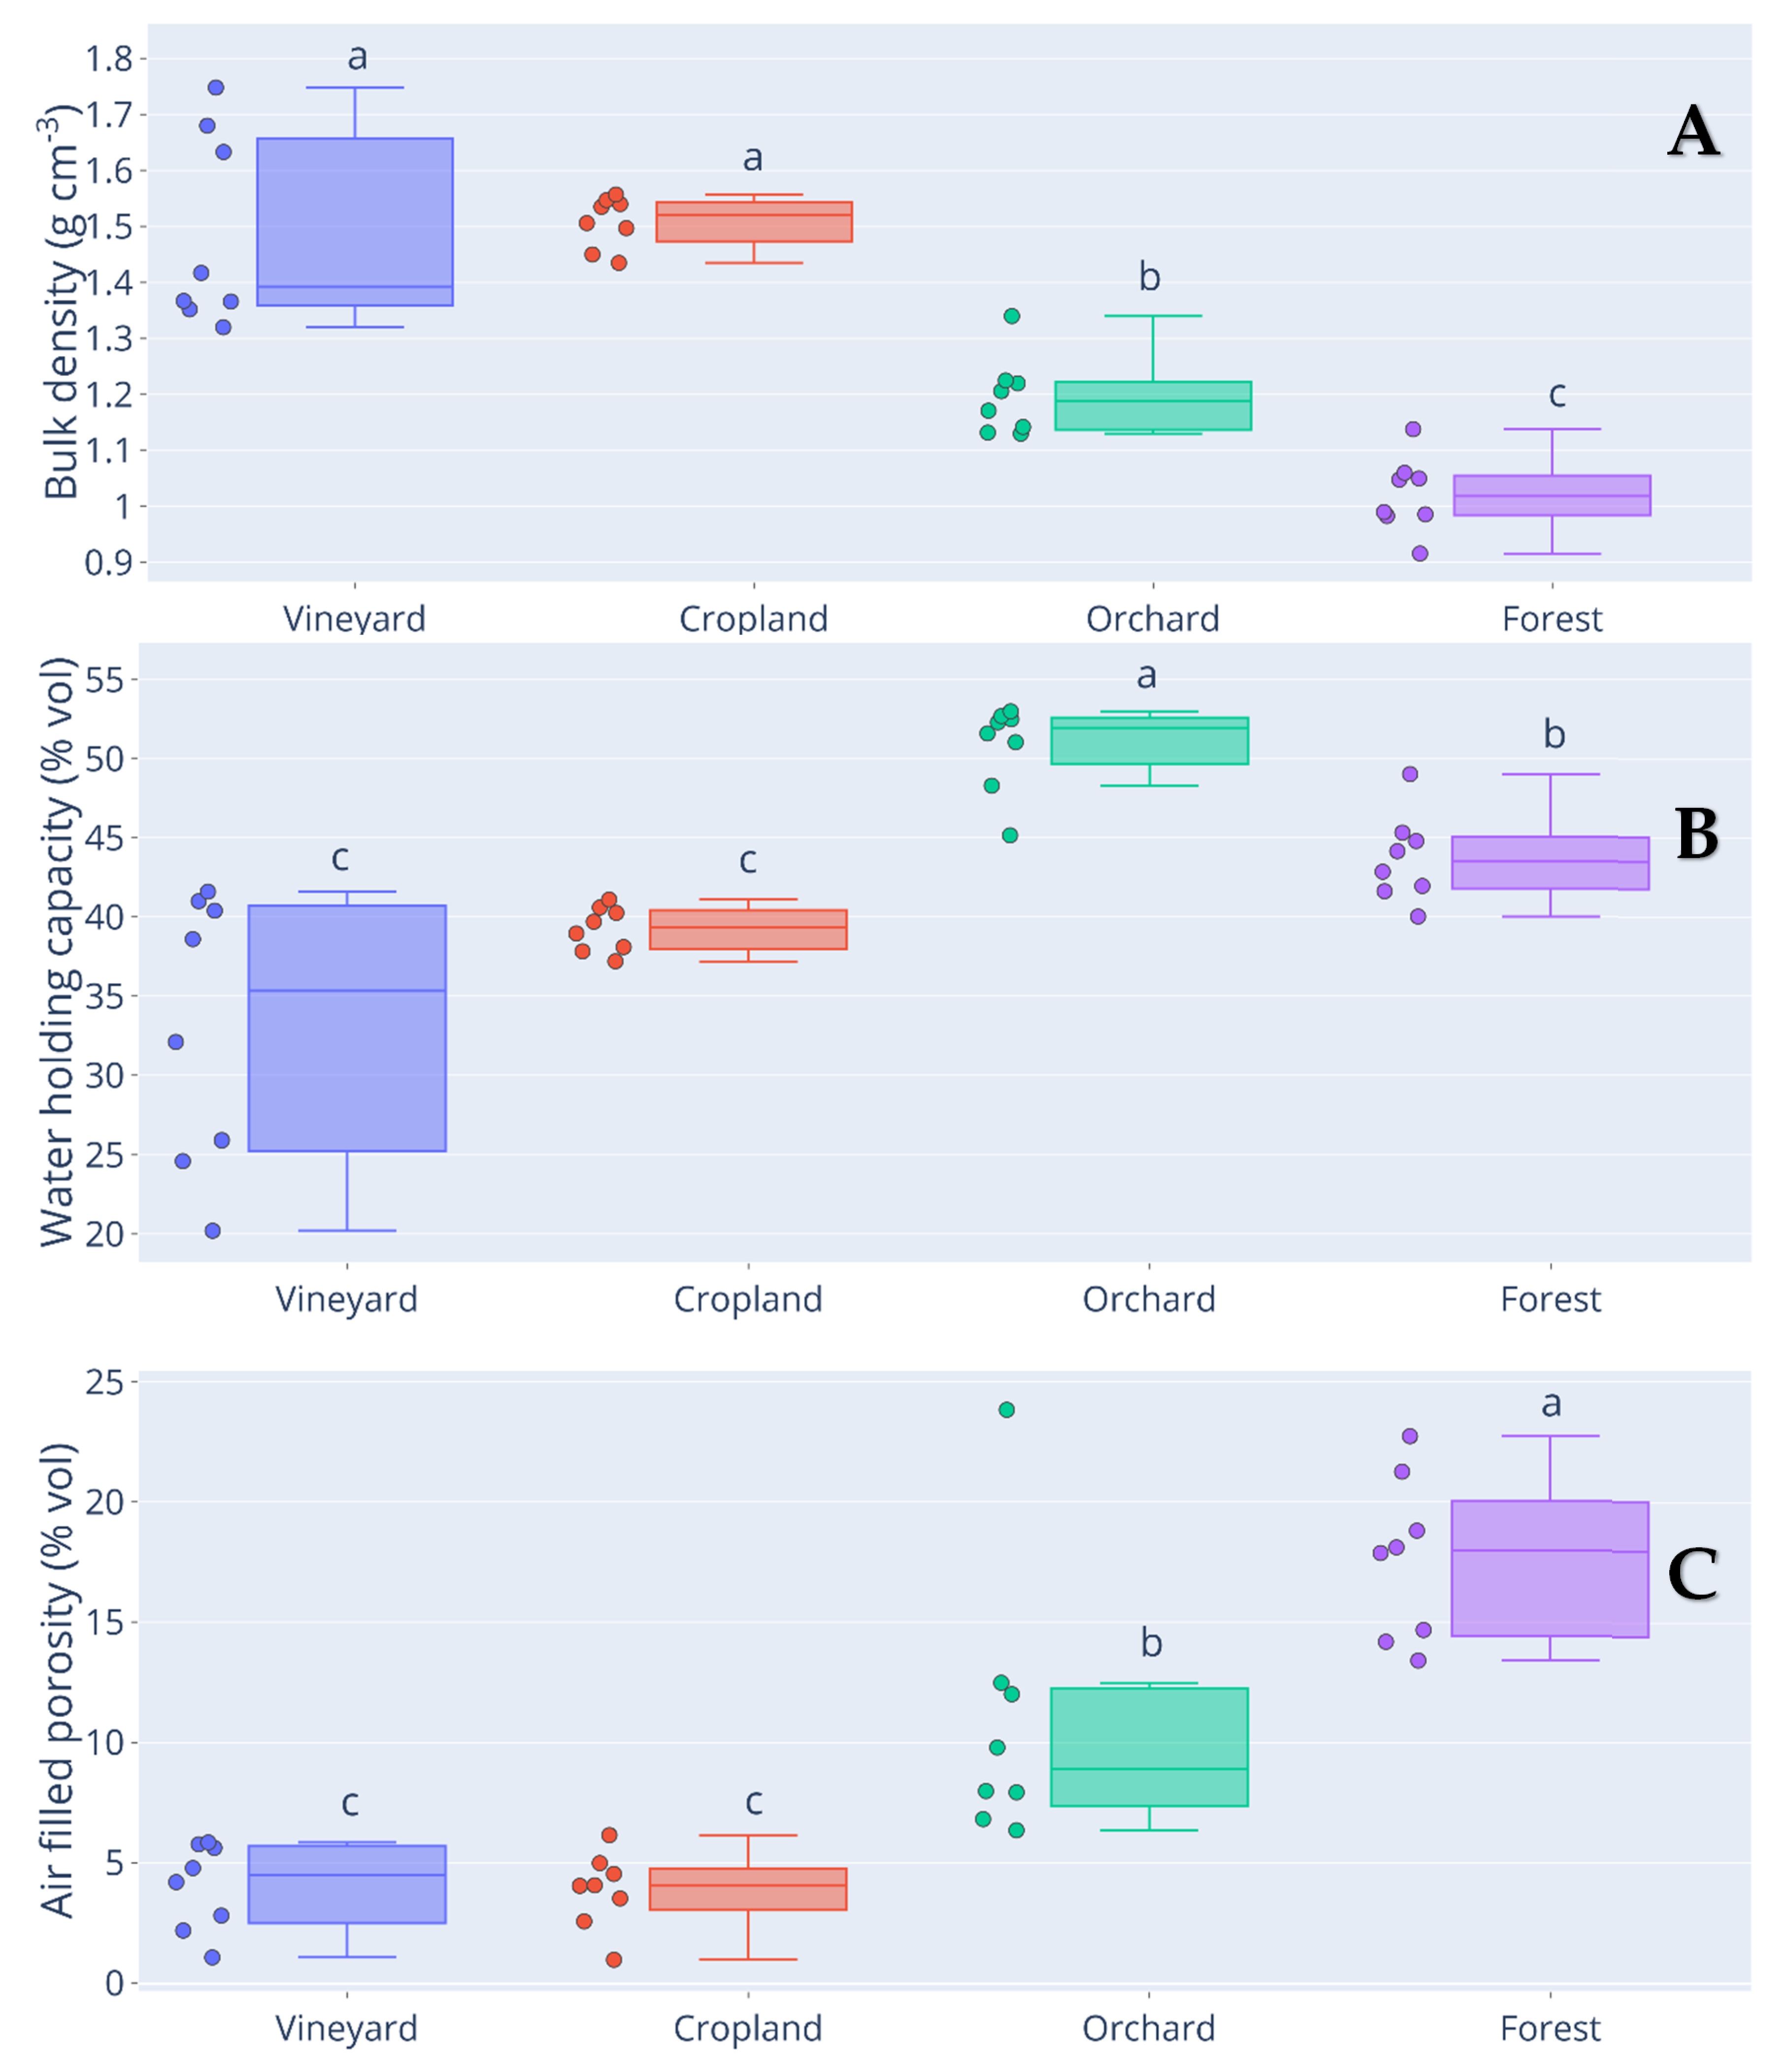
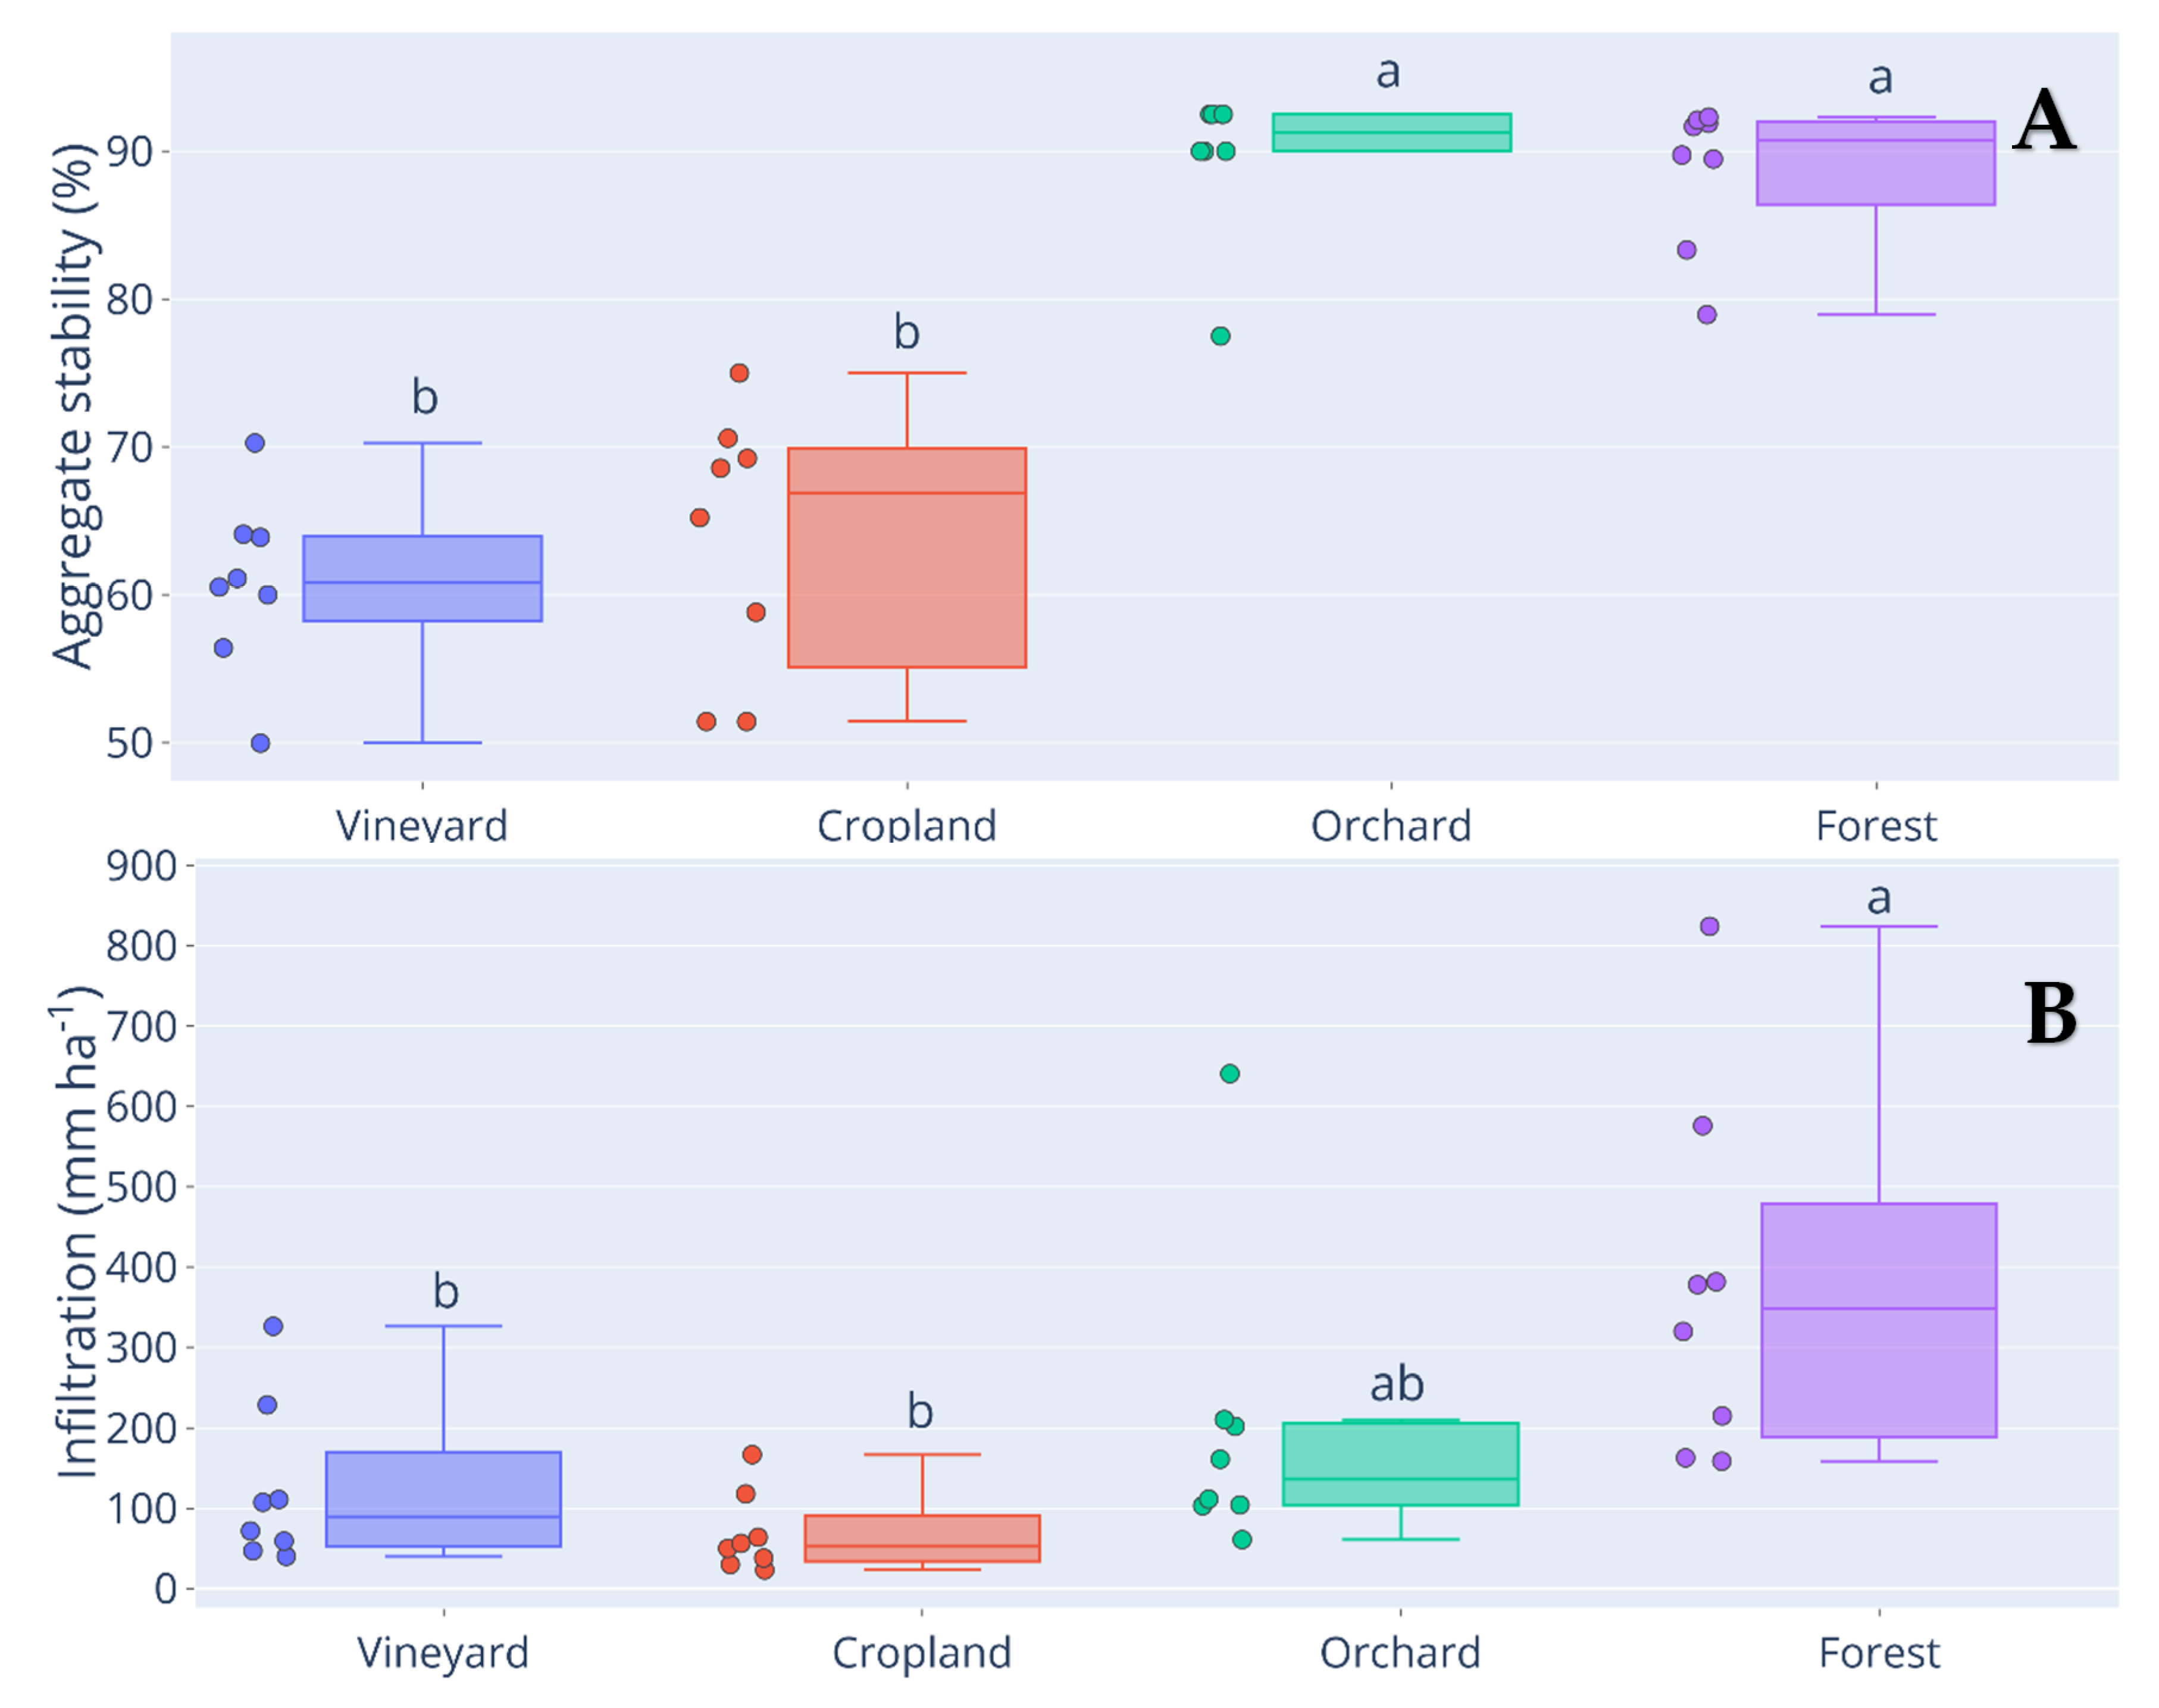
Previous to statistical analysis, normality and homogeneity of the variances were assessed using the Shapiro–Wilk test and Leven’s test, respectively. Normality and heteroscedasticity were considered at a p > 0.05. WHC, AFP, SOCS, Clay, and AS, did not respect the normality and homogeneity of the variances. Data were normalized by applying square-root (SQRT), logarithmic (Log), and Box-Cox (BC) transformations. All the statistical analyses were carried out using the normalized data. However, original data is presented in the graphs. Statistical comparisons among land uses were carried out with a one-way ANOVA test. Significant differences were considered at a p < 0.05. In the case, that significant differences were found, a Tukey HSD test was applied. In order to identify the relations between variables and land uses, a redundancy analysis (RDA) was carried out. Statistical analyses were done using Statistica 7.0 and CANOCO 4.5 for Windows. Graphics were carried out using Plotly version 4.1 [56].

3. Results

Soil clay content was significantly higher in ORCH than in VINE, CROP, and FOR. CROP and FOR also had a significantly lower clay content than VINE (Figure 2A). FOR and ORCH had a significantly higher silt content compared to CROP. No differences were observed between VINE and CROP (Figure 2B). Finally, sand content was significantly higher in CROP than FOR, VINE, and ORCH. No differences were identified between FOR and VINE. ORCH also had a significantly lower sand continent compared to VINE and FOR (Figure 2C).
BD was significantly higher in VINE and CROP than in ORCH and FOR. Also, BD was significantly lower in FOR than in ORCH (Figure 3A). WHC was significantly lower in VINE and CROP compared to ORCH and FOR. ORCH had a significantly higher WHC than FOR (Figure 3B). AFP was significantly higher in FOR than in all the other plots. No differences were observed between VINE and CROP. ORCH had a significantly higher AFP than VINE and CROP (Figure 3C).
AS was significantly higher in ORCH and FOR than in VINE and CROP (Figure 4A). Water infiltration was significantly higher in FOR than in VINE and CROP. No differences were observed between ORCH, CROP, and VINE (Figure 4B). Finally, soil OM and SOCS were significantly higher in FOR than in the other land uses. In both cases, VINE and CROP were significantly lower than ORCH (Figure 5A,B). The RDA factor explained 33.3% of the variance and factor 2 31.3%. AFP, water infiltration, OM, SOCS, silt content, and AS had high values in FOR. WHC and clay content in ORCH, while BD and sand content in CROP (Figure 6, Table S1).

4. Discussion

The clay content in ORCH was significantly higher than the other plots. Also, the clay content in VINE was significantly higher than the CROP and FOR. This might be attributed to the fact that ORCH plots were located in terraces. Terraces are known to retain sediments [57,58] and it is very likely that throughout the years, orchard terraces retained a substantial amount of clay particles coming from upper slope positions. Also, the lack of tillage might have contributed to this. Previous works carried out in the same environment found that in these Stagnosols, nontilled plots were where the clay content was the highest [59]. The high BD and low WHC and AFP in VINE and CROP were attributed to the conventional treatment applied in these plots (e.g., tillage and agrochemicals application). Previous works observed that tractor traffic and tillage increase soil compaction, both in croplands [60] and vineyards [61]. The effect of tractor traffic in Croatian vineyards is very high since the yearly traffic frequency per vineyard can exceed 12 times [61]. On the other hand, conventional management decreases WHC [62] and porosity [63]. In the same line, AS was significantly lower in VINE and CROP, compared to FOR. This is also attributed to the conventional management applied, which is known to reduce AS [64,65,66]. The high BD and the reduced WHC, AFP, and AS imposed by intensive tillage and agrochemicals application are the causes for the significantly lower water infiltration in VINE and CROP than FOR. Soils treated with conventional agricultural practices normally have a low infiltration ratio compared with FOR, as observed elsewhere [67,68,69]. Finally, soil OM and SOCS were significantly higher in FOR compared to the other land uses as a consequence of the absence of human disturbance. FOR soils have a high capacity for C sequestration that is higher than in agricultural areas [70,71]. ORCH was in an intermediary position between FOR, and VINE/CROP land uses. In water infiltration, there were no significant differences with FOR. In other cases (e.g., soil OM and SOCS) ORCH was significantly different from all the other treatments. This means that the practices applied ORCH plots (diverse fruit trees, no-tillage, and soil protection with residues from the grass cuts) are friendly when compared to the ones carried out in VINE and CROP. Previous works highlighted that diverse farms have a high capacity to improve soil WHC, AS, water infiltration [72,73] and C sequestration [74]. The RDA results showed that FOR soil is the one with the highest quality, since it has the highest AFP, water infiltration, OM, SOCS, AS, and WHC, while VINE and CROP had the lowest one. Soils with high AS, OM, AFP, and low BD, have high porosity and, therefore, a high hydraulic conductivity. Similar results observed that forest soils had a higher quality when compared to agricultural ones [75,76]. High levels of OM are related to high water infiltration, AFP AS, and WHC and are indicators of healthy soil [77].
The present study reveals that unsustainable land-use practices (VINE and CROP) can decrease important soil functions provided by the ecosystem. This is particularly critical in areas located in urban areas since the capacity to mitigate floods is reduced. Our study showed that ORCH and FOR land uses have a high capacity of water infiltration and are very likely to mitigate flood impacts. Previous works observed that forest land-uses located near urban areas have a high capacity for flood retention [78,79,80]. The areas used for agriculture can also contribute to the reduction of flood impacts [81]. However, as our study highlighted, this depends on the type of management carried out. If the practices are extensive (ORCH), it is very likely that these areas can contribute to flood mitigation [82] and decrease the flood economic losses [83]. When agriculture areas are managed intensively (VINE and CROP), the capacity of these areas to retain flood is significantly reduced. In the present case, it is likely that the areas with high soil compaction may even increase the flood impacts. Poor management practices, especially in sloped areas (e.g., VINE), can enhance flood risks [84]. FOR and ORCH land uses may act as a C sink. On the other hand, the intensive practices carried out at VINE and CROP likely contribute to C losses. However, it is worthy to highlight that VINE and CROP have a high capacity to sequester C due to the reduced OM. If managed properly they could act as a C sink [85]. Several works highlighted that intensive agricultural practices contribute to greenhouse emissions [86,87,88]. In the case of urban agriculture, this can amplify the impacts of urban activities on climate change, and soil C sequestration service is lost.
Agriculture is crucial to ensure food security, increase the income of the urban population [18,89]. Nevertheless, there are significant trade-offs associated with intensive agriculture, such as the reduction of important soil functions and regulating ecosystem services such as flood retention and C sequestration. Therefore, more sustainable management of VINE and CROP land uses needed to increase soil function capacity. Decreased tractor traffic, reduced or no-tillage management, a transition to organic production, wide crop rotation, and organic fertilization in these plots would be beneficial for soil quality [8,31,90]. The implementation of crop diversification practices would be relevant to reverse soil degradation process. For instance, the management applied in ORCH land use is a good example of how to preserve soil quality. The preservation of soil quality should be a national priority [91,92]. Therefore, it is key to maintain forests in urban areas. These areas can provide another type of ecosystem service such as habitat support, air pollution, and microclimate regulation, soil formation, pollination, groundwater recharge, and recreation [93].
The maintenance of a good soil quality status is key to achieve national (e.g., The Environmental Protection Act OG 80/13) and European level (e.g., flood directive—2007/60/EC; water framework directive—2000/60/EC; groundwater directive—2006/118/EC; nitrates directive—91/676/EEC; habitats directive—92/43/EEC) and global targets (United Nations Sustainable Development Goals (SDGs)), to which the European Union is strongly committed [94]. The United Nations SDGs connect soil functions with ecosystem services, and are directly related to SDGs 2 and 6 (Zero Hunger and Clean Water and sanitation)—food security; SDG 3 (Good health and wellbeing)—food safety; SDG 11 (Sustainable Cities and Communities)—urban development; SDG 13 (Climate Action)—C sequestration; SDG 15 (Life on Land)—sustainability of terrestrial ecosystem services. SDGs 7 (Affordable and Clean Energy) and 14 (Life Below Water) are dependent on the soil’s functional condition [95]. Overall, sustainable practices that encourage the maintenance and restoration of soil quality status are vital to achieving sustainable development goals.
This is a first approach to study the effects of different land use management on soil properties. The results are limited to the effects on the studied soils and this could be considered a limitation. In this context, is important to carry out similar works focused on the effect of soil management in different types of soils and their hydrological response. The inclusion of the temporal factor would be an advantage as well, since peri-urban areas are subject to rapid land-use changes.

5. Conclusions

The results of this work showed that soil clay content was affected by sediment retention of the terraces in ORCH. Intensive agriculture practices in VINE and CROP land-use increased soil compaction and reduced WHC, AFP, AS, water infiltration, OM, and SOCS. The soil with the highest quality was from FOR land use as a consequence of reduced human disturbance, while ORCH soil is in an intermediate position between VINE, CROP and FOR. Sustainable agricultural practices carried out in this land-use type favored a high WHC, AFP, AS, soil OM, and SOCS when compared to the other agricultural plots. ORCH land use is a good example of sustainable land management. The soils from FOR and ORCH can mitigate the impacts of floods in urban areas and contribute to C sequestration. On the other hand, the soils from VINE and CROP as a consequence of the intensive land use may increase flood risk and increase C loss.

Supplementary Materials

The following are available online at https://www.mdpi.com/2073-4395/10/9/1331/s1, Table S1: Original data from research area.

Author Contributions

Conceptualization, I.B. and P.P.; methodology, I.B.; validation, A.V., L.J.T., I.M. and I.B.; formal analysis, P.P., M.F. and L.J.T.; investigation, I.B.; writing—original draft preparation, I.B. and A.V.; writing—review and editing, P.P., M.F. and I.M.; visualization, P.P. and M.F.; supervision, I.B.; project administration, I.B.; funding acquisition, I.B. All authors have read and agreed to the published version of the manuscript.

Funding

This work was supported by Croatian Science Foundation through the project “Soil erosion and degradation in Croatia” (UIP-2017-05-7834) (SEDCRO).

Conflicts of Interest

The authors declare no conflict of interest.

References

  1. Gibbs, H.K.; Rausch, L.; Munger, J.; Schelly, I.; Morton, D.C.; Noojipady, P.; Soares-Filho, B.; Barreto, P.; Micol, L.; Walker, N.F.; et al. Brazil’s Soy Moratorium. Science 2015, 347, 377–378. [Google Scholar] [CrossRef] [PubMed]
  2. Khaledian, Y.; Kiani, F.; Ebrahimi, S.; Brevik, E.C.; Aitkenhead-Peterson, J.; Khaledian, M. Assessment and Monitoring of Soil Degradation during Land Use Change Using Multivariate Analysis. Land Degrad. Dev. 2016, 28, 128–141. [Google Scholar] [CrossRef]
  3. United Nations. Available online: https://www.un.org/en/sections/issues-depth/population/ (accessed on 16 May 2020).
  4. Wei, Y.D.; Ewing, R. Urban expansion, sprawl and inequality. Landsc. Urban Plan. 2018, 177, 259–265. [Google Scholar] [CrossRef]
  5. Pereira, P.; Barceló, D.; Panagos, P. Soil and water threats in a changing environment. Environ. Res. 2020, 186, 109501. [Google Scholar] [CrossRef]
  6. Sarkodie, S.A.; Owusu, P.A.; Leirvik, T. Global effect of urban sprawl, industrialization, trade and economic development on carbon dioxide emissions. Environ. Res. Lett. 2020, 15, 034049. [Google Scholar] [CrossRef]
  7. Scalenghe, R.; Marsan, F.A. The anthropogenic sealing of soils in urban areas. Landsc. Urban Plan. 2009, 90, 1–10. [Google Scholar] [CrossRef]
  8. Bakker, M.M.; Govers, G.; Kosmas, C.; Vanacker, V.; Van Oost, K.; Rounsevell, M. Soil erosion as a driver of land-use change. Agric. Ecosyst. Environ. 2005, 105, 467–481. [Google Scholar] [CrossRef]
  9. Giertz, S.; Junge, B.; Diekkrüger, B. Assessing the effects of land use change on soil physical properties and hydrological processes in the sub-humid tropical environment of West Africa. Phys. Chem. Earth Parts A/B/C 2005, 30, 485–496. [Google Scholar] [CrossRef]
  10. Borrelli, P.; Robinson, D.; Fleischer, L.R.; Lugato, E.; Ballabio, C.; Alewell, C.; Meusburger, K.; Modugno, S.; Schütt, B.; Ferro, V.; et al. An assessment of the global impact of 21st century land use change on soil erosion. Nat. Commun. 2017, 8, 2013. [Google Scholar] [CrossRef] [Green Version]
  11. De Almeida, W.S.; Panachuki, E.; De Oliveira, P.T.S.; Menezes, R.D.S.; Sobrinho, T.A.; De Carvalho, D.F. Effect of soil tillage and vegetal cover on soil water infiltration. Soil Tillage Res. 2018, 175, 130–138. [Google Scholar] [CrossRef]
  12. Bogunović, I.; Fernández, M.P.; Kisic, I.; Marimón, M.B. Agriculture and grazing environments. In Advances in Chemical Pollution, Environmental Management and Protection, 1st ed.; Elsevier BV: London, UK, 2019; Volume 4, pp. 23–70. [Google Scholar]
  13. Canedoli, C.; Crocco, F.; Comolli, R.; Padoa-Schioppa, E. Landscape fragmentation and urban sprawl in the urban region of Milan. Landsc. Res. 2017, 43, 632–651. [Google Scholar] [CrossRef]
  14. Weilenmann, B.; Seidl, I.; Schulz, T. The socio-economic determinants of urban sprawl between 1980 and 2010 in Switzerland. Landsc. Urban Plan. 2017, 157, 468–482. [Google Scholar] [CrossRef]
  15. Abu Hatab, A.; Cavinato, M.E.R.; Lindemer, A.; Lagerkvist, C.-J. Urban sprawl, food security and agricultural systems in developing countries: A systematic review of the literature. Cities 2019, 94, 129–142. [Google Scholar] [CrossRef]
  16. Zasada, I. Multifunctional peri-urban agriculture—A review of societal demands and the provision of goods and services by farming. Land Use Policy 2011, 28, 639–648. [Google Scholar] [CrossRef]
  17. Ferreira, A.J.D.; Guilherme, R.I.M.M.; Ferreira, C.S.; Oliveira, M.D.F. Urban agriculture, a tool towards more resilient urban communities? Curr. Opin. Environ. Sci. Health 2018, 5, 93–97. [Google Scholar] [CrossRef]
  18. Opitz, I.; Berges, R.; Piorr, A.; Krikser, T. Contributing to food security in urban areas: Differences between urban agriculture and peri-urban agriculture in the Global North. Agric. Hum. Values 2015, 33, 341–358. [Google Scholar] [CrossRef] [Green Version]
  19. Dieleman, H. Urban agriculture in Mexico City; balancing between ecological, economic, social and symbolic value. J. Clean. Prod. 2017, 163, S156–S163. [Google Scholar] [CrossRef]
  20. Grebitus, C.; Printezis, I.; Printezis, A. Relationship between Consumer Behavior and Success of Urban Agriculture. Ecol. Econ. 2017, 136, 189–200. [Google Scholar] [CrossRef] [Green Version]
  21. Duvernoy, I.; Zambon, I.; Sateriano, A.; Salvati, L. Pictures from the other side of the fringe: Urban growth and peri-urban agriculture in a post-industrial city (Toulouse, France). J. Rural Stud. 2018, 57, 25–35. [Google Scholar] [CrossRef]
  22. Boente, C.; Matanzas, N.; García-González, N.; Rodríguez-Valdés, E.; Gallego, J.; Gallego, J. Trace elements of concern affecting urban agriculture in industrialized areas: A multivariate approach. Chemosphere 2017, 183, 546–556. [Google Scholar] [CrossRef]
  23. Keshavarzi, B.; Najmeddin, A.; Moore, F.; Moghaddam, P.A. Risk-based assessment of soil pollution by potentially toxic elements in the industrialized urban and peri-urban areas of Ahvaz metropolis, southwest of Iran. Ecotoxicol. Environ. Saf. 2018, 167, 365–375. [Google Scholar] [CrossRef] [PubMed]
  24. Joimel, S.; Cortet, J.; Jolivet, C.; Saby, N.; Chenot, E.; Branchu, P.; Consalès, J.; Lefort, C.; Morel, J.-L.; Schwartz, C. Physico-chemical characteristics of topsoil for contrasted forest, agricultural, urban and industrial land uses in France. Sci. Total Environ. 2016, 40–47. [Google Scholar] [CrossRef] [PubMed] [Green Version]
  25. Delelegn, Y.T.; Purahong, W.; Blazevic, A.; Yitaferu, B.; Wubet, T.; Göransson, H.; Godbold, D.L. Changes in land use alter soil quality and aggregate stability in the highlands of northern Ethiopia. Sci. Rep. 2017, 7, 13602. [Google Scholar] [CrossRef] [PubMed] [Green Version]
  26. Smith, P. Land use change and soil organic carbon dynamics. Nutr. Cycl. Agroecosyst. 2007, 81, 169–178. [Google Scholar] [CrossRef]
  27. Don, A.; Schumacher, J.; Freibauer, A. Impact of tropical land-use change on soil organic carbon stocks - a meta-analysis. Glob. Chang. Biol. 2010, 17, 1658–1670. [Google Scholar] [CrossRef] [Green Version]
  28. Poeplau, C.; Don, A.; Vesterdal, L.; Leifeld, J.; Van Wesemael, B.; Schumacher, J.; Gensior, A. Temporal dynamics of soil organic carbon after land-use change in the temperate zone - carbon response functions as a model approach. Glob. Chang. Biol. 2011, 17, 2415–2427. [Google Scholar] [CrossRef]
  29. Demestihas, C.; Plénet, D.; Génard, M.; Raynal, C.; Lescourret, F. Ecosystem services in orchards. A review. Agron. Sustain. Dev. 2017, 37, 581. [Google Scholar] [CrossRef]
  30. Biddoccu, M.; Ferraris, S.; Pitacco, A.; Cavallo, E. Temporal variability of soil management effects on soil hydrological properties, runoff and erosion at the field scale in a hillslope vineyard, North-West Italy. Soil Tillage Res. 2017, 165, 46–58. [Google Scholar] [CrossRef] [Green Version]
  31. Pereira, P.; Bogunović, I.; Muñoz-Rojas, M.; Brevik, E.C. Soil ecosystem services, sustainability, valuation and management. Curr. Opin. Environ. Sci. Health 2018, 5, 7–13. [Google Scholar] [CrossRef]
  32. St-Hilaire, A.; Duchesne, S.; Rousseau, A.N. Floods and water quality in Canada: A review of the interactions with urbanization, agriculture and forestry. Can. Water Resour. J. / Rev. Can. des ressources hydriques 2015, 41, 273–287. [Google Scholar] [CrossRef]
  33. Douglas, I. The challenge of urban poverty for the use of green infrastructure on floodplains and wetlands to reduce flood impacts in intertropical Africa. Landsc. Urban Plan. 2018, 180, 262–272. [Google Scholar] [CrossRef]
  34. Zinia, N.J.; McShane, P. Ecosystem services management: An evaluation of green adaptations for urban development in Dhaka, Bangladesh. Landsc. Urban Plan. 2018, 173, 23–32. [Google Scholar] [CrossRef]
  35. Clark, K.M.; Boardman, D.L.; Staples, J.S.; Easterby, S.; Reinbott, T.M.; Kremer, R.J.; Kitchen, N.R.; Veum, K.S. Crop Yield and Soil Organic Carbon in Conventional and No-till Organic Systems on a Claypan Soil. Agron. J. 2017, 109, 588–599. [Google Scholar] [CrossRef]
  36. Ghimire, R.; Lamichhane, S.; Acharya, B.S.; Bista, P.; Sainju, U.M. Tillage, crop residue, and nutrient management effects on soil organic carbon in rice-based cropping systems: A review. J. Integr. Agric. 2017, 16, 1–15. [Google Scholar] [CrossRef]
  37. Bernat, S.; Arbanas, S.M.; Krkač, M. Inventory of Precipitation Triggered Landslides in the Winter of 2013 in Zagreb (Croatia, Europe). In Landslide Science for a Safer Geoenvironment; Springer: Berlin, Germany, 2014; pp. 829–835. [Google Scholar]
  38. Lončar, J. Spatial structure of some business activities in the area of small and mid-size cities (peri-urban area) in the county of Zagreb. Analele Universităţii din Oradea, Seria Geografie 2017, 2, 280–291. [Google Scholar]
  39. Husnjak, S.; Vrhovec, D.; Romić, M.; Borošić, J.; Mirošević, N.; Čmelik, Z.; Pospišil, M.; Kušan, V. Inventory of Agricultural Land in the City of Zagreb and Recommendations for Agricultural Production. 2008, p. 137. Available online: https://www.zagreb.hr/UserDocsImages/Poljoprivreda-poljoprivredno%20zemljiste/Inventarizacija%20poljoprivrednog%20zemlji%C5%A1ta-cijeli%20rad%20u%20jednom-Iva-za%20web-pdf.pdf (accessed on 6 August 2020).
  40. Corine Land Cover. CLCCro Home Page. Available online: http://corine.haop.hr/dash-county/21 (accessed on 20 August 2020).
  41. Bathrellos, G.; Skilodimou, H.D.; Chousianitis, K.; Youssef, A.M.; Pradhan, B. Suitability estimation for urban development using multi-hazard assessment map. Sci. Total Environ. 2017, 575, 119–134. [Google Scholar] [CrossRef]
  42. Degórska, B.; Degórski, M. Influence of Climate Change on Environmental Hazards and Human Well-Being in the Urban Areas—Warsaw Case Study Versus General Problems. In Climate Change, Extreme Events and Disaster Risk Reduction; Sustainable Development Goals Series; Mal, S., Singh, R., Huggel, C., Eds.; Springer: Cham, Switzerland, 2018; pp. 43–57. [Google Scholar]
  43. Pan, H.; Page, J.; Zhang, L.; Cong, C.; Ferreira, C.S.; Jonsson, E.; Näsström, H.; Destouni, G.; Deal, B.; Kalantari, Z. Understanding interactions between urban development policies and GHG emissions: A case study in Stockholm Region. Ambio 2019, 49, 1313–1327. [Google Scholar] [CrossRef] [Green Version]
  44. Köppen, W. Versuch einer Klassifikation der Klimate, vorzugsweise nach ihren Beziehungen zur Pflanzenwelt. Geographische Zeitschrift 1900, 6, 593–611. Available online: https://www.jstor.org/stable/27803924 (accessed on 4 September 2020).
  45. Croatian Bureau of Statistics. Population estimate of Republic of Croatia. 2018. Available online: https://www.dzs.hr/Hrv_Eng/publication/2019/07-01-03_01_2019.htm (accessed on 17 May 2020).
  46. Gotovac, A.S.; Zlatar, J. Urban Processes in Zagreb. Residential and Commercial Developments. Hrvat. Geogr. Glas. Geogr. Bull. 2015, 77, 29–45. [Google Scholar] [CrossRef]
  47. Garcia-Ayllon, S. Urban transformations as indicators of economic change in post-communist Eastern Europe: Territorial diagnosis through five case studies. Habitat Int. 2018, 71, 29–37. [Google Scholar] [CrossRef]
  48. IUSS Working Group WRB. World Reference Base for Soil Resources 2014; International Soil Classification System for Naming Soils and Creating Legends for Soil Maps, Update 2015; World Soil Resources Reports No. 106; FAO: Rome, Italy, 2015; p. 188. [Google Scholar]
  49. Reynolds, W.D.; Elrick, D.E. Ponded Infiltration From a Single Ring: I. Analysis of Steady Flow. Soil Sci. Soc. Am. J. 1990, 54, 1233–1241. [Google Scholar] [CrossRef]
  50. Method of Soil Analysis, Part 2, Chemical and Microbiological Properties; Black, C.A. (Ed.) American Society of Agronomy: Madison, WI, USA, 1965. [Google Scholar]
  51. Diaz-Zorita, M.; Perfect, E.; Grove, J.H. Disruptive methods for assessing soil structure. A review. Soil Tillage Res. 2002, 64, 3–22. [Google Scholar] [CrossRef]
  52. Kemper, W.D.; Rosenau, R.C. Aggregate stability and size distribution. In Methods of Soil Analysis: Part 1 Physical and Mineralogical Methods 5; Gee, G.W., Bauder, J.W., Klute, A., Eds.; American Society of Agronomy: Madison, WI, USA, 1986; pp. 425–442. [Google Scholar]
  53. Matsuda, K.; Ito, S. Adsorption strength of zinc for soil humus. Soil Sci. Plant Nutr. 1970, 16, 1–10. [Google Scholar] [CrossRef]
  54. Jackson, M.L. Soil Chemical Analysis, 2nd ed.; M.L. Jackson: Madison, WI, USA, 1969; p. 895. [Google Scholar]
  55. Hoffmann, U.; Jurasinski, G.; Glatzel, S.; Kuhn, N.J.; Hoffmann, T.O. Assessing the spatial variability of soil organic carbon stocks in an alpine setting (Grindelwald, Swiss Alps). Geoderma 2014, 232, 270–283. [Google Scholar] [CrossRef]
  56. Plotly. Chart Studio. Available online: https://chart-studio.plotly.com/create/ (accessed on 13 April 2020).
  57. Wei, W.; Chen, D.; Wang, L.; Daryanto, S.; Chen, L.; Yu, Y.; Lu, Y.; Sun, G.; Feng, T. Global synthesis of the classifications, distributions, benefits and issues of terracing. Earth-Sci. Rev. 2016, 159, 388–403. [Google Scholar] [CrossRef] [Green Version]
  58. Camera, C.; Djuma, H.; Bruggeman, A.; Zoumides, C.; Eliades, M.; Charalambous, K.; Abate, D.; Faka, M. Quantifying the effectiveness of mountain terraces on soil erosion protection with sediment traps and dry-stone wall laser scans. Catena 2018, 171, 251–264. [Google Scholar] [CrossRef]
  59. Bašić, F.; Kisić, I.; Nestroy, O.; Mesic, M.; Butorac, A. Particle Size Distribution (Texture) of Eroded Soil Material. J. Agron. Crop. Sci. 2002, 188, 311–322. [Google Scholar] [CrossRef]
  60. Bennett, J.M.; Roberton, S.D.; Jensen, T.A.; Antille, D.L.; Hall, J. A comparative study of conventional and controlled traffic in irrigated cotton: I. Heavy machinery impact on the soil resource. Soil Tillage Res. 2017, 168, 143–154. [Google Scholar] [CrossRef]
  61. Bogunović, I.; Bilandžija, D.; Andabaka, Z.; Stupic, D.; Rodrigo-Comino, J.; Cacic, M.; Brezinscak, L.; Maletic, E.; Pereira, P. Soil compaction under different management practices in a Croatian vineyard. Arab. J. Geosci. 2017, 10, 340. [Google Scholar] [CrossRef]
  62. López-Vicente, M.; Álvarez, S. Stability and patterns of topsoil water content in rainfed vineyards, olive groves, and cereal fields under different soil and tillage conditions. Agric. Water Manag. 2018, 201, 167–176. [Google Scholar] [CrossRef]
  63. Shipitalo, M.J.; Protz, R. Comparison of morphology and porosity of a soil under conventional and zero tillage. Can. J. Soil Sci. 1987, 67, 445–456. [Google Scholar] [CrossRef]
  64. Sarker, J.R.; Singh, B.-; Cowie, A.; Fang, Y.; Collins, D.; Badgery, W.; Dalal, R.C. Agricultural management practices impacted carbon and nutrient concentrations in soil aggregates, with minimal influence on aggregate stability and total carbon and nutrient stocks in contrasting soils. Soil Tillage Res. 2018, 178, 209–223. [Google Scholar] [CrossRef]
  65. Anderson, R.; Brye, K.R.; Wood, L.S. Soil Aggregate Stability as Affected by Landuse and Soil Properties in the Lower Mississippi River Valley. Soil Sci. Soc. Am. J. 2019, 83, 1512–1524. [Google Scholar] [CrossRef]
  66. Sithole, N.J.; Magwaza, L.S.; Thibaud, G.R. Long-term impact of no-till conservation agriculture and N-fertilizer on soil aggregate stability, infiltration and distribution of C in different size fractions. Soil Tillage Res. 2019, 190, 147–156. [Google Scholar] [CrossRef]
  67. Liu, Z.; Ma, D.; Hu, W.; Li, X. Land use dependent variation of soil water infiltration characteristics and their scale-specific controls. Soil Tillage Res. 2018, 178, 139–149. [Google Scholar] [CrossRef]
  68. Kay, B. Soil Structure and Organic Carbon: A Review. In Soil Processes and the Carbon Cycle; CRC Press: Boca Raton, FL, USA, 2018; pp. 169–197. [Google Scholar]
  69. Sun, L.; Yang, L.; Chen, L.; Li, S.; Zhao, F.; Sun, S. Tracing the soil water response to autumn rainfall in different land uses at multi-day timescale in a subtropical zone. Catena 2019, 180, 355–364. [Google Scholar] [CrossRef]
  70. Zomer, R.J.; Neufeldt, H.; Xu, J.; Ahrends, A.; Bossio, D.; Trabucco, A.; Van Noordwijk, M.; Wang, M. Global Tree Cover and Biomass Carbon on Agricultural Land: The contribution of agroforestry to global and national carbon budgets. Sci. Rep. 2016, 6, 29987. [Google Scholar] [CrossRef]
  71. Lewis, T.; Verstraten, L.; Hogg, B.; Wehr, B.J.; Swift, S.; Tindale, N.; Menzies, N.W.; Dalal, R.C.; Bryant, P.; Francis, B.; et al. Reforestation of agricultural land in the tropics: The relative contribution of soil, living biomass and debris pools to carbon sequestration. Sci. Total Environ. 2019, 649, 1502–1513. [Google Scholar] [CrossRef] [Green Version]
  72. Crittenden, S.; De Goede, R.G. Integrating soil physical and biological properties in contrasting tillage systems in organic and conventional farming. Eur. J. Soil Biol. 2016, 77, 26–33. [Google Scholar] [CrossRef]
  73. Rosa-Schleich, J.; Loos, J.; Mußhoff, O.; Tscharntke, T. Ecological-economic trade-offs of Diversified Farming Systems—A review. Ecol. Econ. 2019, 160, 251–263. [Google Scholar] [CrossRef]
  74. Sánchez-Navarro, V.; Zornoza, R.; Faz, Á.; Fernandez, J.A. Comparison of soil organic carbon pools, microbial activity and crop yield and quality in two vegetable multiple cropping systems under mediterranean conditions. Sci. Hortic. 2020, 261, 109025. [Google Scholar] [CrossRef]
  75. Yimer, F.; Messing, I.; Ledin, S.; Abdelkadir, A. Effects of different land use types on infiltration capacity in a catchment in the highlands of Ethiopia. Soil Use Manag. 2008, 24, 344–349. [Google Scholar] [CrossRef]
  76. Owuor, S.; Butterbach-Bahl, K.; Guzha, A.; Jacobs, S.; Merbold, L.; Rufino, M.C.; Pelster, D.E.; Diaz-Pines, E.; Breuer, L. Conversion of natural forest results in a significant degradation of soil hydraulic properties in the highlands of Kenya. Soil Tillage Res. 2018, 176, 36–44. [Google Scholar] [CrossRef] [Green Version]
  77. Muñoz-Rojas, M. Soil quality indicators: Critical tools in ecosystem restoration. Curr. Opin. Environ. Sci. Heal. 2018, 5, 47–52. [Google Scholar] [CrossRef]
  78. Scholz, M. Classification methodology for Sustainable Flood Retention Basins. Landsc. Urban Plan. 2007, 81, 246–256. [Google Scholar] [CrossRef]
  79. Schubert, J.E.; Burns, M.J.; Fletcher, T.D.; Sanders, B.F. A framework for the case-specific assessment of Green Infrastructure in mitigating urban flood hazards. Adv. Water Resour. 2017, 108, 55–68. [Google Scholar] [CrossRef]
  80. Endreny, T.; Santagata, R.; Perna, A.; De Stefano, C.; Rallo, R.; Ulgiati, S. Implementing and managing urban forests: A much needed conservation strategy to increase ecosystem services and urban wellbeing. Ecol. Model. 2017, 360, 328–335. [Google Scholar] [CrossRef]
  81. Cooley, C.; Emery, I. Ecosystem Services from Urban Agriculture in the City of the Future. In Sowing Seeds in the City; Springer: Dordrecht, The Netherlands, 2016; pp. 1–22. [Google Scholar]
  82. Gunnell, K.; Mulligan, M.; Francis, R.A.; Hole, D.G. Evaluating natural infrastructure for flood management within the watersheds of selected global cities. Sci. Total Environ. 2019, 670, 411–424. [Google Scholar] [CrossRef]
  83. Antolini, F.; Tate, E.; Dalzell, B.; Young, N.; Johnson, K.; Hawthorne, P.L. Flood Risk Reduction from Agricultural Best Management Practices. JAWRA J. Am. Water Resour. Assoc. 2019, 56, 161–179. [Google Scholar] [CrossRef]
  84. Abdulrazzak, M.; Elfeki, A.; Kamis, A.S.; Kassab, M.; Alamri, N.; Chaabani, A.; Noor, K. Flash flood risk assessment in urban arid environment: Case study of Taibah and Islamic universities’ campuses, Medina, Kingdom of Saudi Arabia. Geomat. Nat. Hazards Risk 2019, 10, 780–796. [Google Scholar] [CrossRef] [Green Version]
  85. Criado, M.; Santos-Francés, F.; Martínez-Graña, A.M.; Sánchez, Y.; Merchán, L. Multitemporal Analysis of Soil Sealing and Land Use Changes Linked to Urban Expansion of Salamanca (Spain) Using Landsat Images and Soil Carbon Management as a Mitigating Tool for Climate Change. Remote Sens. 2020, 12, 1131. [Google Scholar] [CrossRef] [Green Version]
  86. Taft, H.E.; Cross, P.A.; Edwards-Jones, G.; Moorhouse, E.R.; Jones, D.L. Greenhouse gas emissions from intensively managed peat soils in an arable production system. Agric. Ecosyst. Environ. 2017, 237, 162–172. [Google Scholar] [CrossRef] [Green Version]
  87. Garnier, J.; Le Noë, J.; Marescaux, A.; Sanz-Cobena, A.; Lassaletta, L.; Silvestre, M.; Thieu, V.; Billen, G. Long-term changes in greenhouse gas emissions from French agriculture and livestock (1852–2014): From traditional agriculture to conventional intensive systems. Sci. Total Environ. 2019, 660, 1486–1501. [Google Scholar] [CrossRef] [PubMed]
  88. Purwanto, B.H.; Alam, S. Impact of intensive agricultural management on carbon and nitrogen dynamics in the humid tropics. Soil Sci. Plant Nutr. 2019, 66, 50–59. [Google Scholar] [CrossRef]
  89. Omondi, S.O.; Jirström, M.; Oluoch-Kosura, W. The role of urban-based agriculture on food security: Kenyan case studies. Geogr. Res. 2017, 55, 231–241. [Google Scholar] [CrossRef]
  90. Bogunovic, I.; Pereira, P.; Galic, M.; Bilandzija, D.; Kisic, I. Tillage system and farmyard manure impact on soil physical properties, CO2 emissions, and crop yield in an organic farm located in a Mediterranean environment (Croatia). Environ. Earth Sci. 2020, 79, 1–11. [Google Scholar] [CrossRef]
  91. Stubenrauch, J.; Garske, B.; Ekardt, F. Sustainable Land Use, Soil Protection and Phosphorus Management from a Cross-National Perspective. Sustainability 2018, 10, 1988. [Google Scholar] [CrossRef] [Green Version]
  92. Bezbradica, L.; Pantić, M.; Gajić, A. The land use and soil protection: Planning and legal regulations in Serbia. Zemljiste i Biljka 2019, 68, 51–71. [Google Scholar] [CrossRef]
  93. Jenkins, M.; Schaap, B. Forest Ecosystem Services. Background Analytical Study. Global Forest Goals. United Nations Forum on Forests. 2018, p. 41. Available online: https://www.un.org/esa/forests/wp-content/uploads/2018/05/UNFF13_BkgdStudy_ForestsEcoServices.pdf (accessed on 26 March 2020).
  94. SDSN & IEEP. The 2019 Europe Sustainable Development Report; Sustainable Development Solutions Network and Institute for European Environmental Policy: Paris, France; Brussels, Belgium, 2019; Available online: https://ieep.eu/uploads/articles/attachments/3af13d3d-41a6-47d5-8199-405052fd620f/Europe%20Sustainable%20Development%20Report%202019.pdf?v=63741369539 (accessed on 28 March 2020).
  95. Toth, G.L.; Hermann, T.; Da Silva, M.R.; Montanarella, L. Monitoring soil for sustainable development and land degradation neutrality. Environ. Monit. Assess. 2018, 190, 57. [Google Scholar] [CrossRef] [Green Version]
Figure 1. Study location and experimental plot design.
Agronomy 10 01331 g001
Figure 2. Box-plots and the results of Kruskal–Wallis (A) and one-way (B) and (C) ANOVA analysis for the effects of land use on (A) soil clay content, (B) silt content and (C) sand content. Different letters represent a significant difference at p < 0.05. The upper hanging bar represents the high edge; the lower hanging bar is the lower edge. The upper and lower box lines mean the quartile 3 and 1, respectively. Finally, the line inside the box is the median.
Agronomy 10 01331 g002
Figure 3. Box-plots and the results of one-way ANOVA analysis for the effects of land use on (A) soil bulk density, (B) water-holding capacity, and (C) air-filled capacity. Different letters represent a significant difference at p < 0.05. The upper hanging bar represents the high edge; the lower hanging bar is the lower edge. The upper and lower box lines mean the quartile 3 and 1, respectively. Finally, the line inside is the median. Note: Soil water-holding capacity and air-filled porosity Box-Cox transformed (used lambda 0.4).
Agronomy 10 01331 g003
Figure 4. Box-plots and the results of one-way ANOVA analysis for the effects of land use on (A) aggregate stability and (B) infiltration. Different letters represent a significant difference at p < 0.05. The upper hanging bar represents the high edge; the lower hanging bar is the lower edge. The upper and lower box lines mean the quartile 3 and 1, respectively. Finally, the line inside the box is the median. Note: Soil aggregate stability SQRT-transformed.
Agronomy 10 01331 g004
Figure 5. Box-plots and the results of one-way ANOVA analysis for the effects of land use on (A) soil organic matter and (B) soil organic matter stock obtained by one-way ANOVA. Different letters represent a significant difference at p < 0.05. The upper hanging bar represents the high edge; the lower hanging bar is the lower edge. The upper and lower box lines mean the quartile 3 and 1, respectively. Finally, the line inside the box is the median. Note: Soil organic matter Box-Cox transformed (used lambda −0.5).
Agronomy 10 01331 g005
Figure 6. RDA about the relation between Factor 1 and 2. Abbreviations: Water-holding capacity (WHC), Bulk Density (BD), Air-Filled Porosity (AFP), Organic Matter (OM), Soil Organic Carbon Stock (SOCS), Aggregate Stability (AS), Vineyard (VINE), Cropland (CROP), Orchard (ORCH) and Forest (FOR).
Agronomy 10 01331 g006
Table 1. Soil physical, chemical and mechanical properties on upper horizon of studied land uses.
Soil Properties/Land Use
Soil Description
Vineyard
Anthrosols
Orchard
Anthrosols
Forest
Stagnosols
Cropland
Dystric Cambisols
Organic matter (g kg−1)1.341.685.341.17
pH in H20 (w w−1 1:5)6.35.96.35.6
EC (µs cm−1)54403873
P (g kg−1)372917132
K (g kg−1)180150150215
Bulk density (g cm−3)1.401.330.991.41
Clay (g kg−1)23231512095
Silt (g kg−1)420410418338
Sand (g kg−1)348275462567

