Article

Effect of Biostimulants on Apple Quality at Harvest and After Storage

1
Laimburg Research Centre, 39051 Pfatten-Vadena, Italy
2
Department of Agricultural, Food, Animal and Environmental Sciences, University of Udine, 33100 Udine, Italy
3
Faculty of Science and Technology, Free University of Bozen-Bolzano, 39100 Bolzano, Italy
*
Author to whom correspondence should be addressed.
Agronomy 2020, 10(8), 1214; https://doi.org/10.3390/agronomy10081214
Submission received: 10 July 2020 / Revised: 31 July 2020 / Accepted: 7 August 2020 / Published: 18 August 2020

Abstract

:
Nutritional unbalances, such as calcium deficiency at the fruit level, are generally the causative agent of post-harvest disorders in apples. Foliar application of Ca as calcium chloride is the current solution to increase Ca concentration in apples, even though the effectiveness of this approach is often not satisfactory. In this research, we tested the efficacy of a combined application of Ca with selected biostimulants to improve apple quality and to reduce the incidence of storage disorders. The experiment was conducted in two “Jonathan” apple orchards that differed in management systems and characteristics. Tree canopies were sprayed with calcium chloride alone and in combination with a commercial product containing zinc and silicon or a seaweed extract. The seaweed extract increased apple quality by boosting the reddish coloration (+32% of color index) and by enhancing final anthocyanin concentration of fruit skin. Both biostimulants significantly reduced (by 20%) the incidence of the physiological disorder, known as “Jonathan spot”, after 160 days of storage. Increased concentration of nutrients (Ca, Zn, and Mn) in the skin of apples after biostimulant applications, together with changes of the phenolic profile during the storage, are discussed as the possible causes of the reduced fruit susceptibility to post-harvest disorders.

1. Introduction

Fruit quality is defined by a complex set of intrinsic and extrinsic parameters which include skin and pulp color, fruit shape, flavor, texture, aroma, and nutritional value [1]. All these quality factors can be severely jeopardized by physiological disorders which might occur during the storage and can therefore be responsible for considerable economical losses [2]. The main post-harvest disorders for apple fruits (Malus × domestica Borkh.), such as bitter pit, water core, senescence breakdown, Jonathan spot, and blossom-end rot, are generally caused by an unbalance in nutrients concentration in fruit [3,4,5]. In detail, calcium deficiency in fruit has often been associated to post-harvest disorders [6,7]. The insufficient level of calcium in fruits can be the result of a scarce mobilization of this element in the target organs [8,9] and of the antagonistic role played by other nutrients (i.e., potassium and magnesium) on Ca uptake by plants [10,11,12]. Canopy applications of Ca (as calcium chloride or calcium nitrate) is currently the most used technique to enhance Ca concentration in fruits [8,10]. The effectiveness of this technique is often unpredictable, being highly dependent on several interplaying factors, such as the number of treatments, the concentration used, and the environmental conditions at the time of application which can affect Ca penetration in plant tissues and its distribution in the fruit [8,11,12].
The efficacy of Ca applications could be enhanced by a combined use of calcium and biostimulant compounds. Plant biostimulants are a new category of agricultural products that have been recently included in the new EU regulation dealing with fertilizing products. These products should:
“…stimulate plant nutrition processes independently of the product’s nutrient content with the sole aim of improving one or more of the following characteristics of the plant or the plant rhizosphere: (i) nutrient use efficiency, (ii) tolerance to abiotic stress, (iii) quality traits, or (iv) availability of confined nutrients in the soil or rhizosphere”.
[13]
Despite these products already being available on the market, a very limited number of research studies have investigated their efficacy in preventing the occurrence of post-harvest disorders [14]. Soppelsa et al. [15] reported a 50–60% incidence reduction of “Jonathan spot” disorder in apple cv. Jonathan during storage after pre-harvest foliar treatments with a plant biostimulant containing amino acids in combination with zinc and with Siliforce®, a commercial product consisting of orthosilicic acid plus zinc. Zinc is considered to play a key role in the limitation of post-harvest disorders in fruit, being responsible, together with Ca, for the stability of cell walls and the partial inhibition of polyphenol oxidase (PPO), the enzyme mostly involved in all the browning reactions of fruit flesh and skin [16,17]. The high Zn concentration found in the apple fruit skin could be the result of the combined effect of Zn contained in the product formulation and the chelating activity of the amino acids mix included in the formulation. This ion-chelating property of amino acids is known from studies on different plant species [18,19,20]. Seaweed extracts by the other hand are known to reduce cracking in pomegranate and cherry fruits [21,22]. Silicon was found to be effective against cherry cracking for its ability to limit cell wall permeability to water and to confer higher elasticity to fruit tissues [23,24].
Considering the current lack of knowledge regarding the use of plant biostimulants to increase post-harvest quality of apples, our work aimed: (i) to evaluate the effects of calcium chloride applications alone and in combination with a product containing Zn and Si or with a seaweed extract on the yield and fruit quality; (ii) to understand the effect of those treatments on Jonathan spot incidence.

2. Materials and Methods

2.1. Site Description and Experimental Layout

The experiment was conducted in 2014 in two apple orchards (Figure S1) located in the municipality of Ora/Auer (46°22′ N; 11°17’ E; 237 m a.s.l.) in Alto Adige/South Tyrol, Italy. The first orchard (site 1) was located at the Research Centre Laimburg and was characterized by five-year-old “Jonathan” apple trees (Malus × domestica Borkh), grafted on M.9 rootstock, grown at a density of 3333 trees ha−1 (1.0 × 3.0 m) and trained to spindle system. The orchard received standard horticultural cares in accordance with the regulation governing organic production. The second orchard (site 2) was located at a private farm and consisted of 42 year old “Jonathan” apple trees, grafted on seedling rootstock, grown at a density of 455 trees ha−1 (4.0 × 5.5 m), and trained to a palmette-like system. Despite the age, the trees were characterized by a good uniformity as for canopy development and trunk circumference. Site 2 orchard was conducted according to the integrated management system, following the guidelines of the province extension service [25]. Meteorological conditions during the growing season from April to August 2014 are reported in Figure S2.
A completely randomized block design was adopted in both experimental sites with three replicates per treatment and three trees per replicate (nine trees per treatment in total). In each site, uniform apple trees were chosen within each plot after measuring their trunk circumference (at 20 cm from the ground) and by estimating the flowering intensity on a scale from 1 (low intensity) to 5 (high intensity), choosing trees evaluated as 4 to 5. Buffer trees were present between replicates to avoid any contamination among treatments. Foliar applications started in both sites 45 days after full bloom (DAFB) at the end of May and were continued at two-week intervals until August. Calcium chloride (commercial name Alical®) was applied alone and in combination with silicon and zinc (commercial product Siliforce®) or with a commercial seaweed extract (Algavis®). Sprays were performed at dosages indicated in the product labels. Details about the active ingredients, dosages, number of applications, and other characteristics are reported in Table 1. Tree canopy was sprayed until the runoff using a pulled sprayer (total volume of 1500 L ha−1). Sprays were performed under favorable weather forecast (no rainfalls expected in the following 72 h). All chosen products are currently allowed in organic farming.

2.2. Productive and Qualitative Parameters

Apple fruits were harvested at the end of August when they reached a starch–iodine value between 2.2 and 3.0 according to the five-point scale proposed by Laimburg RC (see the methodology in Soppelsa et al. [15]). All fruits from one tree per replicate were collected, counted, and weighed. The productive parameters, such as yield tree−1 and yield ha−1, were then calculated. Mean fruit weight (g) and diameter (mm) were determined on 10 randomly selected fruits per replicate. Using the same 10 apples per replicate, total soluble solids (TSS as °Brix), titratable acidity (TA as g L−1 of malic acid), and flesh firmness (FF as kg cm−2, 1 kg cm−2 corresponding to 9.80 N cm−2) were determined with the automatic measuring device “Pimprenelle” (Satop Giraud Technologie, Cavillon, France). Fruit skin color was determined by measuring the colorimetric coordinates (L*, a*, and b*) with a colorimeter (Minolta, model CR-400, Tokyo, Japan) and the color index (CI) was calculated as follows: (CI = (1000 × a)/(L × b)) with a higher CI value indicating a more intense red color of fruit skin [26].
To monitor the ripening process during post-harvest storage, 30 kg of apples for each of the three replicates (approximately 220 fruits per replicate) were stored in a cold room (2 °C and RH 85–90%) and sampled at 60, 130, and 160 days of storage. Moreover, at the same sampling times, the incidence of the physiological disorder known as “Jonathan spot” was evaluated by counting the number of symptomatic fruits per replicate as described in Soppelsa et al. [15]. “Jonathan spot” symptoms are characterized by irregular small black spots on the skin of fruit (Figure S3).

2.3. Biochemical Analysis of Apple Fruits

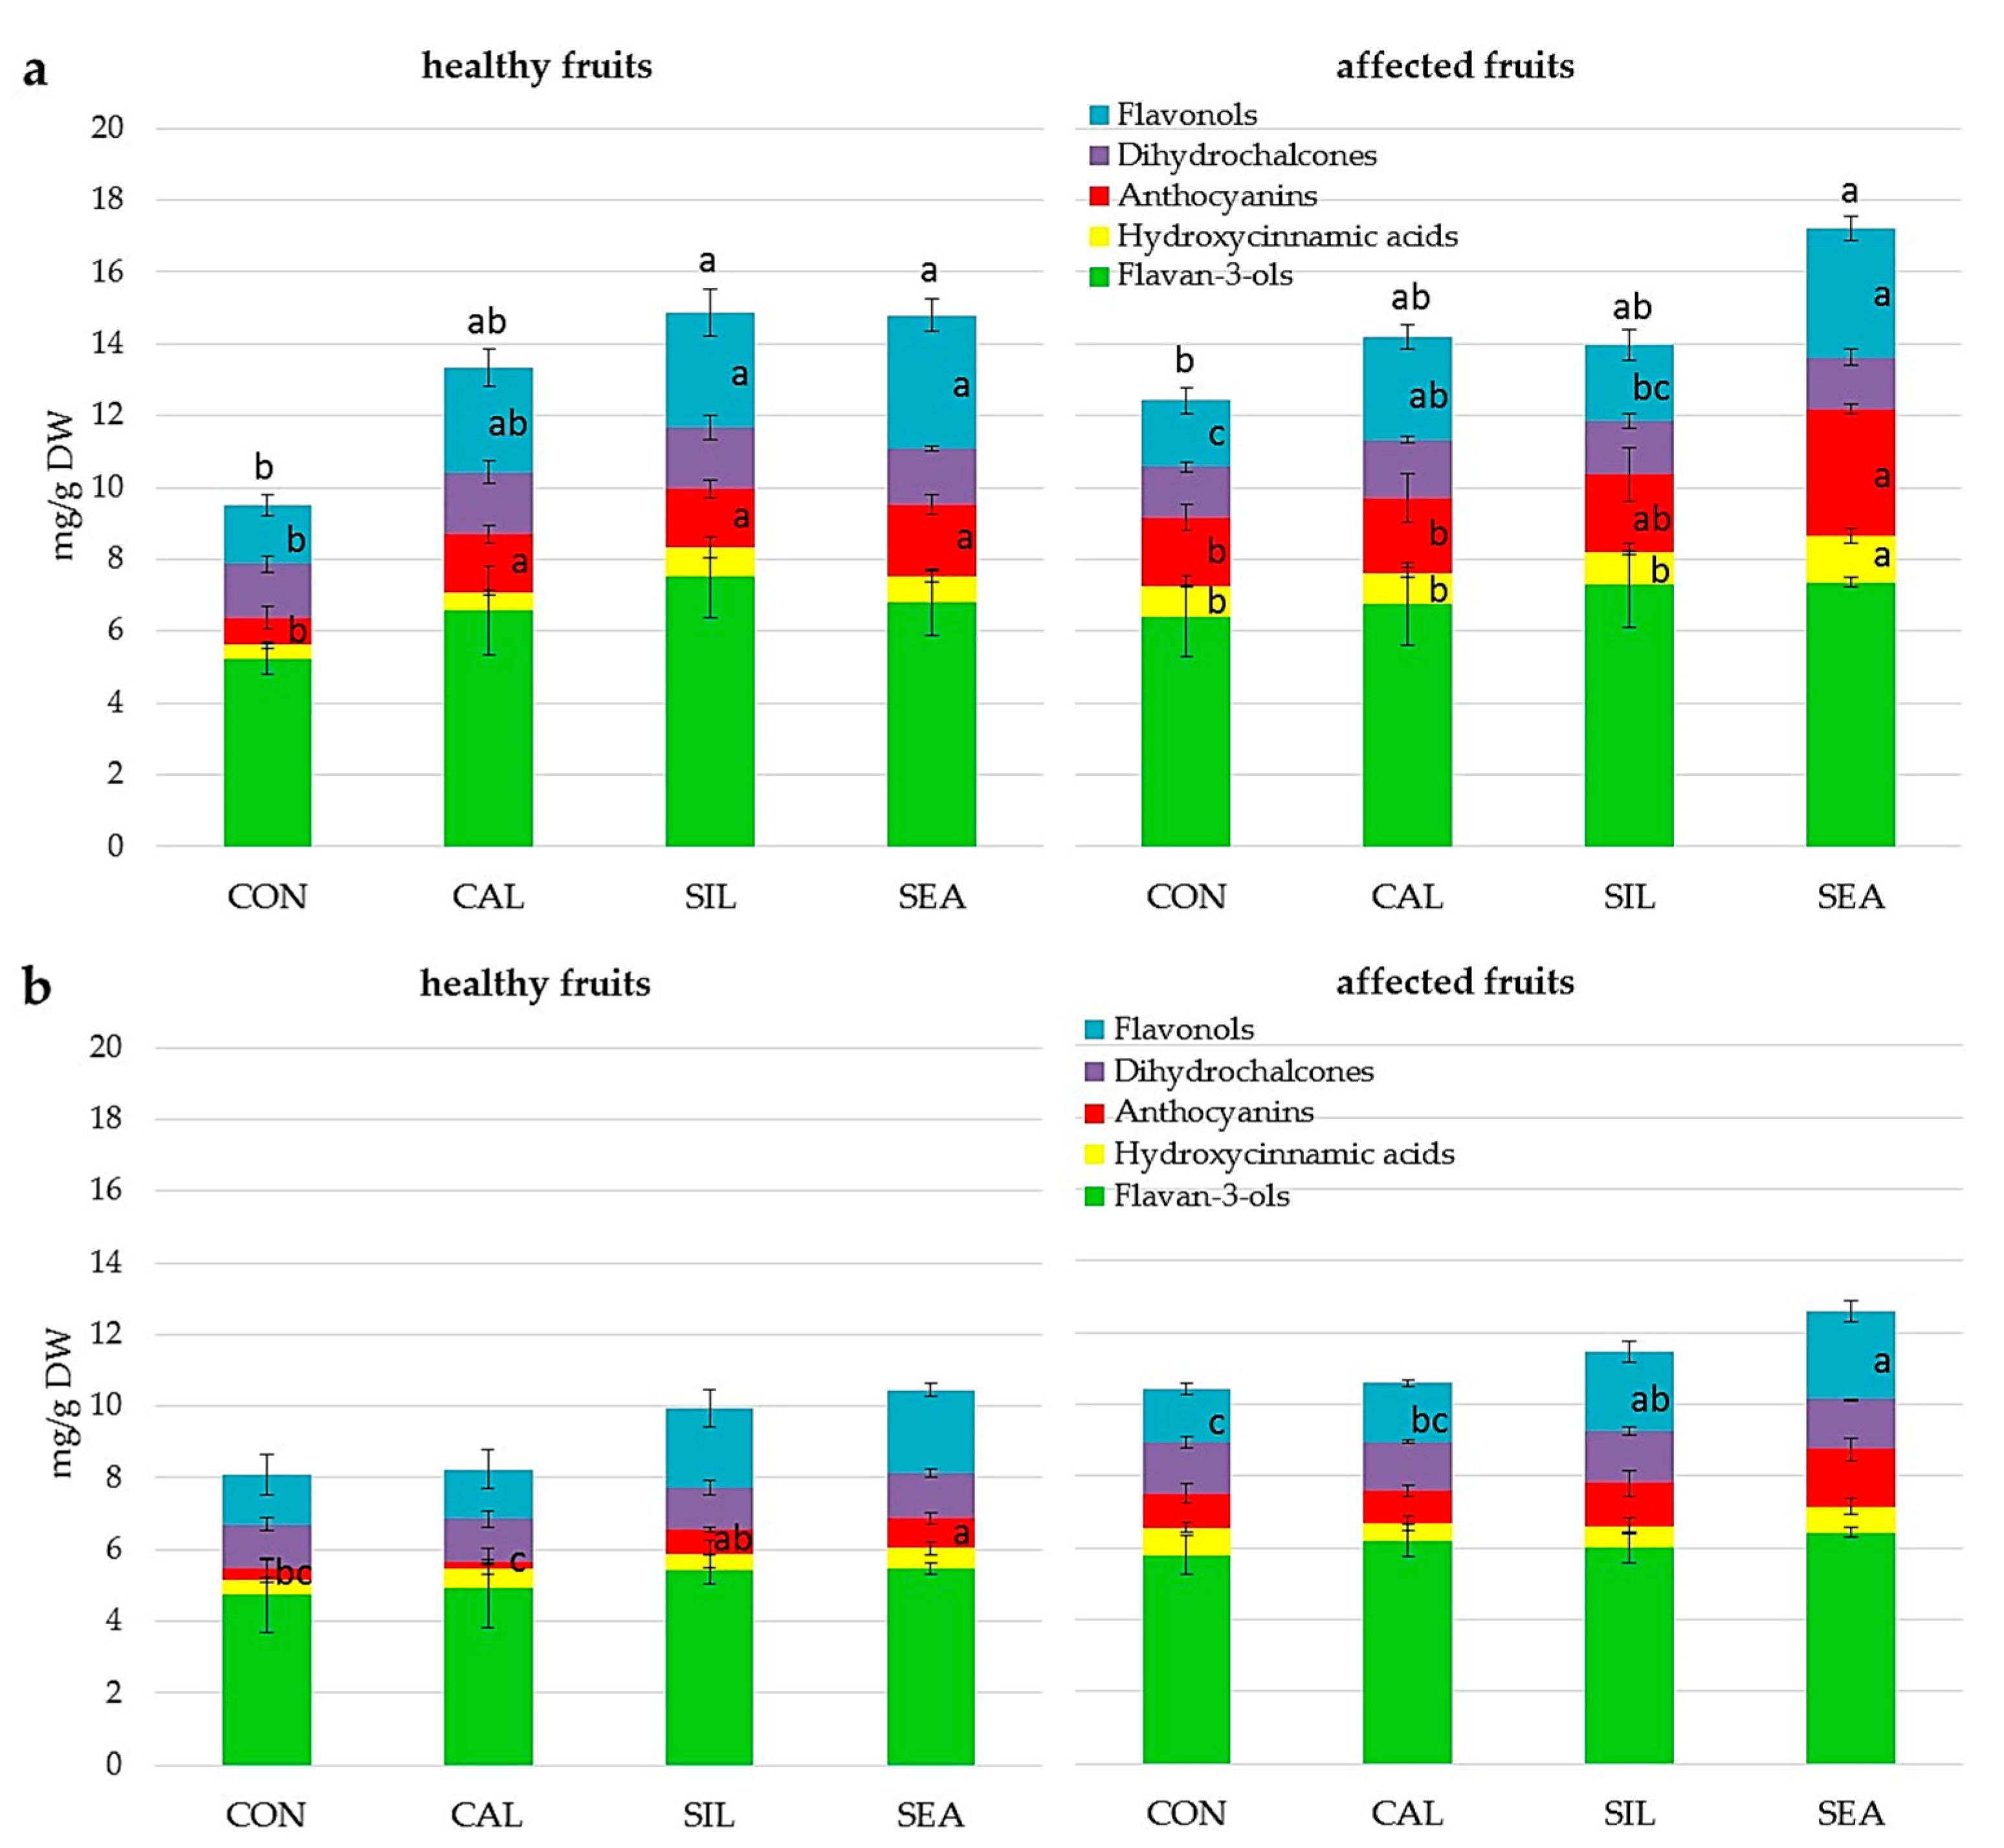
2.3.1. Phenolic Compounds

Five fruits for each of the three replicates (15 per treatment) were randomly sampled at harvest and at the end of storage (160 days after harvest). Four skin strips from each fruit were removed with a peeler and the bulked sample immediately frozen in liquid nitrogen and stored at −80 °C. After freeze-drying, lyophilized samples were milled to a fine powder, extracted with methanol, and analyzed by high-performance liquid chromatography (HPLC) as described by Andreotti et al. [27] and Guerrero-Chavez et al. [28]. In synthesis, the methanolic extracts were analyzed with a Breeze 2 HPLC System (Waters Corporation, Milford, MA, USA) coupled with a photodiode array detector (PDAD), pumps and autosampler to separate and quantify apple phenolic compounds. Compounds separation was achieved with a reverse-phase Supelcosil® LC-18 HPLC column (15 cm long, 4 mm internal diameter and octadecyl silane particles of 5 μm diameter). The mobile phase was 0.01 M phosphoric acid (solvent A) and 100% methanol HPLC grade (solvent B) with the following gradient: 0 min 0% B; 0–40 min 50% B; 40–45 min 100% B followed by an equilibrium time of 15 min. The injection volume was 10 μL and the flow rate was 1 mL min−1. Standards, such as catechin, chlorogenic acid, cyanidin-3-O-glucoside, phloridzin, and quercetin-3-galactoside, were purchased from Sigma–Aldrich (St Louis, MO, USA) for qualitative and quantitative determinations of flavan-3-ols, hydroxycinnamic acids, anthocyanins, dihydrochalcones, and flavonols class of compounds.

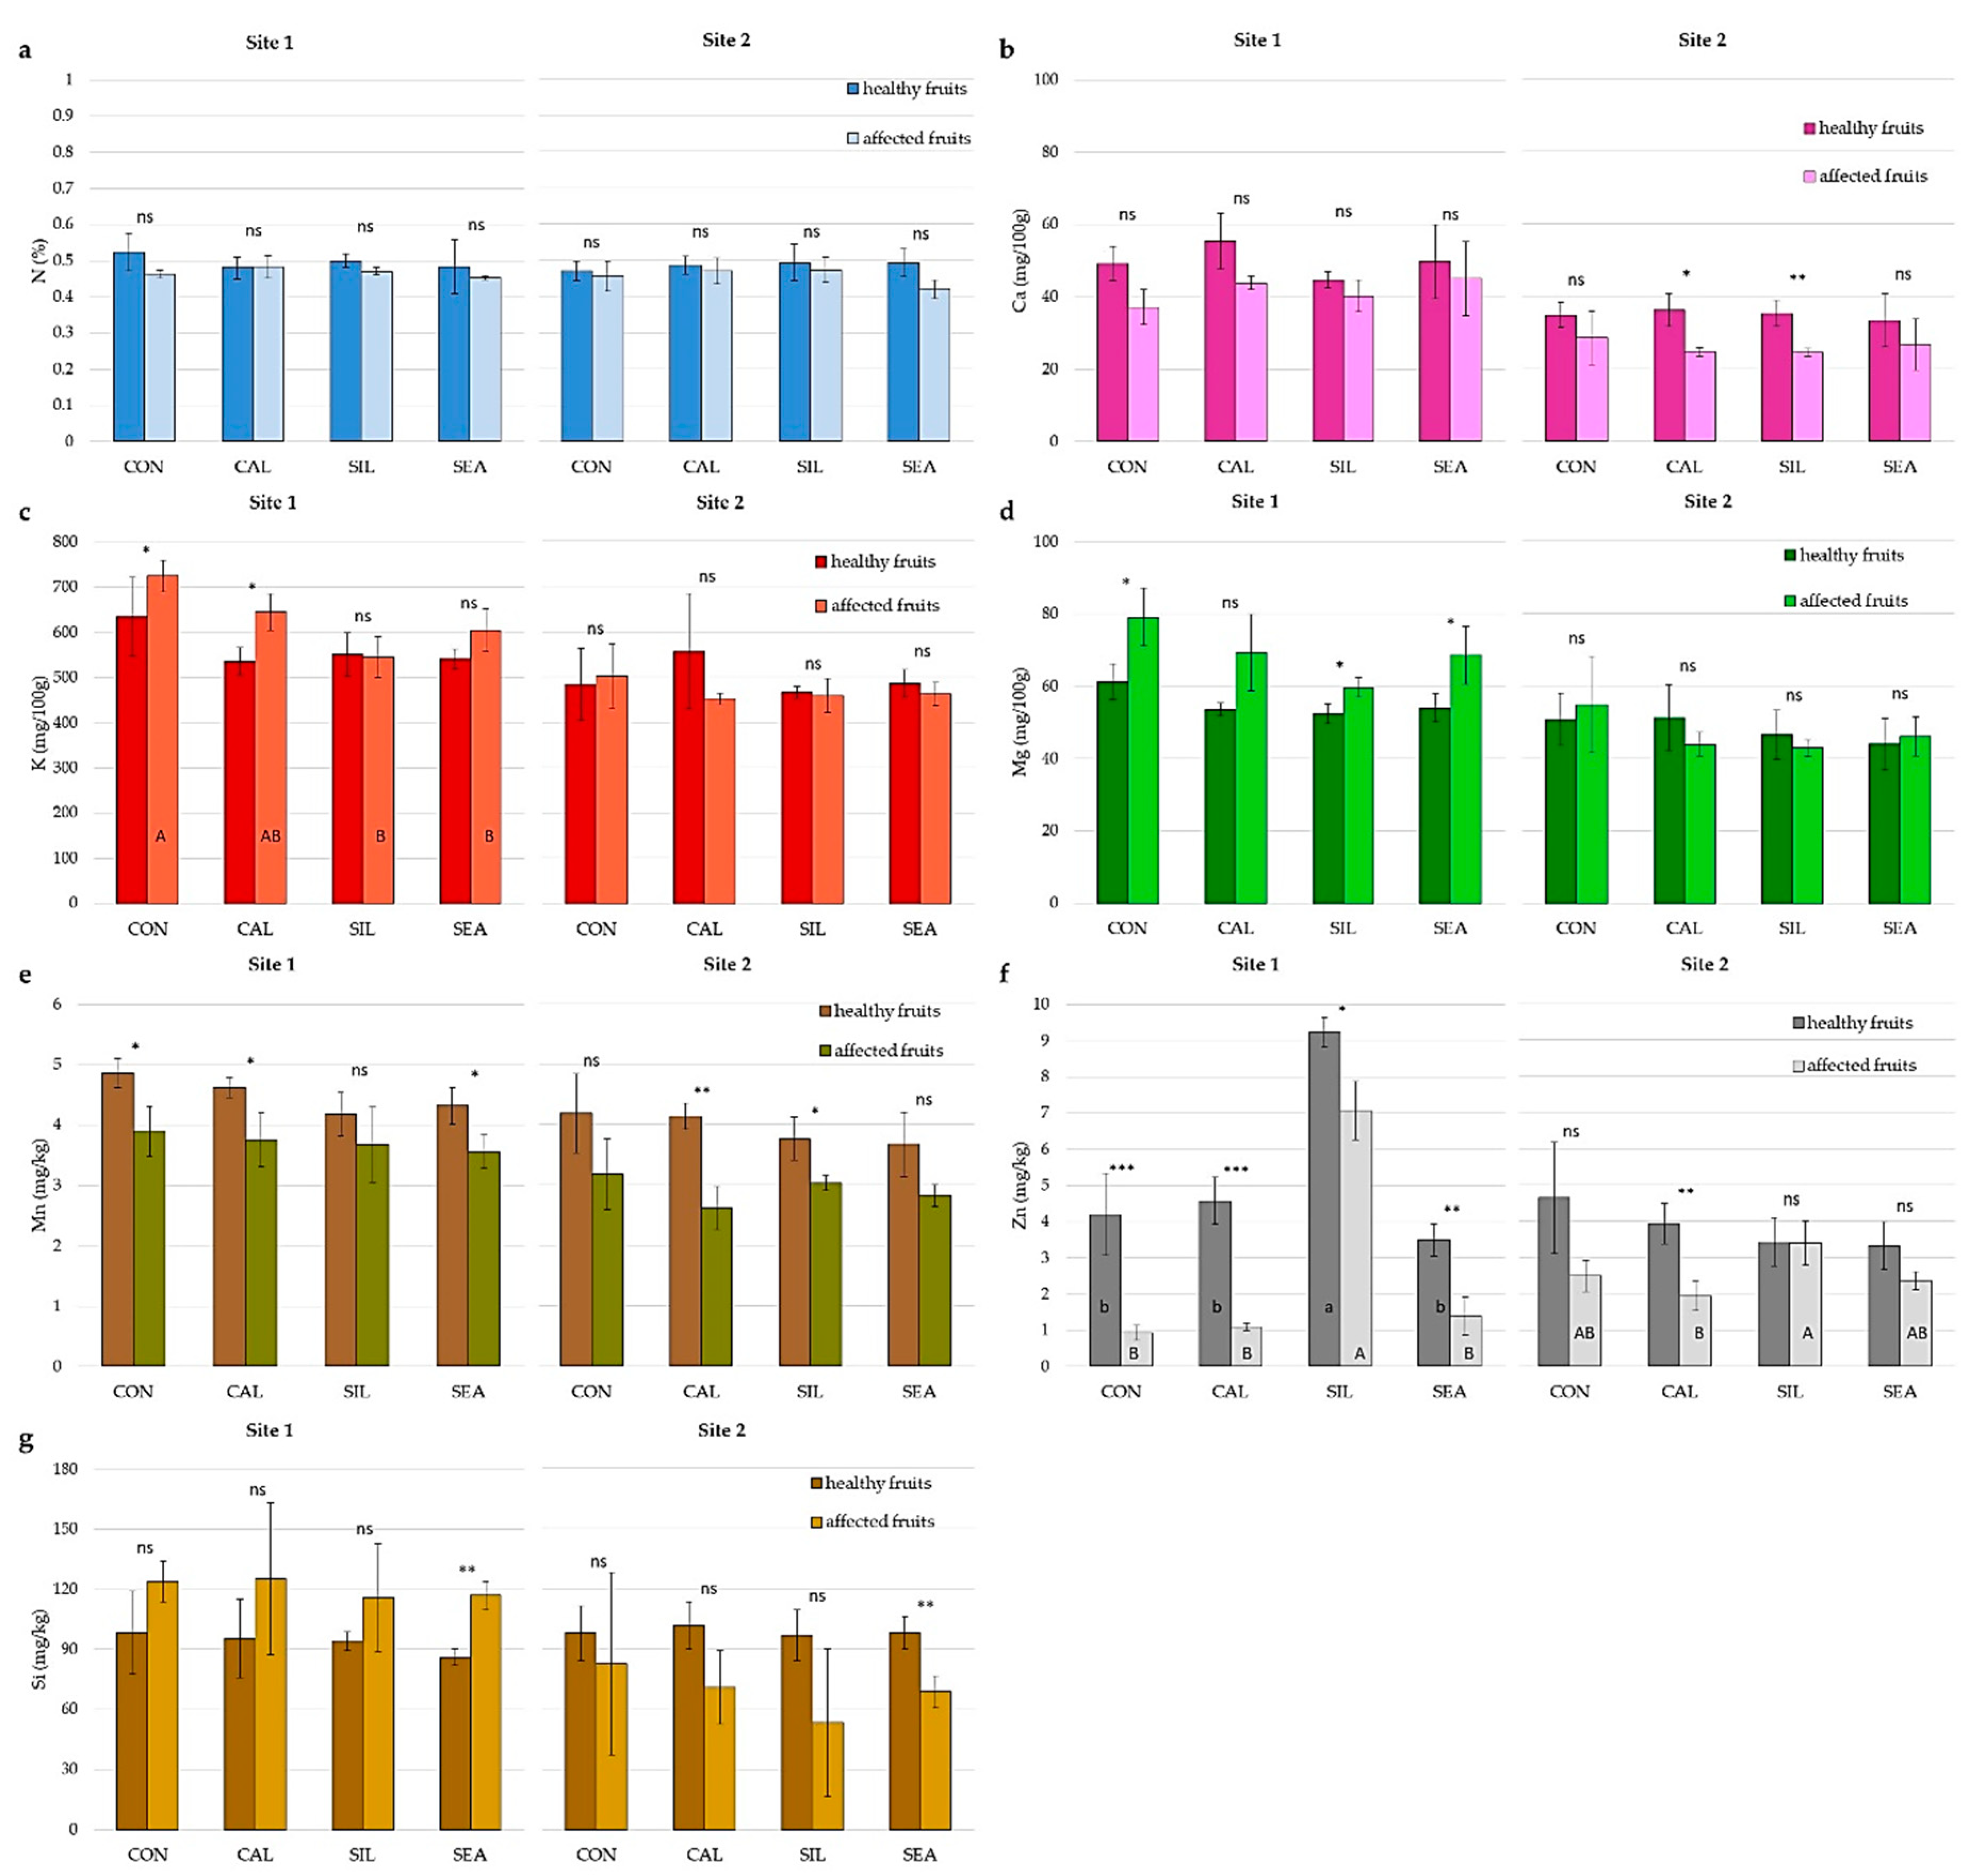
2.3.2. Mineral Element Content

Following the same sampling procedure described for phenolic compounds analysis, lyophilized fruit skin samples were ground and homogenized for the analysis of mineral elements. Nitrogen content was determined with an elementary analyzer method according Dumas DIN EN ISO_16634_1:2009; LECO Mod. Truspec [29]) and the other macro (P, K, Ca, Mg) and microelements (S, Fe, Cu, B, Zn, Mn, Na, Si) were analyzed with microwave-assisted acid digestion (EPA 3052 1996; Milestone Mod. UltraWave [30]) using the inductively coupled plasma optical emission spectrometry (ICP-OES; EPA 6010D 2014; Agilent Model 720 [31]).

2.4. Statistical Analysis

Data normality and equality of error variances were evaluated with the Shapiro–Wilk and the Levene tests, respectively. A two-way ANOVA was performed on data collected at harvest from both sites and mean separation of the dependent variables obtained with the Tukey HSD test (p < 0.05). In case of significant interaction between “treatments” and “sites”, results were presented separately for the 2 sites in dedicated figures as vertical grouped bars with standard deviation per treatment combination. A one-way ANOVA was performed on data collected on healthy and affected fruits after storage, keeping separated samples from the site 1 and site 2. Data are expressed in percentage were arcsine-transformed prior to the application of the ANOVA. For non-normal data, Kruskal–Wallis test was applied. All analyses were carried out with IBM SPSS version 25.

3. Results

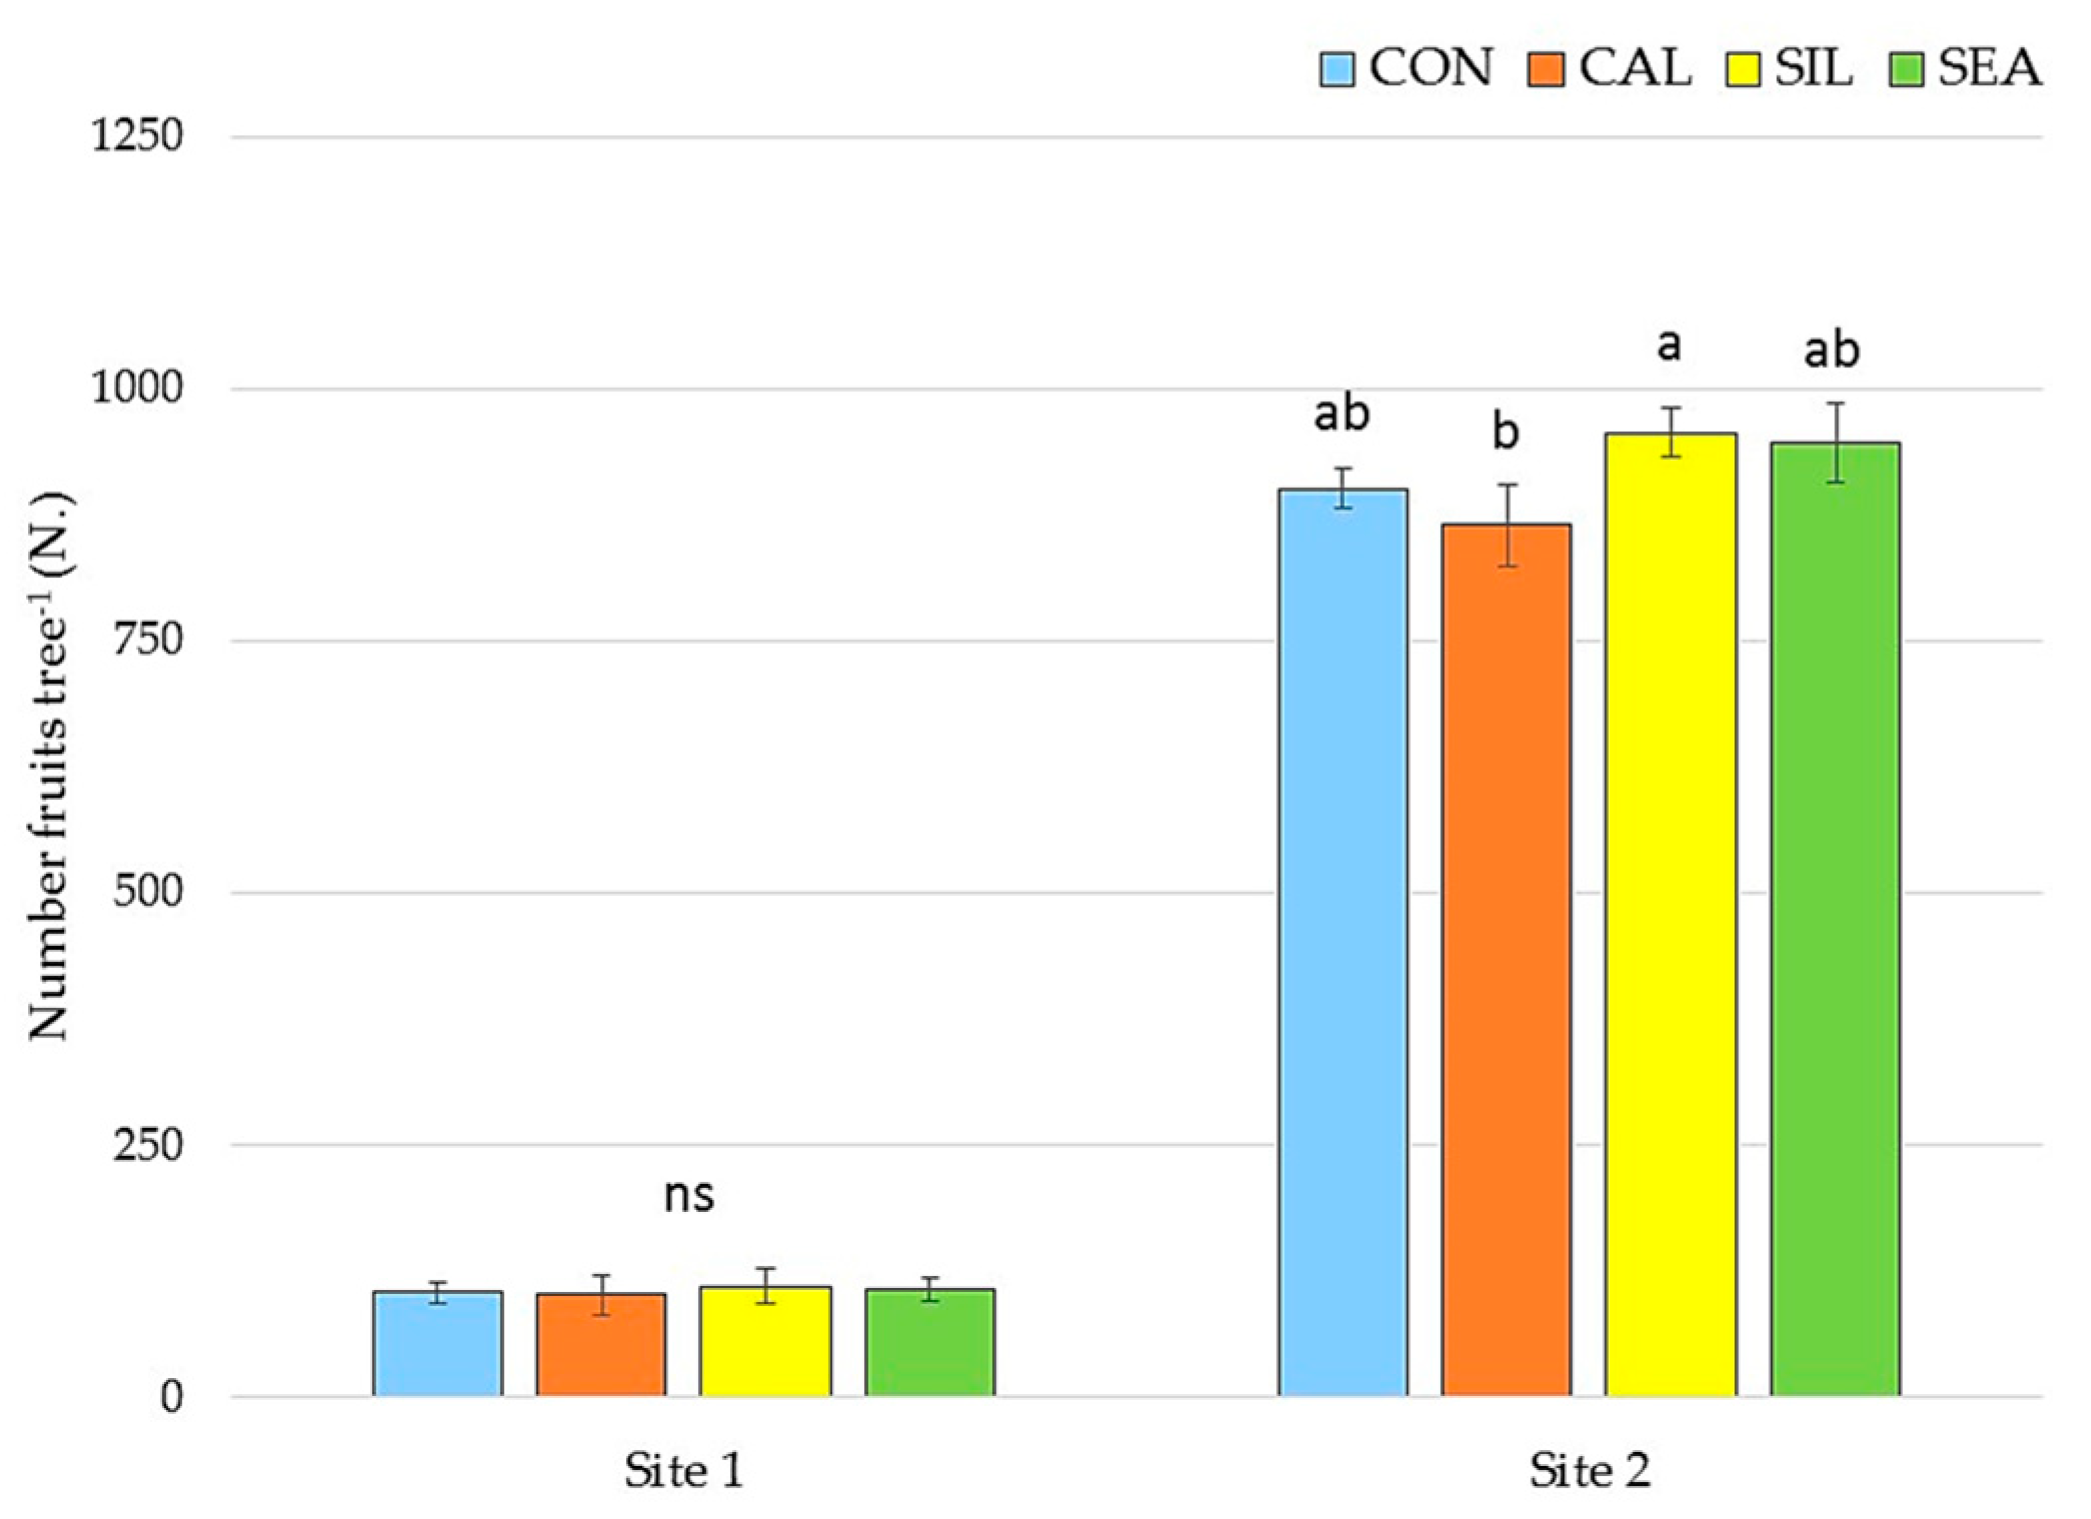
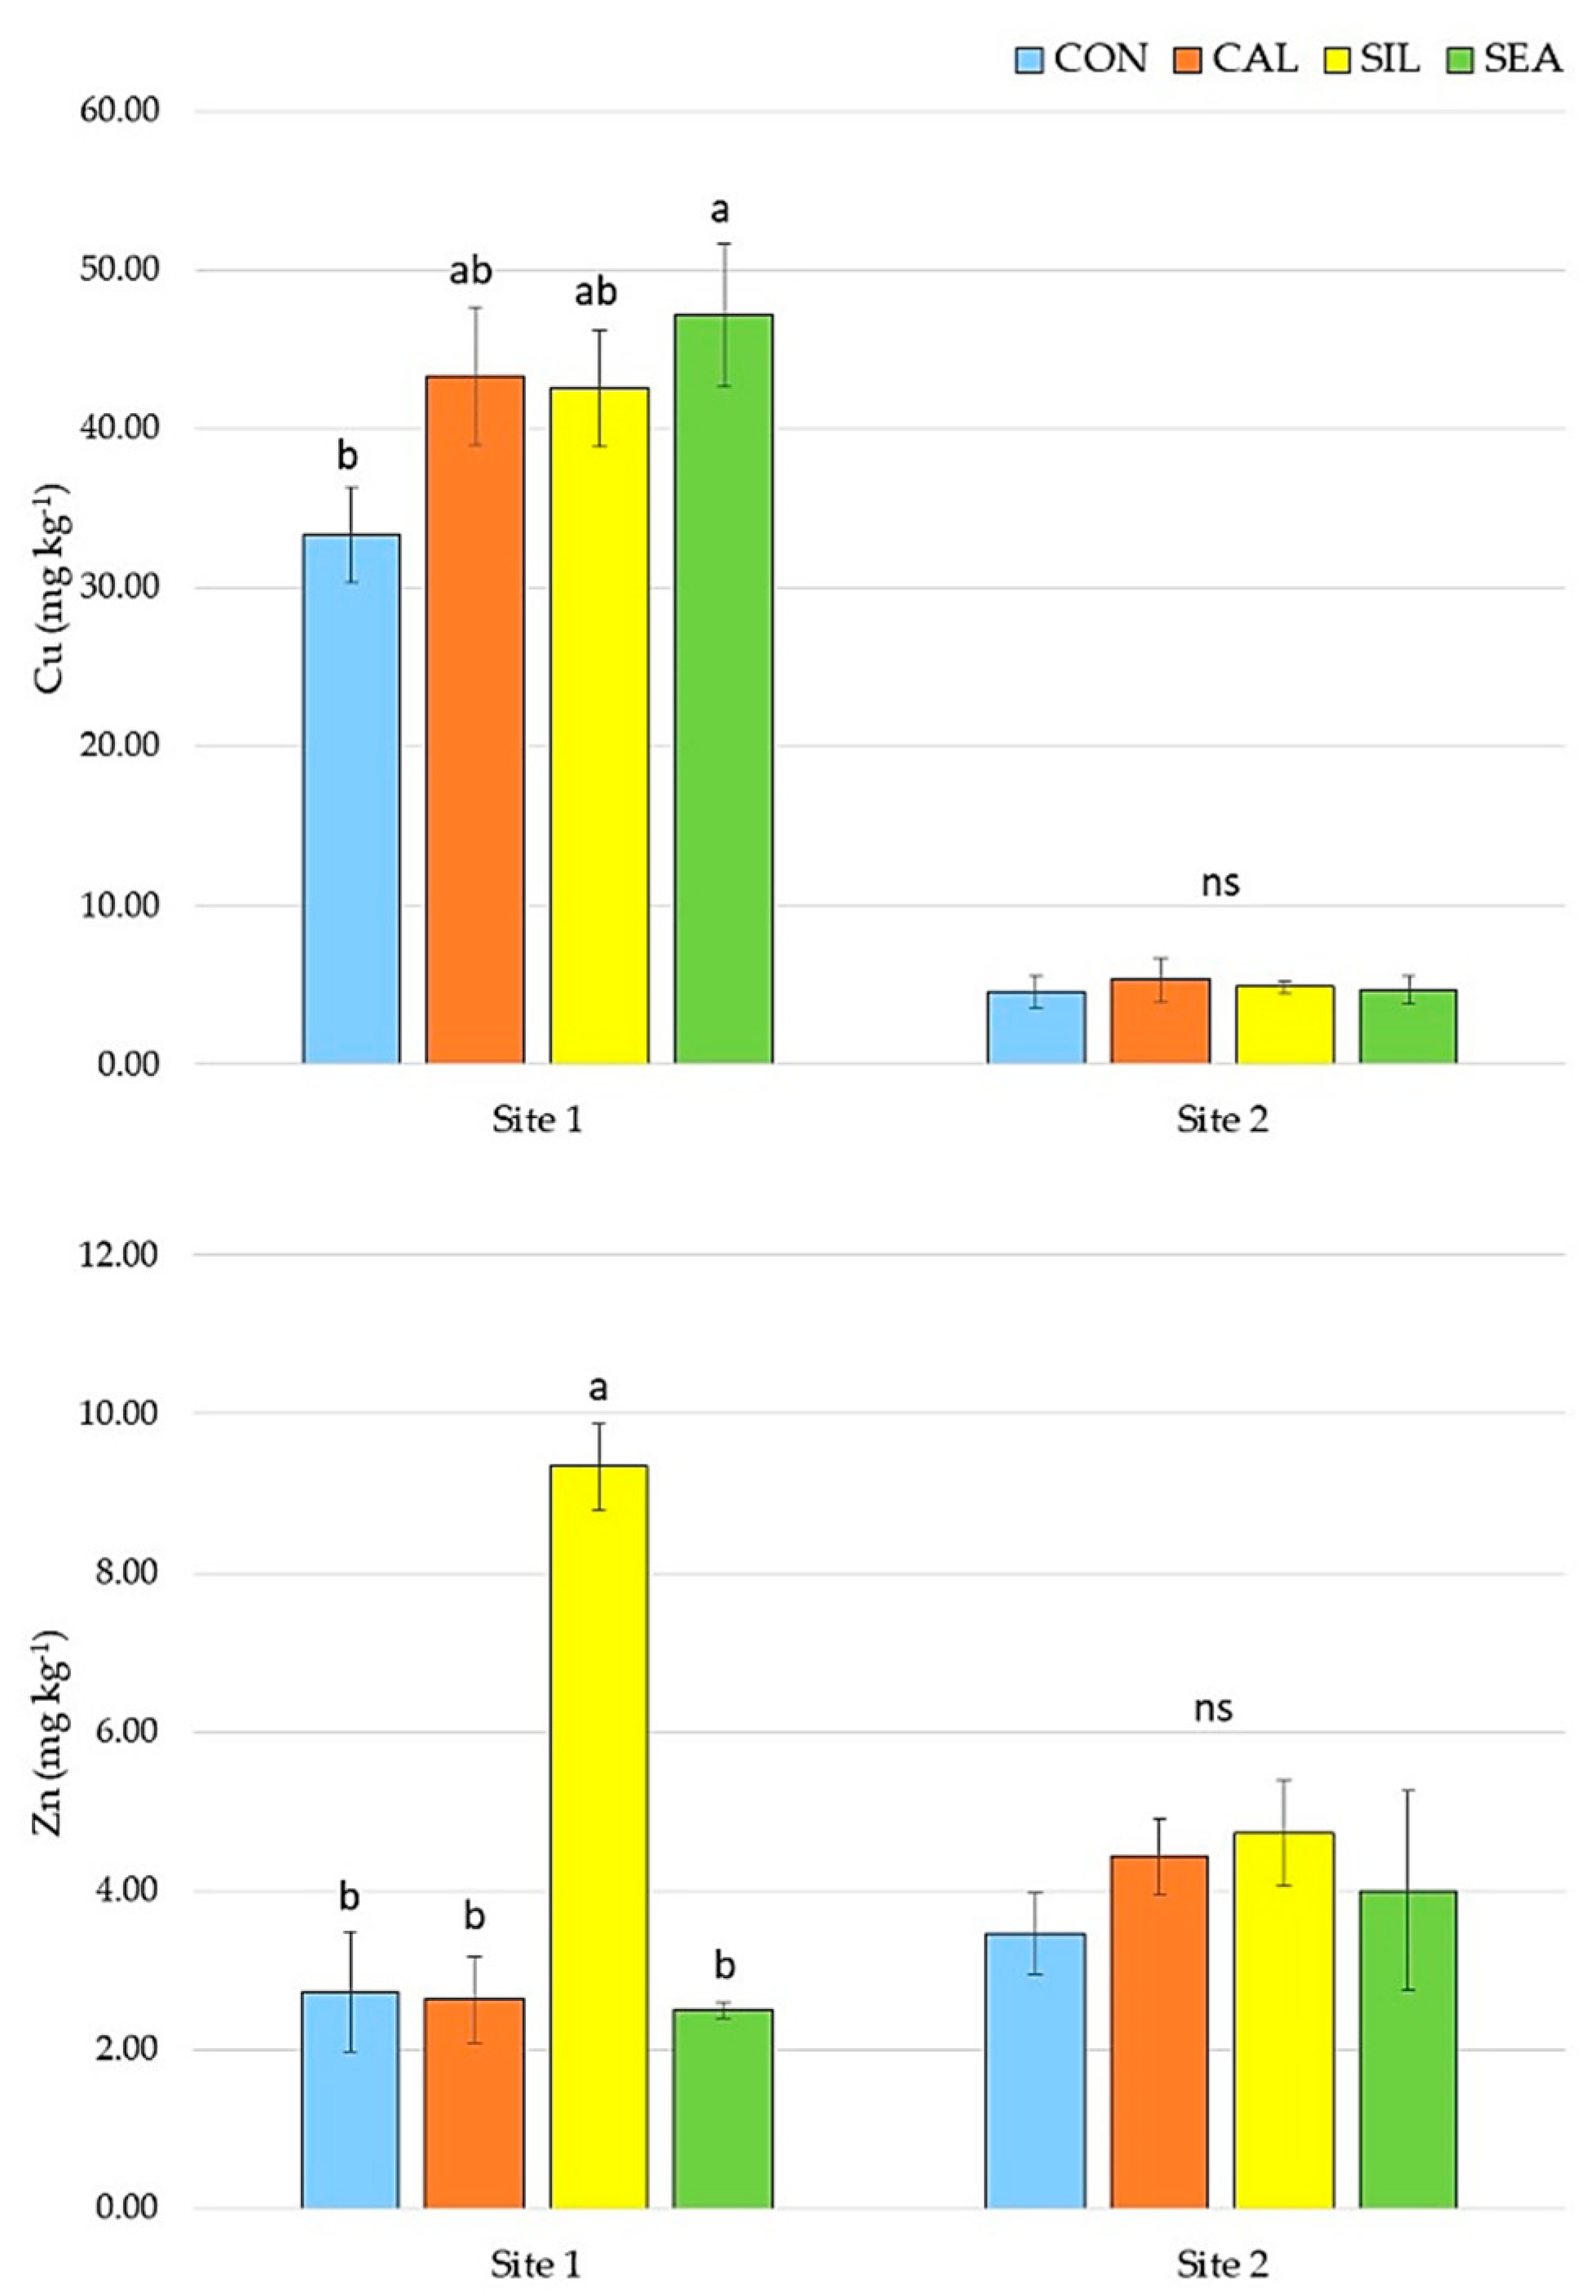
3.1. Yield and Quality Components at Harvest

The markedly different orchards of the two experimental sites caused large and significant differences in their yield components at harvest (Table 2). Site 2, characterized by lower planting density and very large trees, presented a significantly higher yield per hectare as compared with site 1 (55 and 42 tons ha−1, respectively) and an average yield per tree that was roughly 10 times the one of site 1 (120 kg tree−1 and 13 kg tree−1, respectively). Trees in site 2 orchard had a significantly higher number of fruits per tree (approximately 900) as compared to site 1 trees (around 100 fruits tree−1). As a consequences of the lower crop load per tree, apples harvested in site 1 orchard were significantly heavier (+6%) and larger (+6%) as compared to fruits collected in site 2 orchard.
The applications of CAL, SIL, and SEA did not affect the yield parameters as compared to control (Table 2). Yield performances of CAL-treated trees were significantly lower compared to SIL-treated trees (−8%). Differences in the number of fruits per tree were significant in site 2 only, where CAL-treated trees showed a significant lower number of fruits as compared to trees treated with SIL (Figure 1).
Quality indices of apples at harvest were mainly affected by the cultivation site, whereas treatments had a minor influence (Table 3). Apples from site 2 orchard were slightly more mature, showing higher average Brix value and lower total acidity as compared to fruit collected in site 1. Moreover, apples harvested in site 1 were more colored than fruits from site 2 (+32% of color index). No difference was detected in flesh firmness of fruits harvested in the two orchards. Treatment applications did not change final fruit quality as for firmness, soluble solids content, and acidity (Table 3). Seaweed applications increased significantly (by 20%) the fruit color index, independent from the orchard of origin of the apples (Figure S4).
Apples collected in site 1 orchard were generally characterized by higher phenolic concentrations in skin tissue at the harvest stage (Table 4). In detail, the concentration of several phenolic classes (flavan-3-ols, hydroxycinnamic acids, anthocyanins, dihydrochalcones) were higher in site 1 fruits compared to fruits from site 2. The concentration difference was not significant for the flavonols (quercetin derivatives) class of compounds only. The applications of calcium, alone or in combination with Siliforce®, did not affect the phenolic concentration when compared with the control (Table 4). Differently, the seaweed plus calcium applications resulted in significantly higher anthocyanin accumulation in the apple skin (around 4 mg g−1 DW) as compared to the control samples (2 mg g−1 DW).
Macronutrients accumulation in fruit skin was generally higher in site 1 compared to site 2 (Table 5), the only exception being P that showed an 8% lower accumulation. Applications of seaweed extracts (in combination with calcium) significantly enhanced the final Ca accumulation (61.8 and 46 mg 100 g−1 DW in SEA and CON fruits, respectively) and reduced K concentration (by 15%). Fruits from site 1 were also significantly higher in manganese and selenium concentration, whereas they were lower in boron (Table 6). For Cu and Zn concentrations, there was a significant effect of the interaction between treatment and site, treatment effect was therefore evaluated at the level of the single site only (Figure 2). In site 1, SEA-treated apples resulted in significantly higher Cu concentration as compared to control, whereas Zn accumulation was significantly higher SIL-treated fruits. No significant differences were calculated for both nutrients in apples collected in site 2 orchard.

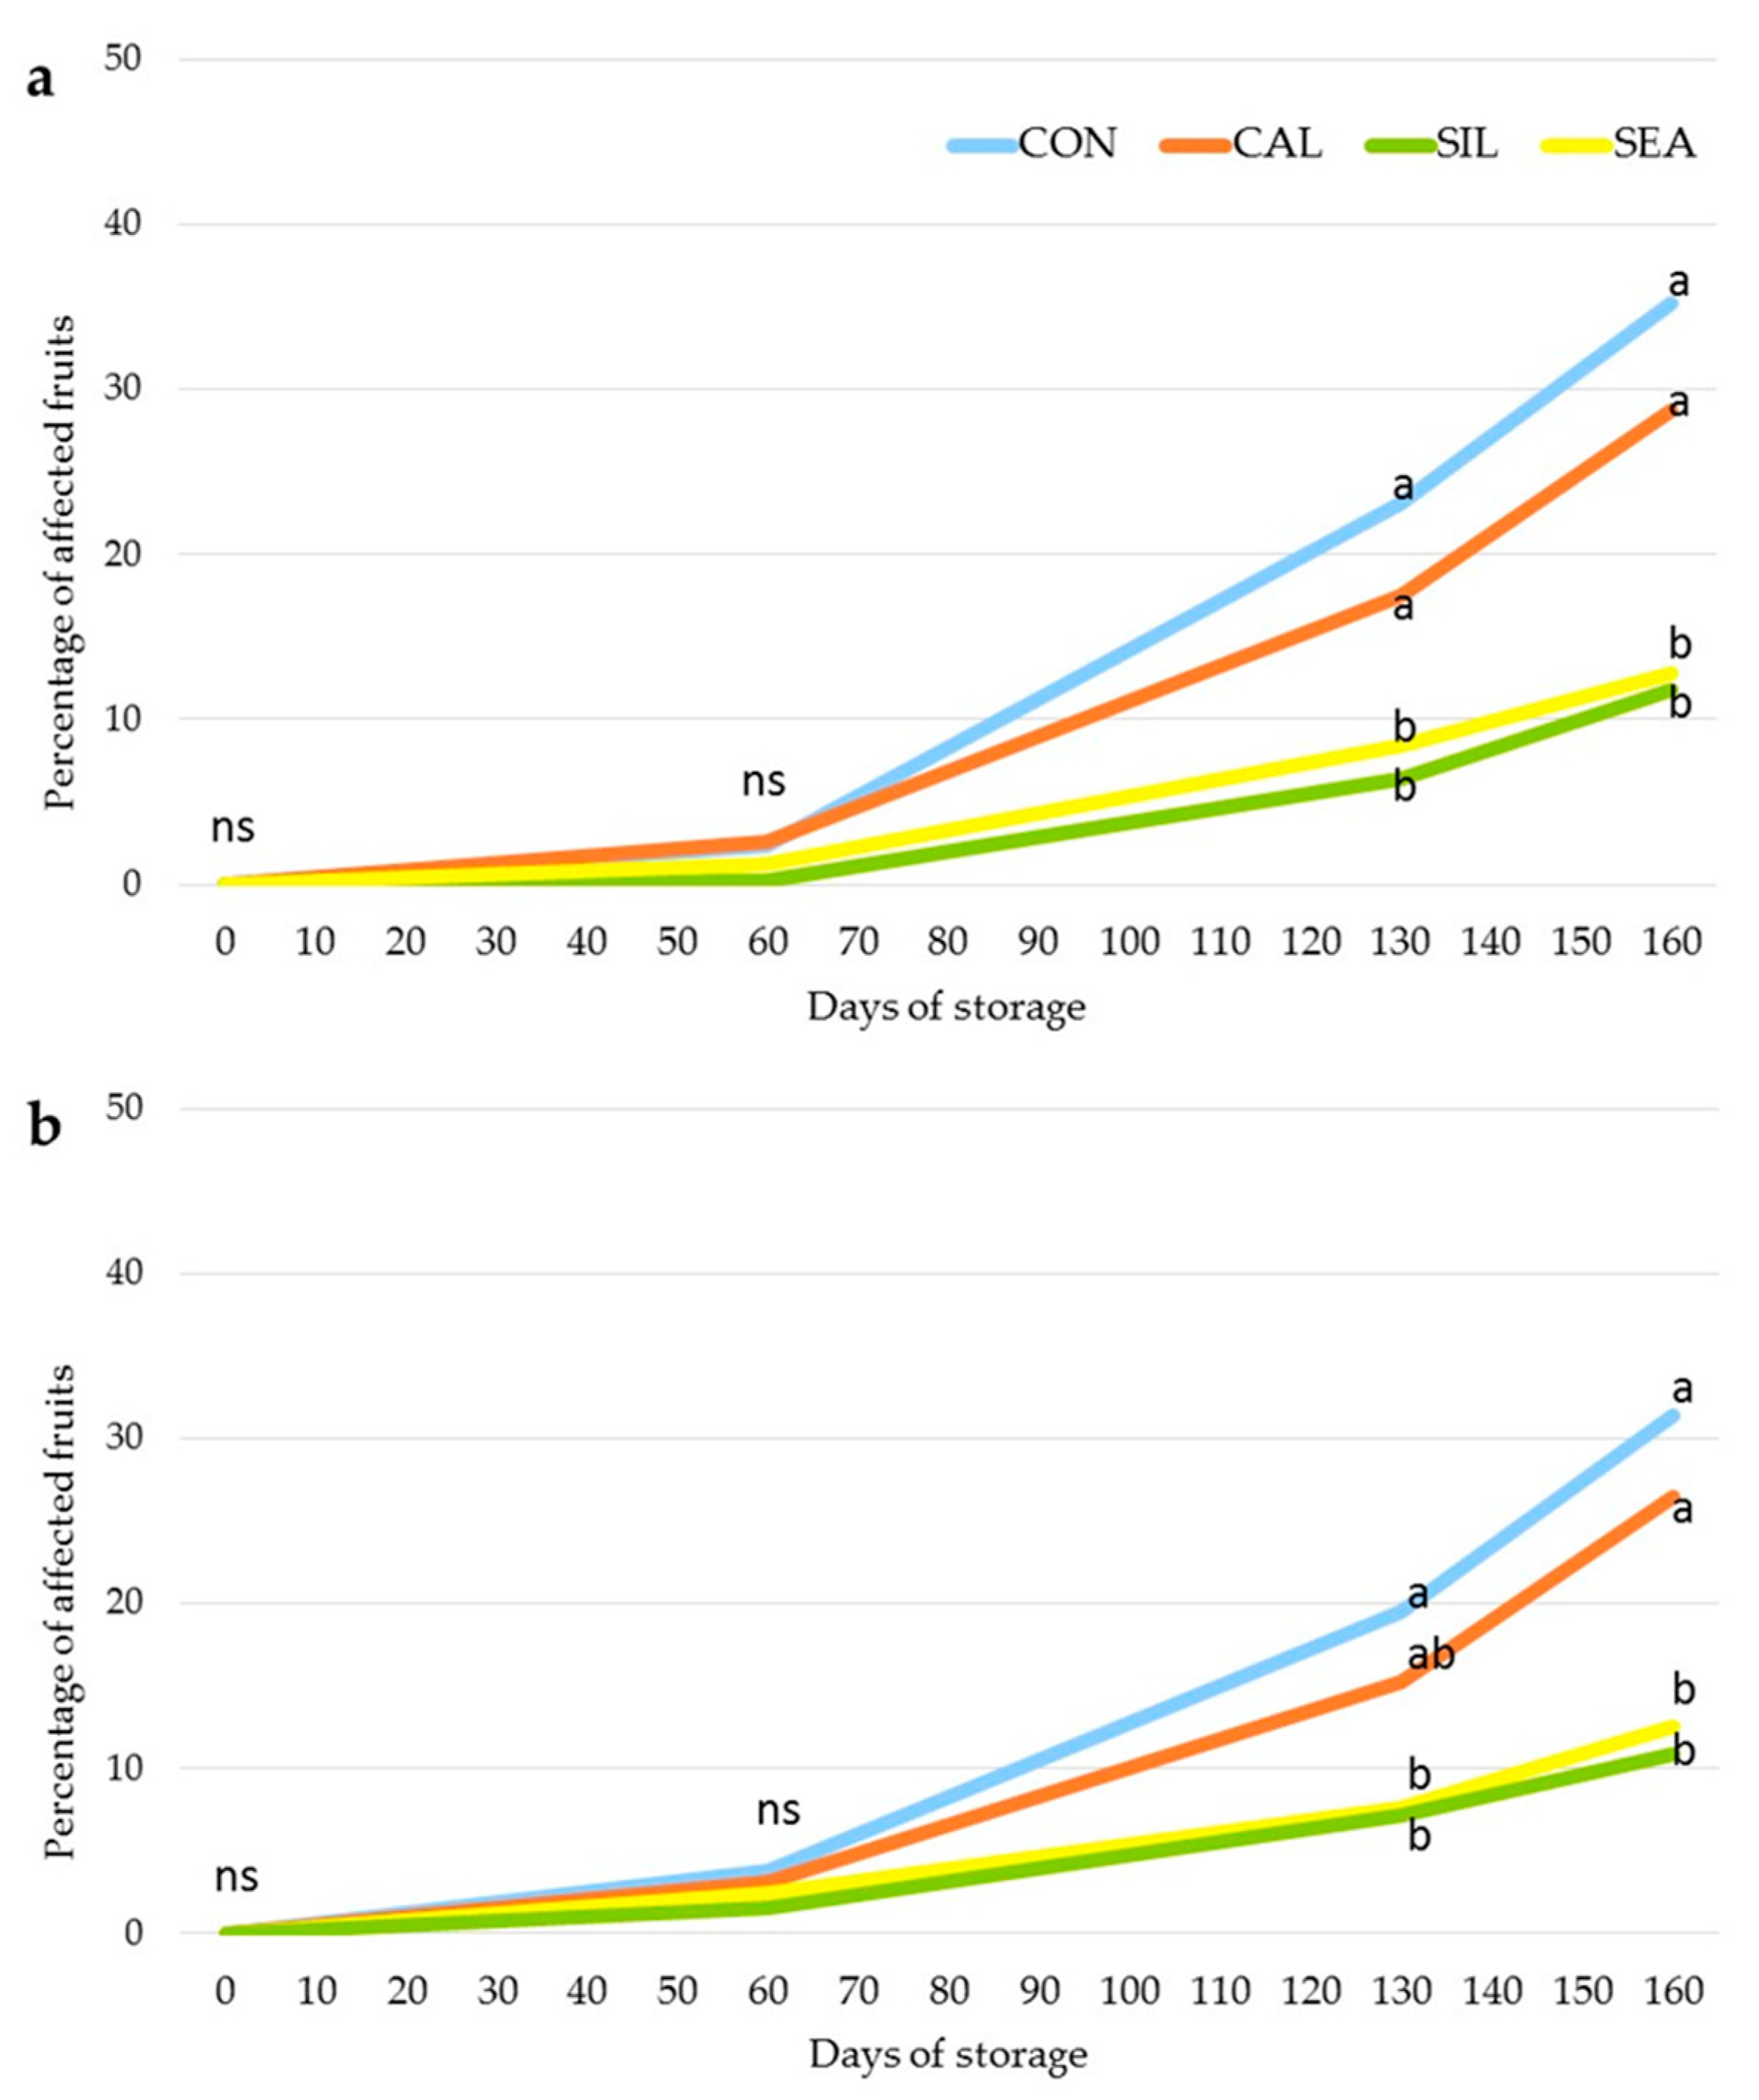
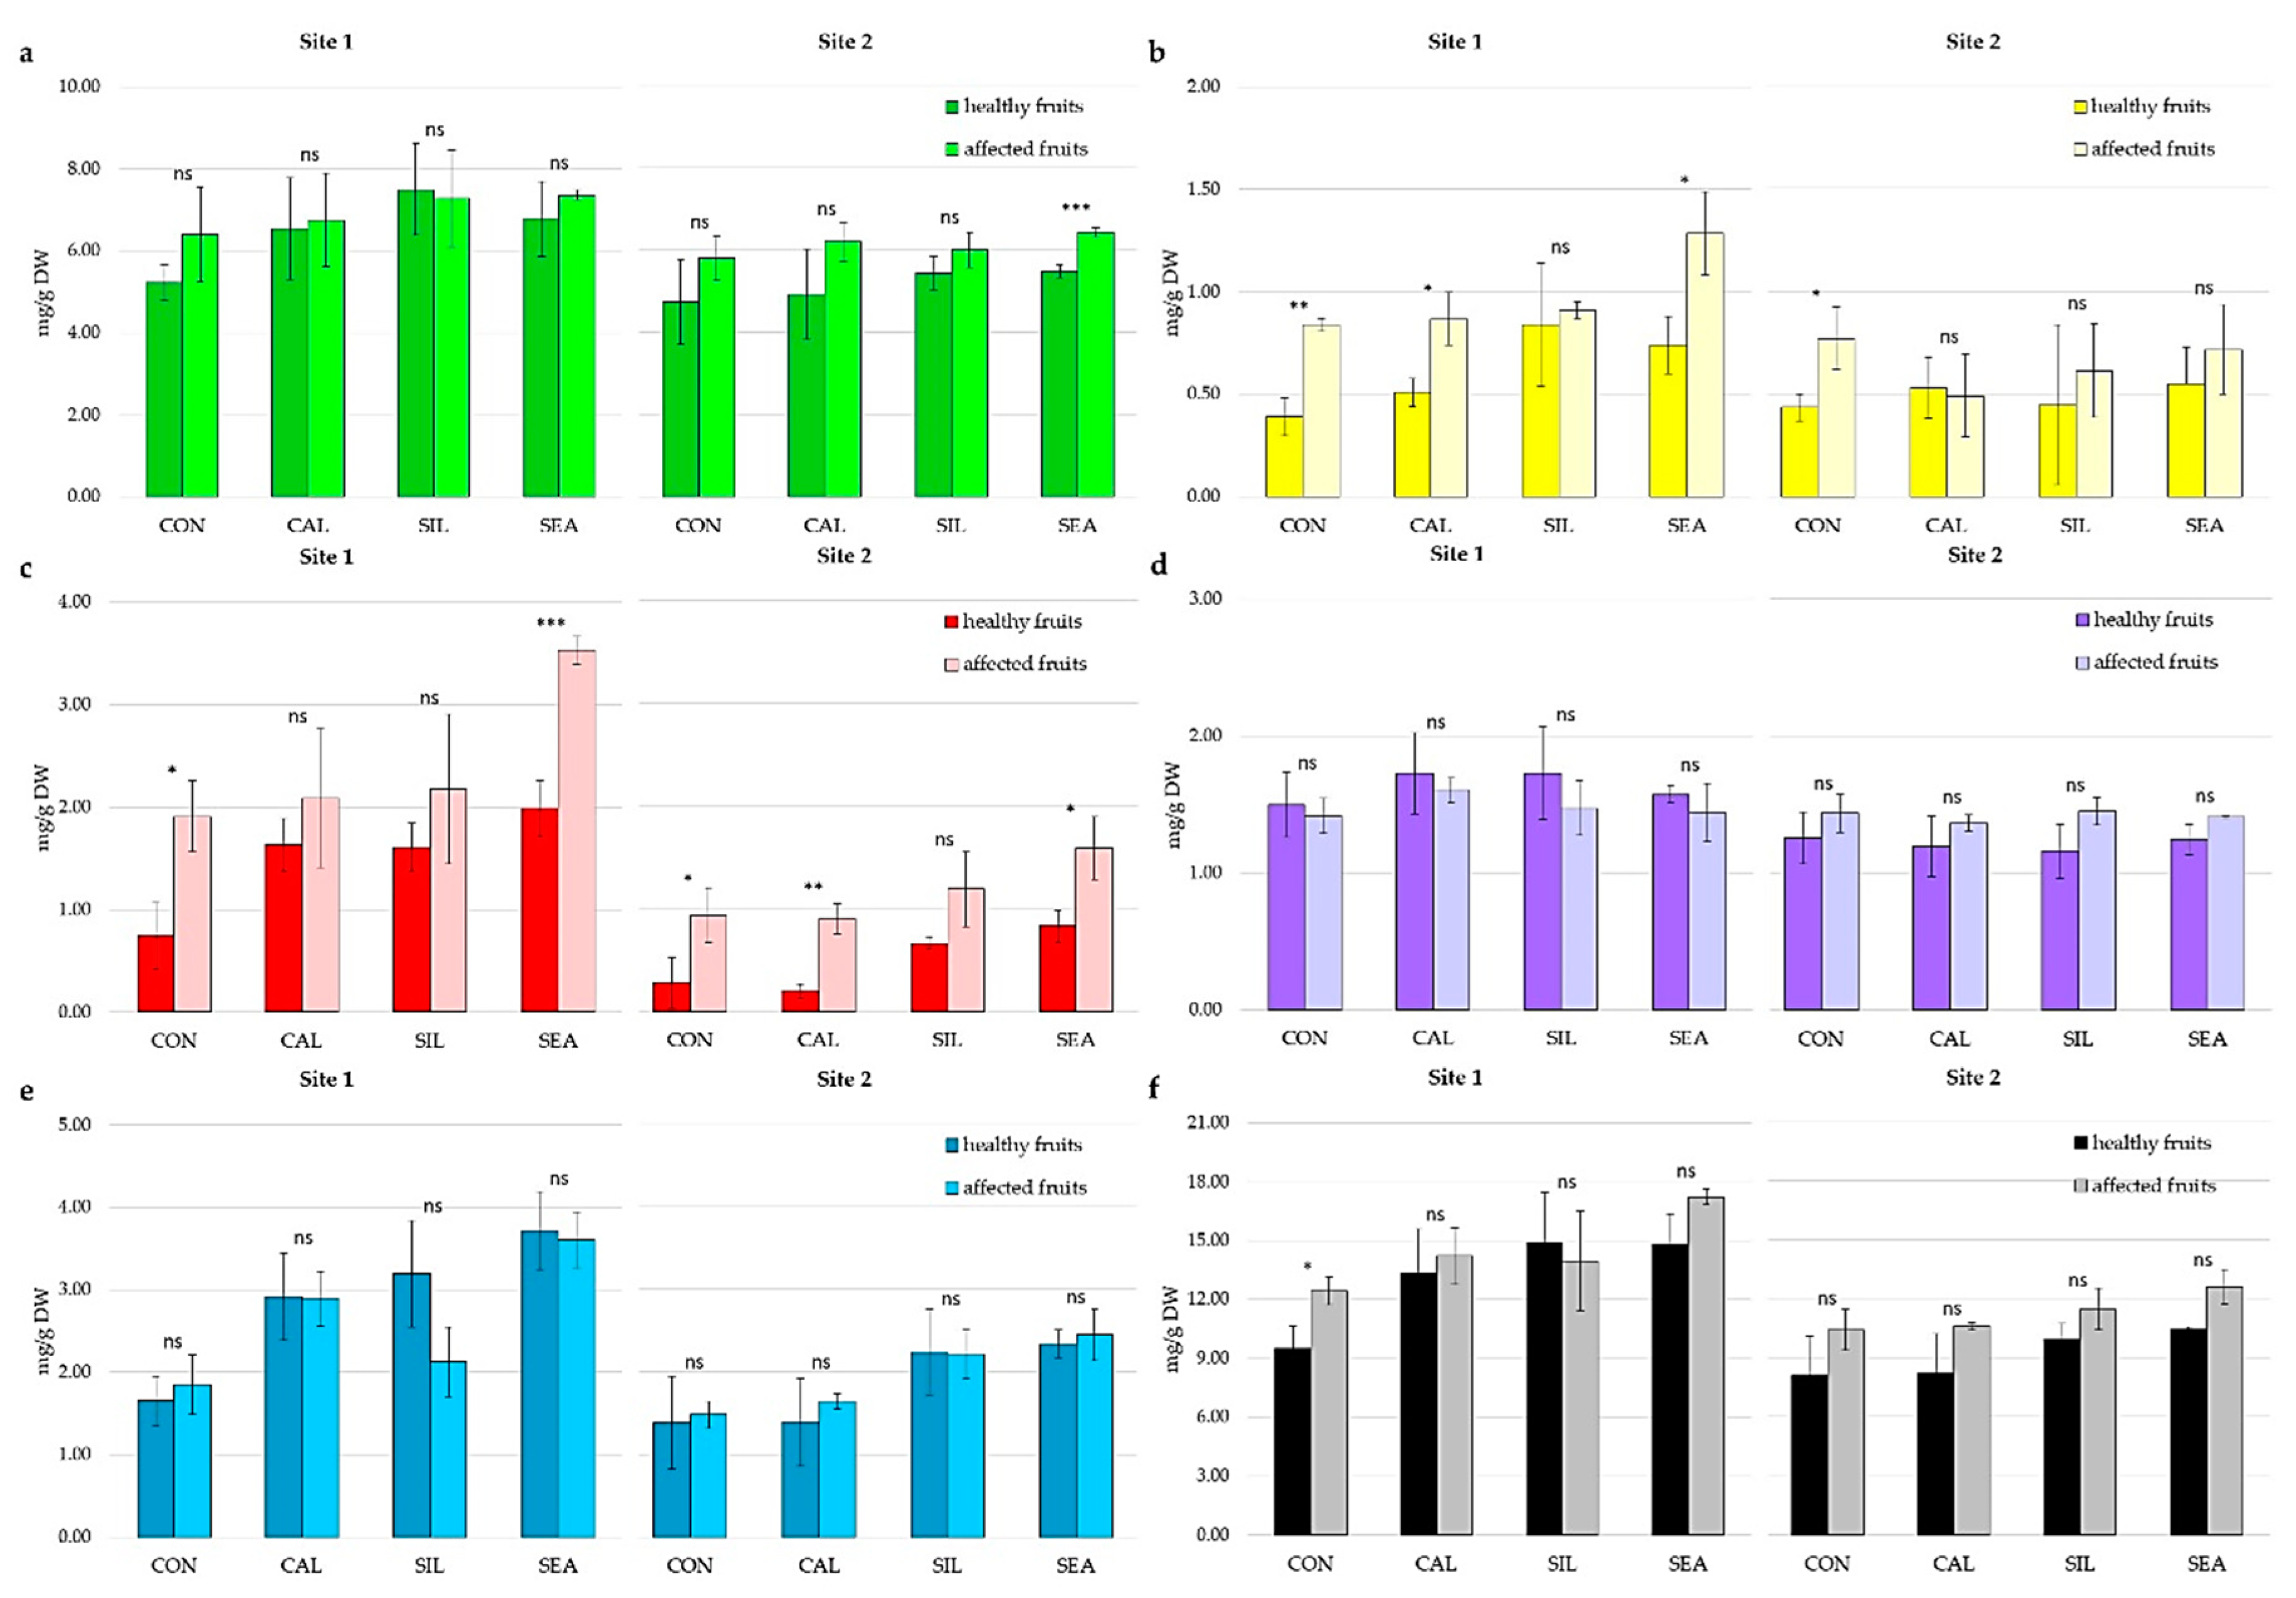
3.2. Fruit Quality and Disorder Incidence during Storage

Treatments did not significantly affect fruit quality during the storage period (Figures S5 and S6). Apples from both sites showed a relevant drop of flesh firmness during the storage, reaching values around 5 kg cm−2 after 60 day in the store. As for the total acidity, fruits presented a decreasing trend with values lower than 6 g L−1 at the end of the storage period. Finally, the sugar content remained almost stable during storage with values that, independently from the considered treatments and sites, resulted around 12–13 °Bx.
Approximately 35% of the control fruits from both sites were affected by the Jonathan spot disorder after 160 days of storage (Figure 3a,b). The application of calcium chloride alone was not effective in reducing the incidence of the disorder in both sites. Differently, when calcium chloride was applied in combination with Siliforce® or seaweed extracts, the final incidence of the disorder was significantly reduced by approximately 20–25% as compared to control or CAL-treated apples. The final Jonathan spot incidence of SIL- and SEA-treated apples was around 10% at the end of the storage period for fruits coming from both sites (Figure 3a,b).
Independently from the treatments and the cultivation sites, fruits affected by the Jonathan spot disorder generally showed higher phenolic concentration than healthy fruits (Figure 4). In detail, in site 1 the total phenolic concentration in affected fruits ranged between 12.4 and 17.2 mg g−1 DW, whereas it was between 9.5 and 14.8 mg g−1 in the healthy ones (Figure 4f). Similarly, in the site 2, the total phenolic concentration was approximately 20% higher in affected than in healthy fruits. Considering the single classes of phenolic compounds, diseased SEA-treated fruits resulted significantly higher in flavan-3-ols concentration than healthy fruits (6.4 and 5.5 mg g−1 respectively, in site 2—Figure 4a). Hydroxycinnamic acids concentration was higher in affected fruits from CON, CAL, and SEA treatments (site 1, Figure 4b) and from untreated (CON) fruits from site 2. Anthocyanins (Figure 4c) concentration was found significantly higher in affected fruits from CON and SEA treatments (site 1) and from CON, CAL, and SEA treatments in site 2. Finally, no significant differences were detected for flavonols and dihydrochalcones classes of compounds in affected and healthy apples at the end of the storage period (Figure 4d,e).
When the effect of the applications was evaluated within homogeneous groups of fruits for status (i.e., healthy or affected) and site of production (site 1 or 2), SEA fruits showed a higher total phenolic accumulation compared to the controls in both healthy (15 and 9 mg g−1 DW, respectively) and affected (17 and 12 mg g−1 DW, respectively) fruits from site 1 (Figure 5a,b). Higher concentrations were found especially for the classes of anthocyanins and flavonols that were approximately two-fold in SEA-treated healthy or affected fruits as compared to the control ones. Differences were also evident in fruits from site 2 (Figure 5b), where SEA-treated apples accumulated approximately 60% more anthocyanins than control in healthy fruits. In affected fruits from site 2, seaweed applications enhanced by approximately 55% the final flavonols concentration as compared to untreated apples (Figure 5b).
Nitrogen concentration did not change significantly in healthy or affected fruits belonging to the different treatments and sampled in both sites (Figure 6a). Affected fruits always showed lower Ca concentration as compared to healthy fruits (Figure 6b). This was particularly evident in fruits from site 2, where affected apples of CAL and SIL treatments presented a calcium concentration that was significantly lower than the corresponding healthy ones. Potassium concentration was found significantly lower (by 100–150 mg 100 g−1 DW) in site 1-affected apples treated with Siliforce® and seaweed extracts (Figure 6c) compared to the control, whereas differences were not significant when healthy fruits of the different treatments were compared. Moreover, affected apples of CON and CAL treatments showed significantly higher K concentrations than the respective healthy fruits. Magnesium concentration in apple skin resulted unaffected by treatments and status in apple fruits collected in site 2, whereas in site 1, CON-, SIL-, and SEA-treated and affected fruits showed a significantly higher concentration than the corresponding healthy ones (Figure 6d). Healthy fruits from both sites generally presented higher Mn and Zn concentrations than affected apples (Figure 6e,f). For CAL-treated fruits, Mn accumulation in skin tissue was statistically higher in healthy than in affected apples from both sites, showing a +20% and a +40% concentration, respectively, in site 1 and 2. In site 1, Siliforce® applications approximately doubled the Zn concentration of healthy apple skin compared to all other treatments, whereas in affected fruits, the concentration increase was seven folds. In site 2, Zn concentration in affected CAL-treated fruits were 50% of the correspondent healthy ones, whereas treatments did not affect the Zn concentration in apples when compared to control. Finally, Si amount in apple skin showed a contrasting behavior, with site 1 and site 2 fruits presenting, respectively, higher and lower Si concentrations in affected apples (significant differences in SEA-treated fruits only) (Figure 6g).

4. Discussion

Independently from the differences in crop load and yield per tree, treatments with calcium chloride alone or in combination with seaweed extracts or Siliforce® did not result in significant modification of the yield parameters when compared with untreated control (Table 2). Seaweed application did not affect the final yield, thus confirming former reports in the literature [15,32,33], whereas it enhanced the fruit number and final yield of apple trees showing alternate bearing [34]. Siliforce® applications significantly increased the fruit number and yield per tree when compared to the sole calcium chloride treatment (Figure 1 and Table 2). Increased yield was also detected in strawberry [35,36] and in other crops (i.e., rice, [37]) after the application of Si-containing products similar to Siliforce®. Silicon is considered able to burst plant productivity because of its role in the primary metabolism as an important cofactor of carboxylation enzymes that are responsible for the photosynthetic process [38].
Apples from site 2 were less colored as indicated by the significantly lower average color index value (Table 3). Large and dense canopies, like those of trees in site 2, were generally characterized by a poor light inner-canopy distribution, resulting in reduced final fruit color [39]. Independently from the orchards’ characteristics, seaweed applications were effective in enhancing anthocyanin accumulation in the skin, and, consequently, apple final reddish coloration (Table 3 and Table 4; Figure S4). These findings are consistent with those reported by other authors on apple [15,33], grapevine [40], and strawberry [35,41]. Seaweed extracts were shown to be able to interfere with the metabolism of plant hormones (mainly cytokines and abscisic acid [42]), leading to an induction of anthocyanin biosynthesis, and accumulation in fruit skin prior to harvest.
Coherently with expectations, treatments with Ca- and Zn-containing products resulted in higher concentrations of those two elements in apple skin at harvest (Table 5 and Figure 2). The reduced K concentration of treated fruits can be interpreted as the result of the K+ and Ca2+ competition for biding sites at cellular level [43,44]. Moreover, site 1 presented larger Cu concentration in fruit skin because of the repeated Cu applications foreseen for pathogens control in organically managed orchards (Figure 2).
The combined application of calcium chloride with a seaweed extract or with a Zn-containing product (Siliforce®) was effective in lowering the incidence of the physiological disorder “Jonathan spot” in stored apples harvested in both the experimental orchards (Figure 3a,b). A similar reduction of post-harvest disorders was also detected after a repeated application of Zn and amino acids in similar growing conditions [15], whereas there is no further evidence of seaweed’s efficacy against apple storage disorders in the literature. Unbalances in the Ca concentration in fruits have often been associated with post-harvest disorders (i.e., bitter pit) in apples [45,46]. In our experimental conditions, the combined application of Ca and Zn resulted in higher concentration of these elements at apple skin level (Table 5 and Figure 2). The higher availability of these elements might have contributed to strengthening cell membrane stability [47,48,49], therefore, reducing the development of the post-harvest “Jonathan spot” disorder during storage. The higher concentration of Ca, Zn, and Mn found in healthy apple fruits compared to the affected ones (Figure 6b,e,f) might represent further evidence of the positive role carried out by these elements in increasing fruit resistance toward storage disorder. Pais and Petho [50] were the first to describe a negative correlation between Zn concentration and the “Jonathan spot” disorder incidence, whereas further studies have pointed out the positive effects of pre-harvest treatments with Zn and Ca on apple storability and overall quality [51]. Phenolic compounds’ concentration changed during the storage, but the interpretation of the role of these modifications in the development of the post-harvest disorder is not straightforward. Total phenolic concentration in apple skin at harvest was not affected by treatments, whereas the accumulation of single classes of compounds (i.e., anthocyanins) was enhanced in seaweed-treated fruits (Table 4 and Figure 5). After storage, symptomatic apples were generally higher in phenolic concentration than the unaffected ones, the classes of hydroxycinnamic acids and anthocyanins being the most affected by the disorder (Figure 4b,c). Phenolics are known to be synthetized by plants in response to stress conditions [52,53]. Our results indicate that stress conditions occurring during the storage probably trigged phenolic biosynthesis more in symptomatic fruits than in the asymptomatic ones. Flavanols and hydroxycinnamic acids were found higher in the skin of apples affected by bitter pit, whereas the concentration of flavonols and anthocyanins was higher in healthy fruits [54]. These results are partially consistent with our findings, despite differences in the considered cultivar and the type of storage disorder. Further investigation is needed in order to better understand the effects of concentration changes in phenolic classes during storage and their relationship with the outburst of physiological disorders.

5. Conclusions

This study has shown that the pre-harvest applications of biostimulants (based on seaweed extracts and inorganic compounds Zn and Si) in combination with Ca can enhance the esthetical quality of apple fruits at harvest by increasing the intensity of skin color and can also reduce the incidence of storage disorder. These results were obtained under different cultivation systems such as tree age, planting density, and production typology (integrated and organic management). Although the research focused on a single apple cultivar and on a specific disorder (Jonathan spot), the overall findings of this study might have relevant implications for pre-harvest practices aiming at enhancing the quality of different fruit crops at harvest and after storage. Since the study was limited to only one season, further research needs to be conducted to better describe the optimization of biostimulants way of application under different environmental and weather conditions.

Supplementary Materials

The following are available online at https://www.mdpi.com/2073-4395/10/8/1214/s1, Figure S1. Above: Site 1 orchard (five-year-old Jonathan/M9 apple trees, at a density of 3333 trees ha−1. Below: Site 2 orchard (42 year old Jonathan/seedling, at a density of 455 trees ha−1). Figure S2: Meteorological conditions during the growing season 2014 at the Laimburg Research Centre in Ora (Italy). Temperatures (lines) and cumulated monthly rainfalls (columns). Figure S3: Spots development in apple fruits cv. Jonathan affected by “Jonathan spot” disorder. Figure S4. Increased red coloration by seaweed applications (above) as compared to untreated control (below). The pictures were taken before harvest (end of August) in site 1 orchard. Figure S5: Firmness (a), total soluble solids (b), and acidity (c) at harvest and during storage (at 0, 60, 130, and 160 days) as affected by treatments in Site1. Vertical bars indicate mean ± SD, n = 3. Bars without letters indicate no significant differences according to LSD test at p < 0.05. Treatments’ legend: CON, control; CAL, calcium chloride; SIL, Siliforce® + calcium chloride; SEA, seaweeds + calcium chloride. Figure S6: Firmness (a), total soluble solids (b), and acidity (c) at harvest and during storage (at 0, 60, 130, and 160 days) as affected by treatments in Site 2. Vertical bars indicate mean ± SD, n = 3. Bars without letters indicate no significant differences according to LSD test at p < 0.05. Treatments’ legend: CON, control; CAL, calcium chloride; SIL, Siliforce® + calcium chloride; SEA, seaweeds + calcium chloride.

Author Contributions

Conceptualization, S.S., M.K., R.T. and C.A.; methodology, S.S. and C.A.; formal analysis, S.S.; data analysis, S.S., D.Z. and C.A.; resources, C.A. and M.K.; writing—original draft preparation, S.S. and C.A.; writing—review and editing, D.Z.; S.S., R.T. and C.A.; supervision, C.A. and M.K. All authors have read and agreed to the published version of the manuscript.

Funding

This research received no external funding. The publication of this work was supported by the Open Access Publishing Fund of the Free University of Bozen-Bolzano.

Conflicts of Interest

The authors declare no conflict of interest.

References

  1. Musacchi, S.; Serra, S. Apple fruit quality: Overview on pre-harvest factors. Sci. Hortic. 2018, 234, 409–430. [Google Scholar] [CrossRef]
  2. Gago, C.M.L.; Guerreiro, A.C.; Miguel, G.; Panagopoulos, T.; da Silva, M.M.; Antunes, M.D.C. Effect of calcium chloride and 1-MCP (SmartfreshTM) postharvest treatment on ‘Golden Delicious’ apple cold storage physiological disorders. Sci. Hortic. 2016, 211, 440–448. [Google Scholar] [CrossRef]
  3. Bangerth, F. Calcium-related physiological disorders of plants. Annu. Rev. Phytopathol. 1979, 17, 97–122. [Google Scholar] [CrossRef]
  4. Fallahi, E.; Conway, W.S.; Hickey, K.D.; Sams, C.E. The role of calcium and nitrogen in postharvest quality and disease resistance of apples. Hort. Sci. 1997, 32, 831–835. [Google Scholar] [CrossRef] [Green Version]
  5. Dris, R.; Niskanen, R. Calcium chloride sprays decrease physiological disorders following long-term cold storage of apple. Plant Foods Hum. Nutr. 1999, 54, 159–171. [Google Scholar] [CrossRef]
  6. de Freitas, S.T.; do Amarante, C.V.T.; Mitcham, E.J. Mechanisms regulating apple cultivar susceptibility to bitter pit. Sci. Hortic. 2015, 186, 54–60. [Google Scholar] [CrossRef]
  7. Perring, M.A.; Pearson, K. Redistribution of minerals in apple fruit during storage: The effect of storage atmosphere on calcium concentration. J. Sci. Food Agric. 1987, 40, 37–42. [Google Scholar] [CrossRef]
  8. Saure, M.C. Calcium translocation to fleshy fruit: Its mechanism and endogenous control. Sci. Hortic. 2005, 105, 65–89. [Google Scholar] [CrossRef]
  9. Amarante, C.V.T.; Silveira, J.P.G.; Steffens, C.A.; Paes, F.N.; Argenta, L.C. Tissue sampling method and mineral attributes to predict bitter pit occurrence in apple fruit: A multivariate approach. VII Int. Postharvest Symp. 1012 2013, 1133–1139. [Google Scholar] [CrossRef]
  10. Tagliavini, M.; Toselli, M. Foliar applications of nutrients. In Encyclopedia of Soils in the Environment; Elsevier: Amsterdam, The Netherlands, 2005; pp. 53–59. [Google Scholar]
  11. Yuri, J.A.; Retamales, J.B.; Moggia, C.; Vásquez, J.L. Bitter pit control in apples cv. ′Braeburn′ through foliar sprays of different calcium sources. Acta Hortic. 2002, 594, 453–460. [Google Scholar] [CrossRef]
  12. Lötze, E.; Joubert, J.; Theron, K.I. Evaluating pre-harvest foliar calcium applications to increase fruit calcium and reduce bitter pit in ′Golden Delicious′ apples. Sci. Hortic. 2008, 116, 299–304. [Google Scholar] [CrossRef]
  13. EU, European Union Fertilizing Products Regulation. Available online: http://data.europa.eu/eli/reg/2019/1009/oj (accessed on 1 July 2020).
  14. Basile, B.; Rouphael, Y.; Colla, G.; Soppelsa, S.; Andreotti, C. Appraisal of emerging crop management opportunities in fruit trees, grapevines and berry crops facilitated by the application of biostimulants. Sci. Hortic. 2020, 267, 109330. [Google Scholar] [CrossRef]
  15. Soppelsa, S.; Kelderer, M.; Casera, C.; Bassi, M.; Robatscher, P.; Andreotti, C. Use of biostimulants for organic apple production: Effects on tree growth, yield, and fruit quality at harvest and during storage. Front. Plant Sci. 2018, 9, 1342. [Google Scholar] [CrossRef] [PubMed]
  16. Ighodaro, O.M.; Akinloye, O.A. First line defence antioxidants-superoxide dismutase (SOD), catalase (CAT) and glutathione peroxidase (GPX): Their fundamental role in the entire antioxidant defence grid. Alex. J. Med. 2018, 54, 287–293. [Google Scholar] [CrossRef] [Green Version]
  17. Taranto, F.; Pasqualone, A.; Mangini, G.; Tripodi, P.; Miazzi, M.M.; Pavan, S.; Montemurro, C. Polyphenol oxidases in crops: Biochemical, physiological and genetic aspects. Int. J. Mol. Sci. 2017, 18, 377. [Google Scholar] [CrossRef]
  18. Ghasemi, S.; Khoshgoftarmanesh, A.H.; Hadadzadeh, H.; Jafari, M. Synthesis of iron-amino acid chelates and evaluation of their efficacy as iron source and growth stimulator for tomato in nutrient solution culture. J. Plant Growth Regul. 2012, 31, 498–508. [Google Scholar] [CrossRef]
  19. Popko, M.; Michalak, I.; Wilk, R.; Gramza, M.; Chojnacka, K.; Górecki, H. Effect of the new plant growth biostimulants based on amino acids on yield and grain quality of winter wheat. Molecules 2018, 23, 470. [Google Scholar] [CrossRef] [Green Version]
  20. Yuan, L.; Wu, L.; Yang, C.; Lv, Q. Effects of iron and zinc foliar applications on rice plants and their grain accumulation and grain nutritional quality. J. Sci. Food Agric. 2013, 93, 254–261. [Google Scholar] [CrossRef]
  21. Aziz, R.A.; Naira, A.; Moieza, A. Effect of plant biostimulants on fruit cracking and quality attributes of pomegranate cv. ‘Kandhari kabuli’. Sci. Res. Essays 2013, 8, 2171–2175. [Google Scholar] [CrossRef]
  22. Correia, S.; Oliveira, I.; Queirós, F.; Ribeiro, C.; Ferreira, L.; Luzio, A.; Silva, A.P.; Gonçalves, B. Preharvest application of seaweed based biostimulant reduced cherry (Prunus Avium L.) cracking. Procedia Environ. Sci. 2015, 29, 251–252. [Google Scholar] [CrossRef] [Green Version]
  23. Ma, J.F. Uptake of silicon in different plant species. In Handbook of Biomineralization; John Wiley & Sons, Ltd.: Hoboken, NJ, USA, 2008; pp. 113–124. [Google Scholar]
  24. Sorrenti, G.; Quartieri, M.; Caruso, S.; Lugli, S.; Rombolà, A.D. Efficace impiego di silicato di sodio e cloruro di calcio per ridurre lo spacco dei frutti. Riv. Fruttic. E Ortofloric. 2008, 70, 28–32. [Google Scholar]
  25. Agrios, Direttive per la Produzione Frutticola Integrata. Available online: http://www.agrios.it/en/ (accessed on 1 July 2020).
  26. Tessmer, M.A.; Appezzato-da-Glória, B.; Antoniolli, L.R. Influence of growing sites and physicochemical features on the incidence of lenticel breakdown in ′Gala′ and ′Galaxy′ apples. Sci. Hortic. 2016, 205, 119–126. [Google Scholar] [CrossRef] [Green Version]
  27. Andreotti, C.; Ravaglia, D.; Ragaini, A.; Costa, G. Phenolic compounds in peach (Prunus persica) cultivars at harvest and during fruit maturation. Ann. Appl. Biol. 2008, 153, 11–23. [Google Scholar] [CrossRef]
  28. Guerrero-Chavez, G.; Scampicchio, M.; Andreotti, C. Influence of the site altitude on strawberry phenolic composition and quality. Sci. Hortic. 2015, 192, 21–28. [Google Scholar] [CrossRef]
  29. ISO 16634-1:2008. Food Products—Determination of the Total Nitrogen Content by Combustion according to the Dumas Principle and Calculation of the Crude Protein Content—Part 1: Oilseeds and Animal Feeding Stuffs; International Organization for Standardization: Geneva, Switzerland, 2008. [Google Scholar]
  30. EPA 3052. Microwave Assisted Acid Digestion of Siliceous and Organically Based Matrics; USA Environmental Protection Agency: Washington, DC, USA, 1996.
  31. EPA 6010D. Inductively Coupled Plasma—Optical Emission Spectrometry; USA Environmental Protection Agency: Washington, DC, USA, 2018.
  32. Bradshaw, T.L.; Berkett, L.P.; Griffith, M.C.; Kingsley-Richards, S.L.; Darby, H.M.; Parsons, R.L.; Moran, R.E.; Garcia, M.E. Assessment of kelp extract biostimulants on tree growth, yield, and fruit quality in a certified organic apple orchard. Acta Hortic. 2013, 1010, 191–198. [Google Scholar] [CrossRef]
  33. Malaguti, D.; Rombolà, A.D.; Gerin, M.; Simoni, G.; Tagliavini, M.; Marangoni, B. Effect of seaweed extracts-based leaf sprays on the mineral status, yield and fruit quality of apple. Acta Hortic. 2002, 594, 357–359. [Google Scholar] [CrossRef]
  34. Spinelli, F.; Fiori, G.; Noferini, M.; Sprocatti, M.; Costa, G. Perspectives on the use of a seaweed extract to moderate the negative effects of alternate bearing in apple trees. J. Hortic. Sci. Biotechnol. 2009, 84, 131–137. [Google Scholar] [CrossRef]
  35. Soppelsa, S.; Kelderer, M.; Casera, C.; Bassi, M.; Robatscher, P.; Matteazzi, A.; Andreotti, C. Foliar applications of biostimulants promote growth, yield and fruit quality of strawberry plants grown under nutrient limitation. Agronomy 2019, 9, 483. [Google Scholar] [CrossRef] [Green Version]
  36. Hajiboland, R.; Moradtalab, N.; Eshaghi, Z.; Feizy, J. Effect of silicon supplementation on growth and metabolism of strawberry plants at three developmental stages. N. Z. J. Crop Hortic. Sci. 2018, 46, 144–161. [Google Scholar] [CrossRef]
  37. Agostinho, F.; Tubana, B.; Martins, M.; Datnoff, L. Effect of different silicon sources on yield and silicon uptake of rice grown under varying phosphorus rates. Plants 2017, 6, 35. [Google Scholar] [CrossRef]
  38. Artyszak, A. Effect of silicon fertilization on crop yield quantity and quality—A literature review in Europe. Plants 2018, 7, 54. [Google Scholar] [CrossRef] [Green Version]
  39. Lordan, J.; Francescatto, P.; Dominguez, L.; Robinson, T. Long-term effects of tree density and tree shape on apple orchard performance, a 20 year study—Part 1, agronomic analysis. Sci. Hortic. 2018, 238, 303–317. [Google Scholar] [CrossRef]
  40. Frioni, T.; Sabbatini, P.; Tombesi, S.; Norrie, J.; Poni, S.; Gatti, M.; Palliotti, A. Effects of a biostimulant derived from the brown seaweed Ascophyllum nodosum on ripening dynamics and fruit quality of grapevines. Sci. Hortic. 2018, 232, 97–106. [Google Scholar] [CrossRef]
  41. Weber, N.; Schmitzer, V.; Jakopic, J.; Stampar, F. First fruit in season: Seaweed extract and silicon advance organic strawberry (Fragaria×ananassa Duch.) fruit formation and yield. Sci. Hortic. 2018, 242, 103–109. [Google Scholar] [CrossRef]
  42. Wally, O.; Critchley, A.; Hiltz, D.; Craigie, J.; Han, X.; Zaharia, I.; Abrams, S.; Prithiviraj, B. Regulation of phytohormone biosynthesis and accumulation in Arabidopsis following treatment with commercial extract from the marine macroalga Ascophyllum nodosum. J. Plant Growth Regul. 2013, 32, 324–339. [Google Scholar] [CrossRef]
  43. Fageria, N.K. Nutrient management for improving upland rice productivity and sustainability. Commun. Soil Sci. Plant Anal. 2001, 32, 2603–2629. [Google Scholar] [CrossRef]
  44. de Freitas, S.T.; Jiang, C.-Z.; Mitcham, E.J. Mechanisms involved in calcium deficiency development in tomato fruit in response to gibberellins. J. Plant Growth Regul. 2012, 31, 221–234. [Google Scholar] [CrossRef]
  45. Saure, M. Reassessment of the role of calcium in development of bitter pit in apple. Funct. Plant Biol. 1996, 23, 237–243. [Google Scholar] [CrossRef]
  46. Ferguson, I.; Volz, R.; Woolf, A. Preharvest factors affecting physiological disorders of fruit. Postharvest Biol. Technol. 1999, 15, 255–262. [Google Scholar] [CrossRef]
  47. Henriques, A.R.; Chalfun-Junior, A.; Aarts, M. Strategies to increase zinc deficiency tolerance and homeostasis in plants. Braz. J. Plant Physiol. 2012, 24, 3–8. [Google Scholar] [CrossRef] [Green Version]
  48. de Freitas, S.T.; do Amarante, C.V.T.; Labavitch, J.M.; Mitcham, E.J. Cellular approach to understand bitter pit development in apple fruit. Postharvest Biol. Technol. 2010, 57, 6–13. [Google Scholar] [CrossRef]
  49. Guerriero, G.; Hausman, J.-F.; Legay, S. Silicon and the plant extracellular matrix. Front. Plant Sci. 2016, 7, 463. [Google Scholar] [CrossRef] [PubMed] [Green Version]
  50. Pais, L.; Petho, F. Investigations on causes of ‘Jonathan spot’. I. Szolo Es Gyumtermeszt. 1970, 6, 31–42. [Google Scholar]
  51. Johnson, D.S.; Dover, C.J. The effect of calcium and zinc sprays on the texture of ′Cox′s Orange Pippin′ apples in controlled atmosphere storage. Acta Hortic. 2002, 594, 427–433. [Google Scholar] [CrossRef]
  52. Treutter, D. Significance of flavonoids in plant resistance: A review. Environ. Chem. Lett. 2006, 4, 147–157. [Google Scholar] [CrossRef]
  53. Treutter, D. Biosynthesis of phenolic compounds and its regulation in apple. Plant Growth Regul. 2001, 34, 71–89. [Google Scholar] [CrossRef]
  54. Zupan, A.; Mikulic-Petkovsek, M.; Cunja, V.; Stampar, F.; Veberic, R. Comparison of phenolic composition of healthy apple tissues and tissues affected by bitter pit. J. Agric. Food Chem. 2013, 61, 12066–12071. [Google Scholar] [CrossRef]
Figure 1. Effect of the biostimulants on the number of fruits per plant compared with the controls for Site 1 and Site 2. Vertical bars indicate means ± SD (n = 3). Within each site, the letters indicate significant differences according to Tukey’s HSD post-hoc test; p < 0.05 (ns: not significant).
Agronomy 10 01214 g001
Figure 2. Effect of the biostimulants on copper (above) and zinc (below) content in apples harvested in Site 1 and Site 2. Vertical bars indicate means ± SD (n = 3). Within each site, letters indicate significant differences according to Tukey’s HSD post-hoc test; p < 0.05 (ns: not significant).
Agronomy 10 01214 g002
Figure 3. “Jonathan spot” disorder incidence in apples during storage (at 0, 60, 130, and 160 days) as affected by treatments in site 1 (a) and site 2 (b). For each evaluating period, letters indicate significant differences according to Tukey’s HSD post-hoc test; p < 0.05 (ns: not significant).
Agronomy 10 01214 g003
Figure 4. Phenolic content (flavan-3-ols—(a), hydroxycinnamic acids—(b), anthocyanins—(c), dihydrochalcones—(d), flavonols—(e), and total—(f)) in apple skin after storage in healthy and symptomatic fruits in site 1 (left) and site 2 (right). Vertical bars indicate mean ± SD (n = 3). Asterisk on the top of the bar indicates significant differences according to one-way ANOVA (*** p < 0.001; ** p < 0.01; * p < 0.05; ns: not significant).
Agronomy 10 01214 g004
Figure 5. Phenolic content in apple skin after storage in healthy and affected fruits in site 1 (a) and site 2 (b). Vertical bars indicate mean ± SD (n = 3). Letters inside bars refer to significant differences among treatments for each single phenolic class, according to Tukey’s HSD post-hoc test; p < 0.05. Letters on the top of the bar indicate significant differences among treatments for total phenolic content, according to Tukey’s HSD post-hoc test; p < 0.05.
Agronomy 10 01214 g005
Figure 6. Nitrogen (a), calcium (b), potassium (c), magnesium (d), manganese (e), zinc (f), and silicon (g) content in apple skin after storage in healthy and symptomatic fruits in site 1 (left) and site 2 (right). Vertical bars indicate mean ± SD (n = 3). Asterisk on the top of the bar indicates significant differences according to one-way ANOVA (*** p < 0.001; ** p < 0.01; * p < 0.05; ns: not significant) between healthy and affected fruits. Letters inside bars refer to significant differences among treatments for healthy fruits (lowercase letters) and affected fruits (uppercase letters), according to Tukey’s HSD post-hoc test; p < 0.05.
Agronomy 10 01214 g006
Table 1. Product characterization, properties, and mode of application.
TreatmentActive IngredientCommercial NameDose (mL 100 L−1)Number of ApplicationsDates of ApplicationsOther Characteristics
CON 1H2O--0--
CALCaCl2Alical® (SIPCAM Italia spa, Pero, Italy)400628 May 2014 (45 DAFB 2) 11 June 2014 (59 DAFB) 25 June 2014 (73 DAFB) 9 July 2014 (87 DAFB) 23 July 2014 (101 DAFB) 6 August 2014 (115 DAFB, 3 weeks before harvest)Calcium chloride solution. Calcium oxide water-soluble: 17%
SILSi, Zn, Mo + CaCl2Siliforce® (ILSA spa, Arzignano, Italy) + Alical®200 + 4006Same as for CAL treatmentFluid mixture of micro-elements containing silicon (8 g kg−1), molybdenum (0.2%), and zinc (1.8%)
SEASeaweed cream + CaCl2Algavis® (SERBIOS srl, Polesine, Italy) + Alical®200 + 4006Same as for CAL treatmentFiltered seaweeds cream solution (Ascophyllum nodosum). Organic carbon of biological origin (4%), mannitol (0.7 g L−1)
1 Treatments’ legend: CON, control; CAL, calcium chloride; SIL, Siliforce®; SEA, seaweeds extract. 2 DAFB, days after full bloom.
Table 2. Yield parameters at harvest as affected by treatments and sites 1.
Yield (kg Tree−1)Yield (t ha−1)Fruit Weight (g)Fruit Diameter (mm)
Treatment (T)
CON65.54 ± 57.27 ab47.53 ± 6.72133.37 ± 7.5273.40 ± 3.05
CAL63.87 ± 55.81 b46.42 ± 8.35135.93 ± 6.4174.75 ± 1.65
SIL69.61 ± 60.81 a50.54 ± 7.91134.70 ± 6.4474.48 ± 4.05
SEA68.57 ± 59.90 ab49.78 ± 6.93131.45 ± 7.8276.38 ± 3.72
Significance*nsnsns
Site (S)
Site 113.60 ± 1.5142.50 ± 4.70137.89 ± 5.5077.06 ± 2.25
Site 2120.20 ± 5.4754.63 ± 2.49129.83 ± 5.6072.45 ± 2.24
Significance************
T × Snsnsnsns
1 Mean values ± standard deviation (SD) (n = 3) followed by the same letter do not significantly differ according to Tukey’s HSD post-hoc test; p < 0.05. Two-way ANOVA significant differences: *** p < 0.001; ** p < 0.01; * p < 0.05; ns: not significant. Treatments’ legend: CON, control; CAL, calcium chloride; SIL, Siliforce® + calcium chloride; SEA, seaweeds + calcium chloride.
Table 3. Fruit quality traits (firmness, soluble solids, acidity, and color index) as affected by biostimulants and sites 1.
Firmness (kg cm−2)Total Soluble Solids (°Brix)Acidity (g L−1)Color Index
Treatment (T)
CON7.75 ± 0.2412.42 ± 1.107.58 ± 1.0632.13 ± 8.87 b
CAL7.87 ± 0.2512.25 ± 1.207.60 ± 1.0032.05 ± 7.33 b
SIL7.63 ± 0.2012.21 ± 1.047.08 ± 0.9632.33 ± 5.94 b
SEA7.85 ± 0.2812.28 ± 1.117.50 ± 0.9440.47 ± 12.39 a
Significancensnsns*
Site (S)
Site 17.73 ± 0.2411.33 ± 0.198.20 ± 0.5540.58 ± 8.88
Site 27.82 ± 0.2513.25 ± 0.486.68 ± 0.5727.92 ± 2.81
Significancens*********
T × Snsnsnsns
1 Mean values ± SD (n = 3) followed by the same letter do not significantly differ according to Tukey’s HSD post-hoc test; p < 0.05. Two-way ANOVA significant differences: *** p < 0.001; ** p < 0.01; * p < 0.05; ns: not significant.
Table 4. Phenolic content in apple skin at harvest as affected by treatments and sites 1.
Flavan-3-ols (mg g−1 DW)Hydroxycinnamic Acids (mg g−1 DW)Anthocyanins (mg g−1 DW)Dihydro-Chalcones (mg g−1 DW)Flavonols (mg g−1 DW)Total (mg g−1 DW)
Treatment (T)
CON5.76 ± 1.080.28 ± 0.592.02 ± 0.72 b1.59 ± 0.152.78 ± 0.6412.43 ± 2.02
CAL5.42 ± 0.750.44 ± 0.413.18 ± 0.71 ab2.00 ± 0.234.94 ± 0.9915.98 ± 1.82
SIL5.88 ± 2.990.26 ± 0.232.60 ± 1.21 ab2.02 ± 0.814.88 ± 3.0215.65 ± 7.72
SEA6.92 ± 3.800.40 ± 0.523.99 ± 2.18 a2.15 ± 0.755.14 ± 2.3918.62 ± 9.52
Significancensns*nsnsns
Site (S)
Site 17.26 ± 2.880.53 ± 0.523.73 ± 1.662.17 ± 0.724.98 ± 2.6618.67 ± 7.54
Site 24.74 ± 0.540.17 ± 0.232.16 ± 0.621.71 ± 0.243.89 ± 1.2912.67 ± 2.36
Significance******ns*
T × Snsnsnsnsnsns
1 Mean values ± SD (n = 3) followed by the same letter do not significantly differ according to Tukey’s HSD post-hoc test; p < 0.05. Two-way ANOVA significant differences: *** p < 0.001; ** p < 0.01; * p < 0.05; ns: not significant.
Table 5. Macronutrients content in apple skin at harvest as affected by treatments and sites 1.
N (% DW)P (mg 100 g−1 DW)K (mg 100 g−1 DW)Ca (mg 100 g−1 DW)Mg (mg 100 g−1 DW)
Treatment (T)
CON0.48 ± 0.0261.46 ± 4.91645.56 ± 40.92 a46.06 ± 9.60 b86.47 ± 5.79
CAL0.51 ± 0.0259.30 ± 5.68613.46 ± 109.49 ab58.89 ± 13.58 ab88.43 ± 10.07
SIL0.48 ± 0.0256.71 ± 3.93581.39 ± 67.62 ab55.39 ± 16.76 ab85.41 ± 5.58
SEA0.50 ± 0.0354.73 ± 6.10550.41 ± 49.37 b61.84 ± 18.66 a85.98 ± 4.78
Significancensns**ns
Site (S)
Site 10.50 ± 0.0355.82 ± 6.42645.17 ± 62.6066.95 ± 11.7291.13 ± 5.59
Site 20.48 ± 0.0260.28 ± 3.43550.24 ± 57.5544.14 ± 8.2182.02 ± 3.48
Significance***********
T × Snsnsnsnsns
1 Mean values ± SD (n = 3) followed by the same letter do not significantly differ according to Tukey’s HSD post-hoc test; p < 0.05. Two-way ANOVA significant differences: *** p < 0.001; ** p < 0.01; * p < 0.05; ns: not significant.
Table 6. Micronutrients content in apple skin at harvest as affected by treatments and sites 1.
B (mg kg−1 DW)Fe (mg kg−1 DW)Mn (mg kg−1 DW)Si (mg kg−1 DW)Se (µg kg−1 DW)
Treatment (T)
CON21.66 ± 7.8940.72 ± 10.124.08 ± 0.7379.35 ± 21.541.47 ± 1.38
CAL21.39 ± 5.7638.69 ± 11.114.50 ± 1.1081.53 ± 25.251.24 ± 1.28
SIL23.99 ± 10.6343.88 ± 18.094.24 ± 0.34115.38 ± 113.481.88 ± 1.54
SEA22.48 ± 9.8235.59 ± 5.624.34 ± 0.82117.07 ± 92.801.70 ± 1.34
Significancensnsnsnsns
Site (S)
Site 115.10 ± 1.4435.75 ± 8.654.69 ± 0.8589.38 ± 69.172.63 ± 1.03
Site 229.67 ± 4.7943.69 ± 13.283.89 ± 0.37107.28 ± 77.530.52 ± 0.39
Significance***ns*ns***
T × Snsnsnsnsns
1 Mean values ± SD (n = 3) followed by the same letter do not significantly differ according to Tukey’s HSD post-hoc test; p < 0.05. Two-way ANOVA significant differences: *** p < 0.001; ** p < 0.01; * p < 0.05; ns: not significant.

