Article

Long-Term Nitrogen Fertilization Impacts on Soil Bacteria, Grain Yield and Nitrogen Use Efficiency of Wheat in Semiarid Loess Plateau, China

1
Gansu Provincial Key Laboratory of Aridland Crop Science, Gansu Agricultural University, Lanzhou 730070, China
2
College of Agronomy, Gansu Agricultural University, Lanzhou 730070, China
3
Dingxi Agricultural Products Quality and Safety Monitoring and Testing Station, Dingxi 743000, China
4
Department of Agronomy and Plant Genetics, University of Minnesota, St. Paul, MN 55108, USA
5
International Crops Research Institute for the Semi-Arid Tropics (ICRISAT), Patancheru, Hyderabad, Telangana 502324, India
6
College of Resource and Environment, Gansu Agricultural University, Lanzhou 730070, China
*
Author to whom correspondence should be addressed.
Agronomy 2020, 10(8), 1175; https://doi.org/10.3390/agronomy10081175
Submission received: 30 June 2020 / Revised: 2 August 2020 / Accepted: 9 August 2020 / Published: 11 August 2020
(This article belongs to the Special Issue Soil Healthy in Agro-ecosystems)

Abstract

:
Soil bacteria are key components of the soil microbial community contributing to soil health. Nitrogen (N) fertilization is an important factor that affects soil microbial community and cereal production. This study aims to explore the impact of long-term N fertilization on soil bacterial diversity, nitrogen use efficiency (NUE), and the grain yield of wheat in the semiarid region of Loess Plateau, China. The field experiment was conducted from 2003 to 2018 including five N treatments: 0 (N0), 52.5 (N52.5), 105 (N105), 157.5 (N157.5), and 210 (N210) kg N ha−1 yr−1. The soil pH was decreased by the N fertilization, while the soil ammonium, nitrate, and available phosphorus were increased. The N uptake and grain yield of wheat were significantly increased with N and the highest NUE (28%) and grain yield (44% higher than control) were observed at 105 kg N ha−1, but no significant increase in yield was observed by further increasing N rate. The bacterial diversity was significantly increased at N105. Soil bacteria community was strongly related to soil chemical properties and ammonium content was the most important contributor. The dominant soil bacterial phyla were Proteobacteria, Actinobacteria, Acidobacteria, Chloroflexi, Gemmatimonadetes, Bacteroidetes, Nitrospirae, Verrucomicrobia, and Planctomycetes. The higher grain yield of wheat was related to the higher class Gammaproteobacteria and Sphingobacteriia abundance, and lower class Acidobacteria and Chloroflexia abundance. In summary, 105 kg ha−1 yr−1 was the optimum rate of N for diversified soil bacterial community and wheat yield for sustainable wheat production in semiarid Loess Plateau of China, whose higher N use efficiency was attributed to the higher phyla Verrucomicrobia and Planctomycetes, and lower Proteobacteria abundance.

1. Introduction

Nitrogen (N) is one of the most important elements in plant nutrition [1] and its deficiency can limit the productivity of crops [2,3]. An adequate supply of N fertilizer plays an important role in increasing crop biomass and grain yields [4,5,6,7]. The global use of N fertilizer had increased dramatically, from 112.5 million tons in 2015 to 118.2 million tons in 2019 [8]. The use of N fertilizer in China exceeded 31 million tons in 2014, accounting for approximately 29% of global consumption [9], and However, the crop recovery rate of N fertilizer only accounts for 25–50% of the application rate [10,11].
Wheat (Triticum aestivum L.), especially spring wheat, is one of the dominant crops in the western Loess Plateau of China [12]. Recent investigations showed that most crop fields in this region received an excessive level of N fertilizer as compared to their nutritional requirement. The average N fertilizer application rate for wheat production has reached 229 kg N ha−1 [13,14]. However, long-term application of high N affects soil properties [15,16], and also leads to low nitrogen use efficiency (NUE), large amounts of nitrate in the soil profile [6], and subsequent soil acidification [15], groundwater pollution, eutrophication of surface water [17], and increased greenhouse gases emissions [18].
The interaction among crops, soil and microorganisms is considered the main driver for agroecosystem functions [19]. Microbial diversity in agricultural soils is critical for the maintenance of soil health and quality [20,21,22]. Soil bacteria being the most abundant and diverse group of soil microorganisms [23,24] work as biocontrol agents against soil-borne pathogens and play key roles in promoting plant growth [25,26].
The long-term excess N fertilization leads to changes in the overall bacterial community structure and populations [27,28,29], especially in cellulolytic bacteria, actinomycetes, and acid bacilli [30,31,32]. Therefore, understanding the changes in soil bacterial community structure and composition following long-term fertilization may have significant implications for the rational use of N fertilizer and sustainable agriculture. However, little is known about the responses of soil microbial community to long-term N fertilization practices in semiarid Loess Plateau.
In this study, we measured the impact of long-term N fertilization on soil physicochemical characteristics, soil bacterial diversity, N uptake and grain yield of wheat. The soil bacterial diversity and community were evaluated via MiSeq® sequencing of 16S rRNA genes. We hypothesize that different N fertilizer application rates would significantly alter soil properties, impacting not only the soil bacterial diversity and community, but also the NUE of wheat. Thus, the objectives of this long-term field experiment were to: (i) compare the effects of different rates of fertilizer application on the soil chemical properties, leaf area index (LAI), grain yield, and NUE of wheat, and soil bacterial diversity and community; (ii) determine which soil characteristics were most closely related to the soil bacterial diversity and community composition; and (iii) evaluate the relative contribution of soil Bacteria to the grain yield and NUE of wheat. This information will help to understand and manage N in agriculturally productive semiarid soils and provide a theoretical basis for the sustainable intensification of wheat production.

2. Materials and Methods

2.1. Site Description

This study was conducted from 2003 to 2018 at the rainfed Agricultural Experimental Station of the Gansu Agricultural University (35°28′ N, 104°44′ E, elevation 1971 m above sea level), Dingxi, Gansu Province, China. The average (2003–2018) minimum and maximum air temperatures at the study site were −22 °C and 38 °C in January and July, respectively, while the average precipitation at the study site was 390.7 mm yr−1. The average annual cumulative air temperature > 10 °C was 2240 °C and the average annual radiation was 5930 MJ m−2, with 2480 h of sunshine per year. The annual average evaporation was 1531 mm (coefficient of variation: 24.3%), which is three to four times greater than precipitation. The soil type at the site is a Huangmian sandy loam [33] and is classified as a Calcaric Cambisol [34].
Before 2003, the field had a long history of traditional farming, and the previous crop was flax (Linum usitatissimum L.). The soil properties in the 0–30 cm depth were 0.77 g kg−1 total nitrogen (TN), 5.43 mg kg−1 NH4-N, 27.63 mg kg−1 NO3-N, 8.33 pH, 1.87 g kg−1 total phosphorus (P), 10.03 mg kg−1 available P, and 18.47 g kg−1 total potassium (K).

2.2. Experimental Design and Treatments

The experiment was set up as a randomized complete block design with three replications of each treatment. The treatments included five rates of N application: 0 (N0), 52.5 (N52.5), 105 (N105), 157.5 (N157.5), and 210 (N210) kg N ha−1. The N fertilizer was urea. Furthermore, 105 kg P2O5 ha−1 (calcium superphosphate) was applied. All the fertilizers were broadcasted evenly over the entire plot area before sowing and then incorporated into the 0–20 cm soil layer using rotary tillage. Since the K concentration in the 20–60 cm soil layers on the Loess Plateau in China (average available K = 274.2 mg kg−1) was sufficient to promote crop growth [14,35], potassium was not applied.
Each year, spring wheat (cultivar Dingxi 38) was planted in mid-March at a rate of 187.5 kg seeds ha−1 in rows spaced 20 cm apart and was harvested in late July to early August of the same year. Each plot was measured 30 m2 (3 × 10 m). Weeds were removed by hand during the growing season, and Roundup® (glyphosate, 10%) was used to control weeds during the fallow periods according to the manufacturer’s instructions. Pests and diseases were monitored and controlled according to the conventional practices in the area.

2.3. Data Collection

2.3.1. Soil Sampling

Soil samples were collected at flowering on 30 June 2018, 98 days after wheat was sown. An auger (3.4 cm diameter) was used to take five samples from 0 to 20 cm soil layer of each plot to provide a composite sample. The samples were homogenized and passed through a 2-mm sieve to remove rocks and surface debris, divided into two subsamples. One subsample was stored immediately at −80 °C for DNA extraction, and the other was air-dried for soil physicochemical analysis.

2.3.2. Soil Chemical Analyses

Soil moisture (SM) was measured using the drying method [36]. Soil pH was measured using a glass combination electrode in a suspension of soil and water at a ratio of 1:2.5 (mass: volume) [37]. Soil total P and available P were determined by the standard molybdenum antimony colorimetric method [38]. Soil total nitrogen (TN) and crop nitrogen concentration were determined by the standard Semimicro–Kjeldahl method [38]. Soil nitrate-N (NO3-N) and ammonium-N (NH4-N) were extracted using 2 mol L−1 KCl and determined spectrophotometrically using a Discrete Auto Analyzer (Smartchem 450, Beijing, China) [39].
The amount of residual soil NO3-N (RSN, kg N hm−2) in each soil layer was calculated as follows [40]:
RSN = Ti × Di × Ci/10
where Ti is soil layer thickness (20 cm), Di is soil bulk density (g cm−3), Ci is soil NO3-N concentration (mg N kg−1) of the corresponding layer, and 10 is the conversion coefficient.

2.3.3. Soil DNA Extraction and Amplification

Genomic DNA was extracted from soil samples using the DNeasy PowerSoil Kit No. 12888-100 (Qiagen, Hilden, Germany) following the manufacturer’s instructions. Quality and quantity of DNA was verified with NanoDrop and agarose gel. Extracted DNA was diluted for PCR amplification of bacterial 16S rRNA genes with barcode primers and Takara Ex Taq (Takara, Japan). For bacterial diversity analysis, V3-V4 variable regions of 16S rRNA genes were amplified with universal primers 338F- 5′-ACTCCTACGGGAGGCAGCA-3′ and 806R- 5′-GGACTACNNGGGTNTCTAAT-3′ to identify bacterial genes.

2.3.4. DNA Sequencing

The 16S rRNA (V3-V4) hypervariable region of the bacteria was sequenced using the Illumina Miseq® PE300 (Illumina Inc., San Diego, CA) sequencing platform to obtain paired-ends reads. Trimmomatic software [41] was used to preprocess the paired end reads to detect and cut off ambiguous bases. After cutting off low-quality sequences with an average quality score below 20 using the sliding window trimming approach, paired-end reads were assembled using FLASH software [41]. The split libraries in QIIME software [42] was used to remove the sequence with a single base repeat greater than six and with a length of less than 200 bp to obtain a clean tags sequence. UCHIME [43] software was used to remove the chimeras in the clean tags, and obtain valid tags for subsequent partitioning of operational taxonomic units (OTUs). Clean reads were subjected to primer sequences removal and clustering to generate OTUs using Vsearch software [44] with 97% similarity cutoff. The representative read of each OTU was selected using QIIME software. All representative reads were annotated and blasted against Silva database Version 123 (16s rDNA) using the RDP classifier with a 70% confidence threshold [45].
Alpha and beta diversity analyses were used to reflect the diversity of species within the habitat and the degree of diversity among species. Bacterial diversity and richness were estimated using Chao1, Shannon, PD_whole_tree (Phylogenetic Diversity index), Goods, and inverse Simpson indices. Molecular analysis, sequencing reactions, and sequence analysis were conducted by a commercial laboratory (Shanghai OE Biotech Co., Ltd., Shanghai, China).

2.3.5. Plant Sampling and Analysis

At tillering, flowering, and maturity stages, wheat plants were harvested from 1 m2 (1 m × 1 m) area of each plot. Plants were separated into leaves, stems, sheaths, spikes, and grains, and were chopped and dried at 70 °C until constant weight. Each plant part was ground separately for N analysis.
Leaf area index: Leaf area of wheat at the flowering stage was measured using a handheld leaf area meter (AM300, ADC BioScientific Ltd., Herts, UK). Leaf area index (LAI) was calculated using the formula [46]:
LAI = Total leaf area of one plant (m2 plant−1) × plant density (plants m−2)
Grain yield: At maturity, spring wheat were manually harvested from all plots (except 0.5 m from borders) using sickles at 5 cm above the ground. Grain yield was determined after natural drying and threshing grains.
Nitrogen use efficiency (NUE) of wheat was calculated as follows [14]:
NUE   ( % ) = 100   ×   Plant   N   uptake NO 3 N   at   sowing   +   fertilizer   N
where plant N uptake was expressed as kg N ha−1, NO3-N at sowing was expressed as kg NO3-N in the 0–20 cm soil layer, and fertilizer N was expressed as kg N ha−1. In this calculation, NH4-N at sowing was not included, as the amount of NH4-N was small (7.39–9.01 kg NH4-N in the 0–20 cm soil layer) and thus considered negligible. Nitrogen mineralized from soil organic matter during the growing season was not included in this calculation according to the study of Li et al. [14].

2.4. Data Analysis

Data were analyzed using SPSS 19.0 software (IBM Corp., Chicago, IL, USA) at p < 0.05. One-way analysis of variance was used to assess the significance of the fixed effect of N fertilizer treatment for all dependent variables. Pearson’s correlation coefficient was used to assess correlations of soil properties, LAI, and grain yield of wheat with soil bacterial alpha diversity indices and abundant soil bacterial phyla, classes, and orders. Redundant analysis (RDA) was performed using CANOCO 5.0 software to assess correlations between the soil bacterial community and soil chemical properties.

3. Results

3.1. Effects of Long-Term N Fertilization on Soil Chemical Properties

After 16 years of fertilization, different application rates of N fertilization altered the physicochemical properties of the soils (Table 1). By increasing the N fertilization rate, the soil pH values decreased from 8.09 to 7.83, but significant differences were found only between the non-N-fertilizer control (N0) or lower N-fertilizer treatment (N52.5) and the higher N-fertilizer treatments (N157.5 and N210). In addition, the soil the available N (NH4-N and NO3-N), especially the soil NO3-N, were increased significantly by increasing annual N fertilizer application rate, while only the N application rate of 105 kg N ha−1 (N105 treatment) significantly increased the soil available phosphorus (AP) compared to the non-N-fertilizer control (N0). However, there were no significant differences in soil total phosphorus (TP), total phosphorus (TN), and soil moisture (SM).

3.2. Effects of Long-Term N Fertilization on LAI, Grain Yield and NUE of Wheat

The annual application of different N fertilizer rates had significantly influenced LAI, N uptake, grain yield, and nitrogen use efficiency (NUE) of wheat (Table 2). Leaf area index of wheat at the flowering stage was increased with increasing N rate. Compared with N0, the application of N fertilizer significantly increased the N uptake in different parts of wheat including aboveground biomass, leaves, stems and sheaths, spikes, straw, and grains. However, the increase in total N uptake was not significant when N rate was above 105 kg ha−1. Grain yield of wheat was increased with increasing N fertilizer application up to N105 and no significant increase in yield was observed by further increasing the N rate, and similar results were basically maintained for many years (except for the first two years of the trial). The grain yield at N105 was 44% higher compared with N0. The NUE showed a decreasing trend by increasing N rate. The NUE was highest (28%) at N105 while the lowest (17%) at N210.

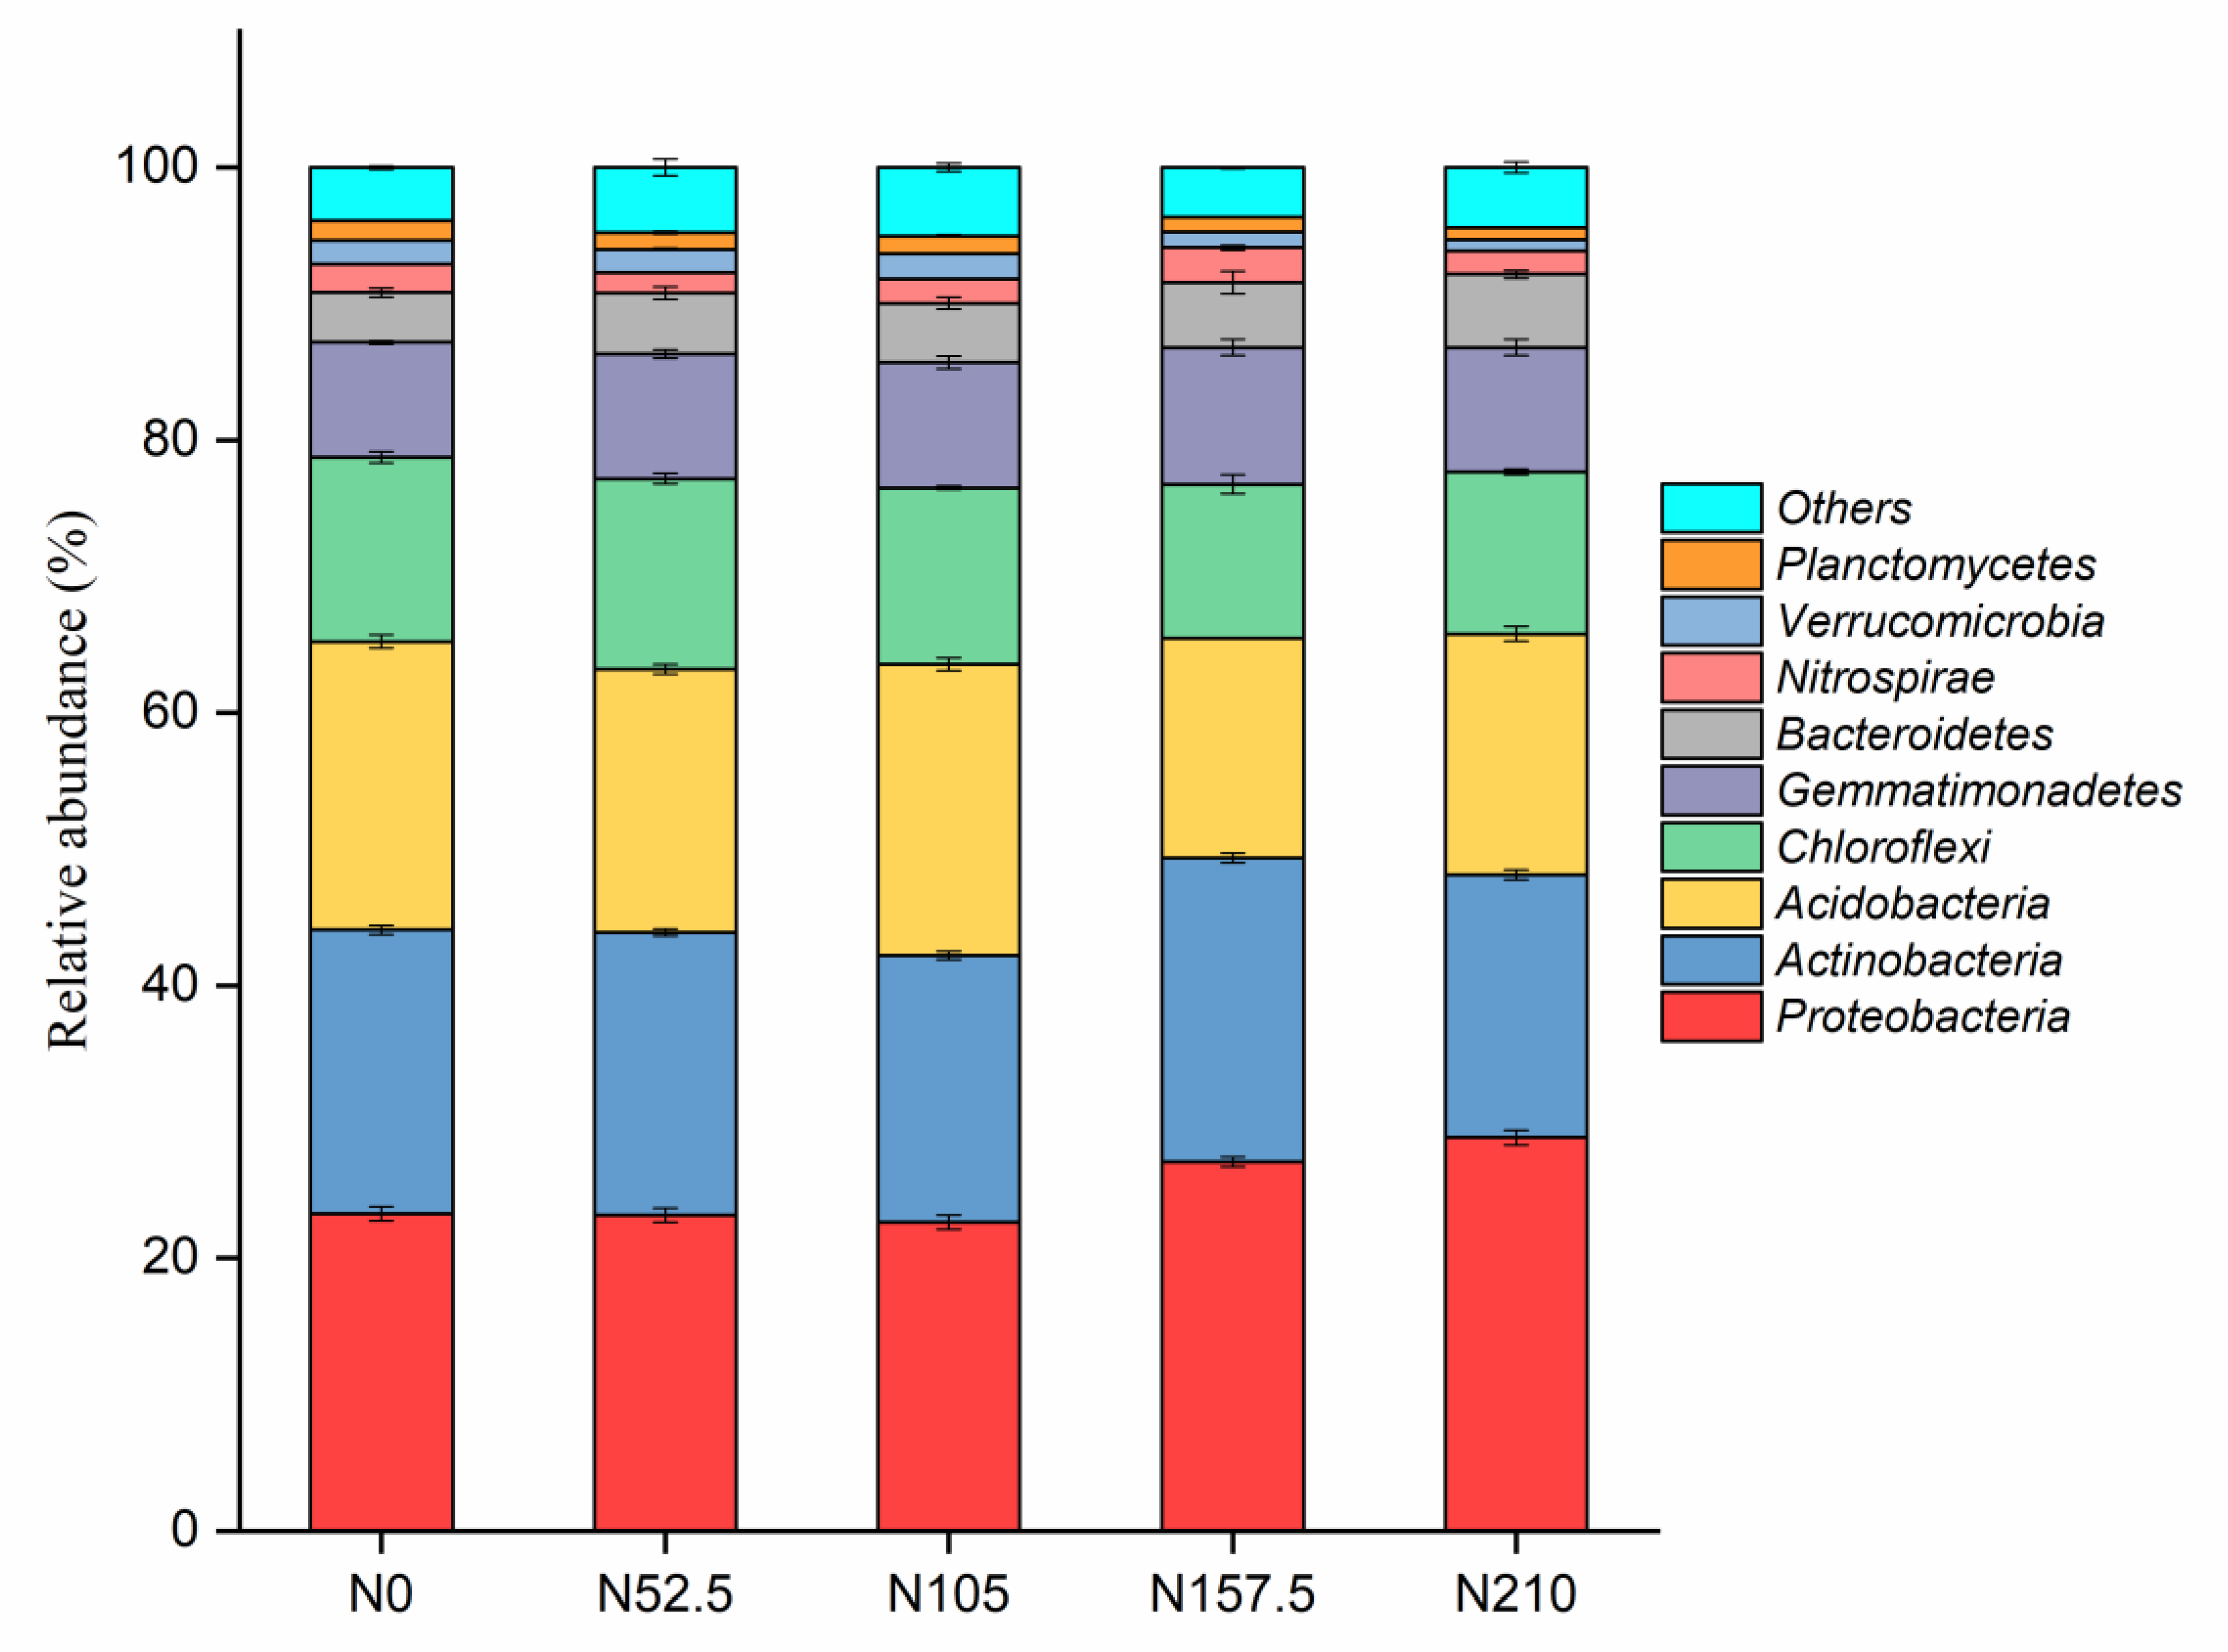
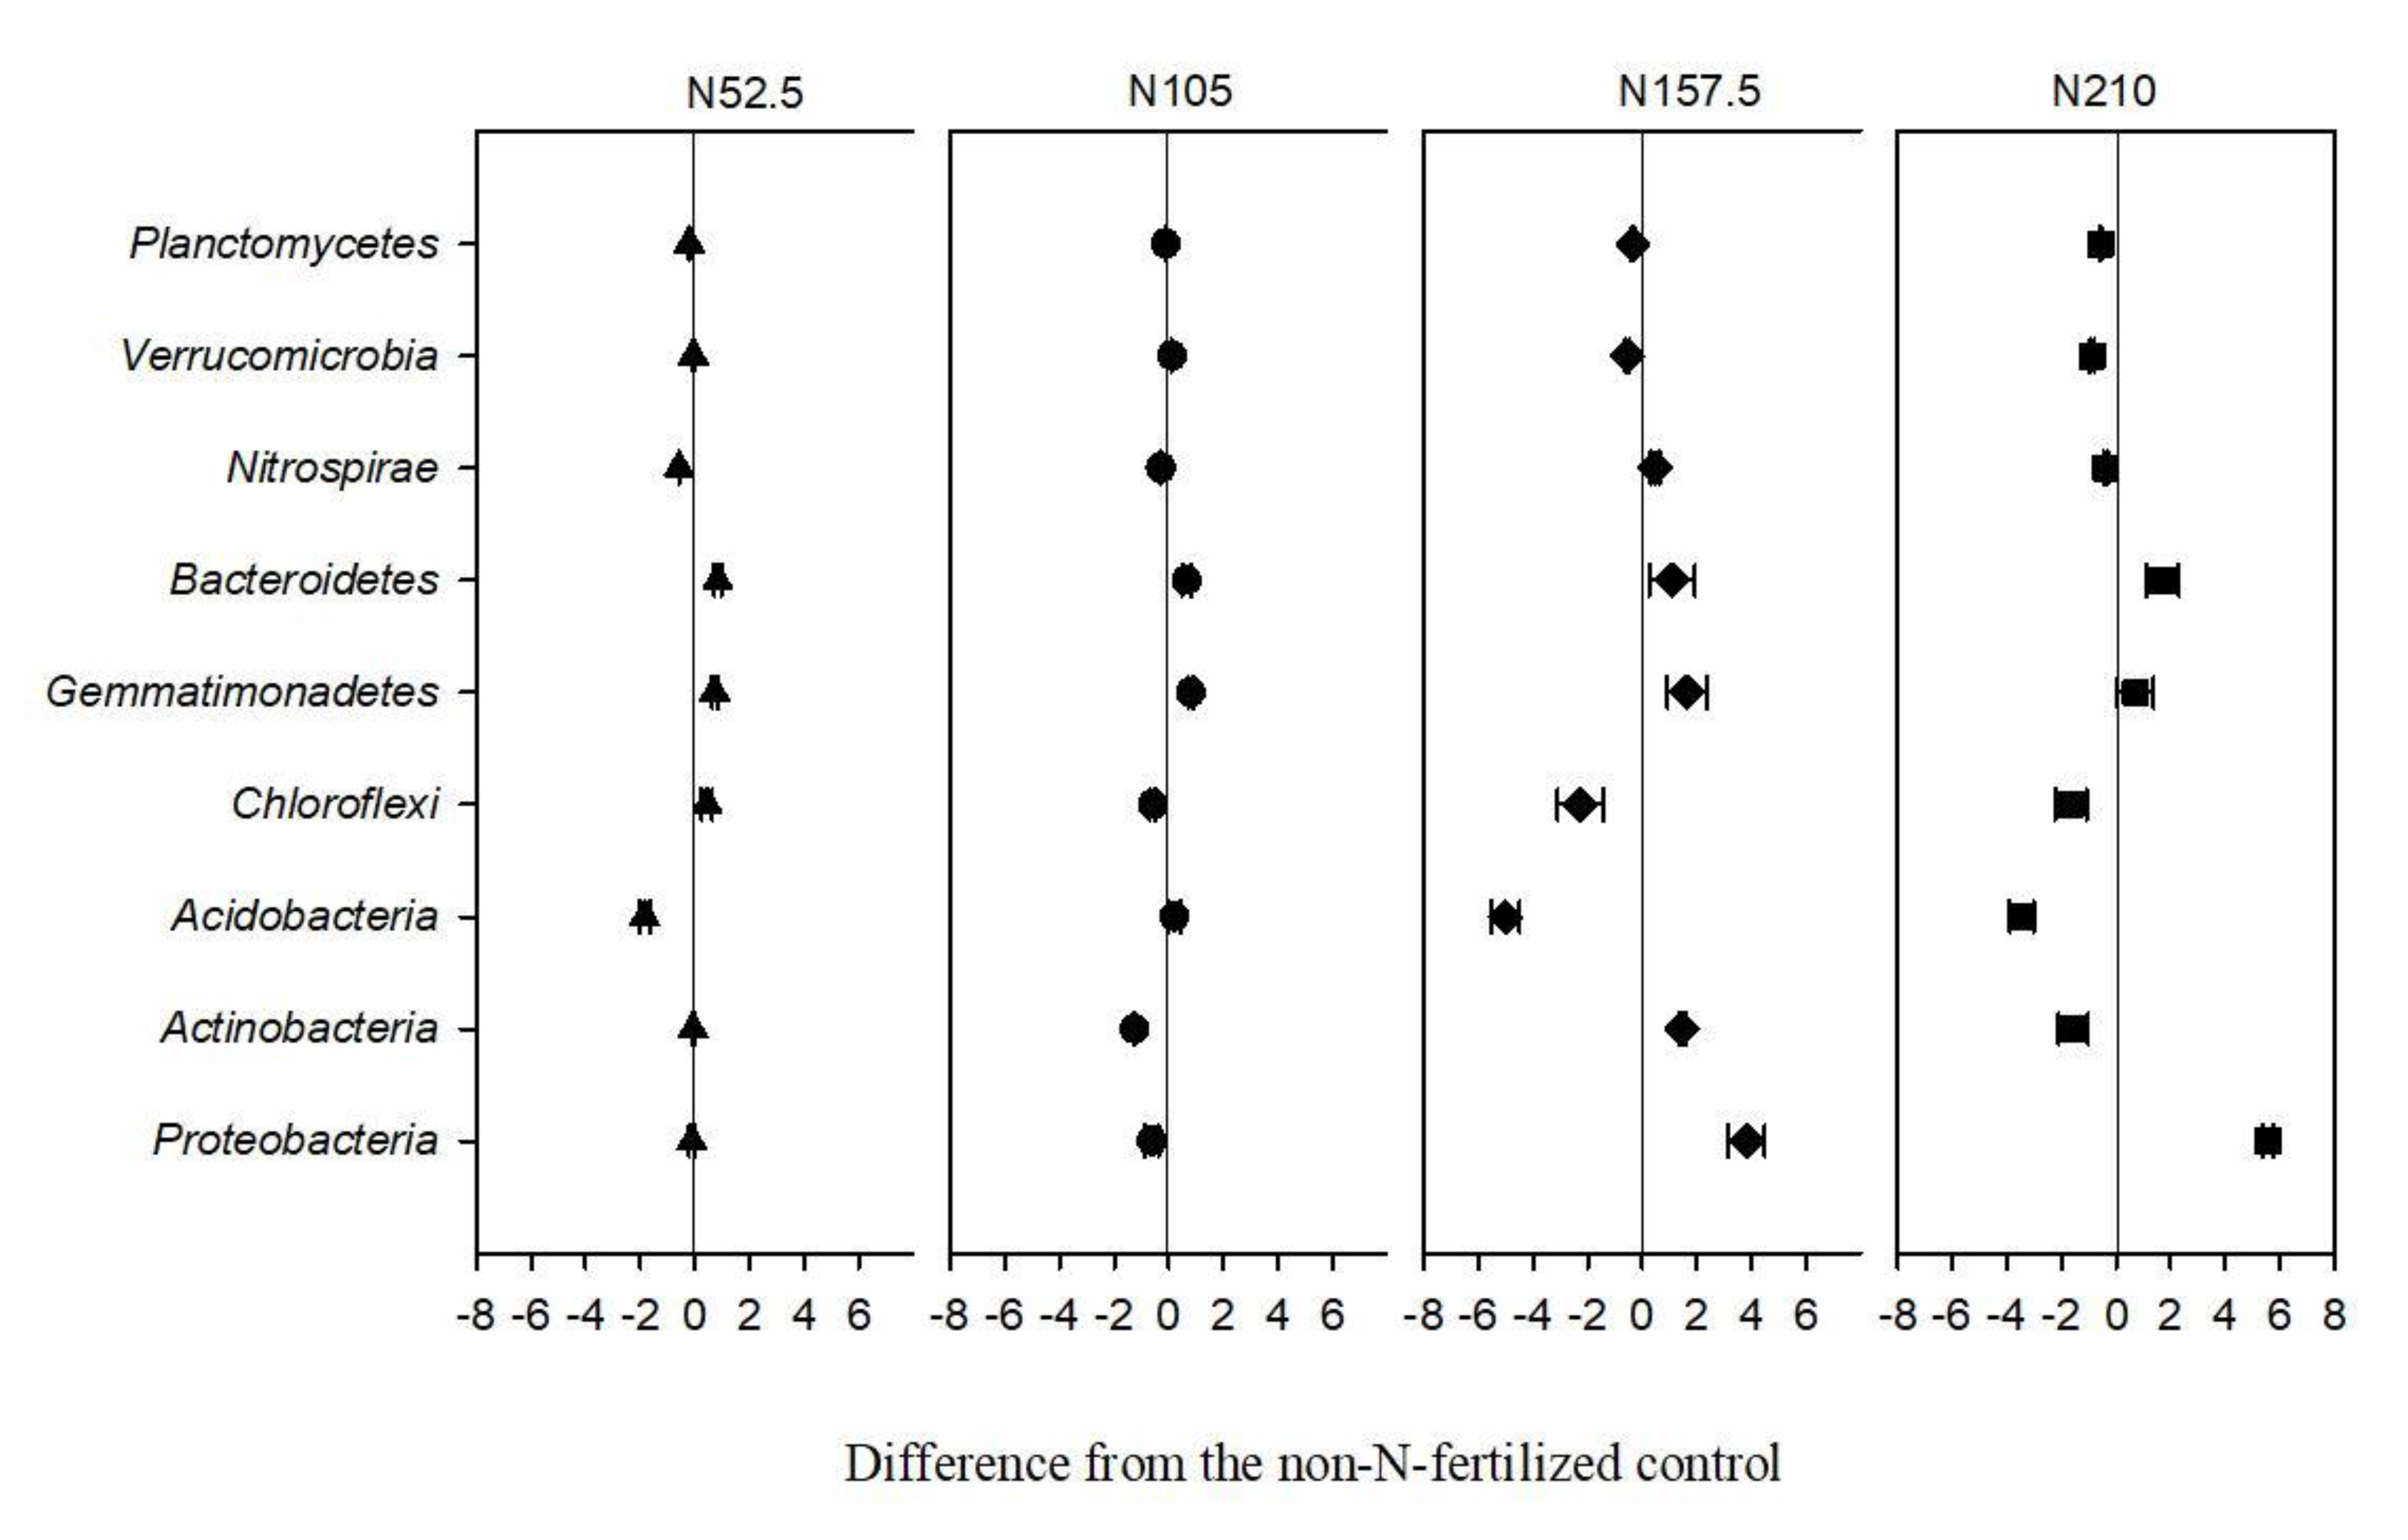
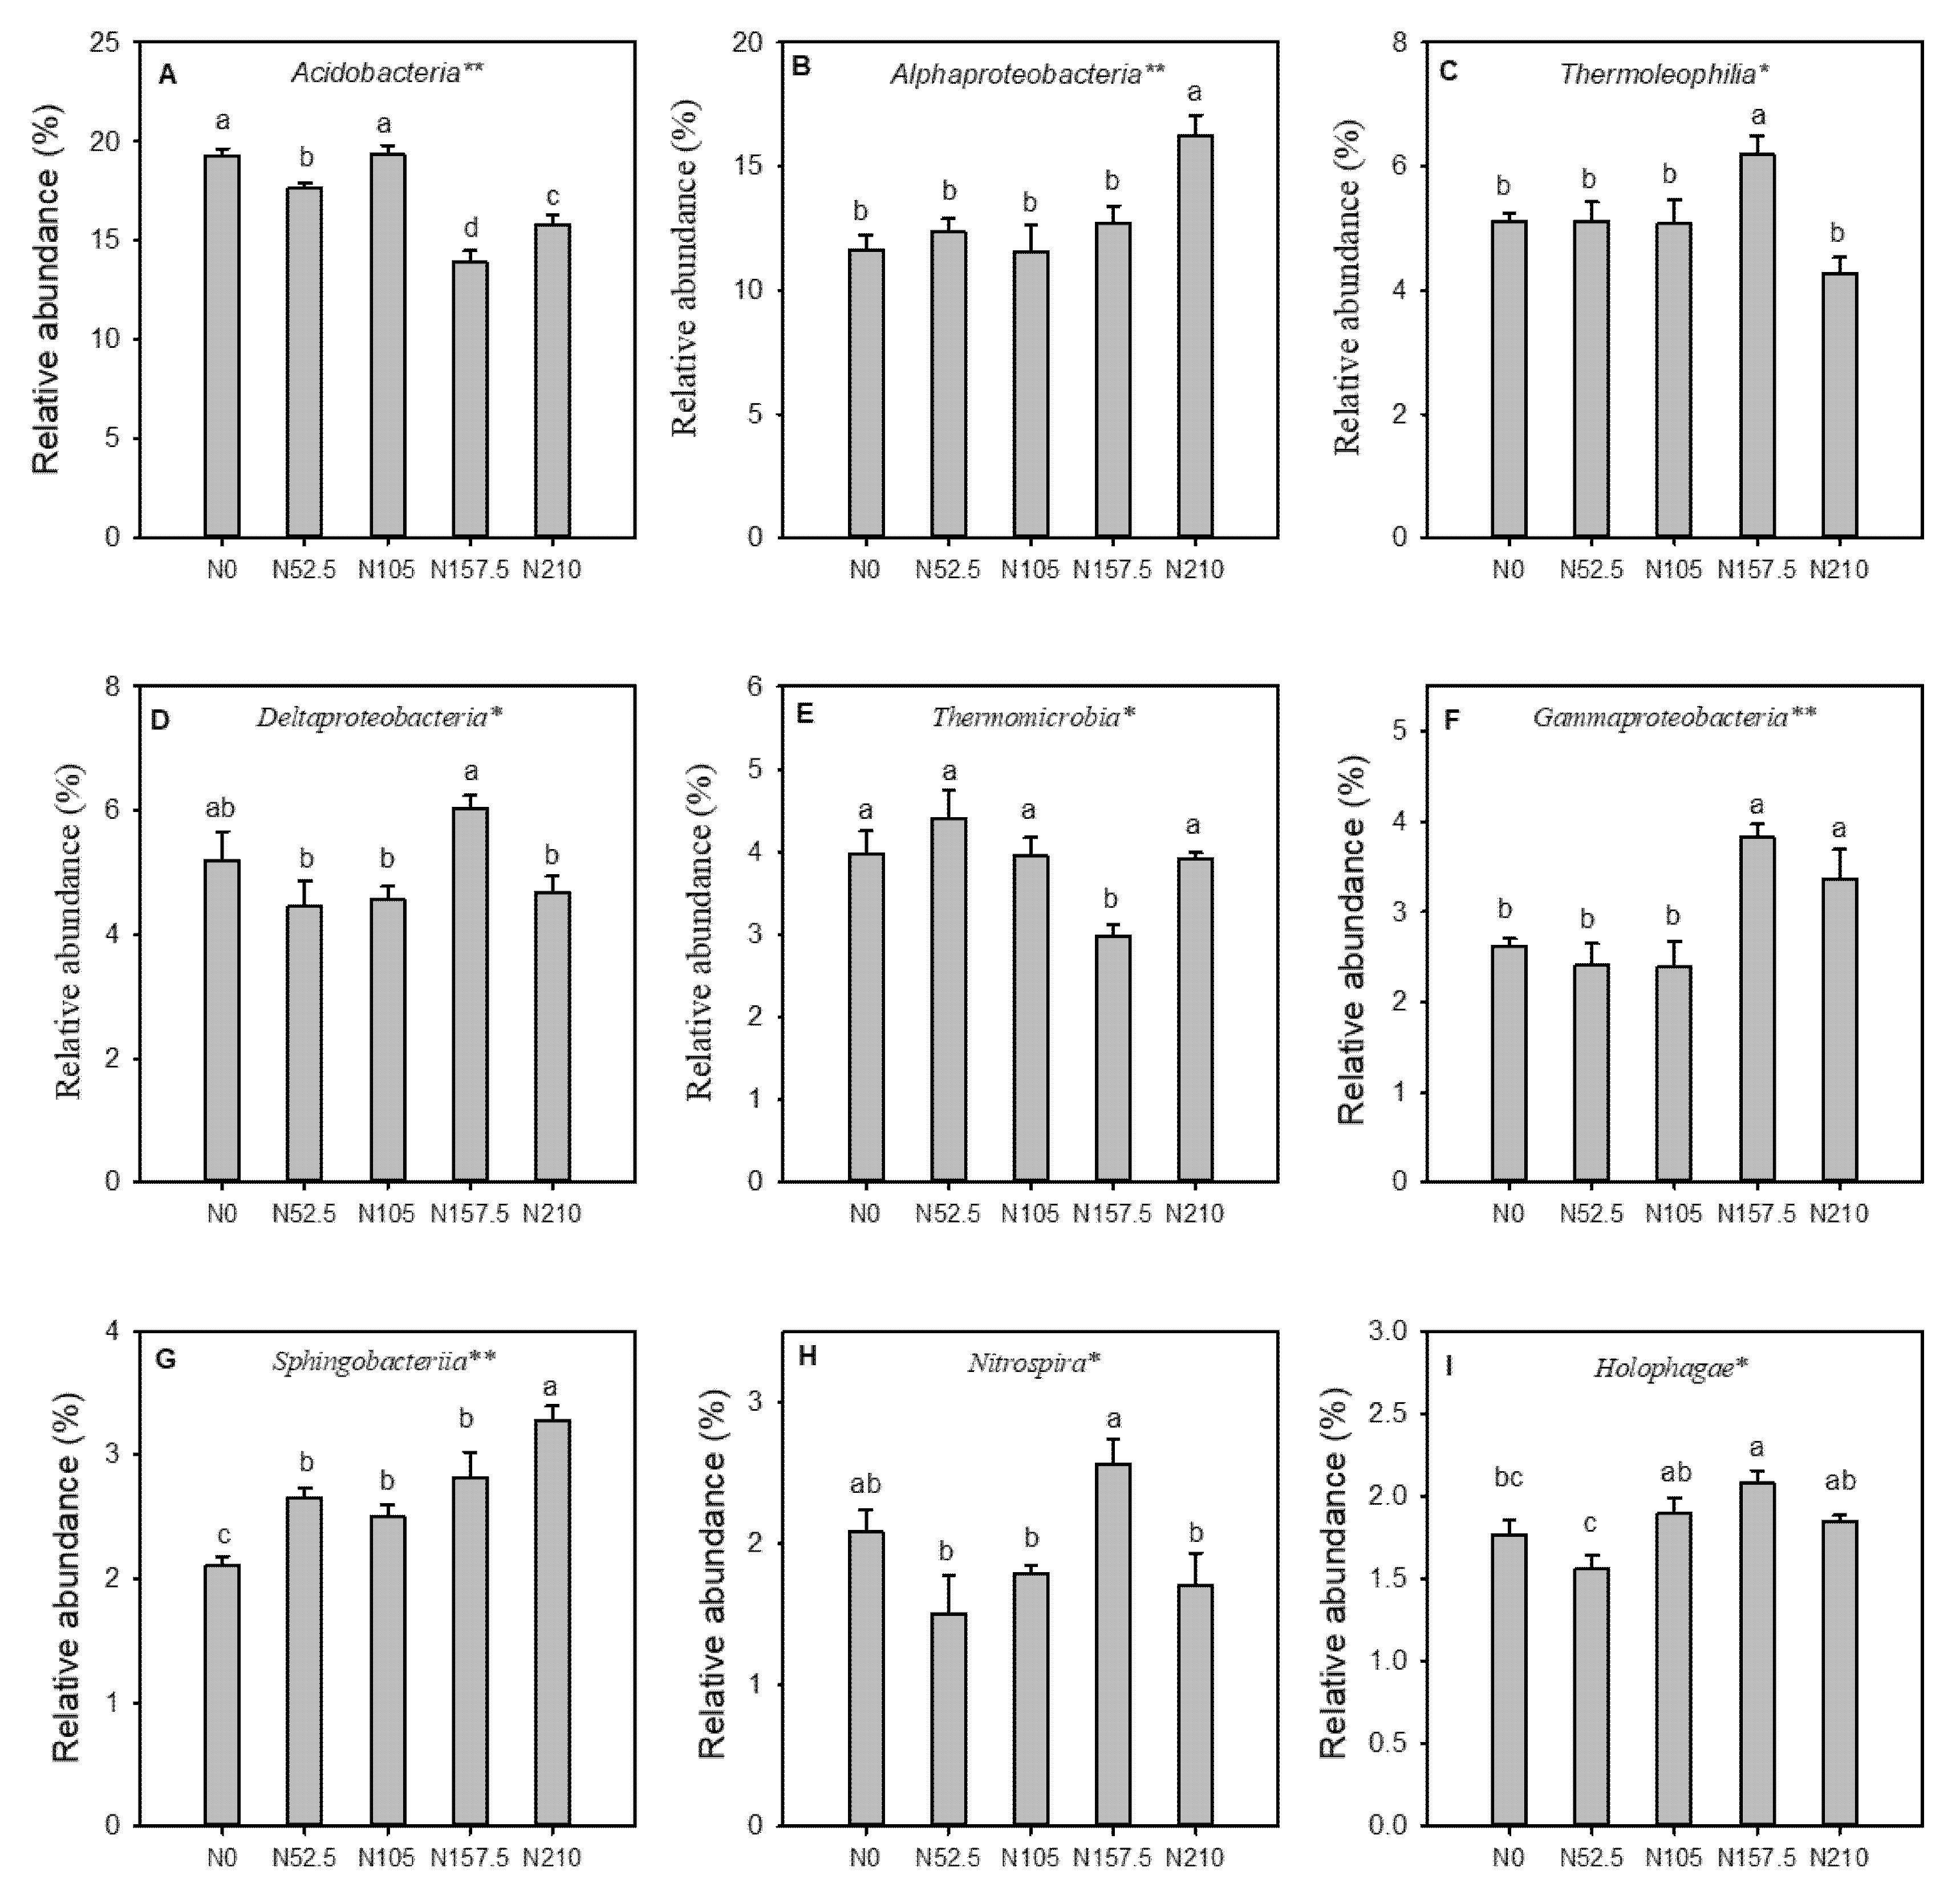
3.3. Effects of Long-Term N Fertilization on Soil Bacterial Diversity and Community Composition

The bacterial community analysis of the 15 soil samples, 28,900–39,145 valid tags for analysis were obtained by removing the clean tags chimera. The chimera-free reads were obtained by MiSeq® sequencing of 16S rRNA genes, and the average length of valid tags ranged from 437.89–440.21 bp. Based on Mothur clustering, the number of OTUs in each soil sample ranged from 2701–3355. Both sequencing and quantitative real-time PCR data showed that the relative abundance of bacteria was more than 97% in the soil. The PD whole tree (phylogenetic diversity index), Chao1, and observed species bacterial diversity indices, and OTU values for species richness were greatest at N105 while lowest at N210, whereas the Simpson’s diversity index was greatest in the soil of the N0 treatment and lowest in the soil of the N210 treatment (Table 3). Shannon’s diversity index and Goods coverage were not significantly affected by the N fertilizer rate.
The relative abundance of different phyla in the 15 samples are shown in Figure 1. The phyla Proteobacteria, Actinobacteria, and Acidobacteria occupied 63–66% of the bacterial sequences obtained from the N-fertilized soils and were followed by Chloroflexi (11–14%), Gemmatimonadetes (8–10%), Bacteroidetes (4–5%), and Nitrospirae (1–3%). The phyla Proteobacteria occupied the highest proportion (23–29%) of the bacterial sequences in all soil samples. Different N fertilization treatments significantly changed the relative abundance of the main phyla (>1%). The relative abundance of the phyla Proteobacteria, Gemmatimonadetes, and Bacteroidetes were increased when N fertilizer was applied, while the phyla Acidobacteria, Chloroflexi, Verrucomicrobia, and Planctomycetes were reduced with N fertilization. Compared with the N0 treatment, the phyla Bacteroidetes and Gemmatimonadetes showed a positive response to N fertilizer, while the phyla Nitrospirae showed a negative response (Figure 2).
The significant differences were observed among treatments for the relative abundance of nine most abundant classes of bacteria (Figure 3A–I). Compared to the N0 treatment, the relative abundance of class Alphaproteobacteria, Sphingobacteria and Holophages were significantly higher under N210 treatment. The relative abundance of the class Acidobacteria was significantly lower under N52.5, N157.5, and N210 treatments compared to the N0 (Figure 3A). Furthermore, the relative abundance of classes Thermoleophilia, Gammaproteobacteria, Holophagae, Sphingobacteriia, and Holophagia were significantly higher in soil of the N157.5 treatment compared to the N0 treatment. The relative abundance of the classes Alphaproteobacteria and Sphingobacteriia were highest under N210 treatment

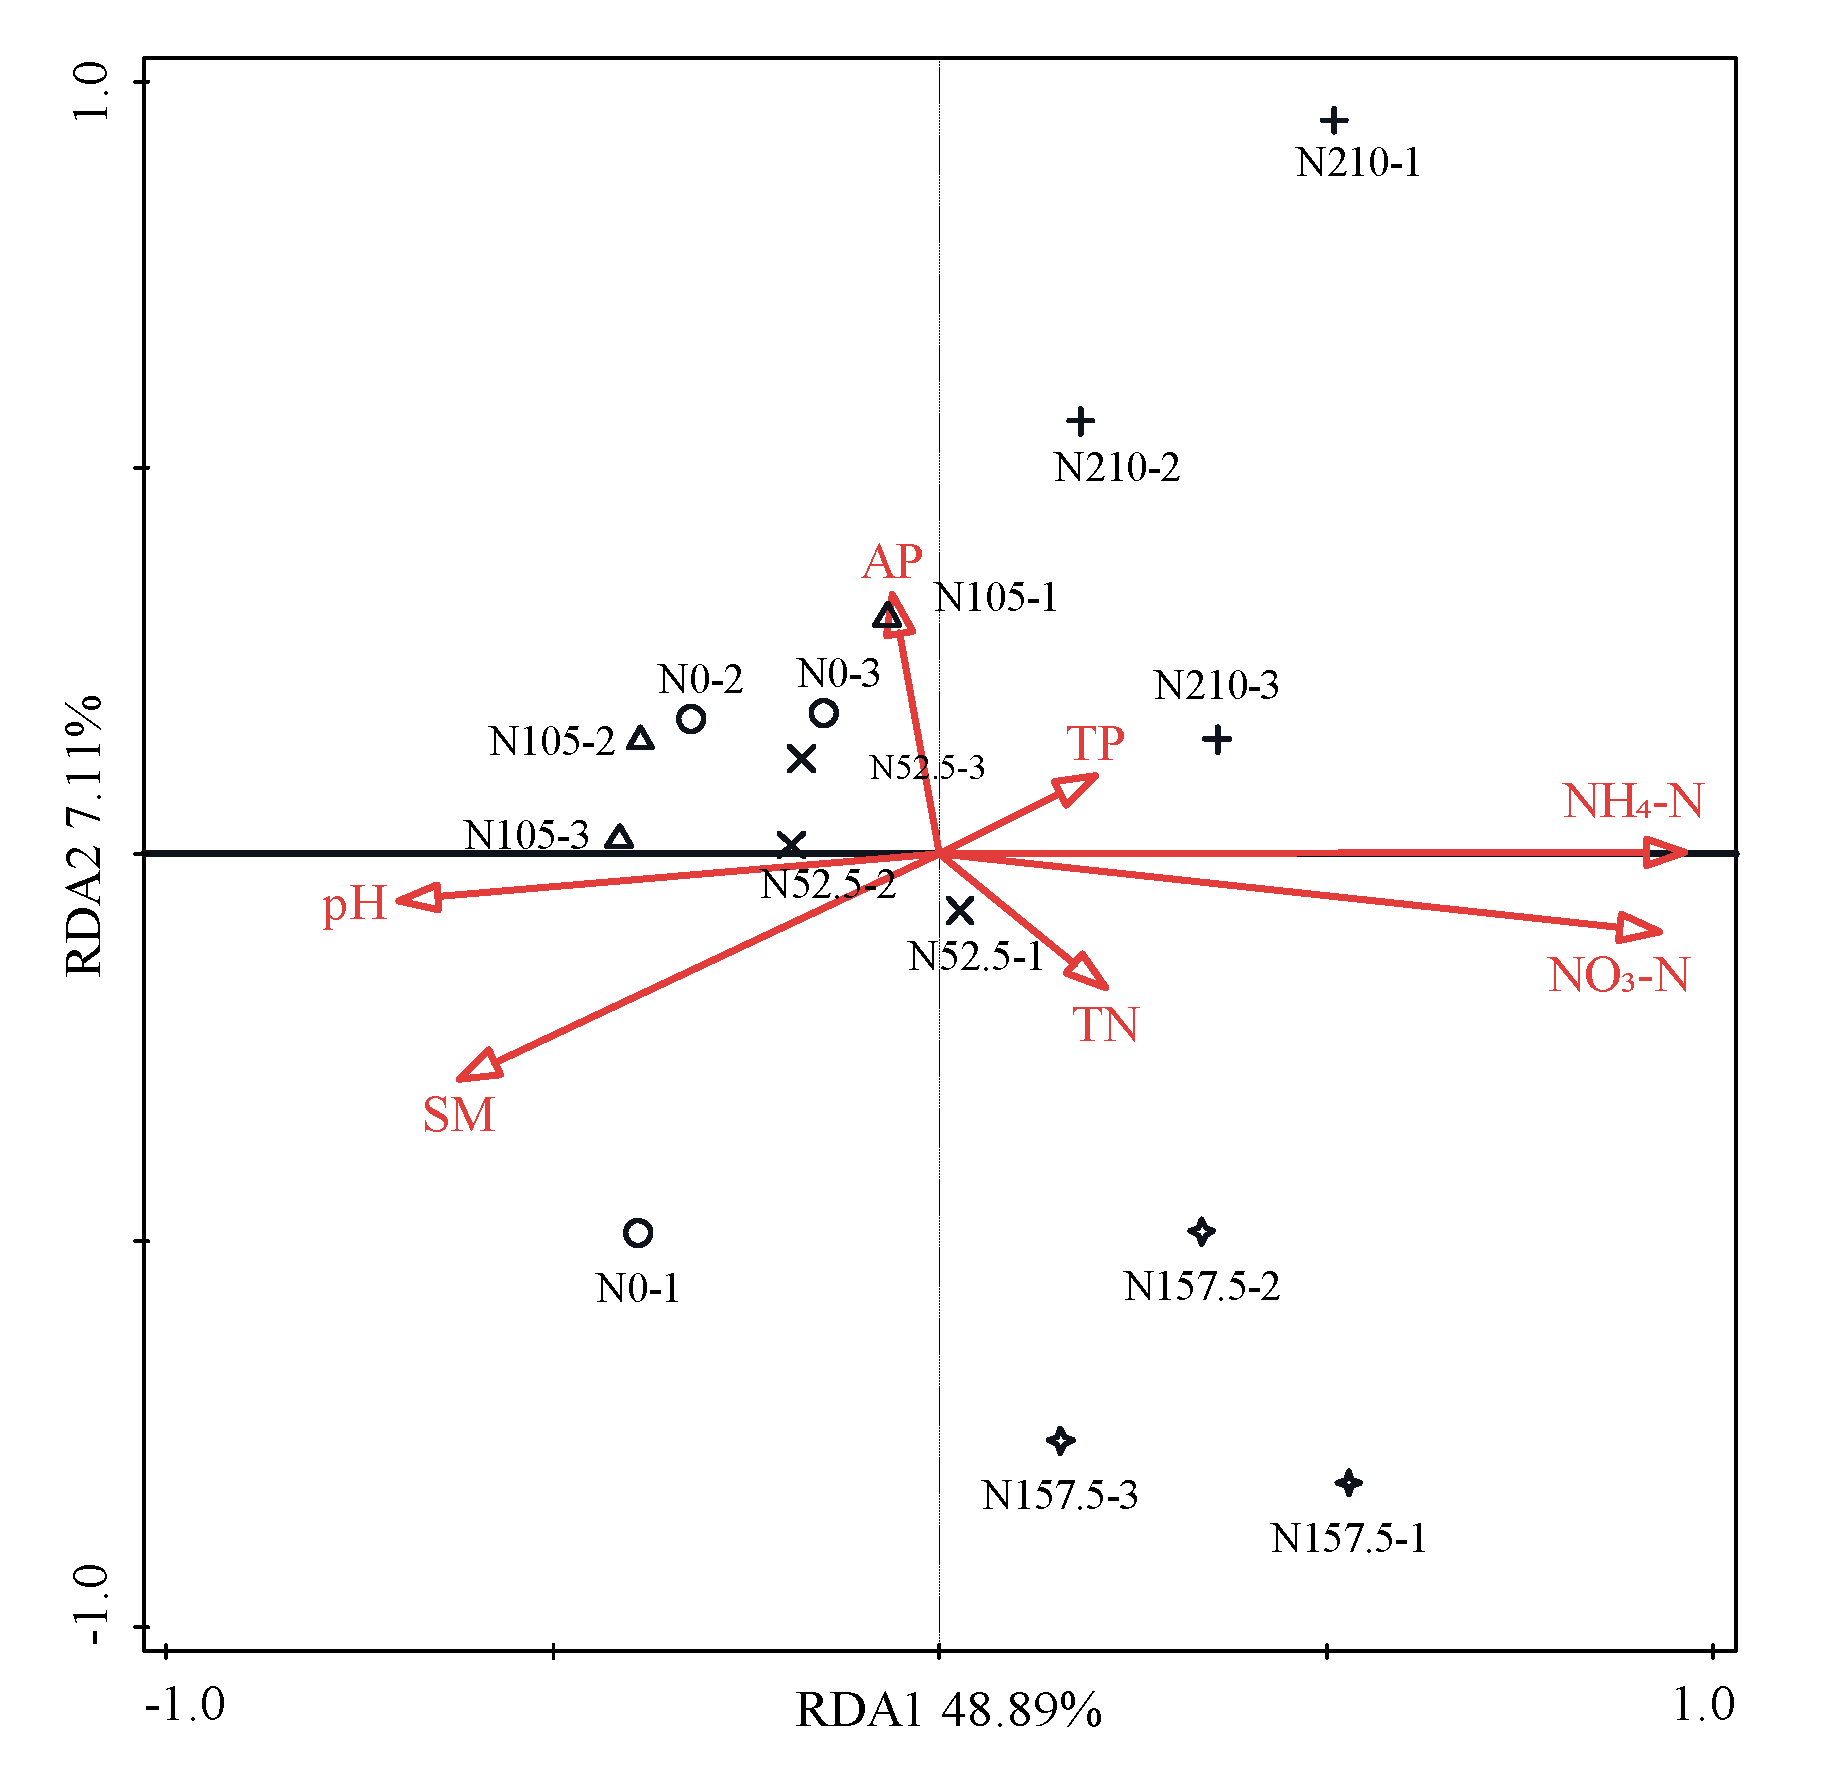
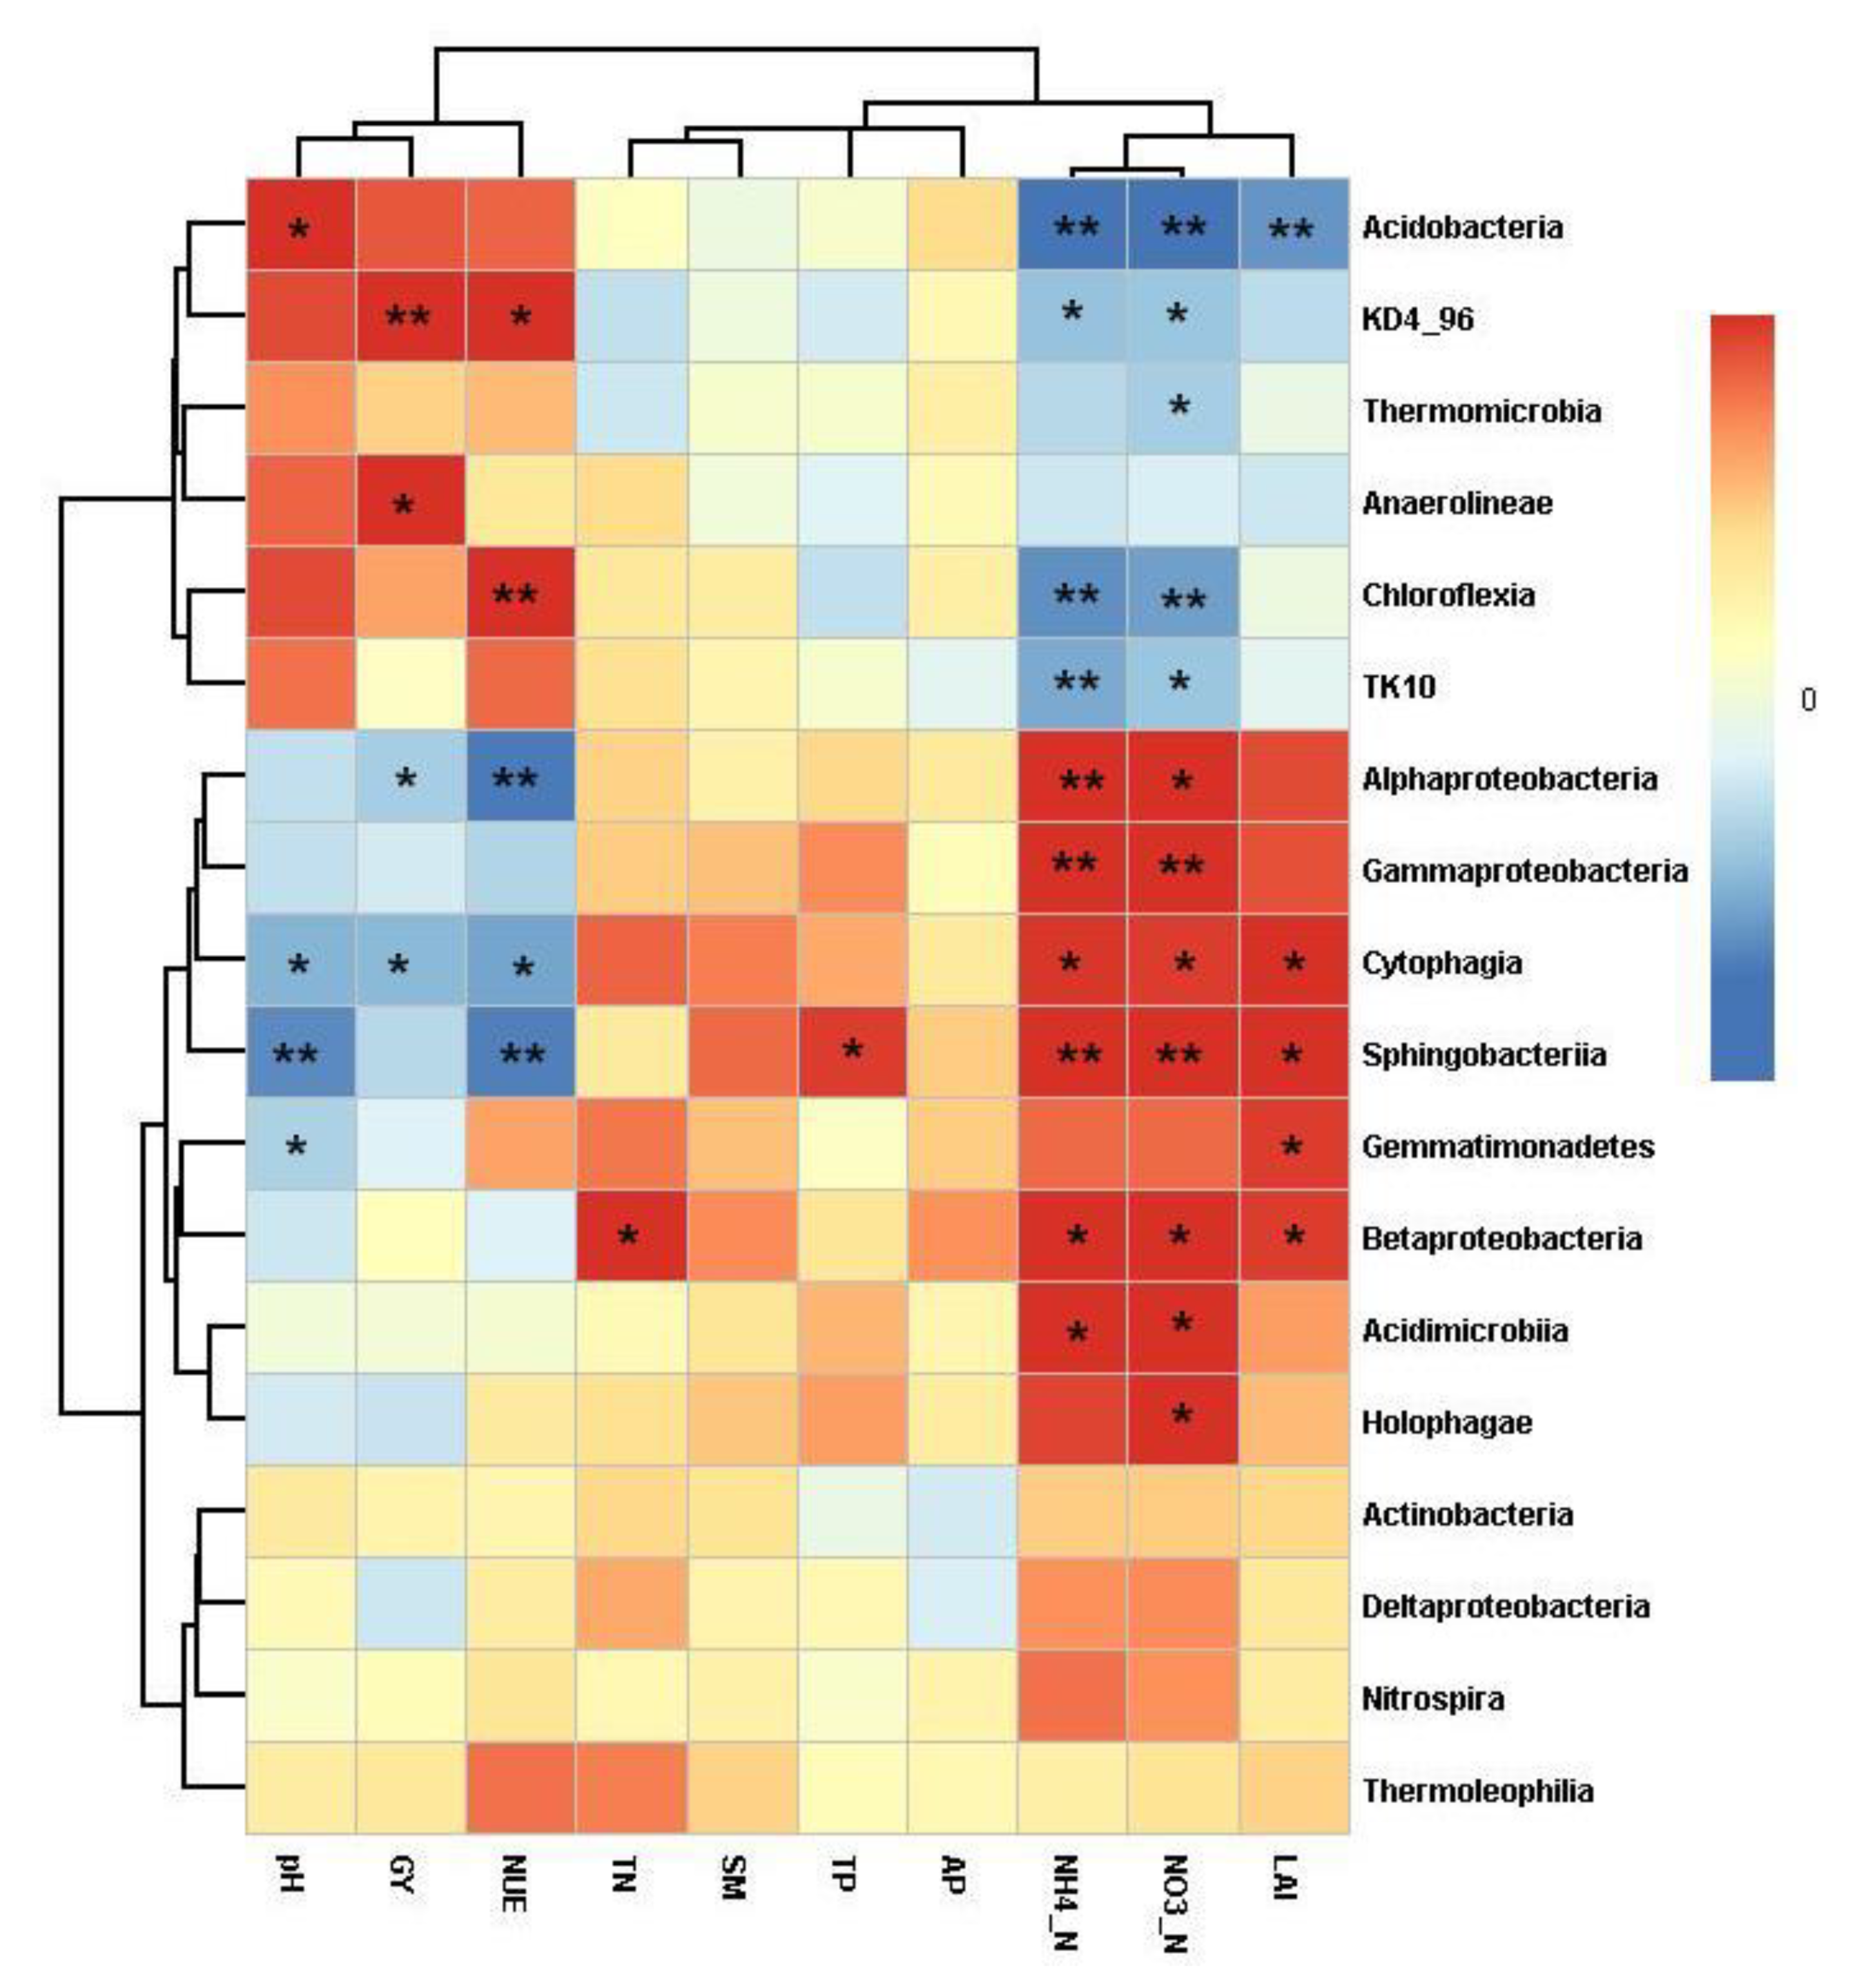
3.4. Relationships of Soil Bacteria with Soil Chemical Properties, Grain Yield, and NUE

Pearson’s correlation coefficient in Table 4 showed that the values of PD whole tree, Chao1, and Shannon’s indices were negatively correlated with soil NH4 concentration (r = −0.585, −0.582, and −0.571, respectively), and the Chao1 index was significantly and negatively correlated with soil NO3 (r = −0.527). The values of PD whole tree and Simpson’s index were significantly and negatively correlated with LAI of wheat (r = −0.522 and −0.524, respectively). Simpson’s index was positively correlated with soil pH (r = 0.539), while OTUs were significantly and positively correlated with grain yield (r = 0.555) and NUE (r = 0.698). Bacteria diversity had no relationship with total N, total P, available P, soil moisture, and N uptake in different parts of wheat (data not provided).
The correlations between the community structures of bacterial phyla and the soil chemical properties were analyzed using the distance-based redundancy analysis (RDA) (Figure 4). Based on this model, a total of 56% of the total variation in the bacterial community was explained by the first two constrained axes of the RDA. The first and second axes explained 48.9% and 7.1% of the total variation of bacterial phyla community structure, respectively. The soil NH4 concentration (F = 10.9, p = 0.002) was the influential soil factors in structuring the bacterial community, with a variation of 46% and a contribution of 72%, respectively. All variables of soil chemical properties together explained 64% of the variation in the soil bacterial community across the samples.
The correlation heatmap was conducted to determine the correlation between the relative abundance of bacterial phyla and the soil properties and leaf area index, grain yield and NUE of wheat (Figure 5). The soil pH was positively correlated with the phyla Acidobacteria abundance (r = 0.643, p = 0.010), Chloroflexi abundance (r = 0.607, p = 0.016), Verrucomicrobia abundance (r = 0.595, p = 0.019), and Planctomycetes abundance (r = 0.616, p = 0.015), but negatively correlated with the phyla Proteobacteria (r = −0.542, p = 0.037), Gemmatimonadetes (r = −0.545, p = 0.036), and Bacteroidetes abundance (r = −0.615, p = 0.015). Soil moisture was positively correlated with the phyla Acidobacteria abundance (r = 0.519, p = 0.047) and Planctomycetes abundance (r = 0.614, p = 0.015), but negatively correlated with the phyla Proteobacteria abundance (r = −0.569, p = 0.027). Soil NH4 was positively correlated with the phyla Proteobacteria abundance (r = 0.883, p < 0.001) and Bacteroidetes abundance (r = 0.532, p = 0.041), but negatively correlated with the phyla Acidobacteria abundance (r = −0.840, p < 0.001), Chloroflexi abundance (r = −0.850, p < 0.001), Verrucomicrobia abundance (r = −0.935, p < 0.001), and Planctomycetes abundance (r = −0.779, p = 0.001). Soil NO3 was positively correlated with the phyla Proteobacteria abundance (r = 0.892, p < 0.001) and Bacteroidetes abundance (r = 0.515, p = 0.050), but negatively correlated with the phyla Acidobacteria abundance (r = −0.814, p < 0.001), Chloroflexi abundance (r = −0.819, p < 0.001), Verrucomicrobia abundance (r = −0.885, p < 0.001), and Planctomycetes abundance (r = −0.811, p < 0.001). The leaf area index during the flowering period of wheat was positively correlated with the phyla Proteobacteria abundance (r = 0.567, p = 0.028), Gemmatimonadetes abundance (r = 0.606, p = 0.017), and Bacteroidetes abundance (r = 0.550, p = 0.034), but negatively correlated with the phyla Acidobacteria abundance (r = −0.751, p = 0.001), Chloroflexi abundance (r = −0.540, p = 0.038), Verrucomicrobia abundance (r = −0.644, p = 0.010), and Planctomycetes abundance (r = −0.752, p = 0.001). The NUE was positively correlated with the phyla Verrucomicrobia abundance (r = 0.673, p = 0.016) and Planctomycetes abundance (r = 0.790, p = 0.002), but negatively correlated with the phyla Proteobacteria abundance (r = −0.754, p = 0.005) and Bacteroidetes abundance (r = −0.631, p = 0.028). However, there was no correlation between soil TN, AP, TP, and grain yield of wheat and bacterial phyla abundance.
The correlation heatmap was also conducted to determine the correlation between the relative abundance of bacterial classes and the soil properties and leaf area index, grain yield and NUE of wheat (Figure 6). The soil pH was positively correlated with the class Acidobacteria abundance (r = 0.625, p = 0.013), but negatively correlated with the class Gemmatimonadetes (r = −0.522, p = 0.046), Sphingobacteriia (r = −0.773, p = 0.001), and Cytophagia abundance (r = −0.639, p = 0.010). The soil SM was positively correlated with the class Anaerolineae abundance (r = 0.591, p = 0.020) and KD4_96 abundance (r = 0.677, p = 0.006), but negatively correlated with the class Alphaproteobacteria abundance (r = −0.544, p = 0.036) and Cytophagia abundance (r = −0.618, p = 0.014). The soil NH4 was positively correlated with the class Alphaproteobacteria abundance (r = 0.677, p = 0.006), Betaproteobacteria abundance (r = −0.560, p = 0.030), Gammaproteobacteria abundance (r = −0.787, p < 0.001), Sphingobacteriia abundance (r = −0.778, p = 0.001), Acidimicrobiia abundance (r = 0.592, p = 0.020), and Cytophagia abundance (r = 0.535, p = 0.040), but negatively correlated with the class Acidobacteria abundance (r = −0.839, p < 0.001), KD4_96 abundance (r = −0.580, p = 0.023), Chloroflexia abundance (r = −0.746, p = 0.001), and TK10 abundance (r = −0.663, p = 0.007). The soil NO3 was positively correlated with the class Alphaproteobacteria abundance (r = 0.615, p = 0.015), Betaproteobacteria abundance (r = −0.559, p = 0.030), Gammaproteobacteria abundance (r = −0.784, p = 0.001), Sphingobacteriia abundance (r = −0.772, p = 0.001), Acidimicrobiia abundance (r = 0.573, p = 0.026), Holophagae abundance (r = 0.582, p = 0.023), and Cytophagia abundance (r = 0.526, p = 0.044), but negatively correlated with the class Acidobacteria abundance (r = −0.830, p < 0.001), Thermomicrobia abundance (r = −0.544, p = 0.036), KD4_96 abundance (r = −0.576, p = 0.025), Chloroflexia abundance (r = −0.698, p = 0.004), and TK10 abundance (r = −0.565, p = 0.028). The soil TN was only positively correlated with the class Betaproteobacteria abundance (r = 0.544, p = 0.036). The soil TP was only positively correlated with the class Sphingobacteriia abundance (r = 0.517, p = 0.048). The leaf area index during the flowering period of wheat positively was correlated with the class Gemmatimonadetes abundance (r = 0.524, p = 0.045), Betaproteobacteria abundance (r = 0.519, p = 0.048), and Cytophagia abundance (r = 0.572, p = 0.026), but negatively correlated with the class Acidobacteria abundance (r = −0.738, p = 0.002) and Sphingobacteriia abundance (r = −0.754, p = 0.001). The grain yield of wheat was positively correlated with the class Betaproteobacteria abundance (r = −0.548, p = 0.035), Gammaproteobacteria abundance (r = −0.553, p = 0.032), and Sphingobacteriia abundance (r = −0.672, p = 0.006), but negatively correlated with the class Acidobacteria abundance (r = −0.562, p = 0.029), Chloroflexia abundance (r = −0.603, p = 0.017), and TK10 abundance (r = −0.607, p = 0.016). NUE was positively correlated with the class KD4_96 abundance (r = 0.617, p = 0.033) and Chloroflexia abundance (r = 0.713, p = 0.009), but negatively correlated with the class Alphaproteobacteria abundance (r = −0.815, p = 0.001), Sphingobacteriia abundance (r = −0.801, p = 0.002), and Cytophagia abundance (r = −0.687, p = 0.013). However, there was no correlation between soil AP and bacterial class abundance.

4. Discussion

4.1. Effect of Long-Term N Fertilization on Soil Chemical Properties, Wheat Yield, Crop N Uptake, and N Use Efficiency

Adequate supply of N fertilizer in the soil is essential to maximize grain yield, but the amount of N fertilizer application exceeding the N absorption of wheat will reduce grain yield [47]. Some studies have reported that long-term elevated N fertilizer input has a negative effect on soil pH [48], and may cause soil acidification and reduce crop yield [49]. The results of this study indicated that N-fertilizer reduced pH, but soil NH4, NO3, available phosphorus concentration, N uptake, and grain yield of wheat were all significantly increased by N fertilization, while no significant increase in total N uptake and grain yield was observed beyond N rate of 105 kg N ha−1. Therefore, for semiarid Loess Plateau, long-term N fertilization had improved the soil chemical properties but reduced soil pH although the reduction in soil pH did not influence wheat yield. This study and previous long-term studies had all proved that the application of medium rate of N fertilizer (105 kg N ha−1 yr−1) showed a maximum increase of spring wheat yield and nitrogen use efficiency (NUE), and minimum accumulation and loss of NO3-N in the soil, thereby maintaining the balance of N input and expenditure in the soil [50].

4.2. Effect of Long-Term N Fertilization on Soil Bacteria

Some studies have shown that all N fertilizer treatments decreased bacterial diversity of agricultural soils [51,52], but some studies have shown opposite results, demonstrating that the application of N fertilizer significantly increases bacterial diversity [53]. Changes in soil microbial communities are often correlated with differences in soil chemistry [54,55,56], for instance, with soil pH [56,57]. In this study, the N105 was observed significantly higher PD whole tree (1.70% higher than N0 and 4.62% higher than N210), Chao1 (4.95% higher than N210), and species bacterial diversity indices (4.91% higher than N210), and OTU values for species richness (5.02% higher than N0 and 8.26% higher than N210), suggesting that a reasonable N fertilizer rate (N105) had significantly increased the bacterial diversity and helpful to maintain a relatively high soil bacterial diversity (Table 3).
The dominant phyla of this study did not agree with Liu et al. [53], who reported that certain dominant phyla in non-N and N-fertilizer treatments were different, and there was no significant difference among the treatments. Studies had also shown that N fertilization not only changes the soil bacterial community [58], but also changes the composition of individual bacteria phyla [59]. In this study, the dominant soil bacterial phyla were Proteobacteria, Actinobacteria, Acidobacteria, Chloroflekxi, Gemmatimonadetes, Bacteroidetes, Nitrospirae, Verrucomicrobia, and Planctomycetes. Some previous study found different dominant phyla from the present study [53,60], whereas, dominant phyla were similar with few previous studies [51], which may be due to different soil and environment.
The long-term N fertilizer application significantly influenced the relative abundance of the main phyla (>1%). The phyla Proteobacteria, Actinobacteria, and Acidobacteria (occupied 63–66%) dominated in all N fertilizer treatments. In previous studies, the relative abundance of the Proteobacteria, Bacteroidetes, and Actinobacteria in higher N soils were increased [61]. However, in this study, Proteobacteria, Bacteroidetes, and Actinobacteria showed different responses to application of N fertilizer. The relative abundance of the phyla Proteobacteria and Bacteroidetes increased in N fertilizer application soils, whereas the relative abundance of phyla Acidobacteria was decreased, which was consistent with the findings of Zhou et al. [51], and inconsistent with the results of Zhong et al. [60]. This difference in relative abundance of the main phyla (>1%) might be attributed to the differences in soil chemistry [55,56].

4.3. Relationships between Soil Bacteria and Soil Chemical Properties and Crop Factors

The effect of N application on soil bacterial diversity may be caused by the direct role of N as a nutrient or indirect role in changing the soil characteristics [62]. Some studies have reported that long-term elevated N fertilizer input has a negative effect on soil pH, which could cause a decrease in bacterial activity [48], and may cause soil acidification and reduce crop yields [49]. Results from this study showed that the soil NH4 concentration was correlated with most of the diversity indices, Simpson’s index was positively correlated with soil pH, and OTUs were positively correlated with grain yield and NUE. However, no significant correlation was found between bacterial diversity and soil total N, total P, available P, soil moisture, and N uptake in different parts of wheat. This indicates that the reduction in pH resulted from long-term N fertilization does not affect the bacterial diversity and grain yield of wheat although the increased soil NH4 resulted from reasonable N fertilizer rate proved helpful in maintaining a relatively high soil bacterial diversity, grain yield, and NUE.
For soil bacterial community, many studies have shown that soil factors, especially soil pH had strongly influence soil microbial community structure [63,64]. In this study, RDA showed that soil NH4 concentration (F = 10.9, p = 0.002) was the most important contributor to variation in soil bacterial communities. However, as previously discovered, Proteobacteria and Gemmatimonadetes increased in N-fertilizer treatments and was negatively correlated with soil pH [51,65]. Similar to the results of Zhou et al. [51], the relative abundant of Proteobacteria was higher in higher-N-fertilizer treatmens (N157,5 and N210) than other treatments, and this was significantly correlated with the higher concentrations of soil moisture, NH4-N, NO3-N, and lower pH (Figure 5). According to previous studies, Acidobacteria, Chloroflexi, and Verrucomicrobia were considered to be oligotrophic groups [32,61,66], which abundance decreased with N fertilizer application and related to the limited nutrient conditions in the field soil [31,61]. The consistent results of this study showed that the relative abundant of phyla Acidobacteria, Chloroflexi, and Verrucomicrobia were greater in non-N-fertilizer control (N0) than the higher-N-fertilizer treatments (N157.5 and N210) (Figure 1), and were significantly correlated with the higher soil pH, lower concentrations of soil NH4-N and NO3-N (Figure 5), rather than total N as showed by the Rothamsted Research Station in the United Kingdom [67]. In particular, N105 treatment had slightly higher soil properties than N0 (Table 1), but similar to N0, it also had a higher relative abundance of phyla Acidobacteria, Chloroflexi, and Verrucomicrobia (Figure 1), which further proved the previous conclusion that a ppropriate N fertilization (N105) could increase crop yield and N absorption to reduce soil N residues, thereby ensuring the sustainable use of N fertilizer [50,68].
Previous studies focused on the effects of N fertilizer mainly analyzed changes in soil biochemical characteristics and soil microbial community structure [69]. Few studies had explored how the impact of soil biochemical properties on the structure of soil microbial communities would ultimately affect crop production and N fertilizer utilization. The study found that, although the grain yield of wheat was not correlated with the relative abundance of phyla, it was positively correlated with the class Betaproteobacteria abundance, Gammaproteobacteria abundance, and Sphingobacteriia abundance, but negatively correlated with the class Acidobacteria abundance, Chloroflexia abundance, and TK10 (uncultured_ chloroflexi) abundance (Figure 6). The higher grain yield of wheat might be duo to the higher class Gammaproteobacteria and Sphingobacteriia abundance, and lower Acidobacteria and Chloroflexia abundance (Figure 3 and Figure 6). Meanwhile, the NUE was positively correlated with the phyla Verrucomicrobia, phyla Planctomycetes, class KD4_96 (uncultured_Anaerolineae), and class Chloroflexia, but negatively correlated with the phyla Proteobacteria, phyla Bacteroidetes, class Alphaproteobacteria, class Sphingobacteriia, and class Cytophagia abundance (Figure 6). The higher N use efficiency (NUE) of wheat in the N105 treatment might be attributed to the higher phyla Verrucomicrobia and Planctomycetes, and lower Proteobacteria abundance (Figure 1 and Figure 5). However, it is a complicated process for soil bacteria to be affected by the amount of nitrogen fertilizer and further affect crop production. Therefore, it is necessary to continue to verify the response of soil bacteria to N fertilizer in different types of soil environments to drive crop production.

5. Conclusions

Long-term N fertilization for mono-cropping spring wheat had decreased the soil pH and increased NH4, NO3, and available P in soil and leaf area index of wheat. The higher soil NH4 and NO3 under optimum N fertilization rate also increased soil bacterial diversity, N uptake of wheat, grain yield, and nitrogen use efficiency. Soil NH4 concentration proved the most important contributor to variation in the soil bacterial community. The dominant soil bacterial phyla were Proteobacteria, Actinobacteria, Acidobacteria, Chloroflexi, Gemmatimonadetes, Bacteroidetes, Nitrospirae, Verrucomicrobia, and Planctomycetes. Soil bacteria community was strongly related to soil chemical properties, and the higher grain yield of wheat was related to the higher class Gammaproteobacteria and Sphingobacteriia abundance, and lower class Acidobacteria and Chloroflexia abundance. N fertilization rate of 105 kg N ha−1 yr−1 maintained a diversified soil bacterial community, and was most suitable for improving spring wheat yield and nitrogen use efficiency, which can be attributed to the higher phyla Verrucomicrobia and Planctomycetes, and lower Proteobacteria abundance, and thereby could assist the sustainable intensification of wheat production in semi-arid Loess Plateau of China.

Author Contributions

Conceptualization, L.L.; Data curation, Z.L.; Formal analysis, A.X.; Funding acquisition, L.L.; Investigation, A.X., C.L., and L.W.; Methodology, J.A.C., J.X., and Z.L.; Project administration, J.X.; Resources, J.X., S.G., L.C., and L.W.; Software, Z.L.; Supervision, L.L. and R.Z.; Validation, J.X.; Visualization, L.C.; Writing—original draft, A.X.; Writing—review & editing, L.L., J.A.C., S.G., and S.K. All authors have read and agreed to the published version of the manuscript.

Funding

The research was supported by the National Natural Science Foundation of China (31761143004 and 31660373), the Education Department of Gansu Province (2017C-12), and the Department of Science and Technology of Gansu Province (GSPT-2018-56).

Acknowledgments

The authors appreciate assistance in the field and laboratory by students of the Rainfed Agricultural Experimental Station of Gansu Agricultural University.

Conflicts of Interest

The authors declare no conflict of interest.

References

  1. Sean, T.; Chris, M.; Laverne, G.; Blaire, S.; Stephanie, A.; Robert, B.; Cheryl, R. Nitrogen Fertilization Has a Stronger Effect on Soil Nitrogen-Fixing Bacterial Communities than Elevated Atmospheric CO2. Appl. Environ. Microbiol. 2014, 80, 3103–3112. [Google Scholar]
  2. Thomas, R.Q.; Brookshire, E.N.J.; Gerber, S. Nitrogen limitation on land: How can it occur in earth system models? Glob. Chang. Biol. 2015, 21, 1777–1793. [Google Scholar] [CrossRef] [PubMed]
  3. Gitelson, A.; Viña, A.; Arkebauer, T.J.; Rundquist, D.C.; Keydan, G.; Leavitt, B. Remote estimation of leaf area index and green leaf biomass in maize canopies. Geophys. Res. Lett. 2003, 30, 1248–1251. [Google Scholar] [CrossRef] [Green Version]
  4. Fan, T.; Xu, M.; Song, S.; Zhou, G.; Ding, L. Trends in grain yields and soil organic C in a long-term fertilization experiment in the china loess plateau. J. Plant Nutr. Soil Sci. 2008, 171, 448–457. [Google Scholar] [CrossRef]
  5. Fan, T.; Stewart, B.A.; Yong, W.; Junjie, L.; Guangye, Z. Long-term fertilization effects on grain yield, water-use efficiency and soil fertility in the dryland of loess plateau in china. Ecosyst. Environ. 2005, 106, 313–329. [Google Scholar] [CrossRef]
  6. Dai, J.; Wang, Z.; Li, F.; He, G.; Wang, S.; Li, Q.; Cao, H.; Luo, L.; Zan, Y.; Meng, X.; et al. Optimizing nitrogen input by balancing winter wheat yield and residual nitrate-N in soil in a long-term dryland field experiment in the Loess Plateau of China. Field Crop. Res. 2015, 181, 32–41. [Google Scholar] [CrossRef]
  7. Ikeda, S.; Sasaki, K.; Okubo, T.; Yamashita, A.; Terasawa, K.; Bao, Z.; Liu, D.; Watanabe, T.; Murase, J.; Asakawa, S.; et al. Low Nitrogen Fertilization Adapts Rice Root Microbiome to Low Nutrient Environment by Changing Biogeochemical Functions. Microbes Environ. 2014, 29, 50–59. [Google Scholar] [CrossRef] [PubMed] [Green Version]
  8. Lakesh, K.S.; Sukhwinder, K.B. A Review of Methods to Improve Nitrogen Use Efficiency in Agriculture. Sustainability 2018, 10, 51. [Google Scholar]
  9. The Food and Agriculture Organization (FAO). Available online: http://www.fao.org/faostat/en/#data/QC (accessed on 19 January 2018).
  10. Chien, S.H.; Teixeira, L.A.; Cantarella, H.; Rehm, G.W.; Grant, C.A.; Gearhart, M.M. Agronomic effectiveness of granular nitrogen/phosphorus fertilizers containing elemental sulfur with and without ammonium sulfate: A Review. Agron. J. 2016, 108, 1203. [Google Scholar] [CrossRef] [Green Version]
  11. Dobermann, A.; Ping, J.L.; Adamchuk, V.I.; Simbahan, G.C.; Ferguson, R.B. Classification of Crop Yield Variability in Irrigated Production Fields. Agron. J. 2003, 95, 1105. [Google Scholar] [CrossRef] [Green Version]
  12. Nolan, S.; Unkovich, M.; Shen, Y.; Li, L.; Bellotti, W. Farming systems of the Loess Plateau, Gansu Province, China. Ecosyst. Environ. 2008, 124, 13–23. [Google Scholar] [CrossRef]
  13. Li, H.; Zhang, W.; Zhang, F.; Du, F.; Li, L. Chemical fertilizer use and efficiency change of main grain crops in China. Plant Nutr. Fertil. Sci. 2010, 16, 1136–1143. [Google Scholar]
  14. Li, L.; Zhang, R.; Luo, Z.; Liang, W.; Xie, J.; Cai, L.; Bellotti, B. Evolution of soil and water conservation in rain-fed areas of China. Int. Soil Water Conserv. Res. 2014, 2, 78–90. [Google Scholar]
  15. Guo, J.H.; Liu, X.J.; Zhang, Y.; Shen, J.L.; Han, W.X.; Zhang, W.F.; Christie, P.; Goulding, K.W.T.; Vitousek, P.M.; Zhang, F.S. Significant acidification in major chinese croplands. Science 2010, 327, 1008–1010. [Google Scholar] [CrossRef] [PubMed] [Green Version]
  16. Sainjua, U.P.; Senwo, Z.N.; Nyakatawa, E.Z.; Tazisong, I.A.; Reddy, K.C. Soil carbon and nitrogen sequestration as affected by long-term tillage, cropping systems, and nitrogen fertilizer sources. Agric. Ecosyst. Environ. 2008, 127, 234–240. [Google Scholar] [CrossRef]
  17. Conley, D.J.; Paerl, H.W.; Howarth, R.W.; Boesch, D.F.; Seitzinger, S.P.; Havens, K.E.; Lancelot, C.; Likens, G.E. Controlling Eutrophication: Nitrogen and Phosphorus. Science 2009, 323, 1014–1015. [Google Scholar] [CrossRef]
  18. Wei, X.R.; Hao, M.D.; Xue, X.H.; Shi, P.; Horton, R.; Wang, A.; Zhang, Y.F.; Wei, X.R. Nitrous oxide emission from highland winter wheat field after long-term fertilization. Biogeosciences 2010, 7, 3301–3310. [Google Scholar] [CrossRef] [Green Version]
  19. Suleiman, A.K.A.; Manoeli, L.; Boldo, J.T.; Pereira, M.G.; Roesch, L.F.W. Shifts in soil bacterial community after eight years of land-use change. Syst. Appl. Microbiol. 2013, 36, 137–144. [Google Scholar] [CrossRef]
  20. Garbeva, P.; van Veen, J.A.; van Elsas, J.D. Microbial diversity in soil: Selection of microbial populations by plant and soil type and implications for disease suppressiveness. Annu. Rev. Phytopathol. 2004, 42, 243–270. [Google Scholar] [CrossRef]
  21. Shen, W.; Lin, X.; Gao, N.; Zhang, H.; Yin, R.; Shi, W.; Duan, Z. Land use intensification affects soil microbial populations, functional diversity and related suppressiveness of cucumber Fusarium wilt in China’s Yangtze River Delta. Plant Soil 2008, 306, 117–127. [Google Scholar] [CrossRef]
  22. Li, Y.; Chen, L.; Wen, H.; Zhou, T.; Zhang, T.; Gao, X. 454 Pyrosequencing Analysis of Bacterial Diversity Revealed by a Comparative Study of Soils from Mining Subsidence and Reclamation Areas. J. Microbiol. Biotechnol. 2014, 24, 313–323. [Google Scholar] [CrossRef] [PubMed] [Green Version]
  23. Zhao, J.; Ni, T.; Li, Y.; Xiong, W.; Ran, W. Responses of Bacterial Communities in Arable Soils in a Rice-Wheat Cropping System to Different Fertilizer Regimes and Sampling Times. PLoS ONE 2014, 9, e85301. [Google Scholar] [CrossRef] [PubMed]
  24. Gans, J.; Wolinsky, M.; Dunbar, J. Computational Improvements Reveal Great Bacterial Diversity and High Metal Toxicity in Soil. Science 2005, 309, 1387–1390. [Google Scholar] [CrossRef] [PubMed]
  25. Sindhu, S.S.; Gupta, S.K.; Dadarwal, K.R. Antagonistic effect of Pseudomonas spp. on pathogenic fungi and enhancement of growth of green gram (Vigna radiata). Biol. Fertil. Soils 1999, 29, 62–68. [Google Scholar] [CrossRef]
  26. Vessey, J.K. Plant growth promoting rhizobacteria as biofertilizers. Plant Soil 2003, 255, 571–586. [Google Scholar] [CrossRef]
  27. Chu, H.; Fujii, T.; Morimoto, S.; Lin, X.; Yagi, K.; Hu, J.; Zhang, J. Community Structure of Ammonia-Oxidizing Bacteria under Long-Term Application of Mineral Fertilizer and Organic Manure in a Sandy Loam Soil. Appl. Environ. Microbiol. 2007, 73, 485–491. [Google Scholar] [CrossRef] [Green Version]
  28. Ning, Q.; Gu, Q.; Shen, J.; Lv, X.; Yang, J.; Zhang, X.; He, J.; Huang, J.; Wang, H.; Xu, Z.; et al. Effects of nitrogen deposition rates and frequencies on the abundance of soil nitrogen-related functional genes in temperate grassland of northern China. J. Soils Sediments 2015, 15, 694–704. [Google Scholar] [CrossRef]
  29. Hallin, S.; Jones, C.M.; Schloter, M.; Philippot, L. Relationship between N-cycling communities and ecosystem functioning in a 50-year-old fertilization experiment. ISME J. 2009, 3, 597–605. [Google Scholar] [CrossRef]
  30. Wu, H.; Zeng, G.; Liang, J.; Guo, S.; Dai, J.; Lu, L.; Wei, Z.; Xu, P.; Li, F.; Yuan, Y.; et al. Effect of early dry season induced by the Three Gorges Dam on the soil microbial biomass and bacterial community structure in the Dongting Lake wetland. Ecol. Indic. 2015, 53, 129–136. [Google Scholar] [CrossRef]
  31. Yao, M.; Rui, J.; Li, J.; Dai, Y.; Bai, Y.; Heděne, P.; Wang, J.; Zhang, S.; Pei, K.; Liu, C.; et al. Rate-specific responses of prokaryotic diversity and structure to nitrogen deposition in the Leymus chinensis steppe. Soil Biol. Biochem. 2014, 79, 81–90. [Google Scholar] [CrossRef]
  32. Turlapati, S.A.; Minocha, R.; Bhiravarasa, P.S.; Tisa, L.S.; Thomas, W.K.; Minocha, S.C. Chronic N-amended soils exhibit an altered bacterial community structure in Harvard Forest, MA, USA. Ecology 2013, 83, 478–493. [Google Scholar] [CrossRef] [PubMed] [Green Version]
  33. Chinese Soil Taxonomy Cooperative Reseach Group. Chinese Soil Taxonomy (Revised Proposal); Institute of Soil Science/Chinese Agricultural Science and Technology Press, Academic Sinica: Beijing, China, 1995. [Google Scholar]
  34. Food and Agriculture or Ganisation; Food and Agriculture Organization of the United Nations: Rome, Italy, 1990.
  35. Wang, G.; Zhang, X.; Wang, Y.; Xu, X.; Han, Z. Key minerals influencing apple quality in Chinese orchard identified by nutritional diagnosis of leaf and soil analysis. J. Integr. Agric. 2015, 14, 864–874. [Google Scholar] [CrossRef]
  36. O’Kelly, B.C. Accurate Determination of Moisture Content of Organic Soils Using the Oven Drying Method. Dry. Technol. 2004, 22, 1767–1776. [Google Scholar] [CrossRef]
  37. Li, X.; Deng, Y.; Li, Q.; Lu, C.; Wang, J.; Zhang, H.; Zhu, J.; Zhou, J.; He, Z. Shifts of functional gene representation in wheat rhizosphere microbial communities under elevated ozone. ISME J. 2013, 7, 660–671. [Google Scholar] [CrossRef] [PubMed] [Green Version]
  38. Bao, S. Analysis of Soil Agro-Chemistry; China Agriculture Press: Beijing, China, 1999. (In Chinese) [Google Scholar]
  39. National Agriculture Technoligy Extension and Service Center (NATESC). Soil Analysis Technology Specification; China Agriculture Press: Beijing, China, 2006.
  40. Dai, J.; Wang, Z.H.; Li, M.H.; He, G.; Li, Q.; Cao, H.B.; Wang, S.; Gao, Y.J.; Hui, X.L. Winter wheat grain yield and summer nitrate leaching: Long-term effects of nitrogen and phosphorus rates on the Loess Plateau of China. Field Crop. Res. 2016, 196, 180–190. [Google Scholar] [CrossRef]
  41. Magoc, T.; Salzberg, S.L. FLASH: Fast length adjustment of short reads to improve genome assemblies. Bioinformatics. 2011, 27, 2957–2963. [Google Scholar] [CrossRef]
  42. Caporaso, J.G.; Kuczynski, J.J.S. QIIME allows analysis of high-throughput community sequencing data. Nat. Methods. 2010, 7, 335–336. [Google Scholar] [CrossRef] [Green Version]
  43. Edgar, R.C.; Haas, B.J.; Clemente, J.C.; Quince, C.; Knight, R. UCHIME improves sensitivity and speed of chimera detection. Bioinformatics 2011, 27, 2194–2200. [Google Scholar] [CrossRef] [Green Version]
  44. Torbjørn, R.; Tomáš, F.; Nichols, B.; Quince, C.; Frédéric, M. Vsearch: A versatile open source tool for metagenomics. PeerJ 2016, 4, e2584. [Google Scholar]
  45. Wang, Q.; Garrity, G.M.; Tiedje, J.M.; Cole, J.R. Naive Bayesian Classifier for Rapid Assignment of rRNA Sequences into the New Bacterial Taxonomy. Appl. Environ. Microbiol. 2007, 73, 5261–5267. [Google Scholar] [CrossRef] [Green Version]
  46. Su, B.Y.; Song, Y.X.; Song, C.; Cui, L.; Yong, T.W.; Yang, W.T. Growth and photosynthetic responses of soybean seedlings to maize shading in relay intercropping system in Southwest China. Photosynthetica 2014, 52, 332–340. [Google Scholar] [CrossRef]
  47. Wang, X.Y.; Yu, Z.W. Effect of irrigation rate on absorption and translocation of nitrogen under different nitrogen fertilizer rate in wheat. Sci. Agric. Sin. 2008, 41, 3015–3024. [Google Scholar]
  48. Wang, C.; Lu, X.; Mori, T.; Mao, Q.; Zhou, K.; Zhou, G.; Nie, Y.; Mo, J. Responses of soil microbial community to continuous experimental nitrogen additions for 13 years in a nitrogen-rich tropical forest. Soil Biol. Biochem. 2018, 121, 103–112. [Google Scholar] [CrossRef]
  49. Dai, Z.; Su, W.; Chen, H.; Barberán, A.; Zhao, H.; Yu, M.; Yu, L.; Brookes, P.C.; Schadt, C.W.; Chang, S.X.; et al. Long-term nitrogen fertilization decreases bacterial diversity and favors the growth of Actinobacteria and Proteobacteria in agro-ecosystems across the globe. Glob. Chang. Biol. 2018, 24, 3452–3461. [Google Scholar] [CrossRef] [PubMed]
  50. Xu, A.; Li, L.; Xie, J.; Wang, X.; Coulter, J.A.; Liu, C.; Wang, L. Effect of Long-Term Nitrogen Addition on Wheat Yield, Nitrogen Use Efficiency, and Residual Soil Nitrate in a Semiarid Area of the Loess Plateau of China. Sustainability 2020, 12, 1735. [Google Scholar] [CrossRef] [Green Version]
  51. Zhou, J.; Guan, D.; Zhou, B.; Zhao, B.; Ma, M.; Qin, J.; Jiang, X.; Chen, S.; Cao, F.; Shem, D.; et al. Influence of 34-years of fertilization on bacterial communities in an intensively cultivated black soil in northeast China. Soil Biol. Biochem. 2015, 90, 42–51. [Google Scholar] [CrossRef]
  52. Geisseler, D.; Scow, K.M. Long-term effects of mineral fertilizers on soil microorganisms—A review. Soil Biol. Biochem. 2014, 75, 54–63. [Google Scholar] [CrossRef]
  53. Liu, J.; Zhang, X.; Wang, H.; Hui, X.; Wang, Z.; Qiu, W. Long-term nitrogen fertilization impacts soil fungal and bacterial community structures in a dryland soil of Loess Plateau in China. J. Soils Sediments 2017, 18, 1632–1640. [Google Scholar] [CrossRef]
  54. Nilsson, L.O.; Bååth, E.; Falkengren-grerup, U.; Wallander, H. Growth of Ectomycorrhizal Mycelia and Composition of Soil Microbial Communities in Oak Forest Soils along a Nitrogen Deposition Gradient. Oecologia 2007, 153, 375–384. [Google Scholar] [CrossRef]
  55. Lauber, C.L.; Strickland, M.S.; Bradford, M.A.; Fierer, N. The influence of soil properties on the structure of bacterial and fungal communities across land-use types. Soil Biol. Biochem. 2008, 40, 2407–2415. [Google Scholar] [CrossRef]
  56. Jenkins, S.N.; Waite, I.S.; Blackburn, A.; Husband, R.; Rushton, S.P.; Manning, D.C.; O’Donnell, A.G. Actinobacterial community dynamics in long term managed grasslands. Antonie van Leeuwenhoek 2009, 95, 319–334. [Google Scholar] [CrossRef] [PubMed]
  57. Hartman, W.H.; Richardson, C.J.; Vilgalys, R.; Bruland, G.L. Environmental and anthropogenic controls over bacterial communities in wetland soils. Proc. Natl. Acad. Sci. USA 2008, 105, 17842–17847. [Google Scholar] [CrossRef] [PubMed] [Green Version]
  58. Rousk, J.; Bååth, E.; Brookes, P.C.; Lauber, C.L.; Lozupone, C.; Caporaso, J.G.; Knight, R.; Fierer, N. Soil bacterial and fungal communities across a pH gradient in an arable soil. ISME J. 2010, 4, 1340–1351. [Google Scholar] [CrossRef] [PubMed]
  59. Wertz, S.; Leigh, A.K.K.; Grayston, S.J. Effects of long-term fertilization of forest soils on potential nitrification and on the abundance and community structure of ammonia oxidizers and nitrite oxidizers. FEMS Microbiol. Ecol. 2012, 79, 142–154. [Google Scholar] [CrossRef] [PubMed] [Green Version]
  60. Zhong, Y.; Yan, W.; Shangguan, Z. Impact of long-term N additions upon coupling between soil microbial community structure and activity, and nutrient-use efficiencies. Soil Biol. Biochem. 2015, 91, 151–159. [Google Scholar] [CrossRef]
  61. Fierer, N.; Lauber, C.L.; Ramirez, K.S.; Zaneveld, J.; Bradford, M.A.; Knight, R. Comparative metagenomic, phylogenetic and physiological analyses of soil microbial communities across nitrogen gradients. ISME J. 2012, 6, 1007–1017. [Google Scholar] [CrossRef] [Green Version]
  62. Zhang, C.; Song, Z.; Zhuang, D.; Wang, J.; Xie, S.; Liu, G. Urea fertilization decreases soil bacterial diversity, but improves microbial biomass, respiration, and N-cycling potential in a semiarid grassland. Biol. Fertil. Soils 2019, 55, 229–242. [Google Scholar] [CrossRef]
  63. Shen, C.; Xiong, J.; Zhang, H.; Feng, Y.; Lin, X.; Li, X.; Liang, W.; Chu, H. Soil pH drives the spatial distribution of bacterial communities along elevation on Changbai Mountain. Soil Biol. Biochem. 2012, 57, 204–211. [Google Scholar] [CrossRef]
  64. Xiong, J.; Liu, Y.; Lin, X.; Zhang, H.; Zeng, J.; Hou, J.; Yang, Y.; Yao, T.; Knight, R.; Chu, H. Geographic distance and ph drive bacterial distribution in alkaline lake sediments across tibetan plateau. Environ. Microbiol. 2012, 14, 2457–2466. [Google Scholar] [CrossRef] [Green Version]
  65. Dong, W.-Y.; Zhang, X.Y.; Dai, X.Q.; Fu, X.L.; Yang, F.T.; Liu, X.Y.; Sun, X.M.; Wen, X.F.; Schaeffer, S. Changes in soil microbial community composition in response to fertilization of paddy soils in subtropical China. Appl. Soil Ecol. 2014, 84, 140–147. [Google Scholar] [CrossRef]
  66. Ramirez, K.S.; Craine, J.M.; Fierer, N.B. Consistent effects of nitrogen amendments on soil microbial communities and processes across biomes. Glob. Chang. Biol. 2012, 18, 1918–1927. [Google Scholar] [CrossRef]
  67. Zhalnina, K.; Dias, R.; Quadros, P.D.; Davis-Richardson, A.; Camargo, F.A.O.; Clark, I.M.; McGrath, S.P.; Hirsch, P.R.; Triplett, E.W. Soil pH determines microbial diversity and composition in the park grass experiment. Microb. Ecol. 2015, 69, 395–406. [Google Scholar] [CrossRef]
  68. Malhi, S.S.; Soon, Y.K.; Grant, C.A.; Lemke, R.; Lupwayi, N. Influence of controlled-Release urea on seed yield and N concentration, and N use efficiency of small grain crops grown on Dark Gray Luvisols. Can. J. Soil Sci. 2010, 90, 363–372. [Google Scholar] [CrossRef]
  69. Nemergut, D.R.; Townsend, A.R.; Sattin, S.R.; Freeman, K.R.; Fierer, N. The effects of chronic nitrogen fertilization on alpine tundra soil microbial communities: Implications for carbon and nitrogen cycling. Environ. Microbiol. 2008, 10, 3093–3105. [Google Scholar] [CrossRef] [PubMed]
Figure 1. Relative abundance of soil bacterial phyla as affected by nitrogen (N) fertilizer application rate. N0, N52.5, N105, N157.5, and N210 indicate annual N fertilizer application at 0, 52.5, 105, 157.5, and 210 kg ha−1, respectively. Error bars indicate the standard errors of the means (n = 3). Different letters between each column indicate significant differences according to Duncan’s test (p ≤ 0.05).
Agronomy 10 01175 g001
Figure 2. Relative abundance and change of soil bacterial phyla as affected by nitrogen (N) fertilizer treatment. N52.5, N105, N157.5, N210, annual N fertilizer application at 52.5, 105.0, 157.5, and 210.0 kg N ha−1, respectively. Error bars indicate the standard errors of the means (n = 3).
Agronomy 10 01175 g002
Figure 3. Relative abundance of the nine most abundant classes of soil bacteria as affected by nitrogen (N) fertilizer treatment. N0, non-N-fertilized control; N52.5, N105, N157.5, N210, annual N fertilizer application at 52.5, 105.0, 157.5, and 210.0 kg N ha−1, respectively. A, Acidobacteria; B, Alphaproteobacteria, C, Thermoleophilia; D, Deltaproteobacteria, E, Thermomicrobia; F, Gammaproteobacteria; G, Sphingobacteriia; H, Nitrospira; I, Holophagae, respectively. Error bars indicate the standard errors of the means (n = 3). Different letters indicate means that are significantly different at p < 0.05. * and ** indicate that the effect of N fertilizer treatment was significant at p < 0.05 and 0.01, respectively.
Agronomy 10 01175 g003
Figure 4. Redundant analysis (RDA) of soil bacterial communities and soil chemical properties for individual samples. pH, soil pH, TN, soil total nitrogen; NH4-N, soil ammonium-N; NO3-N, soil nitrate-N; TP, soil total phosphorus; AP, soil available phosphorus; SM, soil moisture. −1, −2, and −3 represent the first, second, and third experimental replications, respectively, for the corresponding treatment.
Agronomy 10 01175 g004
Figure 5. Correlation heatmap of soil properties, leaf area index (LAI), grain yield (GY), and nitrogen use efficiency (NUE) of wheat and soil bacterial phyla (relative abundance > 1%). The shade of color indicates the correlation between relative abundance of each bacterial and soil and wheat parameters. * p < 0. 05; ** p < 0.01.
Agronomy 10 01175 g005
Figure 6. Correlation heatmap of soil properties, leaf area index (LAI), grain yield (GY), and nitrogen use efficiency (NUE) of wheat with soil bacterial classes (relative abundance > 1%). The shade of color indicates the correlation between relative abundance of each bacterial and soil and wheat parameters. * p < 0.05; ** p < 0.01.
Agronomy 10 01175 g006
Table 1. Soil properties at the flowering stage of wheat in 2018, as affected by nitrogen (N) fertilizer treatment.
TreatmentpHTN
(g kg−1)
NH4-N
(mg kg−1)
NO3-N
(mg kg−1)
TP
(g kg−1)
AP
(mg kg−1)
SM
(%)
N08.09 ± 0.04ab0.92 ± 0.04a11.61 ± 0.20b15.74 ± 0.12d0.60 ± 0.03a21.52 ± 1.44b11.63 ± 0.91a
N52.57.94 ± 0.03b0.97 ± 0.13a12.05 ± 0.51b19.77 ± 0.55c0.69 ± 0.09a23.74 ± 0.54b11.57 ± 0.46a
N1057.87 ± 0.03bc1.10 ± 0.02a12.68 ± 1.47b26.08 ± 0.63b0.77 ± 0.06a26.65 ± 0.21a11.45 ± 0.27a
N157.57.81 ± 0.01c1.05 ± 0.04a18.09 ± 0.23a46.58 ± 0.68a0.77 ± 0.08a23.55 ± 0.68b10.75 ± 0.5a
N2107.83 ± 0.05c0.99 ± 0a18.68 ± 0.79a47.35 ± 0.42a0.76 ± 0.07a23.94 ± 0.84b10.55 ± 0.79a
ANOVA p-value0.0010.369<0.001<0.0010.4290.0220.503
N0, non-N-fertilized control; N52.5, N105, N157.5, N210, annual N fertilizer application at 52.5, 105.0, 157.5, and 210.0 kg ha−1, respectively; TN, total N; NH4-N, ammonium-N; NO3-N, nitrate-N; TP, total phosphorus; AP, available phosphorus; SM, soil moisture. Values are means of three replicates ± standard error. Within a column, means followed by different letters are significantly different at p < 0.05.
Table 2. Nitrogen uptake (kg N ha−1) of different tissues of wheat at different stages of development, leaf area index (LAI) of wheat at flowering, and grain yield (GY) and nitrogen use efficiency (NUE) of wheat in 2018 as affected by N fertilizer treatment a.
Growth StageDependent VariableN Rate (kg ha−1)ANOVA
(p-Value)
N0N52.5N105N157.5N210
TilleringN uptakeaboveground46.64 ± 3.39c b62.61 ± 2.61b71.72 ± 1.06ab73.35 ± 2.13a78.45 ± 4.28a<0.001
AnthesisN uptakeleaf5.14 ± 0.60b11.43 ± 2.19ab17.38 ± 2.16a20 ± 4.69a19.57 ± 3.18a0.020
stem + sheath14.44 ± 0.22b21.50 ± 1.15a25.18 ± 0.67a27.18 ± 3.95a25.47 ± 1.68a0.008
spike29.61 ± 2.18c41.67 ± 0.46b50.97 ± 2.00a58.06 ± 1.43a56.06 ± 5.11a<0.001
aboveground52.25 ± 3.44b81.93 ± 4.5ab103.31 ± 4.01a112.88 ± 18.73a110.11 ± 9.08a0.007
LAI1.82 ± 0.05d3.56 ± 0.10b3.05 ± 0.12c3.93 ± 0.09a3.86 ± 0.12ab<0.001
MaturityN uptakeleaf2.80 ± 0.22b8.53 ± 1.28a8.71 ± 1.43a9.34 ± 1.26a7.40 ± 0.85a0.011
stem+ sheath5.48 ± 0.38d8.09 ± 0.52c12.36 ± 0.48a10.80 ± 0.37b11.18 ± 0.36ab<0.001
glume+spike-stalk5.27 ± 0.48b11.68 ± 0.78a11.97 ± 0.85a13.97 ± 0.49a14.21 ± 1.60a<0.001
grain33.92 ± 1.56c41.23 ± 1.49b53.17 ± 0.30a54.15 ± 2.47a57.21 ± 2.75a<0.001
straw16.37 ± 0.26c35.56 ± 2.86b39.57 ± 2.12ab43.30 ± 1.72a39.61 ± 1.03ab<0.001
aboveground 45.72 ± 0.87c74.31 ± 2.92b88.17 ± 2.96a90.86 ± 0.29a88.23 ± 1.75a<0.001
GY (kg ha−1)1473.00 ± 30.20c1734.40 ± 104.91b2117.50 ± 74.05a2209.07 ± 73.88a2204.97 ± 30.09a<0.001
NUE (%)27.19 ± 2.70a27.73 ± 3.53a23.79 ± 1.47ab17.02 ± 1.00b0.045
a N0, non-N-fertilized control; N52.5, N105, N157.5, N210, annual N fertilizer application at 52.5, 105.0, 157.5, and 210.0 kg ha−1, respectively. b Values are means of three replicates ± standard error. Within a column, means followed by different letters are significantly different p < 0.05.
Table 3. Alpha diversity indices of the soil bacterial community as affected by nitrogen fertilizer.
TreatmentPD Whole TreeChao1Goods CoverageObserved SpeciesShannonSimpsonOTUs
N0100.2 ± 0.1b3696.0 ± 55.1ab1.0 ± 0.0a2921.8 ± 35.1ab9.9 ± 0.0a1.0 ± 0.0a3054.3 ± 18.1bc
N52.598.8 ± 0.2c3729.6 ± 28.7ab1.0 ± 0.0a2940.1 ± 26.9ab9.9 ± 0.0a1.0 ± 0.0ab3112.3 ± 60.5ab
N105101.9 ± 0.4a3807.6 ± 51.2a1.0 ± 0.0a3016.0 ± 17.5a9.9 ± 0.0a1.0 ± 0.0ab3207.7 ± 29.7a
N157.599.4 ± 0.2bc3629.6 ± 17.5b1.0 ± 0.0a2914.7 ± 32.2ab9.9 ± 0.0a1.0 ± 0.0ab3095.3 ± 35.4abc
N21097.4 ± 0.5d3628.1 ± 23.1b1.0 ± 0.0a2874.9 ± 57.6b9.8 ± 0.1a1.0 ± 0.0b2963.0 ± 46.8c
ANOVA p-value<0.0010.0380.4750.1650.2810.1470.021
N0, non-N-fertilized control; N52.5, N105, N157.5, N210, annual N fertilizer application at 52.5, 105.0, 157.5, and 210.0 kg N ha−1, respectively; PD whole tree, phylogenetic diversity index; OTUs, operational taxonomic units (97% similarity). Values are means of three replicates ± standard error. Within a column, means followed by different letters are significantly different at p < 0.05.
Table 4. Pearson’s correlation coefficients for correlations of soil properties, leaf area index (LAI), grain yield (GY), and nitrogen use efficiency (NUE) of wheat with soil bacterial alpha diversity indices.
Dependent Variable PD
Whole Tree
Chao1Goods
Coverage
Observed
Species
ShannonSimpsonOTUs
pH0.2460.144−0.3180.1700.3170.539 *0.000
TN (g kg−1)0.2830.3690.0510.3490.394−0.1680.402
NH4 (mg kg−1)−0.585 *−0.582 *0.468−0.487−0.571 *−0.377−0.469
NO3 (mg kg−1)−0.468−0.527 *0.411−0.335−0.404−0.320−0.361
TP (g kg−1)0.090−0.019−0.4400.3370.054−0.1810.059
AP (mg kg−1)0.2440.371−0.1700.336−0.076−0.3430.385
SM (%)0.2730.073−0.0180.1620.0610.3150.273
LAI−0.522 *−0.3030.337−0.205−0.319−0.524 *−0.119
GY (kg ha−1)0.2040.258−0.1210.3230.225−0.1810.555 *
NUE (%)0.5180.368−0.1440.4270.4620.3810.657 *
TN, soil total nitrogen; NH4, soil ammonium; NO3, soil nitrate; TP, soil total phosphorus; AP, soil available phosphorus; SM, soil moisture; PD whole tree, phylogenetic diversity index; OTUs, operational taxonomic units (97% similarity). Correlation coefficients followed by * are significant at p < 0.05.

