Article

The Adaptability of APSIM-Wheat Model in the Middle and Lower Reaches of the Yangtze River Plain of China: A Case Study of Winter Wheat in Hubei Province

1
MARA Key Laboratory of Crop Ecophysiology and Farming System in the Middle Reaches of the Yangtze River, College of Plant Science and Technology, Huazhong Agricultural University, Wuhan 430070, China
2
National Key Laboratory of Crop Genetic Improvement, Huazhong Agricultural University, Wuhan 430070, China
*
Author to whom correspondence should be addressed.
Agronomy 2020, 10(7), 981; https://doi.org/10.3390/agronomy10070981
Submission received: 20 June 2020 / Revised: 3 July 2020 / Accepted: 3 July 2020 / Published: 8 July 2020
(This article belongs to the Special Issue Climate Change, Agriculture, and Food Security)

Abstract

:
The middle and lower reaches of the Yangtze River (MLYR) plain represent the second-largest wheat producing area in China; the winter wheat-rice system is one of the main planting systems in this region. The use of the agricultural production system simulator (APSIM)-wheat model to simulate wheat production potential and evaluate the impact of future climate change on wheat production in this region is of great importance. In this study, the adaptability of the APSIM-wheat model in the MLYR was evaluated based on observational data collected in field experiments and daily meteorological data from experimental stations in Wuhan, Jingmen, and Xiangyang in Hubei province. The results showed significant positive relationships between model-predicted wheat growth duration from sowing to anthesis and maturity and the observed values, with coefficients of determination (R2) in ranges of 0.90–0.97 and 0.93–0.96, respectively. The normalized root-mean-square error (NRMSE) of the simulated growth durations and measured values were lower than 1.6%, and the refined index of agreement (dr-values) was in the range of 0.74–0.87. The percent mean absolute relative error (PMARE) was cited here as a new index, with a value below 1.4%, indicating that the model’s rating was excellent. The model’s performance in terms of grain yield and above-ground biomass simulation was also acceptable, although it was not as good as the growth periods simulation. The R2 value was higher than 0.75 and 0.72 for the simulation of grain yield and biomass, respectively. The indices NRMSE and PMARE were lower than 19.8% and 19.9%, and the dr-value was higher than 0.71. According to our results, APSIM-wheat was an effective and accurate model for simulating the phenology and yield production processes of wheat in the MLYR, and the results also provided a theoretical basis and technical support for further research on the yield potential of wheat-rice rotation planting systems with clarification of the key factors limiting the yield gap in this region.

1. Introduction

In China, more than 50% of the population is mainly fed by wheat, and with less and less arable land being available, further improvement in wheat production per area is crucial to ensure China’s food security [1,2]. The middle and lower reaches of the Yangtze River (MLYR) plain represent the second largest wheat producing area in China, and the wheat-rice rotation system is one of the main planting systems used in this region [3]. The rice soil in the alluvial plain of the MLYR has a high organic matter content, sufficient fertility, and optimum thermal momentum, solar radiation, and water, which is conducive to the growth of wheat [3,4]. According to data from the National Bureau of Statistics, the sown area and total output of wheat in this region are 6.385 × 10⁶ ha and 3.307 × 10⁷ t, respectively, accounting for approximately 26.3% and 25.2% of the total planted area and a total output of wheat in China, respectively, in 2018 [5]. In addition, with the continuing shortage of water resources in the north plain of China, the importance of wheat production is becoming increasingly prominent in the MLYR plain.
Much research has been completed by agricultural scientists to continuously improve the grain yield of winter wheat in the MLYR plain in recent years [6,7,8]. It has been reported that the average wheat yield increased from 3.2 to 4.9 t ha−1 from 1985 to 2018, and it has reached more than 9.0 t ha−1 in high-yield experiments [5,9]. The yield potential, yield gap, ways to further improve the wheat grain yield, and the influence of climate change on wheat production in this region remain unknown. Therefore, it is important to develop crop models to simulate the growth and yield formation process of wheat in this region to predict the current grain yield potential as well as future wheat yield trends and to provide breeding suggestions and cultivation guidance to further improve the wheat yield in this region. It is well known that cultivars and crop management, such as cropping systems, fertilizer and irrigation regimes, sowing date, often vary widely due to the differences in climate conditions and soil type among regions. Thus, the first step, which is the most important task when experimenting with models, is the testing of their performance under new circumstances to identify their scope of validity and limitations [10,11].
The agricultural production system simulator (APSIM) was developed by Agricultural Production System Research Unit (APSRU), a collaborative group made up of the Commonwealth Scientific and Industrial Research Organization (CSIRO) and Queensland State Government agencies [10,12]. APSIM-wheat was developed to simulate biophysical processes in farming systems, in particular, where there is interest in the economic and ecological outcomes of management practice in the face of climatic risks [12]. At present, it has been well verified and applied in many countries and regions around the world, such as in the Mediterranean climate zone of Australia [13,14], the temperate continental climate zone of the United States [15], and the tropical humid climate zone of some southeast Asian countries [16].
Since the early 2000s, the research and application of the APSIM-wheat model in China have gradually increased, mainly in the Northeast, Northern, and Northwest of China, and also in the Southwest of China, and these studies have shown that the APSIM-wheat model has a wide range of adaptability in the above regions [17,18,19]. However, the climate conditions, soil types, cropping systems, and wheat cultivars of the MLYR are quite different from the above regions. In the MLYR, there is abundant precipitation and high average temperature, with average values higher than 500 mm and 12.0 °C, respectively, during the wheat growing season, and wheat-rice continuous is the main wheat cropping system. Based on the successful practice of the APSIM-wheat model, mainly in winter wheat planting zones around the world, especially in China, this study was conducted in Hubei province, an area with the typical climatic features and use of wheat-rice continuous cropping system (wheat was planted after rice harvest) of MLYR. The APSIM-wheat model was calibrated and validated for the first time in this region using data on winter wheat grain yield development in field experiments over many years, as well as meteorological data collected during these periods. The aim of the study was to evaluate the utility and adaptability of the APSIM-wheat model in this region, provide a theoretical basis and technical support for further research on the yield potential of the winter wheat-rice planting system in the MLYR, and clarify the key limiting factors in the yield gap.

2. Materials and Methods

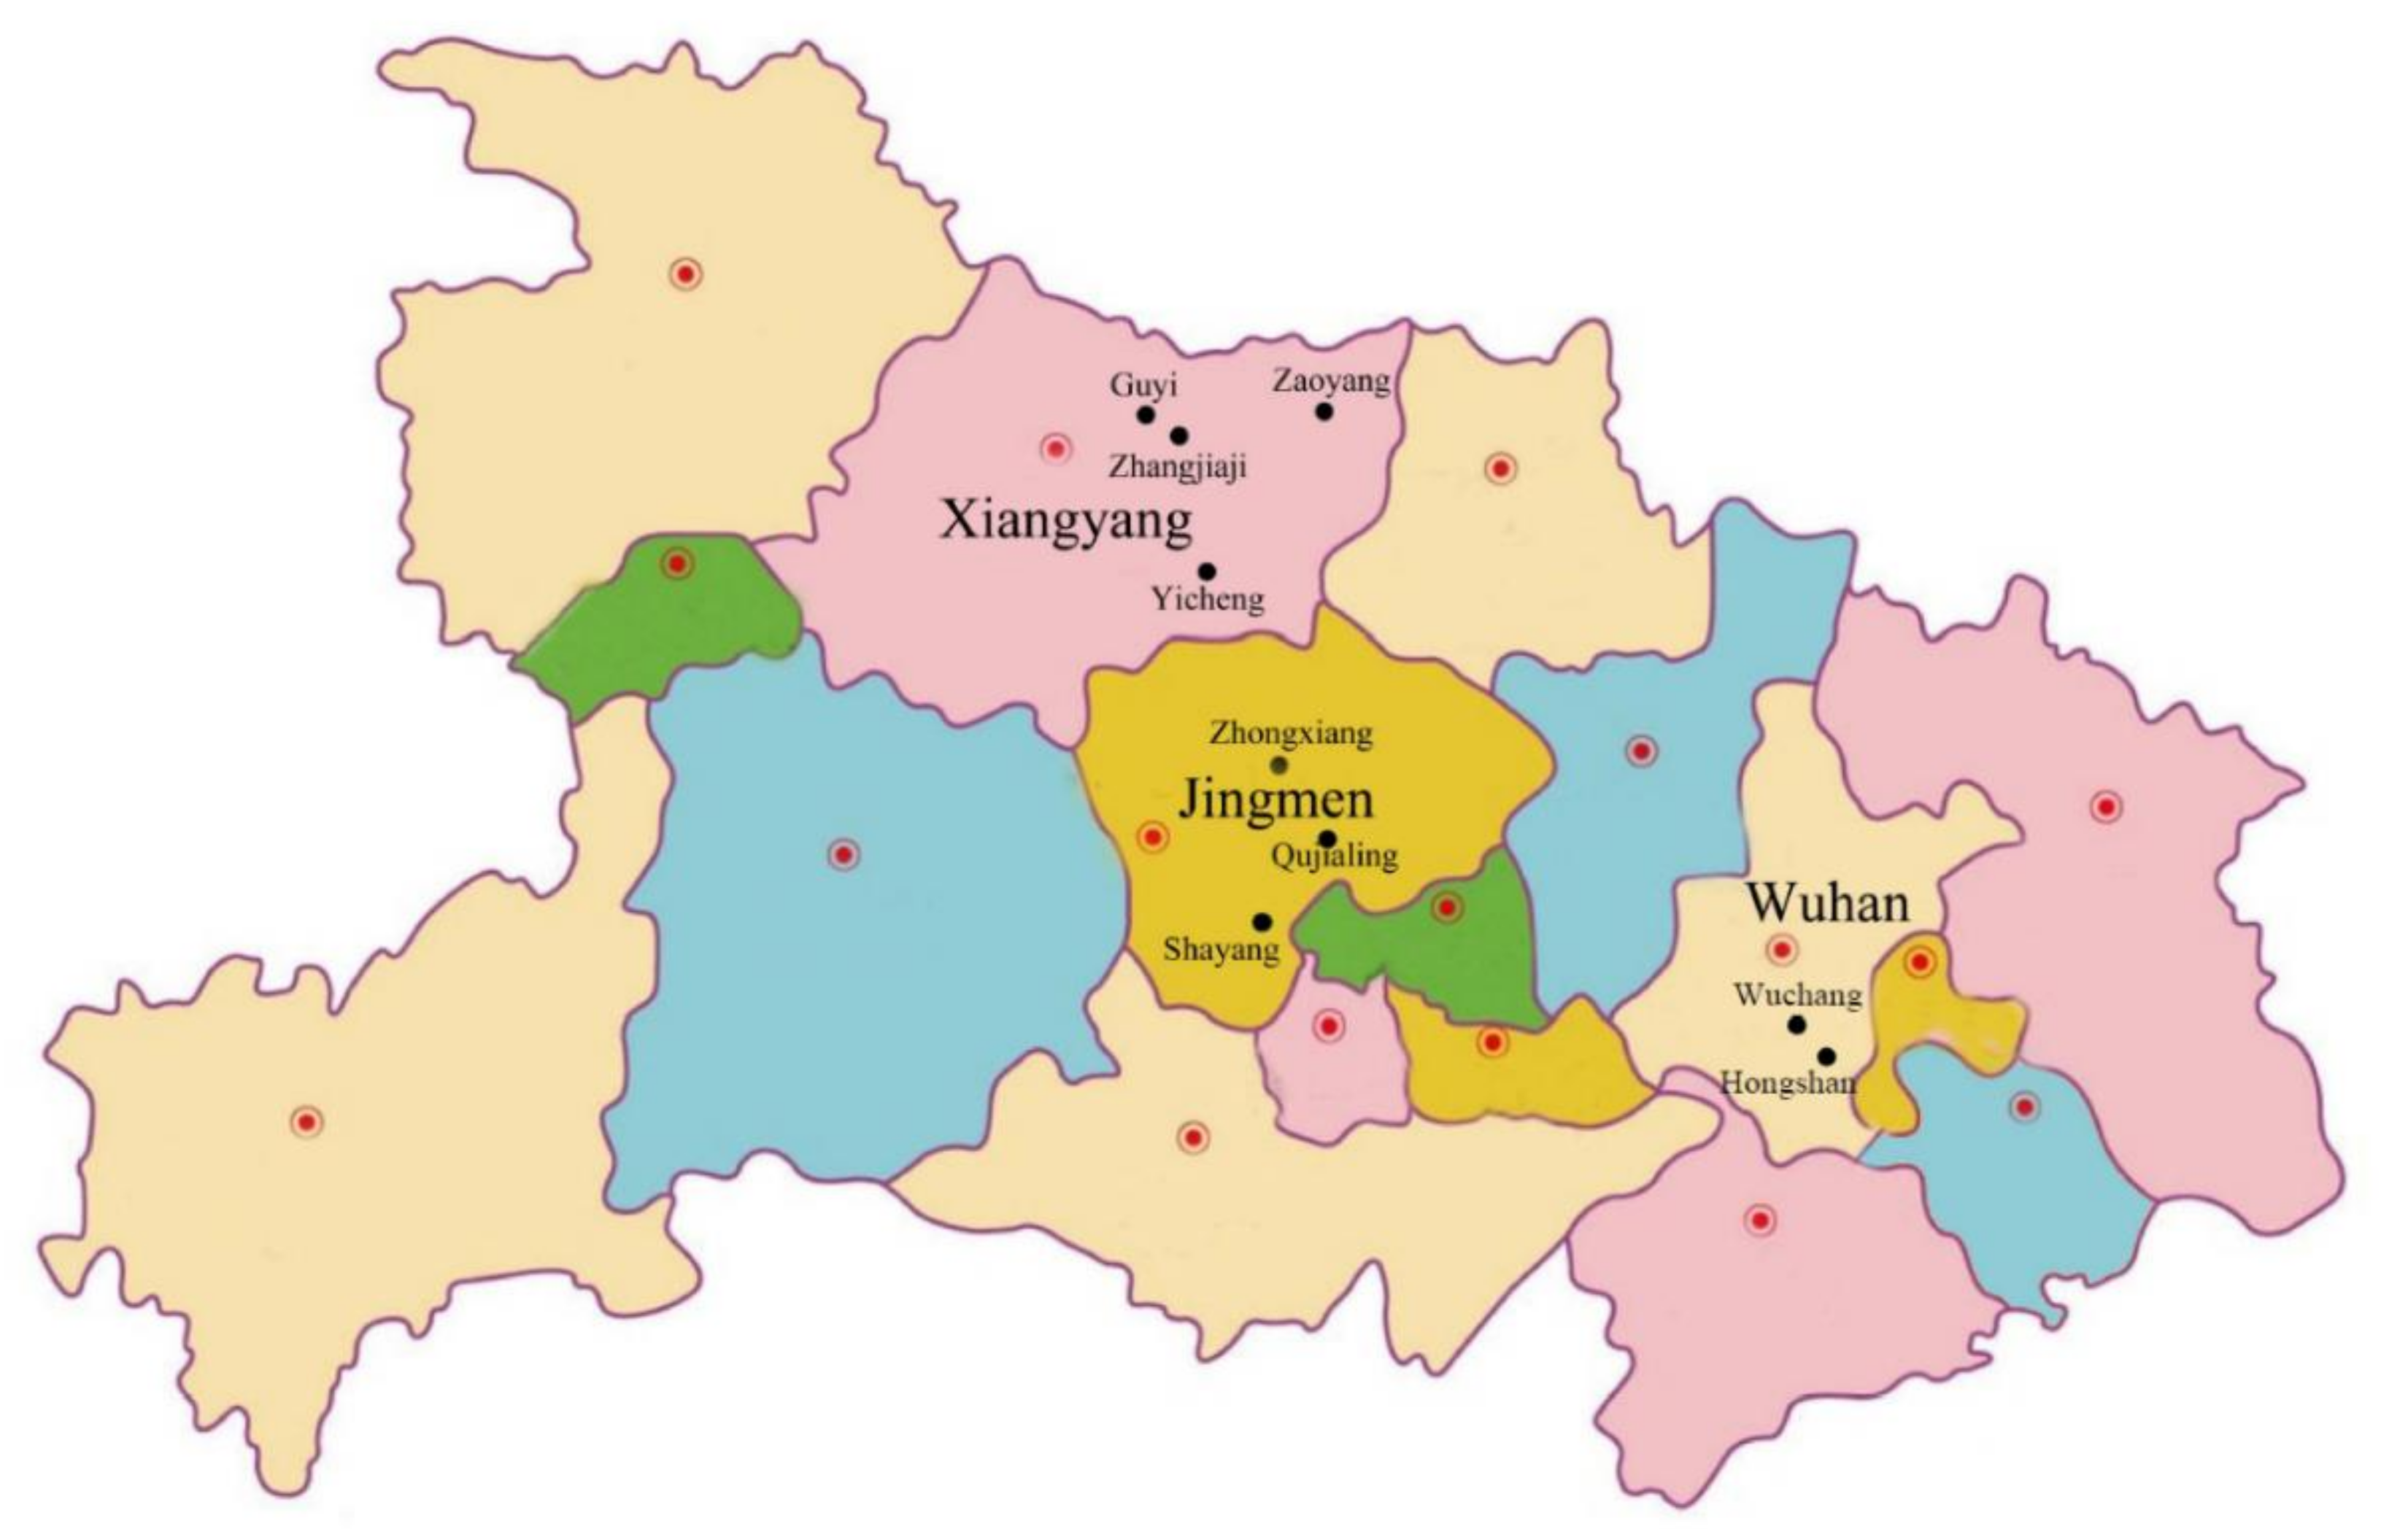
2.1. Experimental Site

Hubei province (29°01′–33°6′N, 108°21′–116°07′E) is located in the central part of China, and its environment is representative of the typical conditions in the MLYR plain. The area exhibits a subtropical monsoon humid climate with annual average sunshine hours of 1754–1910 h, an annual average accumulated temperature (≥0 °C) of 5266-8372 °C d, abundant precipitation in the wheat-growing season, and annual average precipitation of more than 1000 mm. These are superior agricultural production conditions and are conducive to achieving a good crop yield. In this paper, three winter wheat production regions were selected (Figure 1), namely, Wuhan (WH), Jingmen (JM), and Xiangyang (XY), where the winter wheat growth areas account for over 70% of the total wheat planting area in Hubei province.

2.2. Data Source

In terms of weather data, records of daily maximum and minimum temperatures, sunshine hours (or daily solar radiation), and precipitation were available from 1999 to 2016 at each experimental weather station and the National Meteorological Information Center (CMDC, http://data.cma.cn/en). As actual solar radiation measurements were not available for most of the stations, the daily solar radiation was estimated from the sunshine hours using the Angstrom formula [20].
For experimental data, information on winter wheat phenology aspects (such as sowing, emergence, jointing, anthesis, maturity dates, cultivar type, yield, and biomass) and management practices (such as planting density and fertilizer) was obtained from each experimental site (previous field experiment or local agricultural technology extension center) and from the literature (listed in Table 1). Management details of each experimental site can be found in Supplementary Materials (Tables S1 and S2). Crop management practices at each experiment site were generally the same as, or better than, the local traditional practices [21]. The wheat varieties planted at each site are also listed in Table 1. These were widely used in each province during the planting years.
Regarding soil data, the soil bulk density (BD), saturated volumetric water content (SAT), drained upper limit (DUL), 15-bar lower limit (LL15), soil organic carbon (SOC), and pH value (pH) in different soil layers were obtained from the China Soil Scientific Database (CSSD, http://www.soil.csdb.cn), the dissertation of Sun [22] and our previous measurements.

2.3. APSIM-Wheat Model

The APSIM-wheat model used in this study includes the crop-wheat, soil, surface organic matter (OM), and manager modules. The model operates on a “daily” time step and simulates daily crop development, biomass production, soil moisture, and nitrogen dynamics as affected by the climate and management measures.
Crop ontogeny aspects, such as daily biomass and yield production, are simulated by the relationships among crop growth, temperature, and photoperiod [33]. Crop biomass accumulation depends on the solar radiation interception (RI) and radiation use efficiency (RUE), taking full account of the effects of water and nitrogen constraints. RI and RUE related to the leaf area in this model, and the leaf area is calculated by the increase in the leaf dry weight and the maximum specific leaf area (SLAmax), which is related to the leaf area index (LAI), so a function (SLAmax = hSLA (LAI)) is defined by the parameters x_lai and y_sla_max in the APSIM-wheat model [12]. Crop development is primarily based on thermal time, whereas leaf and stem growth rates are calculated depending on phenological stages. The soil water module includes the lower limit (LL15), the drained upper limit (DUL), and the saturated (SAT) volumetric water contents of a sequence of soil layers. Further detailed descriptions of the APSIM-wheat model structure and processes were described by Keating et al. [12] and are available at the following website: http://www.apsim.info.

2.4. Calibration and Validation of the APSIM-Wheat Model

The data for the winter wheat growth period, leaf area index, above-ground biomass at anthesis and maturity, grain yield, yield components, winter wheat management at all stages, soil water, and nutrients content at a soil depth of 0–240 cm with 15 cm per layer were collected from the Wuhan, Jingmen, and Xiangyang experiment regions from 1999 to 2016. The database was divided into two parts (Table 1): one was used to calibrate the genetic parameters of the four wheat varieties (Zhengmai9023, Emai596, Emai18, and Emai170), and the other one was used to validate the utility and adaptability of the calibrated model.
In this study, the crop variety parameters for calibration, such as sensitivity to vernalization, sensitivity to the photoperiod, the thermal time required from grain filling to maturity, the number of grains per gram of stem, the potential grain filling rate, and the maximum specific leaf area, are shown in Table 2. A trial-and-error method was used to identify the optimal parameters of the three varieties. The growth periods from sowing to anthesis and sowing to maturity were mainly calibrated by the sensitivity to vernalization, the sensitivity to the photoperiod, and the thermal time required from grain filling to maturity. The grain yield and above-ground biomass were mainly calibrated via the number of grains per gram of stem, the potential grain filling rate. A maximum specific leaf area was used to adjust the leaf area index (LAI) during the growing season.

2.5. Evaluation of the Model’s Performance

The coefficient of determination (R2), root mean square error (RMSE), normalized root mean square error (NRMSE), Willmott’s refined index of agreement (dr-value) [34], and percent mean absolute relative error (PMARE) [35] were used to evaluate the utility and adaptability of the calibrated model. R2 can reflect the consistency between simulated and observed values—the closer to 1, the better the performance is. The RMSE and NRMSE reflect the relative error and absolute error between simulated and observed values—the smaller the value, the better the performance is. The dr-value (in the range of −1 to 1) indicates the sum of the magnitudes of the differences between the model-predicted and observed deviations of the observed mean relative to the sum of the magnitudes of the perfect-model and the observed deviations of the observed mean [34]. The PMARE directly indicates the strengths or weaknesses of the simulation and thus helps to decide whether to accept or reject the model. The suggested performance rating for model evaluation based on the PMARE is listed in Table 3 [35].
The equations are listed below:
RMSE = 1 n i = 1 n P i O i 2
NRMSE % = RMSE O ¯ × 100 %
d r = 1 i = 1 n A bs ( P i O i ) c × i = 1 n A b s ( O i O ¯ ) ,   w h e n   i = 1 n A bs ( P i O i ) c × i = 1 n A b s ( O i O ¯ ) c × i = 1 n A b s ( O i O ¯ ) i = 1 n A bs ( P i O i ) 1 ,   w h e n   i = 1 n A bs ( P i O i ) > c × i = 1 n A b s ( O i O ¯ )
PMARE % = 100 n i = 1 n A b s P i O i O i
where P i and O i are the predicted (or simulated) and the observed value, respectively; O ¯ is the mean of the observed values; n is the number of observed values.

2.6. Statistical Analysis of the Data

The weather (including daily maximum and minimum temperatures, sunshine hours (or daily solar radiation), and precipitation) and crop management (such as sowing date, irrigation, nitrogen application, and so on) data were compiled in Excel (Microsoft Office Professional Plus 2010, Microsoft Corporation, WA, USA) and then used to calibrate the model and simulate the phenology, grain yield, and above-ground biomass of each variety at the three experimental sites. Regression analyses between simulated and measured values were performed using, t 12.5 software (Systat Software, Inc, San Jose, CA, USA).

3. Results

3.1. Genetic Parameters of Each Variety for the APSIM-Wheat Model

A “trial-and-error” method was used to determine the genetic parameters of Zhengmai9023, Emai596, Emai18, and Emai170 for the APSIM-wheat model (Table 4). The sensitivity to vernalization and the photoperiod ranged from 2.4 to 3.5 and 2.5 to 3.6, respectively, with the values from Zhengmai 9023 being the highest. The thermal time required from grain-filling to maturity of Zhengmai 9023 was 650 °C d, which was higher than that of the other varieties, and the value from Emai596 was the lowest, accumulating only 520 °C d. The number of grains per spike was over 28 for all varieties, and the potential grain filling rate reached to 0.0031 g grain−1 d−1. The maximum specific leaf area ranged from 21,000 to 25,000 mm2 g−1 when ΔLAI (x_lai = 0), and from 18,000 to 23,000 mm2 g−1 when x_lai = 5.

3.2. Performance of the Calibrated APSIM-Wheat Model

Wheat growth duration, grain yield, and above-ground biomass data were used to validate the performance of the calibrated APSIM-wheat model. Relative data came from the “validation part” shown in Table 1. The data from the “calibration part” were not included because they were used to calibrate the model, but they can be found in the Supplementary Materials (Figure S1 and Table S3).

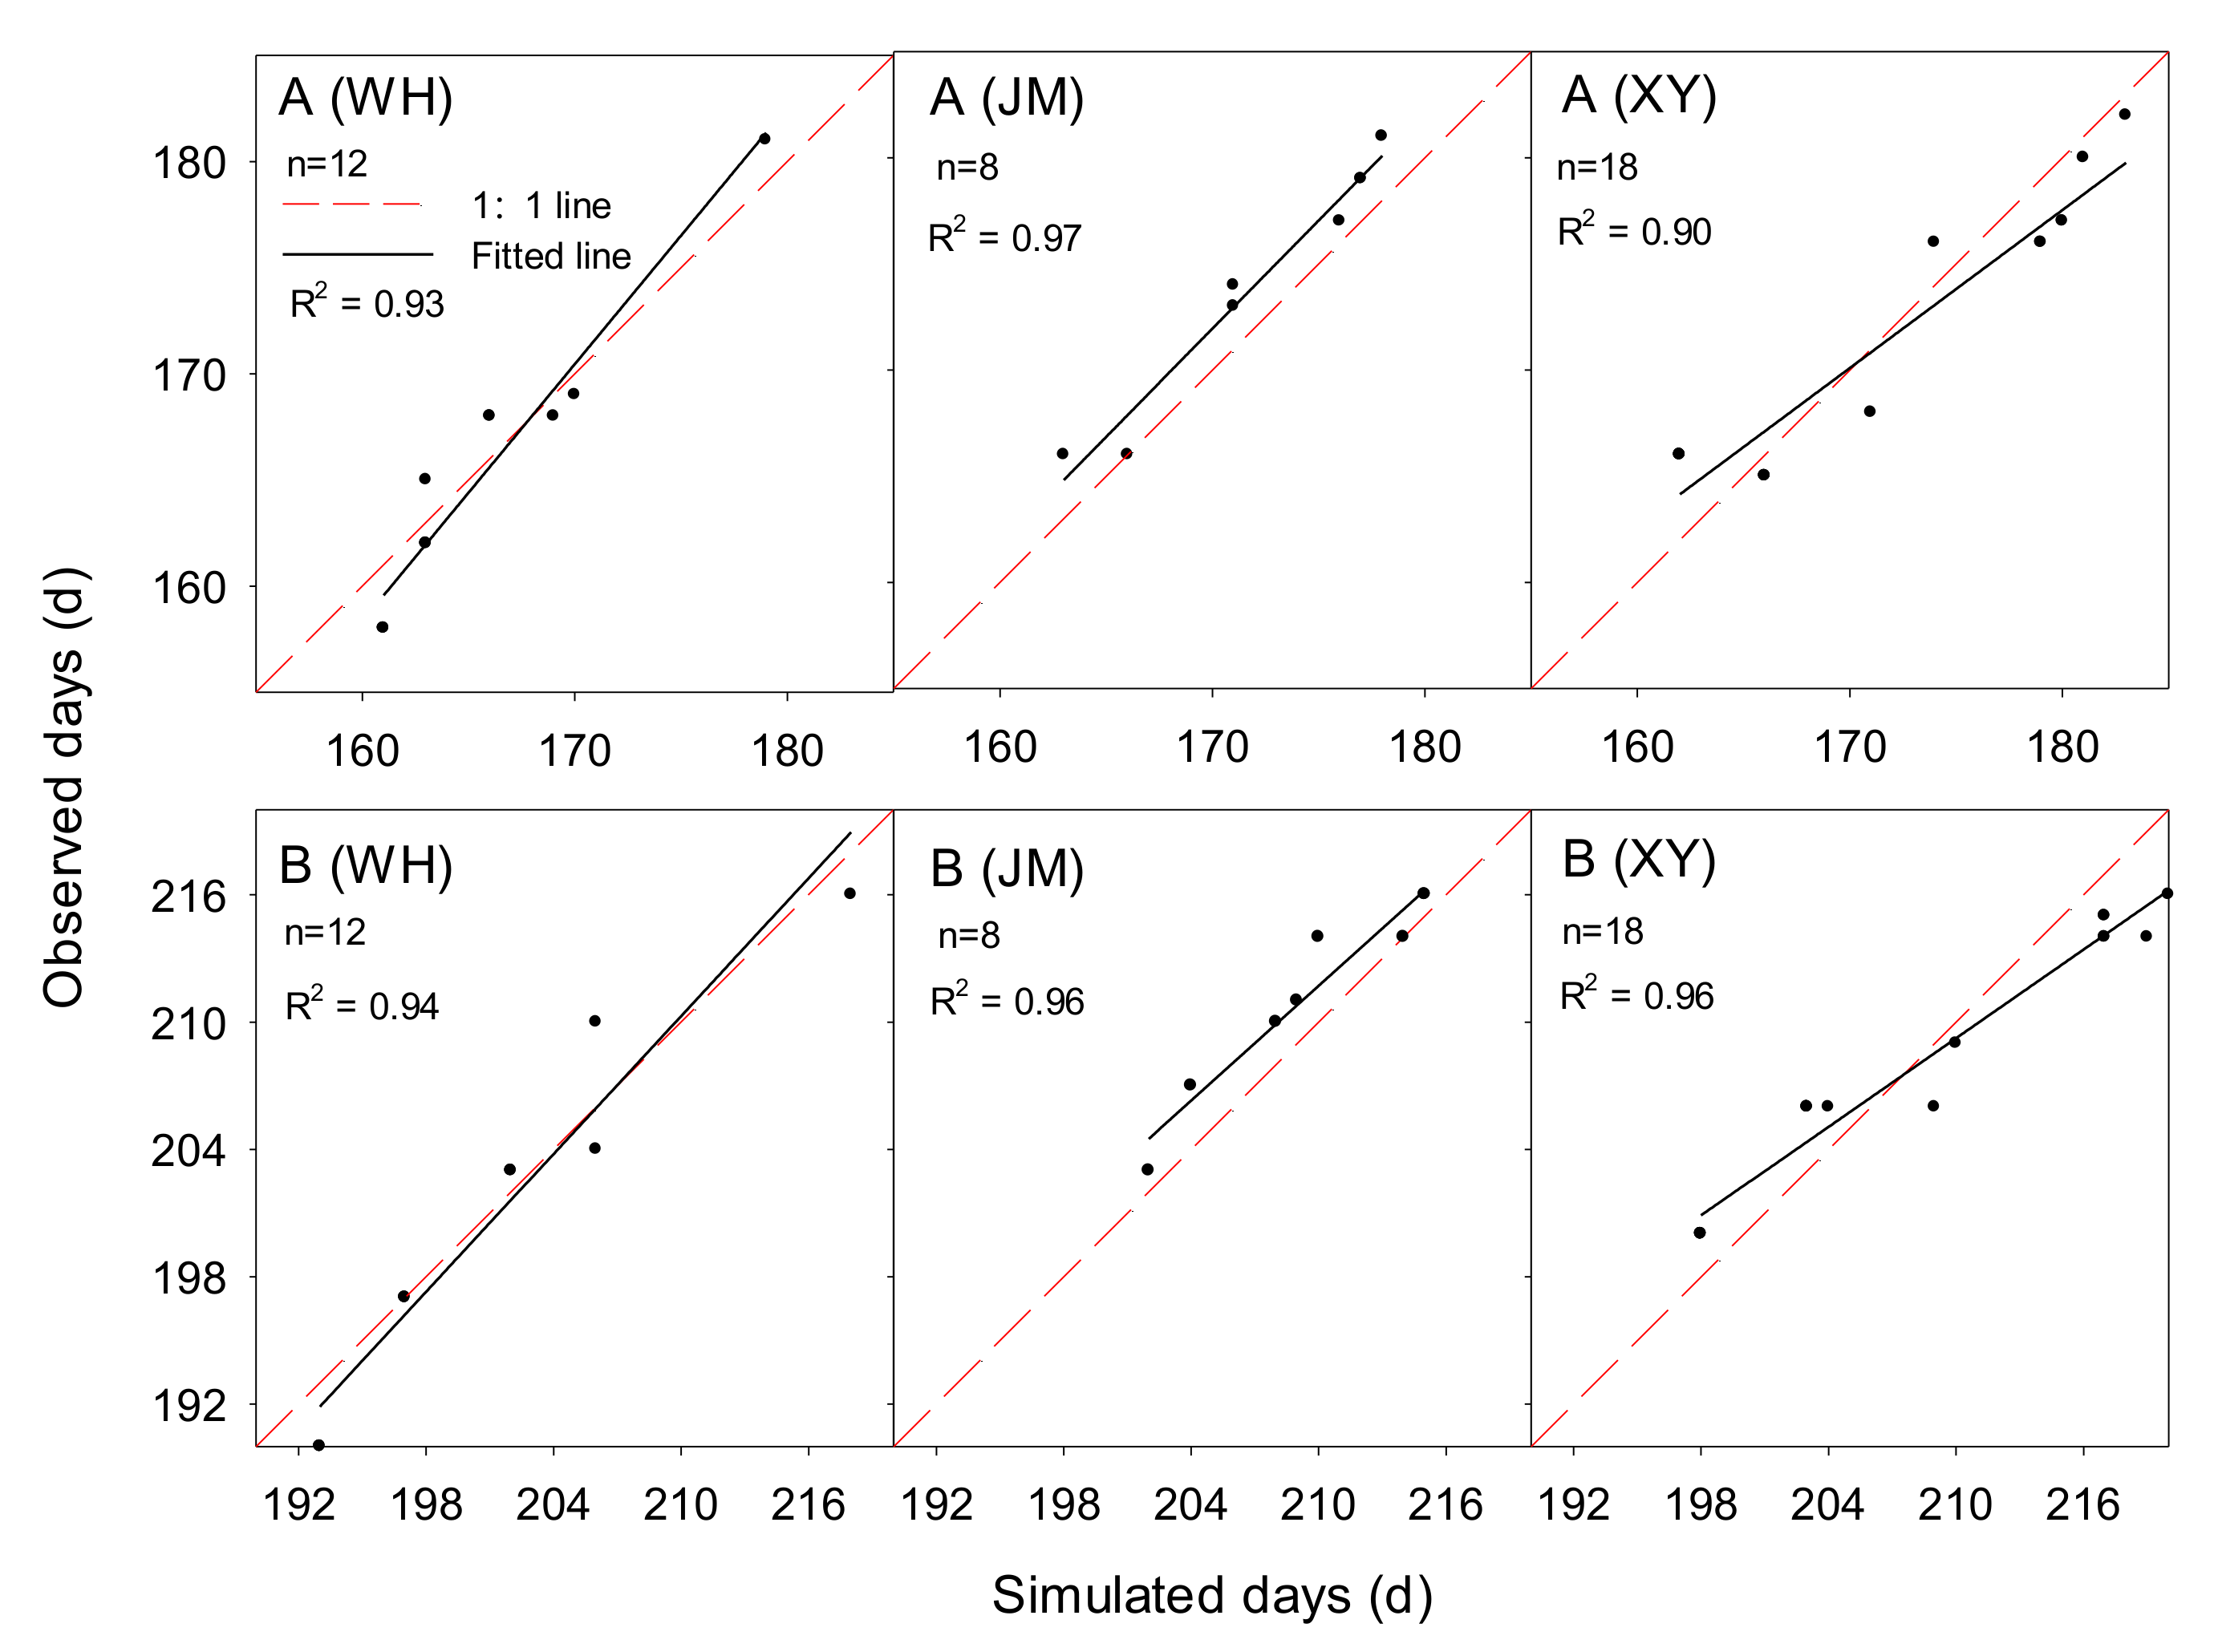
3.2.1. Wheat Growth Duration

The simulated wheat growth duration in Wuhan, Jingmen, and Xiangyang was significantly positively correlated with the measured values (Figure 2 and Table 5), with the coefficient of determination (R2) for the duration from sowing to anthesis being over 0.90. The NRMSE values between the simulated and observed values of the experimental sites in Wuhan, Jingmen, and Xiangyang were low at 1.2%, 1.3%, and 1.6%, respectively, and the dr-values were high at 0.81, 0.78, and 0.79, respectively. The R2 values between the simulated and observed durations from sowing to maturity ranged from 0.93 to 0.96, with the NRMSE values being 1.1%, 1.0%, and 1.3%, and dr-values being 0.87, 0.76, and 0.74, in Wuhan, Jingmen, and Xiangyang regions, respectively. The PMARE values ranged from 0.8 to 1.4, in the range of an excellent model rating. According to the comparison between the simulated results and the measured values, the mean difference in wheat growth duration at the three test regions was within three days (Table 6). This showed that the APSIM-wheat model provided an excellent simulation performance during the determination of the growth duration of winter wheat in the middle and lower reaches of the Yangtze River plain of China.

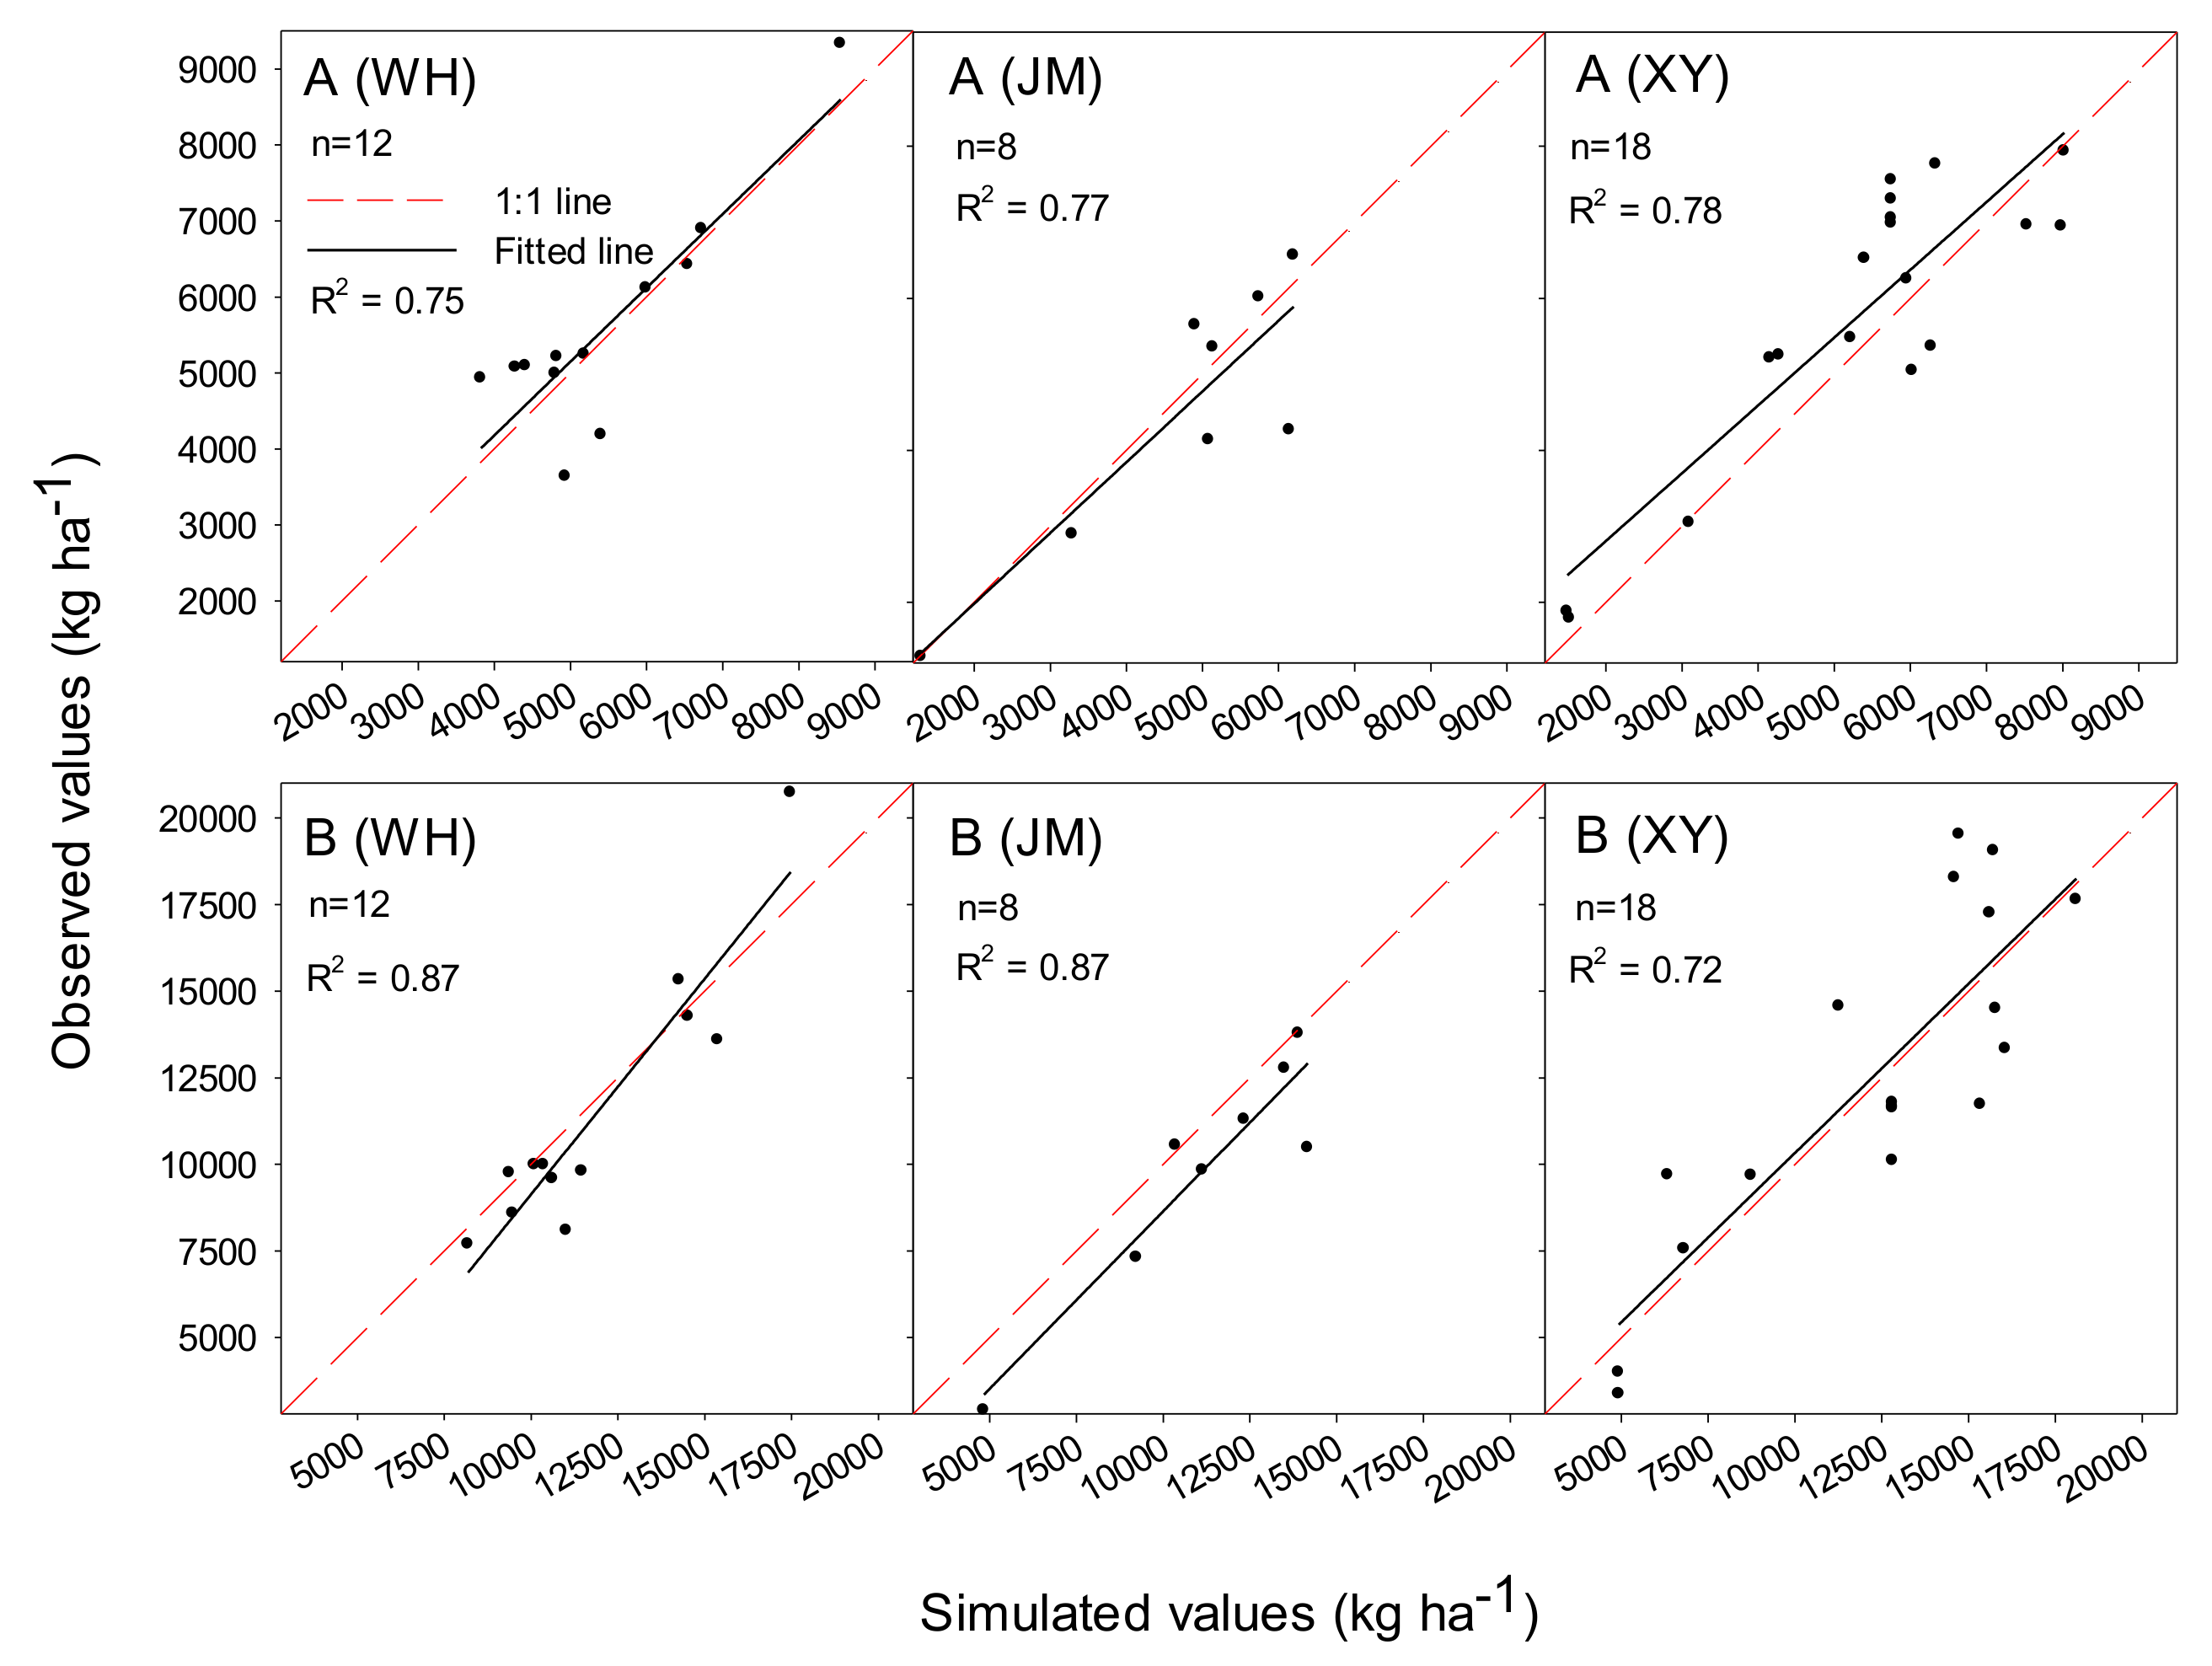
3.2.2. Grain Yield and Above-Ground Biomass

The crop grain yield and above-ground biomass were the key indices used to evaluate the utility of the suggested model. Significant positive relationships between the simulated and observed values of wheat grain yield and above-ground biomass at three experimental regions in Wuhan, Jingmen, and Xiangyang were observed with the R2 values of 0.75–0.78 for the grain yield 0.72–0.87 for the above-ground biomass (Figure 3 and Table 7). The NRMSE values for the simulated and observed values of grain yield were 13.0%, 18.1%, and 17.1%, and the dr-values were 0.73, 0.78, and 0.71 in the above experimental regions. The NRMSE values for the simulated biomass and the observed values were 13.5%, 17.7%, and 19.8%, and the dr-values were 0.80, 0.71, and 0.72 in the above experimental regions. Thus, the NRMSE values for the wheat grain yield and above-ground biomass in the three trial regions were all less than 20%, and the dr-values were all above 0.71, and the mean differences between the simulated and observed wheat grain yield and above-ground biomass were lower than 556 and 1323 kg ha−1, respectively (Table 6). Meanwhile, the PMARE values ranged from 10.6% to 19.9% in most of the model equations performed, which were in the range of either good or fair (Table 3). This indicated that the APSIM-wheat model could simulate the grain yield and biomass of winter wheat in the middle and lower reaches of the Yangtze River plain well and could effectively and accurately simulate the wheat yield formation process in this region.

4. Discussion

The APSIM model simulates the multi-parameter interactions of soil, crops, meteorology, etc., but it takes soil as the center and fully considers the impacts of intercropping and rotation on the soil. It has been well applied in different planting systems in Australia, America, The Netherlands, New Zealand, Germany, and other parts of the world [13,14,15,16]. Seyoum et al. used the APSIM model to examine G × E × M interactions for maize improvement in Ethiopia and found that the model accurately predicted plant-available soil water, days-to-flowering, days to maturity, the leaf area index, biomass, and the yield of maize [36]. Makowski et al. concluded that the APSIM-wheat model could predict phenological stages, like anthesis and maturity, at values close to the observed values [37]. In China, the APSIM-wheat model has been used in the Northeast, Northern, Northwest, and Southwest regions of China to simulate crop growth processes and evaluate the effect of climate change on crop production. This should indicate that the APSIM-wheat model could be used to reproduce the observed crop growth, yield, potential yield, and water use in the study areas [38,39]. The MLYR plain is located in the middle of China and is the second-largest wheat producing area. Wheat production in this region is risky because of the high climatic variability in recent years. Therefore, effective and accurate models are urgently needed to study the wheat growth, development, and yield in response to climate variability in this region.
The APSIM-wheat model was used for the first time and evaluated winter wheat in wheat-rice continuous cropping systems in the MLYR plain in this study. Accurate phenology is the priority when calibrating crop models [40]. The phenology of wheat has a strong influence on the development and grain yield of the crop [41]. Simulation outcomes from the APSIM-wheat model in our study showed that this model could be used as a suitable tool for the selection of appropriate cultivars and to investigate the effect of climate variability on wheat growth and yield [11]. Li et al. found a good agreement between values simulated by the APSIM-wheat model and the observed values for the flowering and maturity dates, yield, and biomass in the North plain of China, with R2 values in the range of 0.72–0.86, the d-values of 0.90–1.00, and RMSE values of 1.10–3.95 d, respectively, for the observed growth periods. The simulated yields were close to the observed yields, with R2 > 0.79, d-values > 0.90, and NRMSE < 13.4%, respectively [39]. We used the same genetic parameters of Zhengmai9023, which were obtained by Li et al. [39] in the North plain of China to validate the APSIM-wheat performance in Xiangyang (to represent MLYR). The poor performance of APSIM-wheat was observed for the simulation of the growth to maturity duration (with 187 d and 216 d for the simulated and observed values, respectively) and grain yield (with 2965 and 7936 for the simulated and observed values, respectively). This indicated that the genetic parameters of Zhengmai9023 from the North plain China could not be used in the model to simulate yield production in the MLYR. Therefore, it was important to calibrate and validate the APSIM-wheat model before it was adopted in a new environment or region. In this study, the calibrated APSIM-wheat model was shown to predict the phenological stages well in the MLYR plain of China. For instance, the predicted values for the sowing date to anthesis and sowing to maturity were close to the values of observed data. The R2 values were all over 0.90, and the NRMSE values were all under 1.6% (Figure 2 and Table 5). The results of the simulations conducted with this model showed that the yield and biomass values were also close to the observed values (Figure 3, Table 6 and Table 7), with R2 > 0.72, dr-values > 0.71, and NRMSE < 19.8%, respectively. These results showed that process-based models had good potential to simulate crop biomass and yield production in the MLYR [42].
The use of logical, consistent, and generally accepted indicators is important when discussing the evaluation of the model procedure. The indicators should appropriately quantify the objectives of the model evaluation and indicate its utility. Fox recommended that the mean error, mean absolute error, variance of the distribution of difference, and root mean square error (R) or its square (R2) should be calculated and reported when evaluating the performance of models [43]. Willmott commented that the correlation between model-predicted and observed data, commonly described by Pearson’s product-moment correlation coefficient, that is R and R2, is an insufficient and often misleading measure of accuracy [34]. Ali et al. also reported that the difference-based (R, R2, RMSE, NRMSE), efficiency-based (Nash and Sutcliffe coefficient, model efficiency of Loague and Green, Legates and McCabe’s index) measures were found ambiguous, inconsistent, and not logical in many cases [35]. Thus, in addition to R2 and NRMSE, two new indices (dr-value and PMARE value) were cited and calculated in this study. The dr-value is intended to be a descriptive measure, and it is both a relative and bounded measure that can be widely applied in order to make cross-comparisons between models [34]. It was shown that the dr-values of the model-predicted wheat growth periods versus the measured values ranged from 0.74 to 0.87, with a mean value of 0.79, indicating the good performance of the model in terms of predicting the wheat growth period. Ali et al. also observed that PMARE always followed logical behavior and no ambiguous result [34]. The PMARE value could be used to evaluate model performance. For the growth periods of anthesis and maturity, the PMARE values indicated an excellent rating in this study (Table 3 and Table 4). In addition, the model‘s performance for grain yield (PMARE < 14.6%) and biomass (PMARE < 19.9%) produced values that were acceptable (Table 3 and Table 7) [35], although they were not as good as the growth period simulation.
Further analysis indicated significant positive relationships between the indicators PMARE and NRMSE, with the R’2 of 0.96 for the simulation values. Significant negative relationships were observed between PMARE and R2 and between NRMSE and R2, with the R’2 of 0.67 and 0.76, respectively. The index dr-value had no clear consistent correlation with the three other parameters, and this result was consistent with Willmott et al. [34] (Figure S2).
Quantitative predicting of the phenological period is of great significance for accurately simulating crop growth and productivity formation [44]. There are 11 phases in APSIM-wheat model, and the timing of phases after germination is determined by the accumulation of thermal time, which is adjusted by vernalization, photoperiod, and other factors, such as nitrogen, water. The length of each phase is determined by the thermal time target, and the next phenological stage occurs when an adjusted thermal time reaches the target thermal time. In the APSIM-wheat model (7.5 R3008 version), soil, water, nitrogen, and phosphorus stresses have no effect on phenological development, so the adjusted thermal time is determined by daily thermal time, vernalization, and photoperiod factors [45]. Thus, we decided to calibrate vernalization and photoperiod to predict these phases in this study, the same as some previous studies [39,46]. As mentioned above, the next phase will begin once an adjusted thermal time reaches the target thermal time. The target thermal time is a site-cultivar-special parameter, and we did not calibrate tt_end_of_juvenile and tt_floral_initiation in this study and only calibrated vernalization and photoperiod-related parameters for days so that anthesis would increase the chances of a less robust calibration and hence a lot of uncertainty in the model implementation, which would be explored in our next step.
Leaves are important organs for intercepting solar radiation and then producing dry matter for the whole plant. Simulating leaf area index (LAI) is one of the important output parameters for a crop growth simulation model [47,48]. In the APSIM-wheat model, the daily increase in leaf area is the minimum between stressed LAI and the carbon-limited LAI. The stressed LAI is determined by leaf number, leaf area, plant population, and environments, such as nitrogen, soil, water, and phosphorus stress factors. Leaf area related to carbon production is calculated by the increase in dry weight of leaf and the maximum special leaf area (sla-max); the sla-max is the maximum leaf area that can be expanded per gram of biomass, which regulates leaf area index and further regulates radiation interception, generating biomass with RUE [45]. In this study, we calibrated the sla-max to adjust LAI for wheat. The validation results showed that the simulated LAIs were close to observed values, the R2 was in the range of 0.85–0.98, NRMSE being from 6.9% to 12.5%. The slopes of the trend in LAI-observed over LAI-simulated for jointing, anthesis, and the whole data were 1.10, 0.93, and 0.96, respectively (Table S4 and Figure S3). This result indicated it was justifiable by using the values of sla-max in Table 4 to calibrate LAI. We also simulated LAIs at jointing and anthesis with the default values of sla-max in the APSIM-wheat model (Table S4 and Figure S3), and the results showed that the LAIs at jointing and anthesis were overestimated (slopes of a trend in LAI-observed over LAI-simulated were in the range of 0.37–0.48). In addition, the NRMSE was in the range of 28.6–36.5%, even though the p-values for the fitted lines were below 0.01, indicating a poor performance of APSIM-wheat on LAI with the default values of sla-max. Anyway, considering the calculation equation for LAI, it would be better to collect more data, including leaf number and leaf area, to improve the performance of the APSIM-wheat further in the next step.
A major source of uncertainty in our analysis may derive from the trial sites and cultivars chosen to calibrate the model [38]. In this study, only Hubei province was selected to test the performance of the APSIM-wheat model in the MLYR plain of China. Although this province has the typical subtropical climate conditions of this region, it still has its limitations in representing the varied topography and cropping systems of the region. Meanwhile, four representative cultivars, which are the main cultivars planted in Hubei province, were chosen as the experimental data to calibrate the model. More than 340 cultivars were released and introduced into the national seed market in China from 1984 to 2010 [39], and approximately 40% were planted in the MLYR plain. Another source of uncertainty may derive from the data from wheat trials coming from the literature and local agricultural technical departments. The data from the field experiment generally ignored the effects of diseases, insect pests, and weeds. This might have influenced the performance of the APSIM-wheat simulations. Therefore, in future research, we would expand the selection range of trial sites and wheat cultivars to further optimize the combination of model parameters and to improve the accuracy and reliability of the model. Then, it would be possible to use the validated model to simulate the yield potential in this region, and the researchers might be able to clarify the potential yield, yield gap, and key limiting factors across the MLYR and develop or optimize wheat production management to further improve grain yield. Furthermore, this model could be used to explore the wheat yield performance under conditions of future climate change, which would help breeders to select and breed varieties that could adjust to climate change. It would also help policymakers to develop methods to optimize the distribution of crops and varieties to ensure national food security.

5. Conclusions

The APSIM-wheat model was used to predict the wheat potential grain yield, yield gap, and yield production response to climate variability in the middle and lower reaches of the Yangtze River plain of China. The utility and adaptability of the model were evaluated and discussed in this study. Significant positive relationships were observed between the simulated and observed wheat growth durations, grain yield, and above-ground biomass. Meanwhile, some logical, consistent, and generally accepted indicators—the coefficients of determination, normalized root-mean-square error, refined index of agreement, and percent mean absolute relative error—were used to evaluate the performance of this model, and the results indicated that the APSIM-wheat model had an excellent performance for determining wheat growth periods and an acceptable performance for determining grain yield and above-ground biomass, although its performance was not as good as the growth period simulation. According to our results, using the APSIM-wheat model was an effective and accurate way to simulate the phenology and yield production process of wheat in the MLYR. The results also provided a theoretical basis and technical support for further research on the yield potential of a wheat-rice planting system and to clarify the key limiting factors related to the yield gap in this region.

Supplementary Materials

The following are available online at https://www.mdpi.com/2073-4395/10/7/981/s1, Figure S1: Relationships between simulated and observed growth duration from sowing to anthesis (A) and to maturity (B), grain yield (C), and above-ground biomass (D) of winter wheat with calibration dataset in Hubei province, Figure S2: Relationships between indices percent mean absolute relative error (PMARE), determination coefficients (R2), normalized root-mean-square error (NRMSE), and index of agreement (dr-value) for all simulations, Figure S3: Relationships between simulated and observed LAI at jointing and anthesis with sla-max values from Table 4 (a) and default sla-max in the APSIM-wheat model (b), Table S1: Details of nitrogen application rate and plant density of each experimental site for APSIM-wheat model calibration in Hubei province, Table S2: Details of nitrogen application rate and plant density of each experimental site for APSIM-wheat model validation in Hubei province, Table S3: The fitted equation for the linear relationships between model-simulated and observed growth duration, grain yield, and biomass with calibration dataset and reliability measures: coefficient of determination (R2), normalized root mean square error (NRMSE), refined index of agreement (dr), and percent mean absolute relative error (PMARE), Table S4: The fitted equation for the linear relationships between the model-simulated and observed LAI at jointing and anthesis and reliability measures: coefficient of determination (R2), normalized root mean square error (NRMSE). Cultivars are Zhengmai9023 and Emai596, data came from field experiment during 2015-2016 and 2016-2017 wheat seasons at Xiangyang and Wuhan.

Author Contributions

Conceptualization, P.Z., S.P., J.M.; Data Collection, P.Z., Y.Z., F.L.; Formal Analysis, P.Z., X.L., N.D.; Software, P.Z., X.L., N.D., J.M.; Supervision, S.P., J.M.; Validation, J.M.; Writing-original draft, P.Z.; Writing-review and editing, J.M. All authors have read and agreed to the published version of the manuscript.

Funding

This research was funded by the National Key Research and Development Program of China (2016YFD0300206, 2018YFD0301302), the National Natural Science Foundation of China (31601251), and the Fundamental Research Funds for the Central Universities (2662017QD038, 2662019QD020).

Acknowledgments

We thank all the authors involved in this research for their experimental data literacies.

Conflicts of Interest

The authors declare no conflict of interest.

References

  1. Yang, X.; Chen, F.; Lin, X.; Liu, Z.; Zhang, H.-L.; Zhao, J.; Li, K.; Ye, Q.; Li, Y.; Lv, S.; et al. Potential benefits of climate change for crop productivity in China. Agric. For. Meteorol. 2015, 208, 76–84. [Google Scholar] [CrossRef]
  2. Qin, X.; Zhang, F.; Liu, C.; Yu, H.; Cao, B.; Tian, S.; Liao, Y.; Siddique, K.H. Wheat yield improvements in China: Past trends and future directions. Field Crop. Res. 2015, 177, 117–124. [Google Scholar] [CrossRef]
  3. Li, H.; Liu, L.; Wang, Z.; Yang, J.; Zhang, J. Agronomic and physiological performance of high-yielding wheat and rice in the lower reaches of Yangtze River of China. Field Crop. Res. 2012, 133, 119–129. [Google Scholar] [CrossRef]
  4. Yi, Q.; He, P.; Zhang, X.Z.; Yang, L.; Xiong, G.Y. Optimizing Fertilizer Nitrogen for Winter Wheat Production in Yangtze River Region in China. J. Plant Nutr. 2015, 38, 1639–1655. [Google Scholar] [CrossRef]
  5. National Bureau of Statistics of China (NBSC). Agriculture, National Data; National Bureau of Statistics of China: Beijing, China, 2019. Available online: http://www.stats.gov.cn/tjsj/ndsj/2019/indexeh.htm (accessed on 15 February 2020).
  6. Tian, Z.; Jing, Q.; Dai, T.; Jiang, D.; Cao, W. Effects of genetic improvements on grain yield and agronomic traits of winter wheat in the Yangtze River Basin of China. Field Crop. Res. 2011, 124, 417–425. [Google Scholar] [CrossRef]
  7. Shi, Z.; Li, D.; Jing, Q.; Cai, J.; Jiang, N.; Cao, W.; Dai, T. Effects of nitrogen applications on soil nitrogen balance and nitrogen utilization of winter wheat in a rice–wheat rotation. Field Crop. Res. 2012, 127, 241–247. [Google Scholar] [CrossRef]
  8. Fan, Y.; Tian, M.; Jing, Q.; Tian, Z.; Han, H.; Jiang, N.; Cao, W.; Dai, T. Winter night warming improves pre-anthesis crop growth and post-anthesis photosynthesis involved in grain yield of winter wheat (Triticum aestivum L.). Field Crop. Res. 2015, 178, 100–108. [Google Scholar] [CrossRef]
  9. Ding, J.F.; Cheng, Y.M.; Huang, Z.J.; Li, C.Y.; Guo, W.S.; Zhu, X.K. Analysis of post-flowering material production and senescence characteristics of different nitrogen efficiency groups in rice stubble wheat. J. Integr. Agric. 2015, 48, 1063–1073. [Google Scholar]
  10. McCown, R.; Hammer, G.; Hargreaves, J.; Holzworth, D.; Freebairn, D. APSIM: A novel software system for model development, model testing and simulation in agricultural systems research. Agric. Syst. 1996, 50, 255–271. [Google Scholar] [CrossRef]
  11. Ahmed, M.; Akram, M.N.; Asim, M.; Aslam, M.; Hassan, F.-U.; Higgins, S.; Stöckle, C.O.; Hoogenboom, G. Calibration and validation of APSIM-Wheat and CERES-Wheat for spring wheat under rainfed conditions: Models evaluation and application. Comput. Electron. Agric. 2016, 123, 384–401. [Google Scholar] [CrossRef]
  12. Keating, B.; Carberry, P.; Hammer, G.; Probert, M.; Robertson, M.; Holzworth, D.; Huth, N.; Hargreaves, J.; Meinke, H.; Hochman, Z.; et al. An overview of APSIM, a model designed for farming systems simulation. Eur. J. Agron. 2003, 18, 267–288. [Google Scholar] [CrossRef] [Green Version]
  13. Asseng, S.; Fillery, I.R.P.; Dunin, F.X.; Keating, B.A.; Meinke, H. Potential deep drainage under wheat crops in a Mediterranean climate. I. Temporal and spatial variability. Aust. J. Agric. Res. 2001, 52, 45–56. [Google Scholar] [CrossRef]
  14. Hammer, G.; Van Oosterom, E.; McLean, G.; Chapman, S.C.; Broad, I.; Harland, P.; Muchow, R.C. Adapting APSIM to model the physiology and genetics of complex adaptive traits in field crops. J. Exp. Bot. 2010, 61, 2185–2202. [Google Scholar] [CrossRef] [Green Version]
  15. Yu, Q.; Li, L.; Braunack, M.; Eamus, D.; Xu, S.; Chen, C.; Wang, E.; Liu, J.; Nielsen, D. Year patterns of climate impact on wheat yields. Int. J. Clim. 2013, 34, 518–528. [Google Scholar] [CrossRef]
  16. Nelson, R.A.; Dimes, J.P.; Paningbatan, E.P.; Silburn, D.M. Erosion/productivity modelling of maize farming in the Philippine uplands: Part I: Parameterising the agricultural production systems simulator. Agric. Syst. 1998, 58, 29–33. [Google Scholar] [CrossRef]
  17. Xiao, D.; Bai, H.; Liu, D.L. Impact of Future Climate Change on Wheat Production: A Simulated Case for China’s Wheat System. Sustainability 2018, 10, 1277. [Google Scholar] [CrossRef] [Green Version]
  18. Sun, S.; Yang, X.; Lin, X.; Sassenrath, G.F.; Li, K. Winter Wheat Yield Gaps and Patterns in China. Agron. J. 2018, 110, 319–330. [Google Scholar] [CrossRef]
  19. Wu, L.; Feng, L.; Li, Y.; Wang, J.; Wu, L. A Yield-Related Agricultural Drought Index Reveals Spatio-Temporal Characteristics of Droughts in Southwestern China. Sustainability 2019, 11, 714. [Google Scholar] [CrossRef] [Green Version]
  20. Jones, H. Plants and Microclimate: A Quantitative Approach to Environmental Plant Physiology; Cambridge University Press: Cambridge, UK, 1992. [Google Scholar]
  21. Tao, F.; Yokozawa, M.; Xu, Y.; Hayashi, Y.; Zhang, Z. Climate changes and trends in phenology and yields of field crops in China, 1981–2000. Agric. For. Meteorol. 2006, 138, 82–92. [Google Scholar] [CrossRef]
  22. Sun, S. Study on Yield Potential and Resource Utilization Efficiency of Winter Wheat in Different Regions of China. Ph.D. Thesis, China Agricultural University, Beijing, China, 2018. [Google Scholar]
  23. Zhang, Y.Q.; Huang, R.H.; Zhuang, Z.Y.; Gao, C.B. High-yield population structure and cultivation techniques of Zhengmai 9023. Hubei Agric. Sci. 2005, 3, 33–34. [Google Scholar]
  24. Xu, F.C.; Li, M.F.; Dong, J.; Qin, D.D. Studies on planting performance of wheat varieties in different ecological areas in Hubei province. Mod. Agric. Sci. Technol. 2014, 24, 69–70. [Google Scholar]
  25. Dong, J.; Li, M.; Xu, F.; Ge, S.T.; Wang, X.Z.; Li, L.F. Effects of planting density sowing time and on population traits and grain yield of new wheat cultivar Emai596. Hubei Agric. Sci. 2010, 49, 1563–1566. [Google Scholar]
  26. Liu, Y.K.; Yan, J.; Zhang, Y.; Gao, C. Breeding and cultivation techniques of new wheat variety Emai170. Hubei Agric. Sci. 2015, 24, 6191–6192. [Google Scholar]
  27. Guan, S.H.; Yang, W.B.; Zou, J.L.; Li, H.B.; Fu, X.Q.; Li, Q. An analysis of the benefits of wheat “3414” fertilizer in Zhongxiang City. China Agric. Technol. Ext. 2015, 3, 51–53. [Google Scholar]
  28. Ruan, J.Z.; Wang, W.J.; Ren, S.Z.; Shi, Y.D.; Kuang, H.Q.; Liu, H.W.; Sun, F.S.; Xu, Y.Z.; Guo, G.L.; Zhu, Z.W.; et al. Studies on main technical measures for wheat yielding above 7500 kg/hm2 in highland area in Northern Hubei provinceI. Analysis on the causes of wheat high yield in highland area in Northern Hubei province. Hubei Agric. Sci. 2013, 23, 5690–5692. [Google Scholar]
  29. Guan, W.; Li, M.F.; Ge, S. Characteristics and cultivation techniques of middle gluten wheat variety Emai18. Hubei Agric. Sci. 2005, 5, 33–34. [Google Scholar]
  30. Wang, P.; Zhang, G.; Chen, B.; Peng, C.; Zhu, Z.; Gao, C.; Zhu, W. Research on fertilizer demand of wheat variety Emai596. Hubei Agric. Sci. 2016, 55, 303–305, 313. [Google Scholar]
  31. Xiong, Y.S.; Yuan, J.F.; Hao, F.X.; Ruan, J.Z.; Zhao, S.; Wang, C.; Peng, C.; Xu, X. Yield change and accumulation regular pattern of nitrogen nutrient for Emai18 under different level of nitrogen. Hubei Agric. Sci. 2009, 48, 2391–2394. [Google Scholar]
  32. Ming, C.F. High yield cultivation technique for wheat variety Emai18. China Agric. Technol. Ext. 2005, 3, 27. [Google Scholar]
  33. Birch, C.; Hammer, G.; Rickert, K.G. Improved methods for predicting individual leaf area and leaf senescence in maize (Zea mays). Aust. J. Agric. Res. 1998, 49, 249. [Google Scholar] [CrossRef]
  34. Willmott, C.J.; Robeson, S.M.; Matsuura, K. A refined index of model performance. Int. J. Clim. 2011, 32, 2088–2094. [Google Scholar] [CrossRef]
  35. Ali, H.; Abustan, I. A new novel index for evaluating model performance. J. Nat. Resour. Dev. 2014, 4, 1–9. [Google Scholar] [CrossRef]
  36. Seyoum, S.; Rachaputi, R.; Chauhan, Y.; Prasanna, B.; Fekybelu, S. Application of the APSIM model to exploit G × E × M interactions for maize improvement in Ethiopia. Field Crop. Res. 2018, 217, 113–124. [Google Scholar] [CrossRef]
  37. Makowski, D.; Naud, C.; Jeuffroy, M.-H.; Barbottin, A.; Monod, H. Global sensitivity analysis for calculating the contribution of genetic parameters to the variance of crop model prediction. Reliab. Eng. Syst. Saf. 2006, 91, 1142–1147. [Google Scholar] [CrossRef]
  38. Chen, C.; Wang, E.; Yu, Q. Modeling Wheat and Maize Productivity as Affected by Climate Variation and Irrigation Supply in North China Plain. Agron. J. 2010, 102, 1037–1049. [Google Scholar] [CrossRef] [Green Version]
  39. Li, K.; Yang, X.; Liu, Z.; Zhang, T.; Lu, S.; Liu, Y. Low yield gap of winter wheat in the North China Plain. Eur. J. Agron. 2014, 59, 1–12. [Google Scholar] [CrossRef]
  40. Archontoulis, S.V.; Miguez, F.; Moore, K.J. A methodology and an optimization tool to calibrate phenology of short-day species included in the APSIM PLANT model: Application to soybean. Environ. Model. Softw. 2014, 62, 465–477. [Google Scholar] [CrossRef]
  41. Ceglar, A.; Črepinšek, Z.; KAJFEŽ-BOGATAJ, L.; POGAČAR, T. The simulation of phenological development in dynamic crop model: The Bayesian comparison of different methods. Agric. For. Meteorol. 2011, 151, 101–115. [Google Scholar] [CrossRef]
  42. Arora, V.; Singh, H.; Singh, B. Analyzing wheat productivity responses to climatic, irrigation and fertilizer-nitrogen regimes in a semi-arid sub-tropical environment using the CERES-Wheat model. Agric. Water Manag. 2007, 94, 22–30. [Google Scholar] [CrossRef]
  43. Fox, D.G. Judging air quality model performance: A summary of the AMS Workshop on Dispersion Model Performance. Bull. Am. Meteorol. Soc. 1981, 62, 599–609. [Google Scholar] [CrossRef] [Green Version]
  44. Tang, L.; Zhu, Y.; Hannaway, D.; Meng, Y.; Liu, L.; Chen, L.; Cao, W. RiceGrow: A rice growth and productivity model. NJAS Wagening. J. Life Sci. 2009, 57, 83–92. [Google Scholar] [CrossRef] [Green Version]
  45. Zheng, B.Y.; Chen, U.K.; Doherty, A.; Chapman, S. The APSIM-Wheat Module (7.5 R3008) Documentation; APSRU: Toowoomba, Australia, 2014; pp. 20–25. [Google Scholar]
  46. Zhang, Y.; Feng, L.; Wang, E.; Wang, J.; Li, B. Evaluation of the APSIM-Wheat model in terms of different cultivars, management regimes and environmental conditions. Can. J. Plant Sci. 2012, 92, 937–949. [Google Scholar] [CrossRef] [Green Version]
  47. Nie, Z.; Li, G.; Wang, J.; Ma, W.; Luo, C.; Dong, L.; Lu, Y. Parameter optimization for the simulation of leaf area index of dryland wheat with the APSIM model. Sci. Agric. Sin. 2019, 52, 2056–2068. [Google Scholar]
  48. Asseng, S.; Turner, N.C.; Botwright, T.; Condon, A.G. Evaluating the Impact of a Trait for Increased Specific Leaf Area on Wheat Yields Using a Crop Simulation Model. Agron. J. 2003, 95, 10. [Google Scholar] [CrossRef]
Figure 1. Locations of the experimental sites (black solid dots) that were used to calibrate and validate the agricultural production system simulator (APSIM)-wheat model. Note: The experimental sites were Guyi town in Xiangzhou county, Zhangjiaji town in Xiangzhou county, Zaoyang county, and Yicheng county in Xiangyang; Zhongxiang county, Qujialing county, and Shayang county in Jingmen; Wuchang district and Hongshan district in Wuhan.
Agronomy 10 00981 g001
Figure 2. Relationships between simulated and observed growth durations from sowing to anthesis (A) and sowing to maturity (B) of winter wheat at Wuhan (WH), Jingmen (JM), and Xiangyang (XY)regions in Hubei province. Note: n means the number of paired data points, some points overlap, so the actual number of points in some graphs differs from the value of n. R2 is presented for the fitted line.
Agronomy 10 00981 g002
Figure 3. Relationships between the simulated and observed grain yield (A) and above-ground biomass (B) of winter wheat in the Wuhan (WH), Jingmen (JM), and Xiangyang (XY) regions in the Hubei province. Note: n means the number of paired data points. Some points overlap, so the actual number of points in some graphs differs from the value of n. R2 is presented for the fitted line.
Agronomy 10 00981 g003
Table 1. Wheat varieties and sources of experimental data for agricultural production system simulator (APSIM)-wheat model calibration and validation in Hubei province.
RegionCultivarDataset
CalibrationValidation
Experimental YearData SourceExperimental YearData Source
WuhanZhengmai 90231999–2000Zhang et al. [23]2013–2014Xu et al. [24]
2008–2009ATEC of Hubei province 2014–2015,
2015–2016
Unpublished data
Emai5962009–2010Dong et al. [25]2009–2010Dong et al. [25]
Emai1702012–2013Liu et al. [26]2013–2014Liu et al. [26]
2015–2016Unpublished data §2015–2016Unpublished data
JingmenZhengmai 90231999–2000Zhang et al. [23]2000–2001Zhang et al. [23]
2010–2011ATEC of Jingmen2013–2014Guan et al. [27]
Emai5962010–2011ATEC of Jingmen2012–2013Ruan et al. [28]
2015–2016Unpublished data
Emai1702015–2016Unpublished data
Emai182008–2009ATEC of Jingmen2002–2003Guan et al. [29]
2015–2016Unpublished data
XiangyangZhengmai 90232001–2002ATEC of Xiangyang1999–2000Zhang et al. [23]
2010–2011ATEC of Xiangyang2011–2012Ruan et al. [28]
2013–2014Xu et al. [24]
2015–2016Unpublished data
Emai5962013–2014Wang et al. [30]2013–2014Wang et al. [30]
2015–2016Unpublished data
Emai1702012–2013ATEC of Xiangyang2015–2016Unpublished data
Emai182007–2008Xiong et al. [31]2002–2003Ming et al. [32]
2007–2008Xiong et al. [31]
2010–2011ATEC of Xiangyang
Note: – means no data. ATEC means agricultural technology extension center, which is an agricultural department of the Bureau of Agriculture and Rural Affairs. § Unpublished data came from our field experiments conducted during the 2014–2015 and 2015–2016 winter wheat seasons in Wuhan, Jingmen, and Xiangyang. The management details of each type of experimental data in terms of calibration and validation can be found in the Supplementary Materials (Tables S1 and S2).
Table 2. Description of genetic coefficients of wheat varieties in the APSIM-wheat model.
Corp ModuleParameter TypeGenetic ParametersDescription
APSIM-wheatPhenology control parametersvern_sensSensitivity to vernalization
photop_sensSensitivity to photoperiod
tt_startgf_to_matThe thermal time required from grain filling to maturity (°C d)
Yield control parametersgrain_per_gram_stemNumbers of grain per gram stem (kernel (g stem)−1)
potential_grain_filling_RatePotential grain filling rate (g grain−1 d−1)
Leaf area control parameterssla-maxMaximum specific leaf area of ΔLAI (mm−2 g−1)
Note: . ΔLAI means delta leaf area index.
Table 3. Suggested performance rating for model evaluation based on the percent mean absolute relative error (PMARE) [35].
PMARE Value (%)Model Rating
0–5Excellent
5–10Very good
10–15Good
15–20Fair
20–25Moderate
>25Unsatisfactory
Table 4. Genetic parameters, sensitivity to vernalization (STV), sensitivity to photoperiod (STP), thermal time required from grain-filling to maturity (TTRGM), numbers of grain per stem (NGS), potential grain filling rate (PGFR), and maximum specific leaf area for ΔLAI (MSLA) for the model simulation of the four wheat varieties in Hubei province.
VarietySTVSTPTTRGM (°C d)NGSPGFR
(g Grain−1 d−1)
MSLA
(mm2 g−1)
x-lai = 0x-lai = 5
Zhengmai90233.53.665030.50.001821,00018,000
Emai5962.52.852028.50.003125,00023,000
Emai182.42.561038.50.002824,00023,000
Emai1703.03.162039.60.002723,00020,000
Table 5. The fitted equation for the linear relationships between the model-simulated and observed wheat growth duration and reliability measures: coefficient of determination (R2), normalized root mean square error (NRMSE), refined index of agreement (dr-values) and percent mean absolute relative error (PMARE).
Growth DurationRegionLinear Regression EquationF–Valuep–ValueR2NRMSE (%)dr-ValuesPMARE (%)
Sowing to anthesisWHy = 1.21x − 35.4139.67<0.00010.931.20.811.1
JMy = 1.02x − 1.1172.5<0.00010.971.30.781.1
XYy = 0.74x + 43.6142.8<0.00010.901.60.791.4
Sowing to maturityWHy = 1.08x − 17.1144.4<0.00010.941.10.870.8
JMy = 0.90x + 22.475.59<0.00010.931.00.760.8
XYy = 0.70x + 63.1359.7<0.00010.961.30.741.3
Note: F-values and p-values represent the fitted lines.
Table 6. The range of the APSIM-wheat simulated and observed values for growth duration from sowing to anthesis (STA) and maturity (STM), grain yield (GY), and above-ground biomass (AGB) in the Wuhan (WH), Jingmen (JM), and Xiangyang (XY) regions in Hubei province.
Model TraitsWHJMXY
Observed (Mean)Simulated (Mean)Observed (Mean)Simulated (Mean)Observed (Mean)Observed (Mean)
STA (d)158–181 (164.9)161–179 (165.4)166–181 (174.4)163–178 (171.8)165–182 (170.4)166–186 (170.4)
STM (d)190–216 (200.0)193–218 (200.5)203–216 (211.4)202–215 (208.9)200–216 (207.4)198–220 (207.3)
GY (kg ha−1)3637–9328 (5593)4935–7550 (5372)1283–6563 (4520)1303–6199 (4726)1789–7936 (5796)1525–8021 (5240)
AGB (kg ha−1)7688–20,730 (11,444)8180–17,471 (11,854)2895–13,775 (9861)4829–13,896 (11,185)3370–19,520 (12,211)4930–18,104 (12,237)
Table 7. The fitted equations for the linear relationships between the model-simulated and observed wheat grain yield and above-ground biomass and reliability measures: coefficient of determination (R2), normalized root mean square error (NRMSE), refined index of agreement (dr-values), and percent mean absolute relative error (PMARE).
Model AttributeRegionLinear Regression EquationF-Valuep-ValueR2NRMSE (%)dr-ValuesPMARE (%)
YieldWHy = 0.97x + 295.229.40.00030.7513.00.7311.9
JMy = 0.93x + 122.220.30.00410.7718.10.7813.6
XYy = 0.89x + 1022.755.9<0.00010.7817.10.7114.6
Above-ground biomassWHy = 1.25x − 3316.865.1<0.00010.8713.50.8010.6
JMy = 1.02x − 1600.540.90.00070.8717.70.7119.9
XYy = 0.98x + 560.041.0<0.00010.7219.80.7218.7
Note: F-values and p-values represent the fitted lines.

