Article

Combining Green Manuring and Fertigation Maximizes Tomato Crop Yield and Minimizes Nitrogen Losses

Department of Agricultural, Food and Environmental Sciences, University of Perugia, 06121 Perugia, Italy
*
Author to whom correspondence should be addressed.
Agronomy 2020, 10(7), 977; https://doi.org/10.3390/agronomy10070977
Submission received: 5 June 2020 / Revised: 4 July 2020 / Accepted: 6 July 2020 / Published: 8 July 2020
(This article belongs to the Special Issue Nitrogen Fertilization in Vegetable Crops)

Abstract

:
The aim of this experiment was to evaluate the effect of fertilizing processing tomato by coupling the green manuring of fall-winter cover crops with fertigation in spring-summer. In a two-year experiment, seven fertilization treatments were compared: green manuring of pure barley (B100) and pure vetch (V100) sown at 100% of their ordinary seeding rates, green manuring of a barley-vetch mixture at a ratio of 75:25 of their own seed rates (B75V25), fertigation with drip irrigation at a rate of 200 kg ha−1 of nitrogen (N) (Fert_N200), fertigation combined with B100 and B75V25 at a N rate complementary to 200 kg N ha−1 (B100 + Fert and B75V25 + Fert, respectively), and an unfertilized control (N0) with no cover crops for green manuring prior to tomato transplanting or fertigation. The Fert_N200 treatment resulted in maximum tomato N uptake, growth and yield, but caused high N leaching, especially during the no-cover fall-winter period, as was also the case for N0. The V100 treatment promoted quite good tomato N status and yield, but did not reduce N leaching. The B100 and B75V25 treatments reduced N leaching but decreased tomato N uptake, growth and yield. The B100 + Fert and B75V25 + Fert treatments reduced N leaching, likely increased soil N stock, and facilitated optimal tomato N nutrition and maximum yields. Combining fertigation with green manuring of cover crops composed of pure grass or grass-legume mixtures appears to be a very effective and environmentally sound practice for fertilizing high N-demanding spring-summer crops like processing tomato.

1. Introduction

Green manuring and fertigation with drip irrigation are two widespread practices that are used for the management of nitrogen (N) nutrition in many vegetable crops [1,2], including processing tomato [3,4,5]. Green manuring is mainly adopted in organic systems, in which chemicals are not allowed, and it represents an alternative to organic fertilizers, which may be not available, as is the case on stockless farms, or because they are too expensive [4,6]. Moreover, using winter cover crops for green manuring prevents N loss from the soil [7,8,9], and when legume species are incorporated, it supplies the soil with new N derived from the atmosphere (Ndfa), helping to increase the self-sufficiency of the system [10,11,12]. Indeed, cover crops and green manures are now also considered in conventional systems because these methods have become an important part of formulating crop rotations for the management of soil N fertility.
However, fertigation with drip systems is probably the most efficient method for delivering N to vegetables, especially for high N-fed and wide-spaced crops that have a long growth cycle, like processing tomato [5,13,14], which is the most widespread vegetable crop in Italy and worldwide. In fact, fertigation allows for localization and splitting of the fertilizer rate according to the needs of the crop at any growth stage, and for adjusting the rate during the growing season based on the crop’s ongoing N nutritional status [15], which is revealed by analysis of the N concentration in the crop biomass [16] or by quick tests [17,18,19,20]. Fertigation is widespread in conventional systems with mineral N fertilizers, but can also be used in organic systems with the use of soluble organic fertilizers [21,22].
Regardless of the cropping system (i.e., organic or conventional), sustainable management of N fertility helps reduce N inputs and losses by increasing either the self-sufficiency of N or N-use efficiency [23,24].
In a recent study, Farneselli et al. [22] compared green manures and fertigation (mineral or organic) with drip systems as possible alternatives for managing N nutrition in processing tomato. Their results demonstrated that cover crops supply a considerable amount of N derived from the atmosphere, owing to the presence of legumes, but that the amount of incorporated N varied with the legume/non-legume ratio and the season. Moreover, N release was not able to be accurately predicted and was not always synchronous with the needs of the tomato plant. In particular, the N release from biomass with a high C/N ratio (such as for cover crops with a prevalence of non-legume species) was too slow to meet the N needs of early crops. On the other hand, fertigation with either mineral or organic fertilizers provided the highest tomato N uptake efficiency and yield, however, this employed off-farms inputs. Thus, it can be hypothesized that combining green manures and fertigation could exploit the advantages of both practices. Green manures would supply biomass and N to the soil and fertigation would provide a complementary N supply to meet the actual N requirement of the cash crop with regard to amount and timing. To the best of our knowledge, very few works have investigated the combination of these two practices. Pypers et al. [25] dealt with a cassava cash crop in a tropical, humid environment and used natural vegetation, Tithonia and Chromolaena as green manure species. In a greenhouse study with tomato and cucumber as cash crops, Kang et al. [26] considered the application of wheat straw before the cash crop or a maize catch crop after the cash crop harvest.
Until now, there has not been an open field study in a temperate environment that has investigated the effect of growing fall-winter green manure crops prior to the establishment of the cash crop and supplementing a complementary N rate by fertigation during the cash crop cycle. Hence, the present work was aimed at testing the hypothesis that combining green manuring of fall-winter cover crops with complementary N supplementation by fertigation in processing tomato guarantees optimal N nutrition and maximum tomato yields while limiting off-farm N inputs and N leaching risks.

2. Materials and Methods

2.1. Experimental Site, Treatments and Crop Management

Field experiments were carried out in two growing seasons (2010–2011 and 2011–2012) at the Experimental Station (FieldLab) of the Department of Agricultural, Food and Environmental Sciences, University of Perugia, which is located in the middle of the Tiber plain (Central Italy, 42.96° N, 12.37° E, 165 m a.s.l.). The soil in the top 0.5 m is clay-loam (Fluventic Haplustept, Soil Taxonomy), composed of 47% silt, 28% sand, and 25% clay, 1.4% organic matter (Walkley-Black method), with total N of 1.0 g kg−1 (Kjeldhal method), high content of extractable P (26.3 mg kg−1, Olsen method) and exchangeable K (265 mg kg−1, ammonium-acetate method), and pH of 8.08 (in water).
Processing tomato (Solanum lycopersicum L., cultivar Perfectpeel) was subjected to seven experimental treatments that focused on crop N availability (Table 1) and consisted of: (i) N supplied only by green manuring of three different cover crops grown in fall-winter; (ii) N supplied only by mineral fertigation through drip irrigation; (iii) N supplied by green manuring of two different cover crops plus mineral fertigation; and (iv) no N supply (N0), i.e., no cover crops for green manuring prior to tomato transplanting or fertigation.
The cover crops used herein were pure barley (Hordeum vulgare L. cultivar Amillis), sown at its ordinary full seed rate of 400 seeds m−2 (B100), pure hairy vetch (Vicia villosa Roth., cultivar Capello), sown at its ordinary full seed rate of 200 seeds m−2 (V100), and a mixture of barley and vetch, at 75% and 25% of their own full seed rate (B75V25), i.e., 300 and 50 seeds m−2, respectively. This seed ratio of the grass (barley) and legume (vetch) species was chosen based on evidence from previous experiments in which it appeared to be a good compromise that both preserved N from leaching and supplied N to the tomato [3]. Cover crops were sown on 17 November 2010 and 31 October 2011 in rows spaced 0.15 m apart. For the mixture, barley and hairy vetch were sown in the same row. Cover crop termination was carried out on 27 April 2011 and 26 April 2012, when vetch was at the beginning of flowering and barley was at ear emergence. Crop termination consisted of mowing and finely chopping plants, and immediately incorporating the biomass into the 0.2 m upper soil layer with a rotary cultivator equipped with ripper blades and a back-roller.
Where processing tomato was only fertigated, the soil was left bare (i.e., without any cover crop) during the fall-winter period and a liquid mineral fertilizer (7.5% NO3-N, 7.5% N-NH4 and 15% urea-N) was provided through drip irrigation at a rate of 200 kg N ha−1 (Fert_N200), which has been proven over many years to approximate the optimum N rate for this crop in our environment [27,28]. The mineral fertigation combined with green manuring was applied only to B100 (B100 + Fert) and B75V25 (B75V25 + Fert). The nitrogen rates applied by fertigation were calculated as the difference between the N rate of Fert_N200 (i.e., 200 kg N ha−1) and the amount of N incorporated into the soil with the aboveground biomass of the two cover crops. Fertigation was not applied to V100, since previous experiments indicated that in our environment, this treatment generally provides an amount of N that approximates the N requirement of the tomato plant [3,22]. In all fertigated treatments (i.e., Fert_N200, B100 + Fert and B75V25 + Fert), the total N rates were split during the crop cycle according to the N uptake rates proposed for processing tomato by Farneselli et al. [5]. As a result, a total of ten fertigations were applied, once a week, starting from 30 days after transplanting.
The experimental design was a completely randomized block with three replicates. The plot size was 92 m2 in both years. In both years, the preceding crop was soft winter wheat, and 100 kg P2O5 ha−1 and 100 kg K2O ha−1 were broadcast for all treatments at ploughing, and before cover crop sowing.
Processing tomato was transplanted on 11 May 2011 and 15 May 2012 at a density of 3.2 plants m−2 in a twin-row plant arrangement (0.4 + 1.2 m). According to the FAO method, the same irrigation volume was applied in a two-times-per-week irrigation schedule for all treatments [29], and by using Kc determined on the basis of previous research carried out on the same processing tomato cultivar in the same environment [27]. The reference crop was the treatment with the greatest canopy in both years, i.e., Fert_N200. No pest control was necessary during the growing cycle and weeds were thoroughly controlled by hand-weeding.

2.2. Plant Sampling

The aboveground dry matter (DM) of cover crops at incorporation date (27 April 2011 and 26 April 2012) was determined by sampling plants from an area of 1.2 m2 per plot. The vetch and barley were separated from the mixture by hand to quantify the contribution of each companion species to the total biomass and N supply. The DM of tomato at final harvest (carried out on 23 August 2011 and 28 August 2012, when about 80% of the fruit were ripe) was determined by sampling 20 plants per plot, then separating the vegetative parts from the fruit, and further dividing them into marketable, unripe, and rotten fruit to calculate total fruit yield (TY) and marketable fruit yield (MY). Both cover crop and tomato biomass samples were oven dried at 80 °C, ground to a fine powder, and subjected to Kjeldahl digestion and analysis of the reduced N concentration, as employed by Farneselli et al. [22]. The C/N ratio of the cover crops was calculated by assuming that the C content in the aboveground biomass was equal to 42% of the dry matter [30,31]. Nitrogen accumulation in the cover crop and tomato biomass was calculated as the product of total biomass by reduced N concentration.

2.3. Cumulative NO3-N Leached below 0.9 m Depth

In both years, two lysimeters (SDEC, France) consisting of porous ceramic cups (32 mm external diameter by 95 mm length) were installed in each plot, one in the middle of the twin row and one in between two adjacent twin rows, both at a depth of 0.9 m. Samples of the soil solution were taken using a portable vacuum pump and the nitrate nitrogen (NO3-N) concentration of the water samples was measured with an ion-specific electrode meter (Spectrum Technologies Inc., Aurora, IL, USA), as described by Farneselli et al. [22]. During the cover crop cycle, water samples were collected after each heavy rain event, while during the processing tomato cycle, the samples were taken about 12 h after each irrigation or fertigation event. The DeNitrification-DeComposition (DNDC) model (version 9.5) was used to estimate drainage based on daily weather data, soil properties, and land use and management practices [32,33]. The calculation of N leached was based on the simulated daily drainage by interpolating the NO3-N concentration between sampling dates, according to cumulative drainage flow [34]. Cumulative N leaching was calculated for the cover crop cycle from the sowing to termination dates, for the tomato cycle from the day after cover crop incorporation to final harvest, and for the whole cover crop + tomato period (i.e., more than 9 months).

2.4. Data Analysis

The whole dataset (two years) was analyzed by ANOVA, using a mixed model, with year, treatment type, and “year by treatment” interaction as fixed effects, and blocks within years as a random effect. The means were compared using the generalized multiple comparison procedure suggested by Hothorn et al. [35], together with a single-step multiplicity adjustment. Statistical analysis of the data was performed using the R statistical environment [36].

3. Results

3.1. Weather Conditions

Rainfall and temperature regimes during the two experimental years are reported in Figure 1. For the cover crop growing period (November to April), the first year was very wet, with 542 mm total rainfall, 256 mm of which occurred in November. The second year was much drier with only 240 mm rainfall in total, 100 mm of which was in April. As far as the tomato growing season is concerned (i.e., May to August), total rainfall was similar in the two years (172 mm in 2011 and 187 mm in 2012) and slightly lower than the 30-year average (218 mm). The thermal regime in fall-winter was also quite different between the two years. The 2010–2011 season was mild but had a severe frost in early December, while the 2011–2012 season was quite cold until February. Temperatures during the two tomato growing seasons were similar and in line with the 30-year average (Figure 1).

3.2. Aboveground DM and N Accumulation in Cover Crops

The DM of cover crops at their incorporation date in 2011–2012 was more than twice that of 2010–2011 (2.84 Mg ha−1 and 6.17 Mg ha−1, respectively, averaged for all treatments), while treatments and treatment-by-year interactions were not significant (Table 2). The vetch in the mixture was scarce in the first year and practically absent in the second year. The DM of V100 in 2010–2011 was greater than that of B100 and B75V25, but was lower in 2011–2012 than in the other two cover crops. Indeed, the actual biomass of vetch in V100 was similar in the two years, and the higher DM value of V100 in 2011–2012 was accounted for by about 2 t ha−1 of weeds, almost all of which were gramineous species. Specifically, in 2012, vetch biomass was 3.92 t ha−1, with a N concentration of 3.11%, and weeds accounted for 2.02 t ha−1, with a N concentration of 2.21.
Nitrogen accumulation in cover crops was significantly affected by both the cover crop treatment and the year. Within each year, N accumulation of B100 and B75V25 did not differ significantly from each other, while N accumulation of V100 was 4-fold greater in the first year and 2.5-fold greater in the second year compared with the other two treatments. On average for all of the three cover crop treatments, N accumulation in 2011–2012 was almost double that of 2010–2011 (100 vs. 56 kg ha−1).
The C/N ratio in both years was high for B100 and B75V25, while it was very low for V100 (14.6 on average).

3.3. Aboveground DM and N uptake, and Fruit Yield in Processing Tomato

The aboveground DM of the tomato was significantly affected by the treatment type and the year (Table 3), and was generally higher in 2012, except for in B75V25, which showed similar values in the two years. The DM was high in both years for the three fertigated treatments (Fert_N200, B75V25 + Fert and B100 + Fert) and for V100 (11.5 Mg ha−1 in 2011 and 12.9 Mg ha−1 in 2012, averaged for all treatments). The tomato DM in the remaining three treatments (N0, B100, and B75V25) was markedly lower (6.7 Mg ha−1 in 2011 and 7.9 Mg ha−1 in 2012, as averaged for the three treatments). The DM was greatly increased by the application of fertigation to green manured tomato: +81% for B100 + Fert compared to B100, and +62% for B75V25 + Fert compared to B75V25, averaged over the two years.
Tomato N uptake was affected by treatment type in both years (Table 3), with very high values in all of the fertigated treatments (312 kg N ha−1 as an average over both years and all treatments). As for DM, N uptake was greatly increased by the application of fertigation to green manured tomato, that is, around 2.5-fold for B100 + Fert and B75V25 + Fert compared to B100 and B75V25, averaged over two years. The tomato N uptake in V100 was 62% higher than in B100 and B75V25, and 34% lower than in the corresponding fertigated treatments (B100 + Fert and B75V25 + Fert) when averaged for both years and all treatments, while it was half of the value recorded in Fert_N200 in both years. In all treatments and in both years, the amount of N taken up by tomato plants was higher than the amount of N supplied by green manuring and/or fertilization and, in fact, the N taken up by the tomato in N0 was about 150 kg ha−1 on average over the two years.
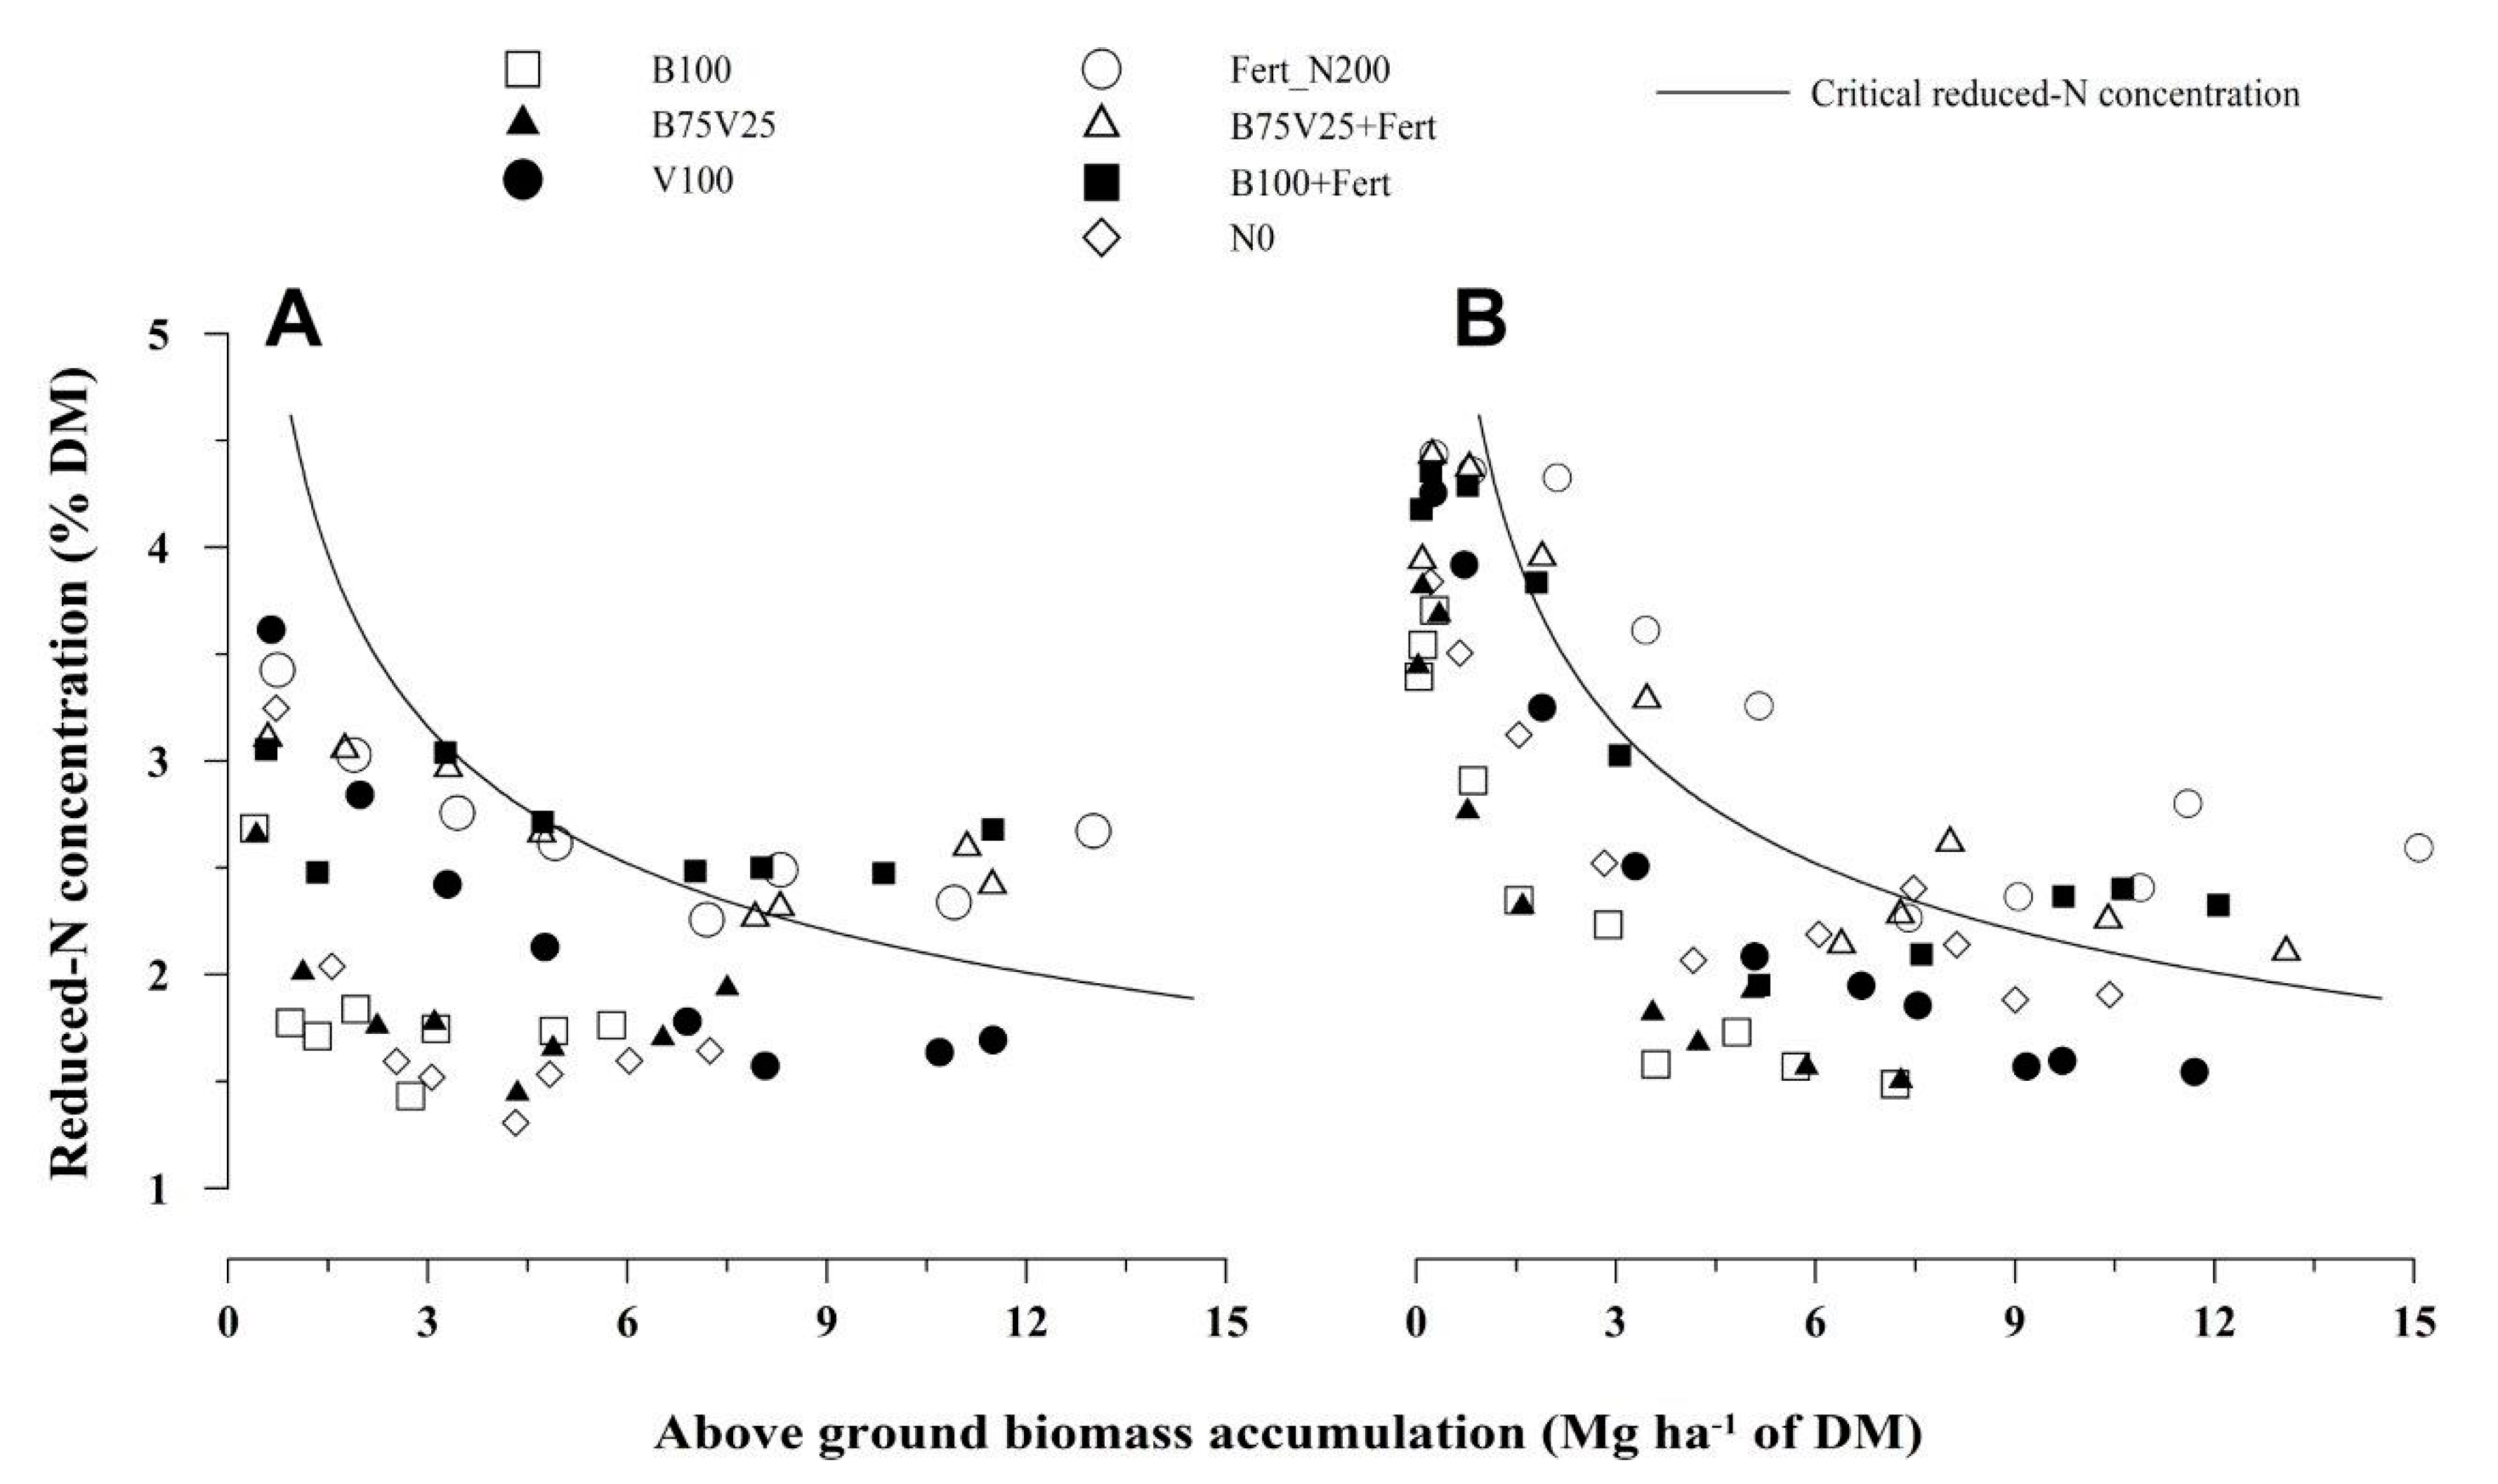
The N concentration in the tomato biomass was different among treatments in both years (Figure 2). Taking the tomato critical N curve proposed by Tei et al. [27] as a reference, the crop N status ranged from severe deficiency in treatments B100 and B75V25 to luxury consumption in the fertigated treatments, especially in Fert_N200. On average across all treatments, the crop N status appeared worse in the first compared to the second year, especially in the early growth stages and, in fact, the crop N concentration in the unfertilized control (N0) was lower in the first year. In both years, the tomato N status of V100 was intermediate, but below the critical N curve.
The proportion of dry matter attributed to the fruit was about 65% of the total aboveground DM (data not shown), independent of the treatment and year. In fact, differences among treatments for TY and MY were in line with those described for the total aboveground DM (Table 3). Thus, TY and MY were very high in the fertigated treatments and did not differ significantly from each other in both years. The V100 did not differ significantly from B100 + Fert and B75V25 + Fert, whereas it yielded significantly less fruit than Fert_N200, and significantly more than B100 and B75V25. Fertigation in addition to green manuring (i.e., the B100 + Fert and B75V25 + Fert treatments) caused a sharp increase in TY and MY (compared to B100 and B75V25, respectively). In 2011, the fruit yield in B75V25 was higher than in B100 and close to that in N0, while in 2012, fruit yield in B75V25 was close to that in B100 and lower than that in N0.

3.4. Cumulative NO3-N Leached below 0.9 m Depth

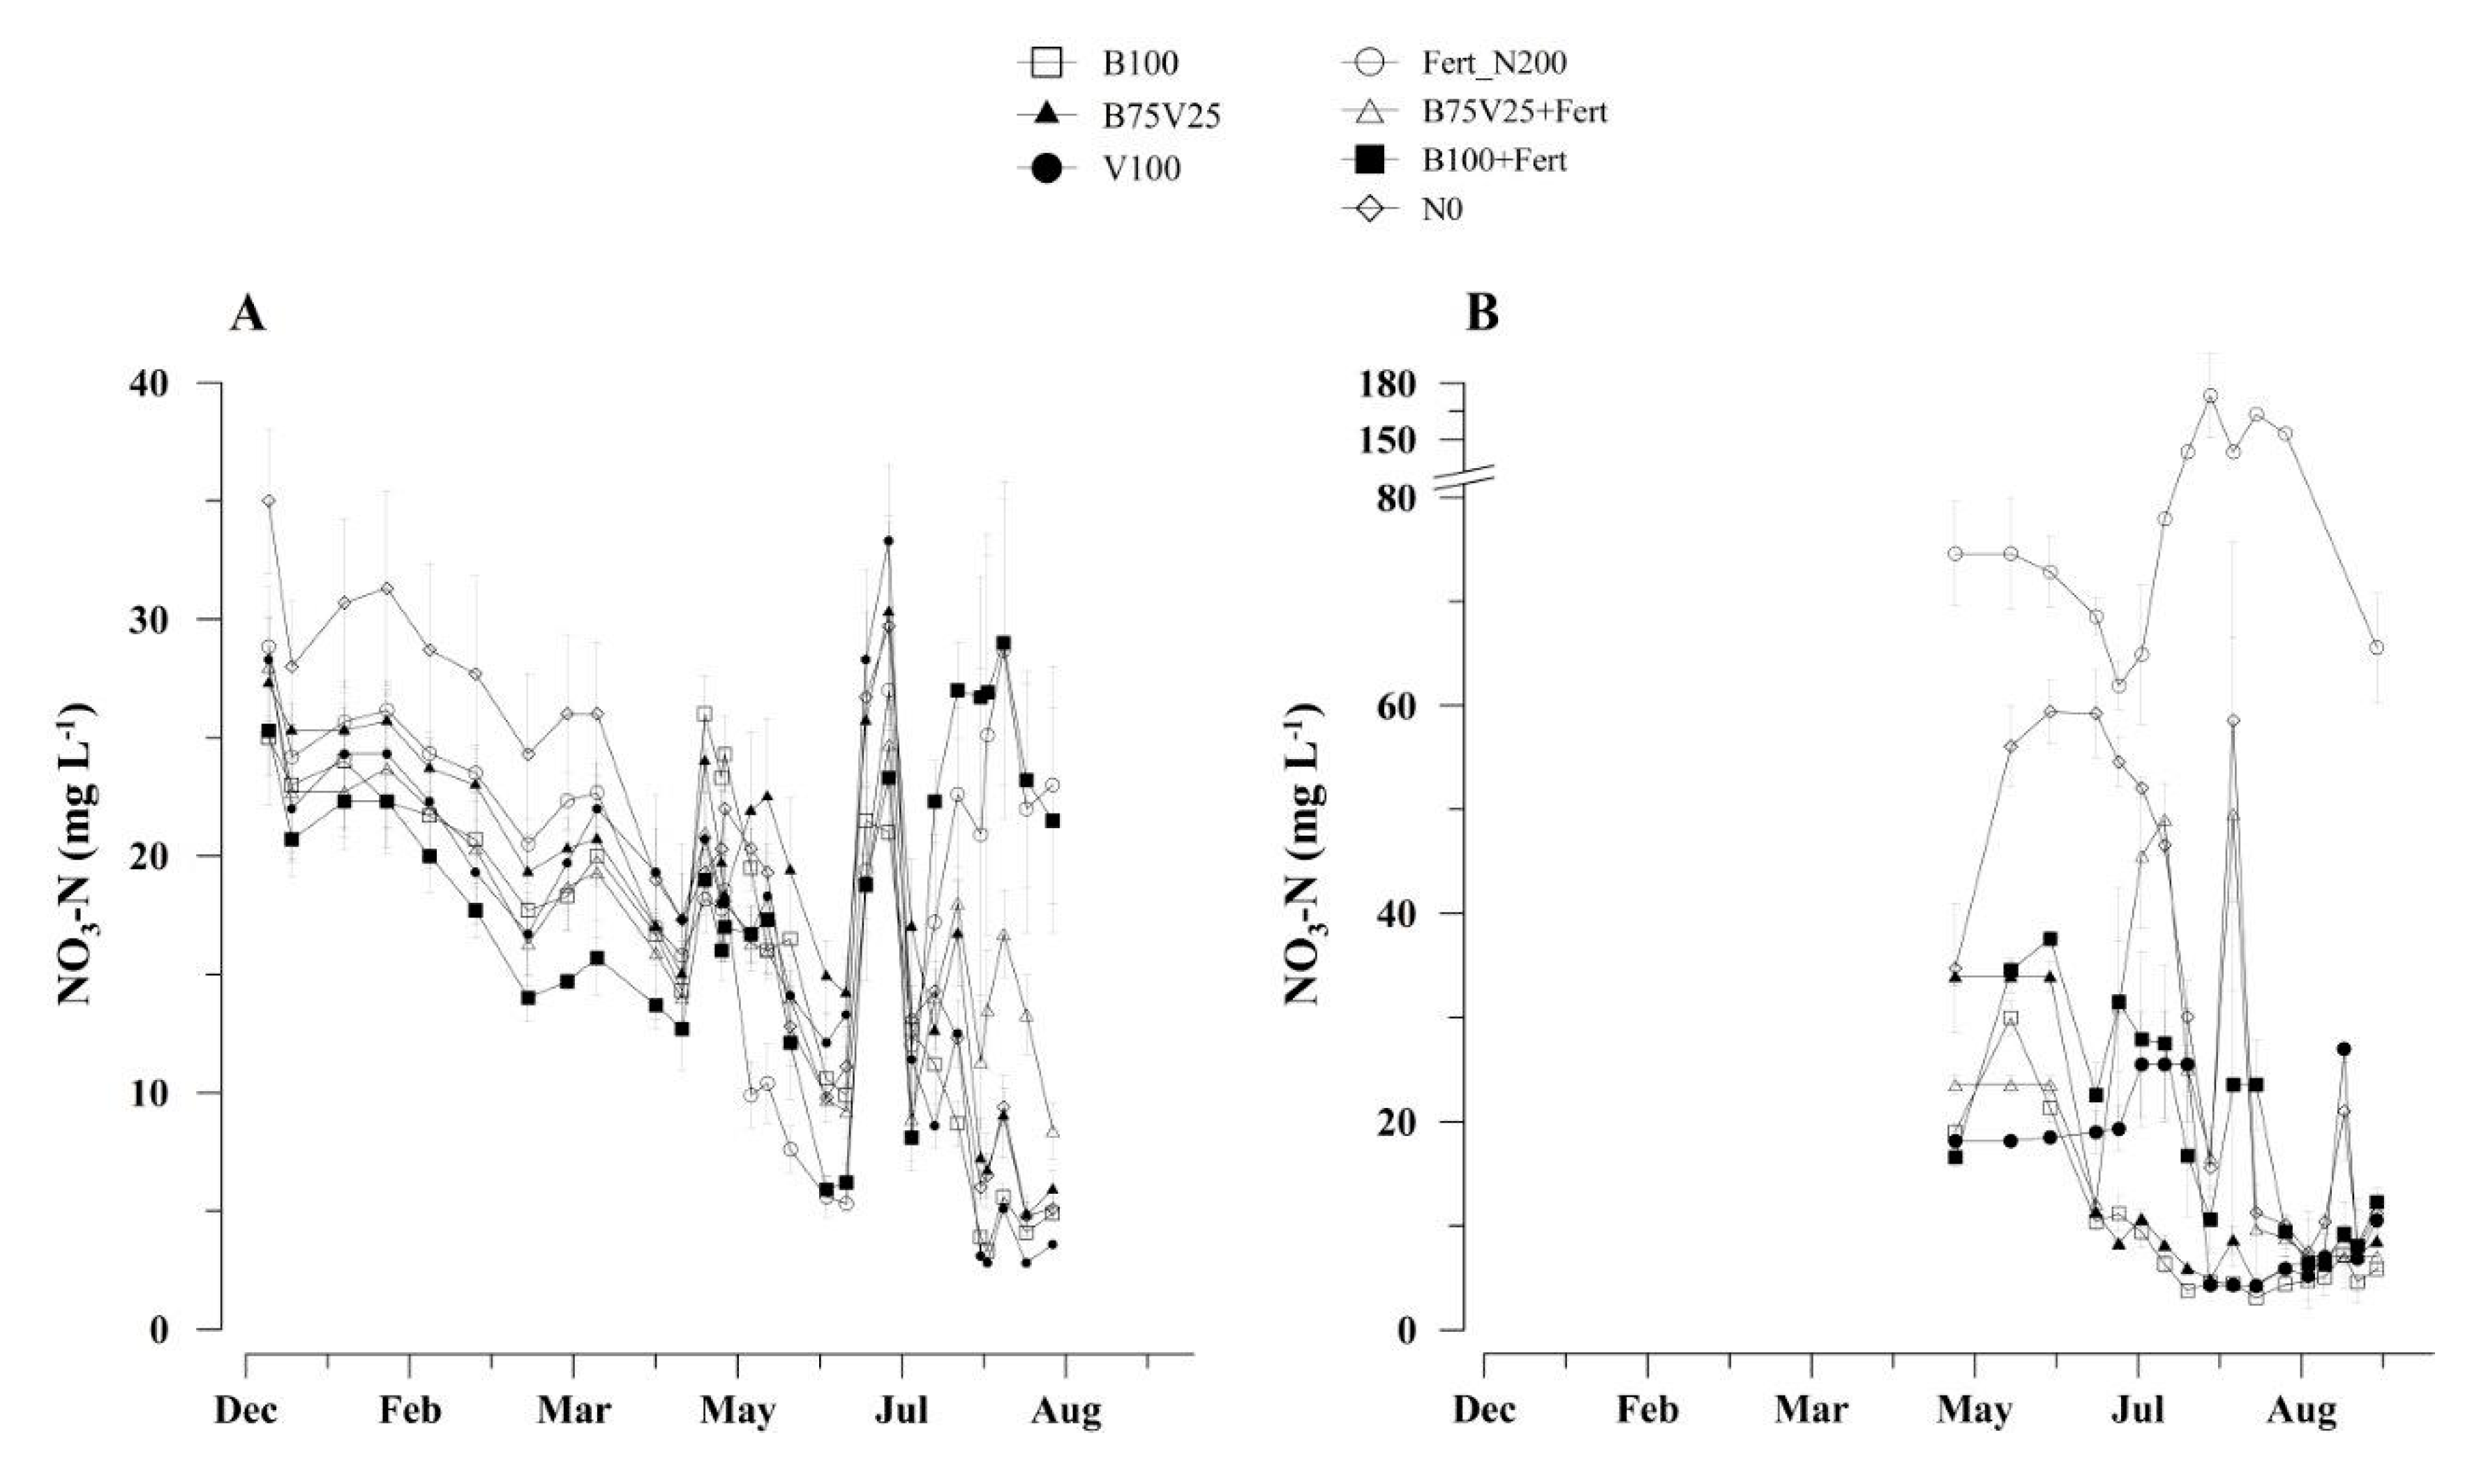
The NO3-N concentration in the soil solution (Figure 3) during the cover crop cycle could only be recorded during the first growing season, since the extraction of soil solution by suction lysimeters was not effective in the second year due to very scarce rainfall. In the first fall-winter period, the differences among treatments did not appear relevant, except for the constantly higher NO3-N concentration in plots where the soil was bare (i.e., N0 and Fert_N200). After green manure incorporation and during the tomato growing cycle, the differences among treatments became more significant, especially in 2012. In this year, the NO3-N concentration was by far the highest in Fert_N200 throughout the tomato cycle, and it was also considerable until July in N0, and to a lesser extent, in V100.
In all treatments, the cumulative drainage, as well as the cumulative NO3-N leached between November and August, was higher in the first than in the second year and occurred mainly in fall-winter (Table 4). The highest values of cumulative NO3-N leached were observed in N0 in both years, followed by Fert_N200 and V100 in 2010–2011. Leaching in 2010–2011 was also considerable for all other treatments (around 80 kg N ha−1), while in 2011–2012 it was much lower (less than 30 kg ha−1 for the three cover crop treatments, and less than 10 kg ha−1 for the two cover crops + fertigation).

4. Discussion

Biomass and N accumulation of the three cover crops during the two study years clearly depended upon weather, for its different effects on soil mineral N and on the growth of the legume and non-legume species. The heavy rainfall of fall-winter 2010–2011 depleted the soil mineral N and greatly reduced barley growth while favoring vetch; however, the latter species was partially damaged by December frost (Figure 1). In 2011–2012, the high soil N availability due to the low fall-winter rainfall promoted the growth of both species, but especially that of barley, which suppressed vetch in the mixture. This year was so favorable to non-legume species that even pure vetch was infested by about 2 t ha−1 of gramineous weeds. The C/N ratio of cover crop biomass in the two years varied accordingly. Since tomato transplantation was planned, as usual, for mid-May, termination of the cover crop could be delayed until late April, and this increased biomass accumulation and its C/N ratio, as expected [37,38,39]. It is worth noting that the C% was not measured here, but was assumed to be 42% in all treatments. However, there is evidence in the literature suggesting that C% is rather invariable, regardless of the plant species and environmental conditions [30,31]. It is also worth bearing in mind that only the aboveground biomass was recorded in this experiment, and that the additional biomass and N supply from the root system should be taken into account. Finally, it should be noted that legume N was mainly derived from the atmosphere through symbiotic fixation. The Ndfa of vetch in the Italian environment has been found to account for around 70% of the total aboveground N accumulation [40]. Results of previous studies have confirmed that cover crop biomass and N accumulation are aleatory, as demonstrated over 15 years of experiments on cover crops in the same environment as that studied herein [4,37,41] and also in different environments [11,38]. Acting on the seed ratio of the legume and non-legume species in the mixtures can only partially contribute to the modulation of biomass and N accumulation since the weather may then favor one species to the detriment of the other [42,43]. Nonetheless, the mixture guarantees some lower variability in biomass accumulation due to the N self-sufficiency of the legume in rainy conditions and to the frost tolerance of the grass species in cold conditions [44].
Data on tomato N uptake (Table 2) and N concentration in the aboveground biomass (Figure 2) indicate that the N supply from pure barley and the mixture was inadequate in meeting the N requirement of the tomato plant in both years. In fact, in B100 and in B75V25 tomatoes took up less N than in N0, suggesting that these treatments caused pre-emptive competition [12], absorbing soil N during their growing cycle and immobilizing it after biomass incorporation as a consequence of its high C/N ratio. This soil N immobilization represents an ecosystem service during the rainy season, since it prevents N from leaching; however, this effect was negligible in 2011–2012 by virtue of the very scarce fall-winter rainfall. Apart from the low total N uptake of the tomato, the timing of N release in B100 and in B75V25 was inadequate, since N was not available in the early tomato growth stages and this compromised its growth and yield. In both years, the N taken up by the tomato in V100 approximated the actual crop need [27]. However, data on total DM and TY (Table 3), as well as data on N concentration (Figure 2), compared with those recorded for Fert_N200, indicate that some additional and/or earlier available N would have been necessary. In this regard, the higher N supply obtained by any of the three cover crops in 2012 as compared to the correspondent cover crop in 2011 did not affect the final tomato N uptake, but only the N uptake in the early stages (Figure 2). This showed that the effect of N release from pre-existent soil N stock became prevalent in the later stages and it was able to compensate for a difference of a few dozen kilograms of N between the years. Fertigating tomato in addition to green manuring of cover crops (i.e., treatments B100 + Fert and B75V25 + Fert) guaranteed a ready supply of tomato N nutrition, except for the early growth stages of the first year, and very good crop growth and fruit yield. It is of relevance that the tomato in B100 + Fert and B75V25 + Fert had a total and marketable fruit yield not significantly lower than Fert_N200, in spite of a markedly lower N uptake. This suggests that N availability in Fert_N200 was accompanied with luxury N consumption. In fact, biomass N concentration in Fert_N200 was above the critical N curve for most of the growing season [27], especially in the second year (Figure 2). On the other hand, since the total N input (i.e., N from green manures plus N from fertigation) was the same in the three treatments, the lower tomato N uptake in B100 + Fert and B75V25 + Fert indicates that part of the N was not available to the tomato as it was likely immobilized in the soil, thereby increasing the N stock and long-term fertility of the soil. In fact, a slightly lower tomato N concentration at the very early stages (Figure 2) and reduced total DM accumulation (Table 3) were observed in B100 + Fert and B75V25 + Fert, compared to Fert_N200. However, under normal practices, these lower values would be easily accounted for by increasing the early fertigation N rate in order to counteract the estimated effect of pre-emptive competition, based on the amount and proportion of non-legume biomass incorporated at cover crop termination. This situation was considered in our experiment, but then neglected so as not to include another variable.
The high total and marketable fruit yield of tomato recorded in fertigated treatments was in line with values reported in the literature for the same or similar environments [22,45,46], confirming that fertigation helps maximize yields. On the other hand, leaving the soil bare in fall-winter, as it was for plots of Fert_N200 and N0, caused a significant N loss in 2010–2011, whereas cover crops reduced cumulative drainage and N leaching (Figure 3; Table 4), as expected [9,22,47], due to crop evapotranspiration and N uptake [48]. This effect could be observed only during the wet conditions experienced in 2010–2011, whereas in 2011–2012 there was no drainage and thus no leaching. In this second year, as discussed above, the N scavenging function of cover crops was not necessary while the soil N depletion caused by the grass component was negative for tomato lacking the supplementary N provided by fertigation. The effect of cover crops on N leaching also continued after biomass incorporation and throughout the tomato cycle, with the cover crop species having a clear effect. In particular, when the soil mineral N content in spring was high due to the dry winter in 2012, the NO3-N concentration at 0.9 m (i.e., below most tomato roots) was very high in treatments without cover crops (Fert_N200 and N0), and also after the pure vetch treatment. These effects were expected, since they had already been observed in our previous experiments [7,22]. What is novel here is the effect of the two cover crops followed by mineral fertigation (B100 + Fert and B75V25 + Fert). These treatments guaranteed optimal tomato N nutrition and yield while significantly reducing N leaching during both the cover crop and the tomato growing periods. Thus, combining cover crops and mineral fertigation may be considered the most environmentally sound strategy for managing soil N fertility, as it guarantees prevention of N leaching (and consequently an increase in the soil N stock in the long term), together with the optimal N nutrition of the cash crop.
Based on evidence from Farneselli et al. [22], similar results would be obtained if fertigation were to be carried out with fast release organic fertilizers (e.g., blood, leather by-products, etc.) in place of mineral fertilizers. This evidence is an important consideration in view of the adoption of this practice in organic farming. The technique could be further improved by implementing a variable split of the N fertigation rate based on the amount of incorporated cover crop biomass and its C/N ratio, as shown by previous measurements or models [44], or at least, as estimated on the basis of cover crop density and height, as well as the proportion of legume and non-legume species.
As mentioned above, the practice of combining green manuring and fertigation could be adopted in both conventional and organic systems, because the increase in N self-sufficiency and use efficiency and the reduction in N pollution, together with a high cash crop yield, are all aspects of production sustainability, which must be pursued whatever the system [11,13,49,50]. Undoubtedly, including cover crops in the rotation brings about additional financial and labor costs, as well as challenges for farm management. These extra costs should be compensated for by some incentives, taking into account these and the other ecosystem services they provide (e.g., increased soil organic matter content, physical stability, improved water infiltration, prevention of erosion, cooling effect on the land surface, higher biological activity, etc.) [11,44,51,52].

5. Conclusions

The results of the present study confirm that mineral fertigation with drip irrigation is a very efficient N fertilization practice for processing tomato, and for maximizing crop N uptake, growth and yield. However, leaving the soil bare during winter was not environmentally sustainable, as it caused high N leaching. Green manuring of pure vetch produced quite good tomato N status and yield, but did not solve the problem of N leaching. Growing pure barley or a barley-vetch mixture (with a higher amount of barley) was effective in reducing N leaching, likely increasing soil N stock, but caused N shortage to the tomato, thus decreasing its growth and yield. Moreover, the effects of green manures were variable over the two years, depending on fall-winter rainfall and temperatures, which suggests a need for flexible N supplementation. This flexibility was achieved by providing mineral fertigation to plots green manured with pure barley or the barley-vetch mixture and, in fact, resulted in reduced N leaching together with optimal tomato N nutrition and maximum fruit yield. Thus, combining green manuring with fertigation is an effective means of maximizing yields while minimizing N loss in high N-demanding spring-summer crops. For this reason, the adoption of this practice should be encouraged among farmers with some incentives to compensate for the increased costs of cover crop management.

Author Contributions

Conceptualization, M.F., P.B., G.T., M.G., F.T.; methodology, M.F., P.B., G.T., M.G., F.T.; formal analysis, M.F., G.T.; investigation, M.F.; resources, M.F.; data curation, M.F., P.B.; writing—original draft preparation, M.F., P.B.; writing—review and editing, M.F., P.B., G.T., M.G., F.T.; supervision, M.G., F.T.; project administration, M.F., F.T.; funding acquisition, F.T.; All authors have read and agreed to the published version of the manuscript.

Funding

This work was supported by the Italian Ministry of Education, University and Research (PRIN 2008, prot-2008KL73BE).

Acknowledgments

We gratefully acknowledge Daniele Luchetti and all workers of the FieldLab of the Department of Agricultural, Food and Environmental Sciences, University of Perugia, for managing the field experiment.

Conflicts of Interest

The authors declare no conflict of interest.

References

  1. Bindraban, P.S.; Dimkpa, C.; Nagarajan, L.; Roy, A.; Rabbinge, R. Revisiting fertilisers and fertilisation strategies for improved nutrient uptake by plants. Biol. Fert. Soils 2015, 51, 897–911. [Google Scholar] [CrossRef] [Green Version]
  2. Incrocci, L.; Massa, D.; Pardossi, A. New trends in the fertigation management of irrigated vegetable crops. Horticulturae 2017, 3, 37. [Google Scholar] [CrossRef]
  3. Tosti, G.; Benincasa, P.; Farneselli, M.; Pace, R.; Tei, F.; Guiducci, M. Green manuring effect of pure and mixed barley hairy vetch winter cover crops on maize and processing tomato N nutrition. Eur. J. Agron. 2012, 43, 136–146. [Google Scholar] [CrossRef] [Green Version]
  4. Farneselli, M.; Benincasa, P.; Tosti, G.; Pace, R.; Tei, F.; Guiducci, M. Nine-year results on maize and processing tomato cultivation in an organic and in a conventional low input cropping system. Ital. J. Agron. 2013, 8, 2. [Google Scholar] [CrossRef] [Green Version]
  5. Farneselli, M.; Benincasa, P.; Tosti, G.; Simonne, E.; Guiducci, M.; Tei, F. High fertigation frequency improves nitrogen uptake and crop performance in processing tomato grown with high nitrogen and water supply. Agr. Water Manag. 2015, 154, 52–58. [Google Scholar] [CrossRef]
  6. Abdalla, M.; Hastings, A.; Cheng, K.; Yue, Q.; Chadwick, D.; Espenberg, M. A critical review of the impacts of cover crops on nitrogen leaching, net greenhouse gas balance and crop productivity. Glob. Chang. Biol. 2019, 25, 2530–2543. [Google Scholar] [CrossRef] [Green Version]
  7. Tosti, G.; Benincasa, P.; Farneselli, M.; Tei, F.; Guiducci, M. Barley-hairy vetch mixture as cover crop for green manuring and the mitigation of N leaching risk. Eur. J. Agron. 2014, 54, 34–39. [Google Scholar] [CrossRef]
  8. Shah, S.; Hookway, S.; Pullen, H.; Clarke, T.; Wilkinson, S.; Reeve, V. The role of cover crops in reducing nitrate leaching and increasing soil organic matter. Asp. Appl. Biol. 2017, 134, 243–252. [Google Scholar]
  9. Meyer, N.; Bergez, J.E.; Constantin, J.; Justes, E. Cover crops reduce water drainage in temperate climates: A meta-analysis. Agron. Sustain. Dev. 2019, 39, 3. [Google Scholar] [CrossRef] [Green Version]
  10. Blesh, J. Functional traits in cover crop mixtures: Biological nitrogen fixation and multifunctionality. J. Appl. Ecol. 2018, 55, 38–48. [Google Scholar] [CrossRef] [Green Version]
  11. Quemada, M.; Lassaletta, L.; Leip, A.; Jones, A.; Lugato, E. Integrated management for sustainable cropping systems: Looking beyond the greenhouse balance at the field scale. Glob. Chang. Biol. 2020, 26, 2584–2598. [Google Scholar] [CrossRef] [PubMed]
  12. Thorup-Kristensen, K.; Magid, J.; Jensen, L.S. Catch crops and green manures as biological tools in nitrogen management in temperate zones. Adv. Agron. 2003, 79, 227–302. [Google Scholar] [CrossRef]
  13. Azad, N.; Behmanesh, J.; Rezaverdinejad, V.; Abbasi, F.; Navabian, M. Developing an optimization model in drip fertigation management to consider environmental issues and supply plant requirements. Agr. Water Manage. 2018, 208, 344–356. [Google Scholar] [CrossRef]
  14. Haofeng, L.; Shan, L.; Yafang, W.; Xiaojuan, L.; Yiming, Z.; Yingjie, L. Drip fertigation significantly reduces nitrogen leaching in solar greenhouse vegetable production system. Environ. Pollut. 2019, 245, 694–701. [Google Scholar] [CrossRef]
  15. Thompson, R.B.; Tremblay, N.; Fink, M.; Gallardo, M.; Padilla, F.M. Tools and Strategies for Sustainable Nitrogen Fertilisation of Vegetable Crops. In Advances in Research on Fertilization Management of Vegetable Crops; Tei, F., Nicola, S., Benincasa, P., Eds.; Advances in Olericulture Series; Springer: Cham, Switzerland, 2017; pp. 11–63. [Google Scholar] [CrossRef]
  16. Tei, F.; Benincasa, P.; Guiducci, M. Effect of N availability on growth, N uptake, light interception and photosynthetic activity in processing tomato. Acta Hortic. 2002, 571, 209–216. [Google Scholar] [CrossRef]
  17. Farneselli, M.; Simonne, E.H.; Studstill, D.W.; Tei, F. Washing and/or cutting petioles reduces nitrate nitrogen and potassium sap concentrations in vegetables. J. Plant Nutr. 2006, 29, 1975–1982. [Google Scholar] [CrossRef]
  18. Farneselli, M.; Benincasa, P.; Tei, F. Validation of N nutritional status tools for processing tomato. Acta Hortic. 2010, 852, 227–232. [Google Scholar] [CrossRef]
  19. Padilla, F.M.; Peña-Fleitas, M.T.; Gallardo, M.; Giménez, C.; Thompson, R.B. Derivation of sufficiency values of a chlorophyll meter to estimate cucumber nitrogen status and yield. Comput. Electron. Agric. 2017, 141, 54–64. [Google Scholar] [CrossRef]
  20. Peña-Fleitas, M.T.; Gallardo, M.; Thompson, R.B.; Farneselli, M.; Padilla, F.M. Assessing crop N status of fertigated vegetable crops using plant and soil monitoring techniques. Ann. Appl. Biol. 2015, 167, 387–405. [Google Scholar] [CrossRef]
  21. Devanathan, R.; Sekar, K. Effect of organic fertigation on yield and quality of bell pepper (Capsicum annuum var. Grossum Sendt.). Asian J. Hortic. 2018, 13, 1–4. [Google Scholar] [CrossRef]
  22. Farneselli, M.; Tosti, G.; Onofri, A.; Benincasa, P.; Guiducci, M.; Pannacci, E.; Tei, F. Effects of N sources and management strategies on crop growth, yield and potential N leaching in processing tomato. Eur. J. Agron. 2018, 98, 46–54. [Google Scholar] [CrossRef]
  23. Harchaoui, S.; Chatzimpiros, P. Energy, Nitrogen, and Farm Surplus Transitions in Agriculture from Historical Data Modeling. France, 1882–2013. J. Ind. Ecol. 2019, 23, 412–425. [Google Scholar] [CrossRef]
  24. Rakotovololona, L.; Beaudoin, N.; Ronceux, A.; Venet, E.; Mary, B. Driving factors of nitrate leaching in arable organic cropping systems in Northern France. Agr. Ecosyst. Environ. 2019, 272, 38–51. [Google Scholar] [CrossRef]
  25. Pypers, P.; Bimponda, W.; Lodi-Lama, J.-P.; Lele, B.; Mulumba, R.; Kachaka, C.; Boeckx, P.; Merckx, R.; Vanlauwe, B. Combining mineral fertilizer and green manure for increased, profitable cassava production. Agron. J. 2012, 104, 178–187. [Google Scholar] [CrossRef]
  26. Kang, L.; Fan, B.; Chen, S.; Chen, Q. Fertigation combined with catch crop maximize vegetable yield and minimize N and P surplus. Nutr. Cycl. Agroecosyst. 2018, 112, 87–99. [Google Scholar] [CrossRef]
  27. Tei, F.; Benincasa, P.; Guiducci, M. Critical nitrogen concentration in processing tomato. Eur. J. Agron. 2002, 18, 45–55. [Google Scholar] [CrossRef]
  28. Tei, F.; Benincasa, P.; Farneselli, M.; Tosti, G.; Guiducci, M. Environmentally sustainable nitrogen nutrition management in processing tomato. Acta Hortic. 2015, 1081, 41–48. [Google Scholar] [CrossRef]
  29. Allen, R.G.; Pereira, L.S.; Raes, D.; Smith, M. Crop Evapotranspiration—Guidelines for Computing Crop Water Requirements—FAO Irrigation and Drainage Paper 56; Food and Agriculture Organization: Rome, Italy, 1998. [Google Scholar]
  30. Ma, S.; He, F.; Tian, D.; Zou, D.; Yan, Z.; Yang, Y.; Zhou, T.; Huang, K.; Shen, H.; Fang, J. Variations and determinants of carbon content in plants: A global synthesis. Biogeosciences 2018, 15, 693–702. [Google Scholar] [CrossRef] [Green Version]
  31. Quemada, M. Predicting crop residue decomposition using moisture adjusted time scales. Nutr. Cycl. Agroecosyst. 2004, 70, 283–291. [Google Scholar] [CrossRef]
  32. DNDC Model (Version 9.5); Institute for the Study of Earth, Oceans, and Space University of New Hampshire: Durham, NH, USA, 2012.
  33. Camarotto, C.; Dal Ferro, N.; Piccoli, I.; Polese, R.; Furlan, L.; Chiarini, F. Conservation agriculture and cover crop practices to regulate water, carbon and nitrogen cycles in the low-lying Venetian plain. Catena 2018, 167, 236–249. [Google Scholar] [CrossRef]
  34. De Notaris, C.; Rasmussen, J.; Sørensen, P.; Olesen, J.E. Nitrogen leaching: A crop rotation perspective on the effect of N surplus, field management and use of catch crops. Agr. Ecosyst. Environ. 2018, 255, 1–11. [Google Scholar] [CrossRef]
  35. Hothorn, T.; Bretz, F.; Westfall, P. Simultaneous inference in general parametric models. Biom. J. 2008, 50, 346–363. [Google Scholar] [CrossRef] [PubMed] [Green Version]
  36. R Core Team. R: A Language and Environment for Statistical Computing; R Foundation for Statistical Computing: Vienna, Austria, 2018; Available online: https://www.R.-project.org/ (accessed on 12 November 2019).
  37. Benincasa, P.; Tosti, G.; Tei, F.; Guiducci, M. Actual N Availability from Winter Catch Crops Used for Green Manuring in Maize Cultivation. J. Sustain. Agr. 2010, 34, 705–723. [Google Scholar] [CrossRef]
  38. Alonso-Ayuso, M.; Gabriel, J.L.; Quemada, M. The kill date as a management tool for cover cropping success. PLoS ONE 2014, 9, e109587. [Google Scholar] [CrossRef] [PubMed]
  39. Wittwer, R.; Dorn, B.; Jossi, W.; van der Heijden, M.G.A. Cover crops support ecological intensification of arable cropping systems. Sci. Rep. 2017, 7, 41911. [Google Scholar] [CrossRef] [PubMed] [Green Version]
  40. Cazzato, E.; Venticelli, P.; Corleto, A. N2 fixation of annual fodder legumes in Mediterranean environment. Note 2. Comparison between difference and isotope dilution methods and evaluation of two grass species as reference crops. Riv. di Agron. 2003, 37, 63–68. [Google Scholar]
  41. Tosti, G.; Benincasa, P.; Farneselli, M.; Guiducci, M.; Onofri, A.; Tei, F. Processing Tomato–Durum Wheat Rotation under Integrated, Organic and Mulch-Based No-Tillage Organic Systems: Yield, N Balance and N Loss. Agronomy 2019, 9, 718. [Google Scholar] [CrossRef] [Green Version]
  42. Kramberger, B.; Gselman, A.; Podvršnik, M.; Kristl, J.; Lešnik, M. Environmental advantages of binary mixtures of Trifolium incarnatum and Lolium multiflorum over individual pure stands. Plant Soil Environ. 2013, 59, 22–28. [Google Scholar] [CrossRef] [Green Version]
  43. Gaudio, N.; Escobar-Gutierrez, A.J.; Casadebaig, P.; Evers, J.B.; Gerard, F.; Louarn, G. Current knowledge and future research opportunities for modelling annual crop mixtures. A review. Agron. Sustain. Dev. 2019, 39, 20. [Google Scholar] [CrossRef] [Green Version]
  44. Tribouillois, H.; Jean-Pierre, C.; Justes, E. Cover crop mixtures including legume produce ecosystem services of nitrate capture and green manuring: Assessment combining experimentation and modelling. Plant Soil 2016, 401, 347–364. [Google Scholar] [CrossRef]
  45. Gabriel, J.L.; Munoz-Carpena, R.; Quemada, M. The role of cover crops in irrigated systems: Water balance, nitrate leaching and soil mineral nitrogen accumulation. Agr. Ecosyst. Environ. 2012, 155, 50–61. [Google Scholar] [CrossRef] [Green Version]
  46. Ronga, D.; Zaccardelli, M.; Lovelli, S.; Perrone, D.; Francia, E.; Milc, J. Biomass production and dry matter partitioning of processing tomato under organic vs conventional cropping systems in a Mediterranean environment. Sci. Hortic. 2017, 224, 163–170. [Google Scholar] [CrossRef]
  47. Askegaard, M.; Olesen, J.E.; Rasmussen, I.A.; Kristensen, K. Nitrate leaching from organic arable crop rotations is mostly determined by autumn field management. Agr. Ecosyst. Environ. 2011, 142, 149–160. [Google Scholar] [CrossRef]
  48. Basche, A.D.; Archontoulis, S.A.; Kaspar, T.C.; Jaynes, D.B.; Parkin, T.B.; Miguez, F.E. Simulating long-term impacts of cover crops and climate change on crop production and environmental outcomes in the Midwestern United States. Agr. Ecosyst. Environ. 2016, 218, 95–106. [Google Scholar] [CrossRef] [Green Version]
  49. Padilla, F.M.; Gallardo, M.; Manzano-Agugliaro, F. Global trends in nitrate leaching research in the 1960–2017 period. Sci. Total Environ. 2018, 643, 400–413. [Google Scholar] [CrossRef]
  50. Pandey, A.; Li, F.; Askegaard, M.; Rasmussen, I.A.; Olesen, J.E. Nitrogen balances in organic and conventional arable crop rotations and their relations to nitrogen yield and nitrate leaching losses. Agr. Ecosyst. Environ. 2018, 265, 350–362. [Google Scholar] [CrossRef]
  51. Gabriel, J.L.; Garrido, A.; Quemada, M. Cover crop effect on farm benefits and nitrate leaching: Linking economic and environmental analysis. Agric. Syst. 2013, 121, 23–32. [Google Scholar] [CrossRef]
  52. Schipanski, M.E.; Barbercheck, M.; Douglas, M.R.; Finney, D.M.; Haider, K.; Kaye, J.P. A framework for evaluating ecosystem services provided by cover crops in agroecosystems. Agr. Syst. 2014, 125, 12–22. [Google Scholar] [CrossRef]
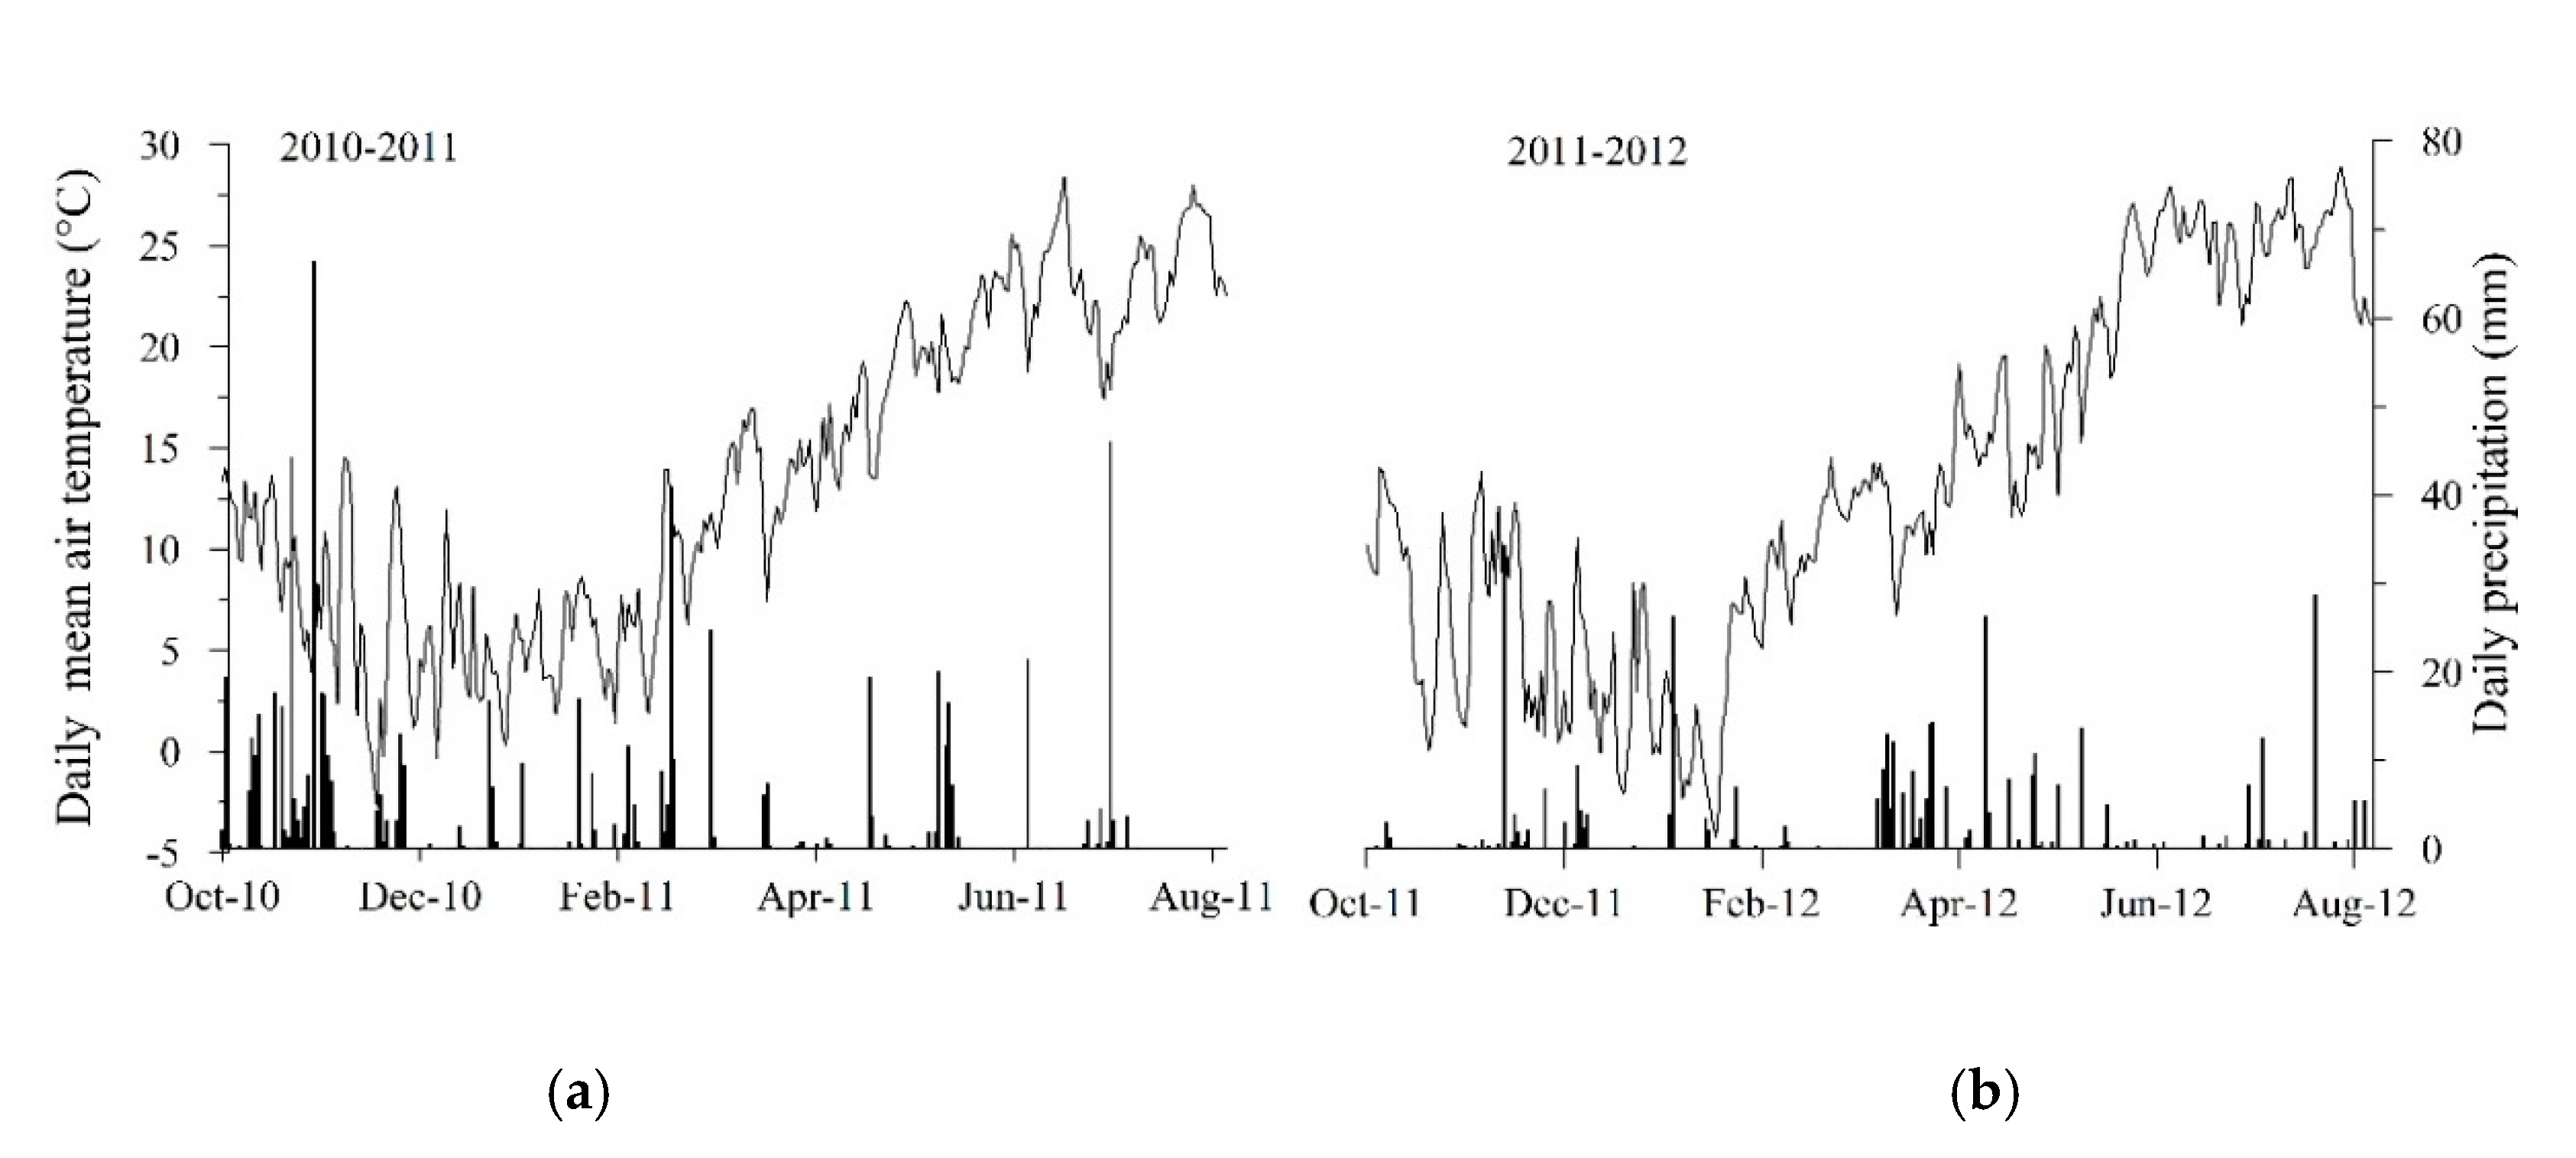
Figure 1. Daily rainfall (vertical bars) and mean daily air temperature (line) during the periods October 2010–August 2011 (a) and October 2011–August 2012 (b).
Agronomy 10 00977 g001
Figure 2. Reduced-N concentration in aboveground dry matter (DM) vs. aboveground DM accumulation observed in 2011 (A) and 2012 (B) in processing tomato grown with different N fertilization strategies. B100 = green manuring of pure barley at full seeding rate; V100 = green manuring of pure vetch at full seeding rate; B75V25 = green manuring of a mixture of barley and vetch at the ratio of 75:25 of their own full seed rates; Fert_N200 = mineral fertigation with 200 kg N ha−1; B100 + Fert and B75V25 + Fert = green manuring with B100 and B75V25, respectively, plus N supplementation with mineral fertigation to reach 200 kg N ha−1; N0 = unfertilized control, with no green manuring or fertigation. The symbols represent observed data (mean of n = 3 replicates). The curve represents the critical reduced-N concentration of processing tomato [27].
Agronomy 10 00977 g002
Figure 3. Time course of NO3-N concentration in soil solution (mg L−1) at a 0.9 m depth during the periods December 2010–August 2011 (A) and April 2012–August 2012 (B) in processing tomato grown with different N fertilization strategies. B100 = green manuring of pure barley at full seeding rate; V100 = green manuring of pure vetch at full seeding rate; B75V25 = green manuring of a mixture of barley and vetch at the ratio of 75:25 of their own full seed rates; Fert_N200 = mineral fertigation with 200 kg N ha−1; B100 + Fert and B75V25 + Fert = green manuring with B100 and B75V25, respectively, plus N supplementation with mineral fertigation to reach 200 kg N ha−1; N0 = unfertilized control, with no green manuring or fertigation. Each value is the mean of n = 6 replicates. Vertical bars represent SEs. Different y-axis scales are used for the two years.
Agronomy 10 00977 g003
Table 1. Experimental details: treatment codes, description, amount of N supplied by fertigation only and total N supplied by cover crops + fertigation.
Treatment CodeDescriptionN Supplied by Fertigation
(kg ha−1)
Total N Supplied
(CC a + Fertigation)
(kg ha−1)
2011201220112012
B100pure barley--2267
B75V25mixture barley/vetch--3467
V100pure vetch--112166
Fert_N200mineral fertigation200200200200
B100 + Fertpure barley + fertigation178133200200
B75V25 + Fertmixture barley/vetch + fertigation166133200200
N0unfertilized control----
a CC = cover crops.
Table 2. Aboveground dry matter (DM) and nitrogen accumulation in the aboveground biomass (Nacc), and carbon to nitrogen (C/N) ratio of cover crops at incorporation date in 2011 and 2012.
TreatmentsDM (Mg ha−1)Nacc (kg ha−1)C/N
201120122011201220112012
B1002.286.33226744.239.4
B75V252.486.25346731.639.5
V1003.775.94 a11216614.315.0
Significance of fixed effects
Treatments (T)ns****
Year (Y)** **ns
T × Ynsns**
Pooled SED0.90714.03.34
B100 = pure barley at full seeding rate; V100 = pure vetch at full seeding rate; B75V25 = mixture of barley and vetch at the ratio of 75:25 of their own full seed rates. Each value is the mean of n = 3 replicates. a weed biomass included; **: p < 0.01; ns: not significant; SED: pooled standard error of differences.
Table 3. Aboveground dry matter accumulation (DM), total N uptake, total fresh fruit yield (TY) and marketable fresh fruit yield (MY) in processing tomato grown in 2011 and 2012 with different N fertilization strategies.
TreatmentsDM (Mg ha−1)N uptake (kg ha−1)TY (Mg ha−1)MY (Mg ha−1)
20112012201120122011201220112012
B1005.667.1910310768.090.557.965.2
B75V257.367.2914311088.887.179.162.9
V10011.2111.70195180136.3138.6124.3114.8
Fert_N20012.6215.07348394172.3169.3146.1147.2
B100 + Fert11.2612.03304274145.3158.1123.6132.2
B75V25 + Fert10.7612.96289266154.0148.3132.9126.9
N07.029.2911818489.8111.477.796.1
Significance of fixed effects
Treatment (T)*******
Year (Y)*nsnsns
T × Y nsns****
Pooled SED1.08124.712.4310.25
B100 = green manuring of pure barley at full seeding rate; V100 = green manuring of pure vetch at full seeding rate; B75V25 = green manuring of a mixture of barley and vetch at the ratio of 75% and 25%, respectively, of their own full seeding rates; Fert_N200 = mineral fertigation with 200 kg N ha−1; B100 + Fert and B75V25 + Fert = green manuring with B100 and B75V25, respectively, plus N supplementation with mineral fertigation to reach 200 kg N ha−1; N0 = unfertilized control, with neither green manuring nor fertigation. Each value is the mean of n = 3 replicates. *: p < 0.05; **: p < 0.01; ns: not significant; SED: pooled standard error of differences.
Table 4. Cumulative drainage simulated by the DNDC model and measured NO3-N leached during the cover crop growing cycle and the whole experimental period in 2010–2011 and 2011–2012 as a function of tomato N fertilization strategies.
TreatmentsDrainage CC a (mm)Drainage TOT b (mm) NO3-N Leached CC a (kg ha−1)NO3-N Leached TOT a (kg ha−1)
1st Year2nd Year1st Year2nd Year1st Year2nd Year1st Year2nd Year
B100327243523506647926
B75V25327233343257278630
V100426815681911101511929
Fert_N2004311274321351323314041
B100 + Fert3272433045634776
B75V25 + Fert32723330447278610
N043112758334413233153101
Significance of fixed effects
Treatment (T) ****
Year (Y) ****
T × Y nsns
Pooled SED 13.0213.36
a CC = cover crops; b TOT = cover crop + tomato cycles. B100 = green manuring of pure barley at full seeding rate; V100 = green manuring of pure vetch at full seeding rate; B75V25 = green manuring of a mixture of barley and vetch at the ratio of 75% and 25%, respectively, of their own full seeding rates; Fert_N200 = mineral fertigation with 200 kg N ha−1; B100 + Fert and B75V25 + Fert = green manuring with B100 and B75V25, respectively, plus N supplementation with mineral fertigation to reach 200 kg N ha−1; N0 = unfertilized control, with neither green manuring nor fertigation. Each value is the mean of n = 3 replicates. **: p < 0.01; ns: not significant; SED: pooled standard error of differences.