Effect of Conversion to Organic Farming on Pest and Disease Control in French Vineyards


Abstract
1. Introduction
2. Material and Methods
2.1. Grapevines (Vitis vinifera) Growing System
2.2. Vineyard Network
2.3. Pest and Disease Monitoring
2.4. Overall Climatic Conditions and Natural Pest and Disease Pressure at the Regional Scale
2.5. Statistical Analysis
3. Results
3.1. Mixed Models Selection and Estimation
3.2. Per-Pathogen, Mono-Disease Analyses
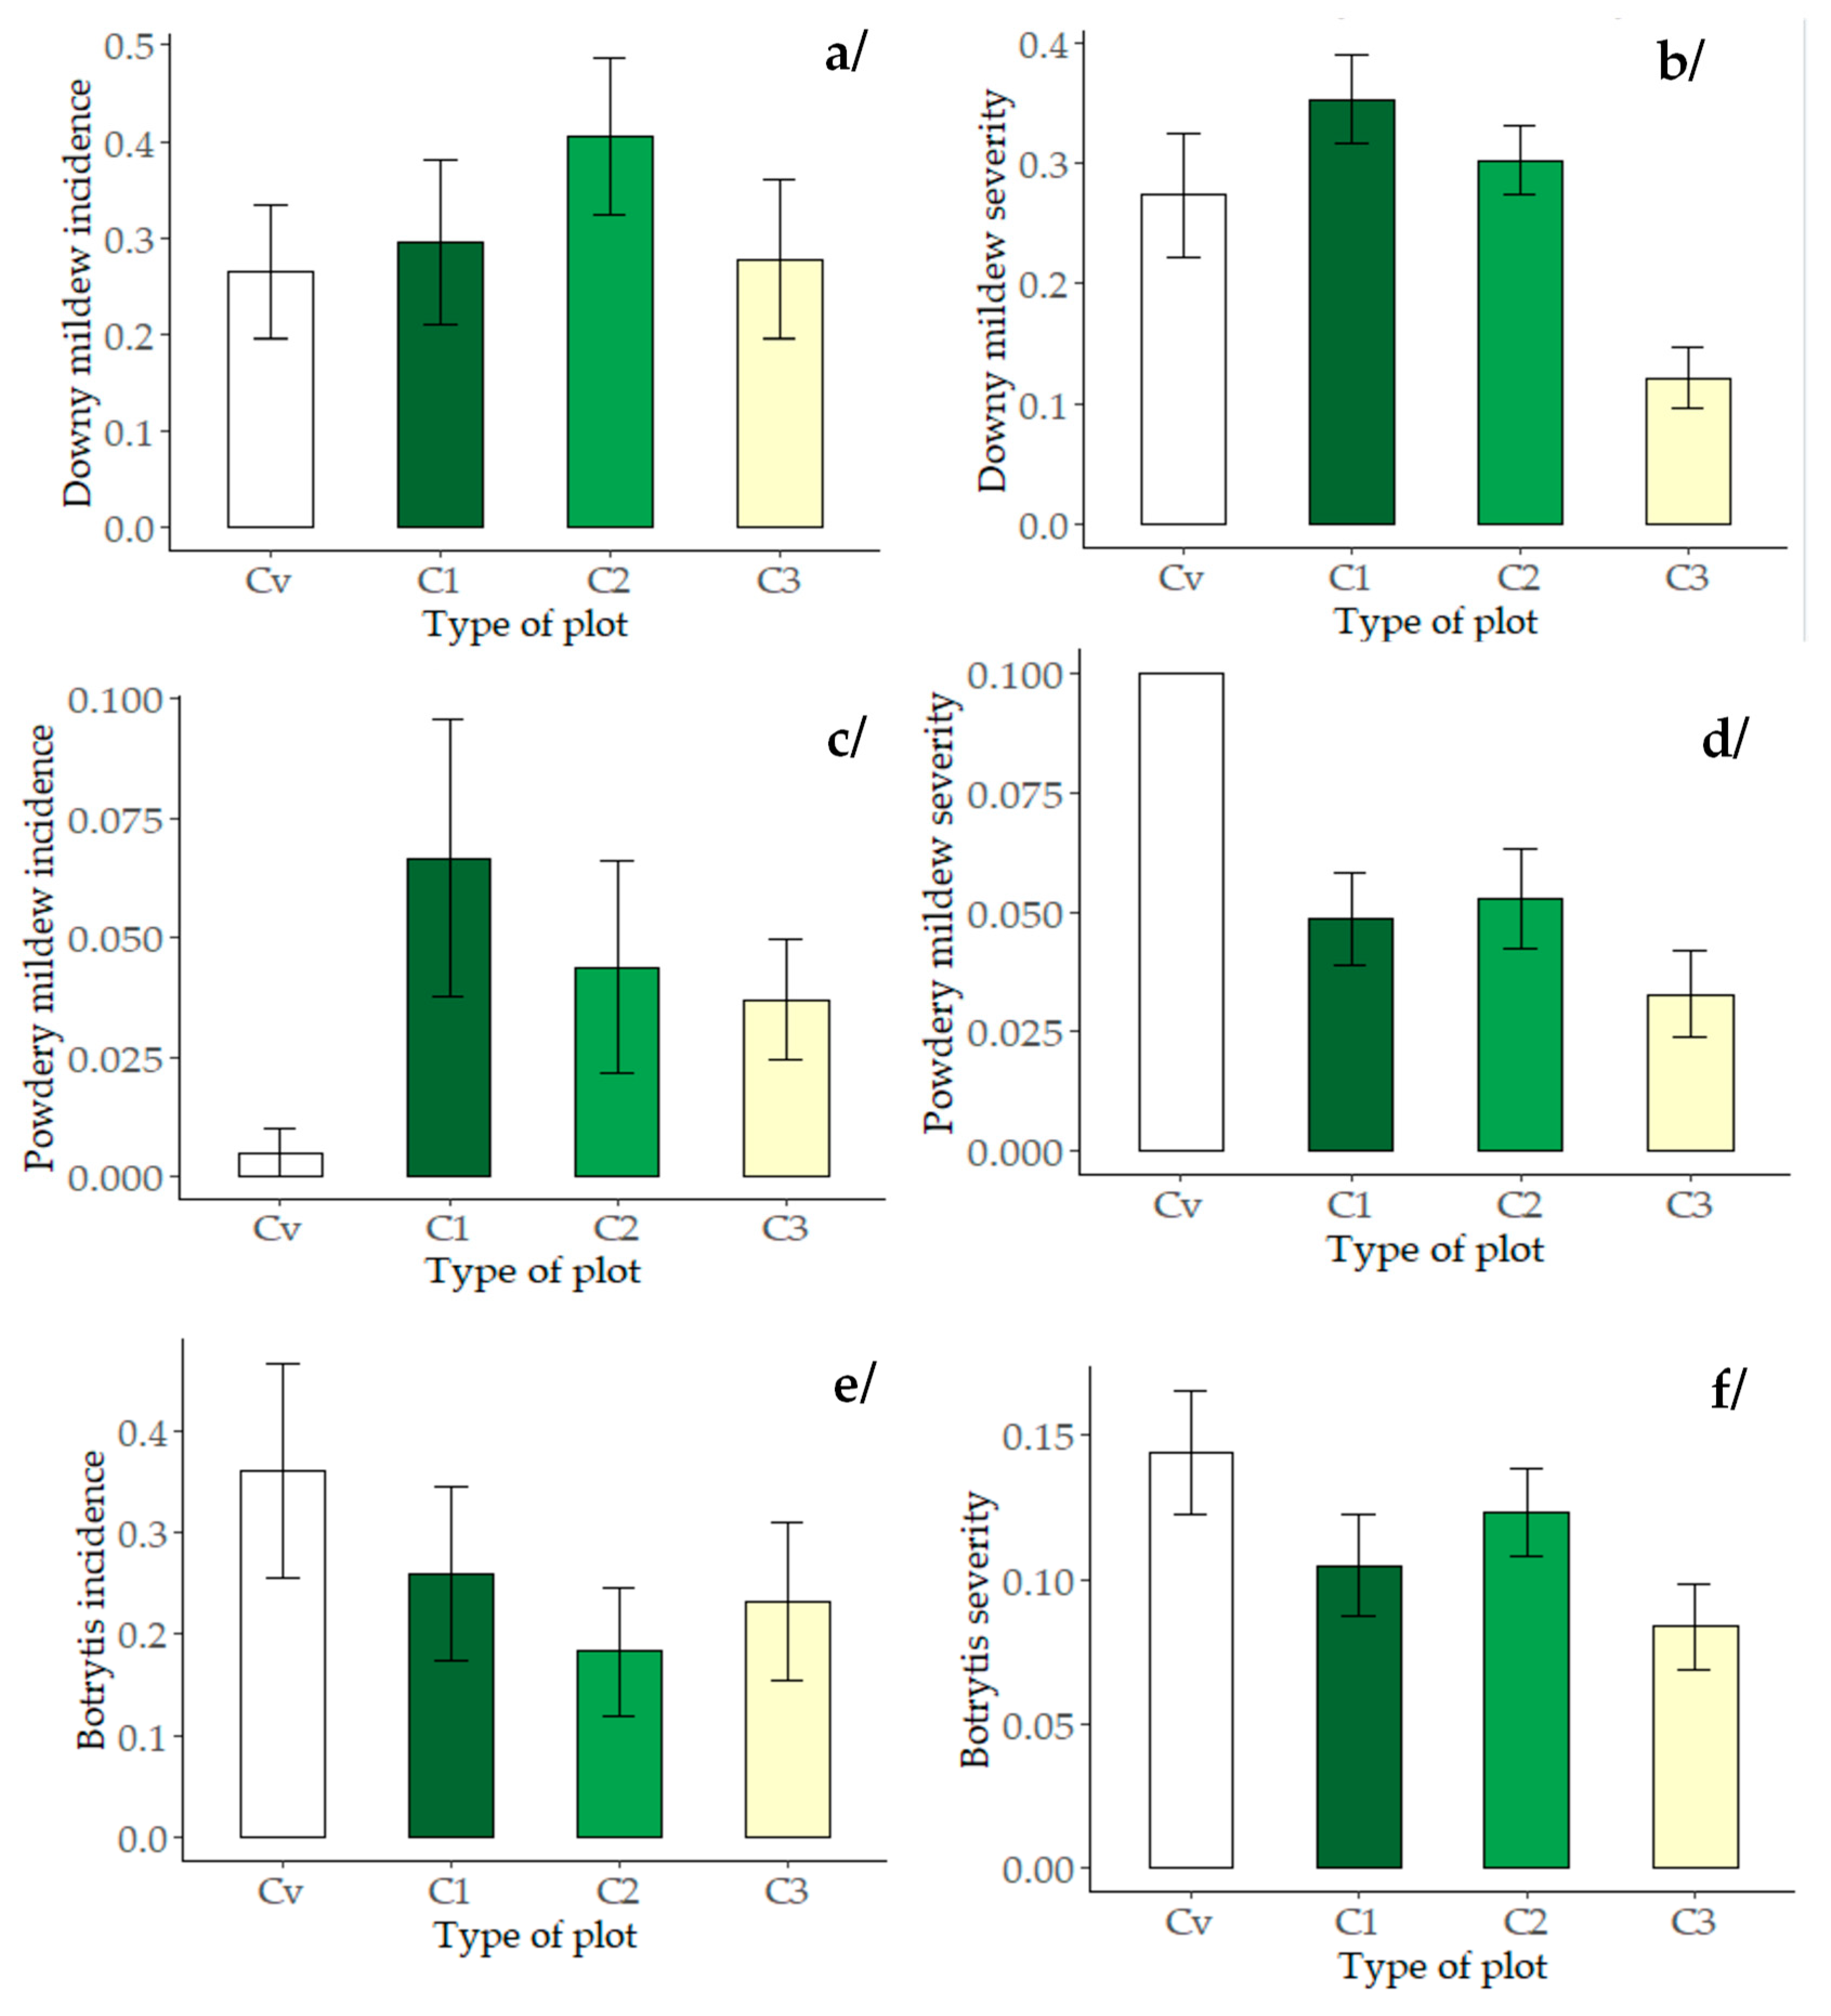
3.2.1. Downy Mildew
3.2.2. Powdery Mildew
3.2.3. Botrytis
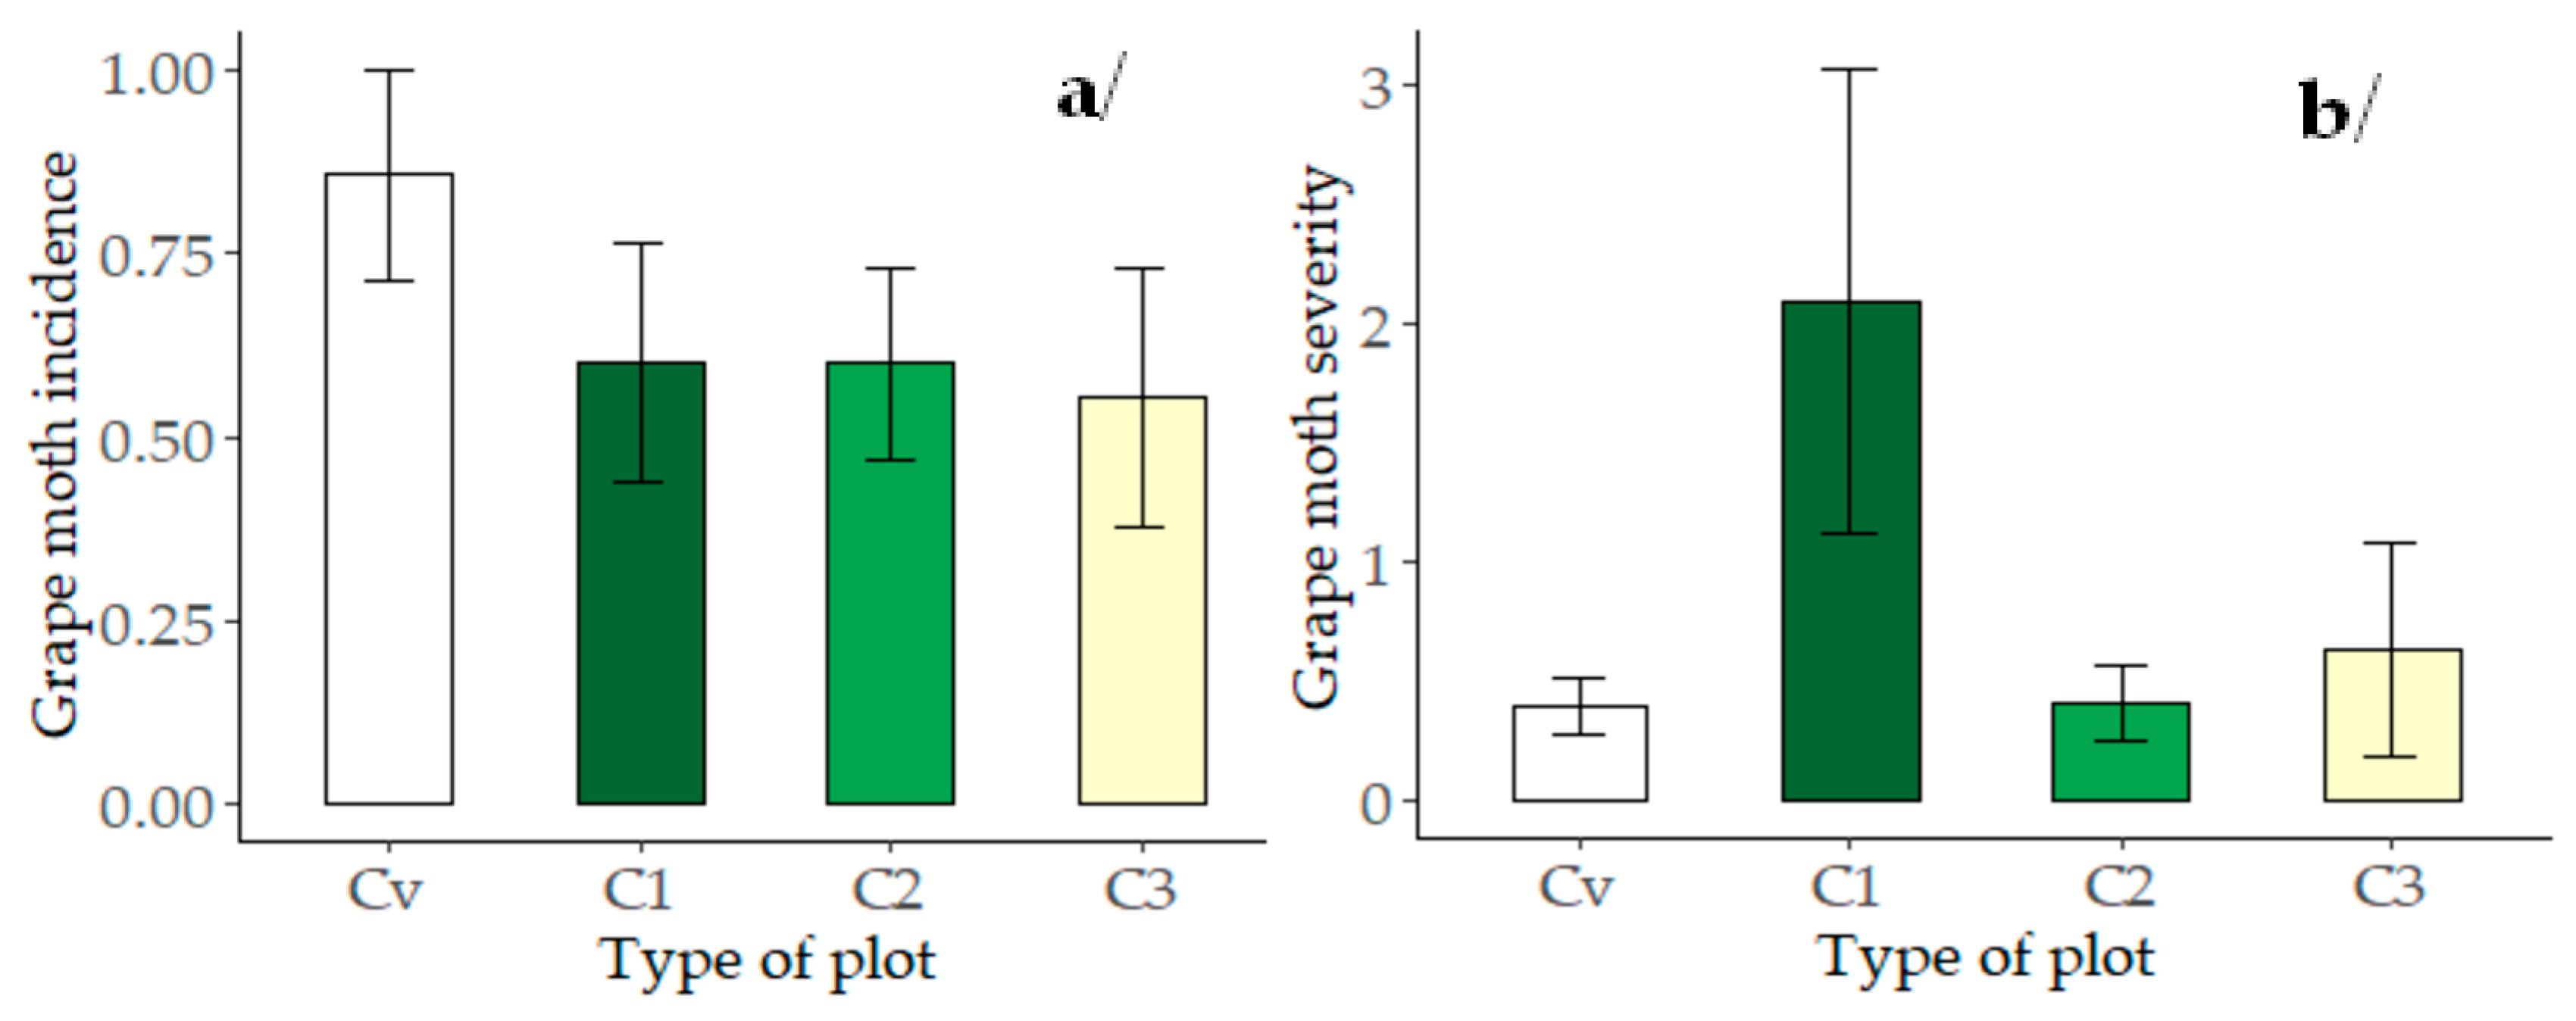
3.2.4. Grape Moth
3.3. Integrated Multi-Pathogen Approaches
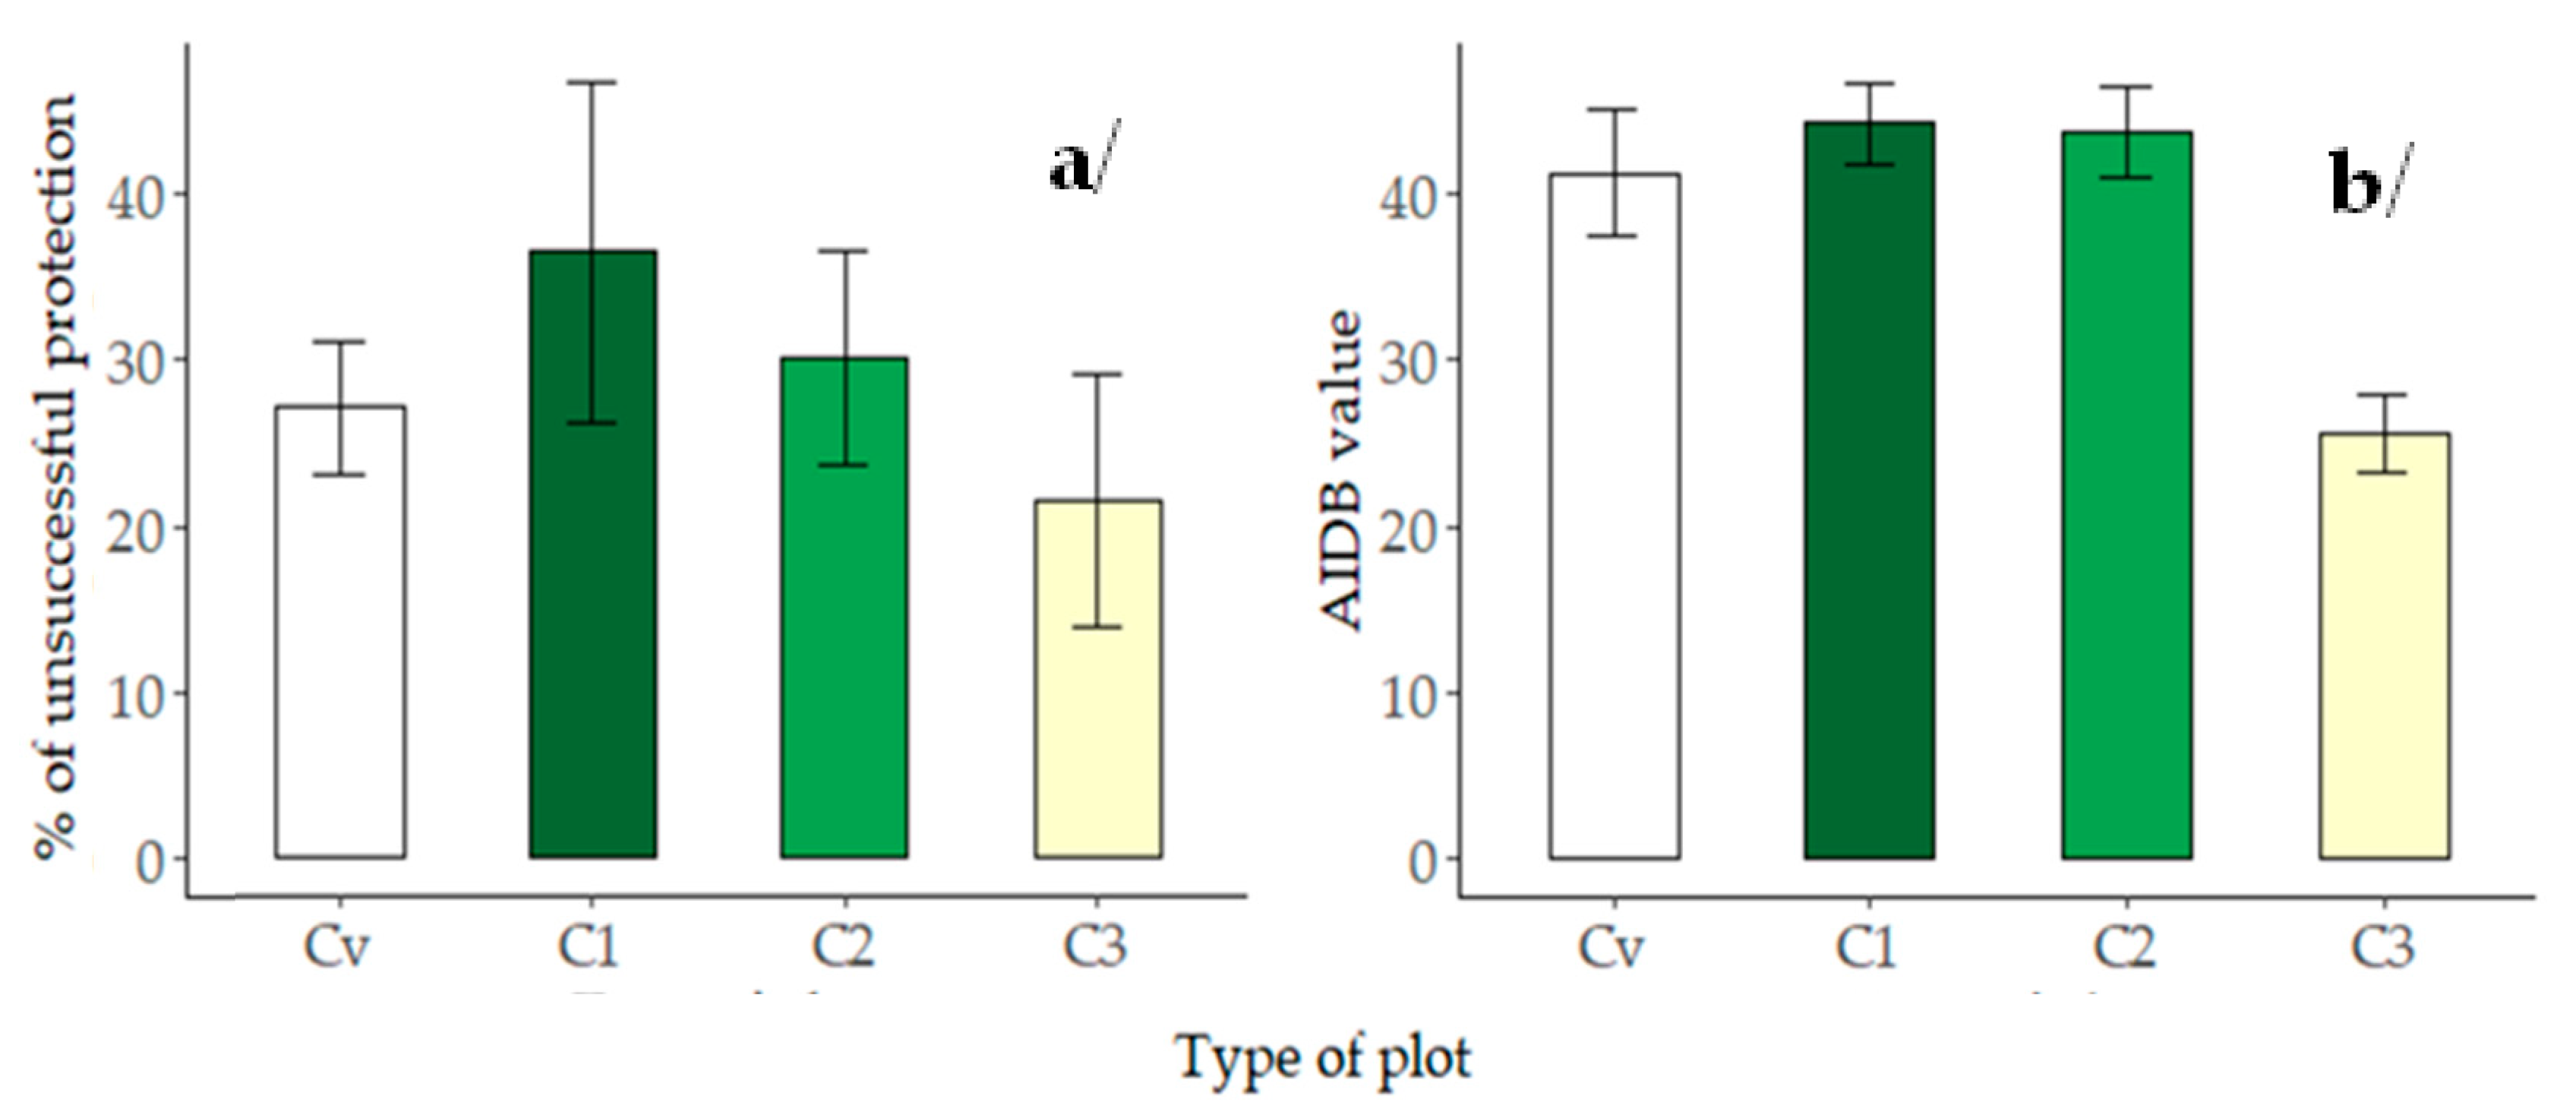
3.3.1. Assessment Indicator of Damage in Berries (AIDB)
3.3.2. Healthy Berries Percentage
4. Discussion
Author Contributions
Funding
Acknowledgments
Conflicts of Interest
References
- Tscharntke, T.; Clough, Y.; Wanger, T.C.; Jackson, L.; Motzke, I.; Perfecto, I.; Vandermeer, J.; Whitbread, A. Global food security, biodiversity conservation and the future of agricultural intensification. Biol. Conser. 2012, 151, 53–59. [Google Scholar] [CrossRef]
- Caron, P.; Bienabe, E.; Hainzelin, E. Making transition towards ecological intensification of agriculture a reality: The gaps in and the role of scientific knowledge. Curr. Opin. Environ. Sustain. 2014, 8, 44–52. [Google Scholar] [CrossRef]
- Lin, B.B.; Flynn, D.F.B.; Bunker, D.E.; Uriarte, M.; Naeem, S. The effect of agricultural diversity and crop choice on functional capacity change in grassland conversions. J. Appl. Ecol. 2011, 48, 609–618. [Google Scholar] [CrossRef]
- Duru, M.; Therond, O.; Martin, G.; Martin-Clouaire, R.; Magne, M.-A.; Justes, E.; Journet, E.-P.; Aubertot, J.-N.; Savary, S.; Bergez, J.-E.; et al. How to implement biodiversity-based agriculture to enhance ecosystem services: A review. Agron. Sustain. Dev. 2015, 35, 1259–1281. [Google Scholar] [CrossRef]
- Hill, S.B.; MacRae, R.J. Conceptual Framework for the Transition from Conventional to Sustainable Agriculture. J. Sustain. Agric. 1996, 7, 81–87. [Google Scholar] [CrossRef]
- Meziere, D.; Gary, C.; Barbier, J.M.; Bernos, L.; Clement, C.; Constant, N.; Deliere, L.; Forget, D.; Grosman, J.; Molot, B.; et al. Ecophyto R&D. Vers des Systèmes de Culture Économes en Pesticides. Volet 1. Tome III: Analyse Comparative de Différents Systèmes en Viticulture. 2009; 84. [Google Scholar]
- Simonovici, M. Enquêtes Pratiques Phytosanitaires en Viticulture en 2016. Available online: https://agreste.agriculture.gouv.fr/agreste-web/download/publication/publie/Dos1902/Dossier2019-2.pdf (accessed on 10 February 2020).
- Lamine, C.; Bellon, S. Conversion to organic farming: A multidimensional research object at the crossroads of agricultural and social sciences. A review. Agron. Sustain. Dev. 2009, 29, 97–112. [Google Scholar] [CrossRef]
- Merot, A.; Alonso Ugaglia, A.; Barbier, J.-M.; Del’homme, B. Diversity of conversion strategies for organic vineyards. Agron. Sustain. Dev. 2019, 39, 16. [Google Scholar] [CrossRef]
- Fermaud, M.; Smits, N.; Merot, A.; Roudet, J.; Thiery, D.; Wéry, J.; Delbac, L. New multipest damage indicator to assess protection strategies in grapevine cropping systems. Aust. J. Grape Wine Res. 2016, 22, 450–461. [Google Scholar] [CrossRef]
- Leroy, P.; Smits, N.; Cartolaro, P.; Delière, L.; Goutouly, J.-P.; Raynal, M.; Alonso Ugaglia, A. A bioeconomic model of downy mildew damage on grapevine for evaluation of control strategies. Crop Prot. 2013, 53, 58–71. [Google Scholar] [CrossRef]
- Davy, A.; Raynal, M.; Vergnes, M.; Remenant, S.; Michez, A.; Claverie, M.; Codis, S.; Bernard, F.; Colombier, L.; Davidou, L.; et al. Trials results of the “Optidose” method using an adjustment of the pesticide dose for control of downy and powdery mildew. In Proceedings of the 6th International workshop of Grapevine Downy and Powdery Mildew, Bordeaux, France, 4–9 July 2010; pp. 123–125. [Google Scholar]
- Léger, B.; Naud, O.; Bellon Maurel, V.; Clerjeau, M.; Delière, L.; Cartolaro, P.; Delbac, L. GrapeMilDeWS: A formally designed integrated pest management decision process against grapevine powdery and downy mildews. In Decision Support Systems in Agriculture, Food and the Environment: Trends, Applications and Advances; Manos, B., Matsatsinis, N., Paparrizos, K., Papathanasiou, J., Eds.; IGI Global: Hershey, PA, USA, 2010; pp. 246–269. [Google Scholar] [CrossRef]
- Pertot, I.; Caffi, T.; Rossi, V.; Mugnai, L.; Hoffmann, C.; Grando, M.S.; Gary, C.; Lafond, D.; Duso, C.; Thiery, D.; et al. A critical review of plant protection tools for reducing pesticide use on grapevine and new perspectives for the implementation of IPM in viticulture. Crop Prot. 2017, 97, 70–84. [Google Scholar] [CrossRef]
- Barbier, M.; Lémery, B. Learning through processes of change in agriculture: A methodological framework. In Cow up a Tree. Knowing and Learning for Change in Agriculture. Case Studies from Industrialised Countries; INRA: Paris, France, 2000; pp. 381–393. [Google Scholar]
- Merot, A.; Wery, J. Converting to organic viticulture increases cropping system structure and management complexity. Agron. Sustain. Dev. 2017, 37, 19. [Google Scholar] [CrossRef]
- Toffolini, Q.; Jeuffroy, M.-H.; Prost, L. Indicators used by farmers to design agricultural systems: A survey. Agron. Sustain. Dev. 2015, 36, 5. [Google Scholar] [CrossRef]
- Ramos, I.J.; Ribeiro, J.A.; Figueiredo, D. Effects of vineyard agricultural practices on the diversityof macroinvertebrates. In Proceedings of the 2019; 41st World Congress of Vine and Wine, Punta del este, Uruguay, 19–23 November 2018. [Google Scholar]
- Barzman, M.; Bàrberi, P.; Birch, A.N.E.; Boonekamp, P.; Dachbrodt-Saaydeh, S.; Graf, B.; Hommel, B.; Jensen, J.E.; Kiss, J.; Kudsk, P.; et al. Eight principles of integrated pest management. Agron. Sustain. Dev. 2015, 35, 1199–1215. [Google Scholar] [CrossRef]
- Darnhofer, I. Socio-technical transitions in farming: Key concepts. In Transition Pathways towards Sustainability in European Agriculture. Case Studies from Europe; Sutherland, L.-A., Darnhofer, I., Wilson, G.A., Zagata, L., Eds.; CAB International: Wallingford, UK, 2015. [Google Scholar]
- Foxon, T.J. A coevolutionary framework for analysing a transition to a sustainable low carbon economy. Ecol. Econ. 2011, 70, 2258–2267. [Google Scholar] [CrossRef]
- Calvo-Garrido, C.; Roudet, J.; Aveline, N.; Davidou, L.; Dupin, S.; Fermaud, M. Microbial Antagonism Toward Botrytis Bunch Rot of Grapes in Multiple Field Tests Using One Bacillus ginsengihumi Strain and Formulated Biological Control Products. Front. Plant Sci. 2019, 10, 105. [Google Scholar] [CrossRef]
- Guilpart, N.; Metay, A.; Gary, C. Grapevine bud fertility and number of berries per bunch are determined by water and nitrogen stress around flowering in the previous year. Eur. J. Agron. 2014, 54, 9–20. [Google Scholar] [CrossRef]
- Calonnec, A.; Cartolaro, P.; Poupot, C.; Dubourdieu, D.; Darriet, P. Effects of Uncinula necator on the yield and quality of grapes (Vitis vinifera) and wine. Plant Pathol. 2004, 53, 434–445. [Google Scholar] [CrossRef]
- Gadoury, D.M.; Seem, R.C.; Pearson, R.C.; Wilcox, W.F.; Dunst, R.M. Effects of powdery mildew on vine growth, yield, and quality of concord grapes. Plant Dis. 2001, 85, 137–140. [Google Scholar] [CrossRef]
- Ky, I.; Lorrain, B.; Jourdes, M.; Pasquier, G.; Fermaud, M.; Gény, L.; Rey, P.; Doneche, B.; Teissedre, P.L. Assessment of grey mould (Botrytis cinerea) impact on phenolic and sensory quality of Bordeaux grapes, musts and wines for two consecutive vintages. Aust. J. Grape Wine Res. 2012, 18, 215–226. [Google Scholar] [CrossRef]
- Pons, A.; Mouakka, N.; Deliere, L.; Crachereau, J.C.; Davidou, L.; Sauris, P.; Guilbault, P.; Darriet, P. Impact of Plasmopara viticola infection of Merlot and Cabernet Sauvignon grapes on wine composition and flavor. Food Chem. 2018, 239, 102–110. [Google Scholar] [CrossRef] [PubMed]
- Jermini, M.; Blaise, P.; Gessler, C. Quantitative effect of leaf damage caused by downy mildew (Plasmopara viticola) on growth and yield quality of grapevine ‘Merlot” (Vitis vinifera). Vitis 2010, 49, 77–85. [Google Scholar]
- Jermini, M.; Blaise, P.; Gessler, C. Response of ‘Merlot’ (Vitis vinifera) grapevine to defoliation caused by downy mildew (Plasmopara viticola) during the following growing season. Vitis 2010, 49, 161–166. [Google Scholar]
- Coombe, B.G. Growth Stages of the Grapevine: Adoption of a system for identifying grapevine growth stages. Aust. J. Grape Wine Res. 1995, 1, 104–110. [Google Scholar] [CrossRef]
- Merot, A.; Belhouchette, H.; Saj, S.; Wery, J. Implementing organic farming in vineyards. Agroecol. Sustain. Food Syst. 2019, 44, 164–187. [Google Scholar] [CrossRef]
- Wilcox, W.F.; Gubler, W.D.; Uyemoto, J.K. Compendium of Grape Diseases, Disorders, and Pests, 2nd ed.; The American Phytopathological Society (APS): St. Paul, MN, USA, 2015. [Google Scholar] [CrossRef]
- Delbac, L.; Thiery, D. Damage to grape flowers and berries by Lobesia botrana larvae (Denis & Schiffernuller) (Lepidoptera: Tortricidae), and relation to larval age. Aust. J. Grape Wine Res. 2016, 22, 256–261. [Google Scholar] [CrossRef]
- Stockel, J.; Schmitz, V.; Lecharpentier, P.; Roehrich, R.; Vila, M.T.; Neumann, U.; Brustis, J.M.; Pronier, V. A 5-year experiment in the control of the grape moth Lobesia botrana using mating disruption in a bordeaux vineyard. Agronomie 1994, 14, 71–82. [Google Scholar] [CrossRef]
- Renaud-Gentié, C.; Dieu, V.; Thiollet-Scholtus, M.; Mérot, A. Addressing organic viticulture environmental burdens by better understanding interannual impact variations. Int. J. Life Cycle Assess. 2019, 1–16. [Google Scholar] [CrossRef]
- R Core Team. R: A Language and Environment for Statistical Computing; R Foundation for Statistical Computing: Vienna, Austria, 2017. [Google Scholar]
- Bolker, B.M.; Brooks, M.E.; Clark, C.J.; Geange, S.W.; Poulsen, J.R.; Stevens, M.H.; White, J.S. Generalized linear mixed models: A practical guide for ecology and evolution. Trends Ecol. Evol. 2009, 24, 127–135. [Google Scholar] [CrossRef] [PubMed]
- Zuur, A.; Ieno, E.N.; Walker, N.; Saveliev, A.A.; Smith, G.M. Mixed Effects Models and Extensions in Ecology with R; Springer: New York, NY, USA, 2009; p. 574. [Google Scholar]
- Bates, D.; Maechler, M.; Bolker, B.; Walker, S. Fitting Linear Mixed-Effects Models Using lme4. J. Stat. Softw. 2015, 61, 1–48. [Google Scholar] [CrossRef]
- Pinheiro, J.; Bates, D.; DebRoy, S.; Sarkar, D.; R Core Team. nlme: Linear and Nonlinear Mixed Effects Models. R package version 3.1-148. 2020. Available online: https://CRAN.R-project.org/package=nlme (accessed on 4 May 2020).
- Akaike, H. A new look at the statistical model identification. IEEE Trans. Autom. Control 1974, 19, 716–723. [Google Scholar] [CrossRef]
- Burnham, K.P.; Anderson, D.R. Model Selection and Multimodel Inference—A Practical Information-Theoretic Approach; Springer: New York, NY, USA, 2002; p. 488. [Google Scholar]
- Hothorn, T.; Bretz, F.; Westfall, P. Simultaneous Inference in General Parametric Models. Biom. J. 2008, 50, 346–363. [Google Scholar] [CrossRef]
- Doring, J.; Frisch, M.; Tittmann, S.; Stoll, M.; Kauer, R. Growth, Yield and Fruit Quality of Grapevines under Organic and Biodynamic Management. PLoS ONE 2015, 10, e0138445. [Google Scholar] [CrossRef] [PubMed]
- Danner, R. Vergleichende Untersuchungen zum Konventionellen, Organisch-Biologischen und Biologisch-Dynamischen Weinbau. Doctoral Thesis, Universität für Bodenkultur, Wien, Austria, 1985. [Google Scholar]
- Dubos, B. Maladies Cryptogamiques de la Vigne, 2nd ed.; Féret, Ed.; Bordeaux, France, 2002. [Google Scholar]
- Panitrur-De La Fuente, C.; Valdes-Gomez, H.; Roudet, J.; Acevedo-Opazo, C.; Verdugo-Vasquez, N.; Araya-Alman, M.; Lolas, M.; Moreno, Y.; Fermaud, M. Classification of winegrape cultivars in Chile and France according to their susceptibility to Botrytis cinerea related to fruit maturity. Aust. J. Grape Wine Res. 2018, 24, 145–157. [Google Scholar] [CrossRef]
- Orpet, R.J.; Jones, V.P.; Beers, E.H.; Reganold, J.P.; Goldberger, J.R.; Crowder, D.W. Perceptions and outcomes of conventional vs. organic apple orchard management. Agric. Ecosyst. Environ. 2020, 289, 106723. [Google Scholar] [CrossRef]
- Garin, P.; Claverie, M.; Richy, D.; Bontemps, C. Dix ans D’observations Phytosanitaires du Vignoble de PACA. 2017. Available online: http://www.institut-rhodanien.com/download/1723 (accessed on 4 May 2020).
- Vallejo, A.; Millan, L.; Abrego, Z.; Sampedro, M.C.; Sanchez-Ortega, A.; Unceta, N.; Gomez-Caballero, A.; Goicolea, M.A.; Diez-Navajas, A.M.; Barrio, R.J. Fungicide distribution in vitiviniculture ecosystems according to different application strategies to reduce environmental impact. Sci. Total Environ. 2019, 687, 319–329. [Google Scholar] [CrossRef]
- Meite, F.; Alvarez-Zaldivar, P.; Crochet, A.; Wiegert, C.; Payraudeau, S.; Imfeld, G. Impact of rainfall patterns and frequency on the export of pesticides and heavy-metals from agricultural soils. Sci. Total Environ. 2018, 616, 500–509. [Google Scholar] [CrossRef]
- Chantre, E.; Cardona, A. Trajectories of French Field Crop Farmers Moving Toward Sustainable Farming Practices: Change, Learning, and Links with the Advisory Services. Agroecol. Sustain. Food Syst. 2014, 38, 573–602. [Google Scholar] [CrossRef]
- Meynard, J.-M.; Dedieu, B.; Bos, A.P. Re-design and co-design of farming systems. An overview of methods and practices. In Farming Systems Research into the 21st Century: The New Dynami; Darnhofer, I., Gibon, D., Dedieu, B., Eds.; Springer: Berlin/Heidelberg, Germany, 2012; pp. 407–432. [Google Scholar] [CrossRef]
- Prost, L.; Reau, R.; Paravano, L.; Cerf, M.; Jeuffroy, M.-H. Designing agricultural systems from invention to implementation: The contribution of agronomy. Lessons from a case study. Agric. Syst. 2018, 164, 122–132. [Google Scholar] [CrossRef]


| Synthetic Pesticides | Non Synthetic Pesticides Without Biocontrol Products | Biocontrol | ||||
|---|---|---|---|---|---|---|
| Fungicides (powdery and downy mildew) | Insecticides | Fungicides (powdery and downy mildew) | Insecticides | Fungicides (powdery and downy mildew) | Insecticides | |
| Cv | 11 | 15 | 0 | 0 | 4.4 | 0 |
| C1 | 0 | 0 | 5.2 | 0.2 | 4.8 | 0.1 |
| C2 | 0 | 0 | 6.4 | 0.05 | 6.4 | 0.06 |
| C3 | 0 | 0 | 5.6 | 1.1 | 6.7 | 0 |
| (a) Climatic Conditions | Year of Occurrence | |
| Pattern W1 | Temperature slightly below average and rain over average from January till September, fewer hot days (>30 °C) than average, sunny summer, very dry in June and August, “humid” in May and July | 2013 |
| Pattern W2 | Slightly over average temperatures January–April, average temperatures in summer, more rain than average June–August Less sunny than average July–September, | 2014 |
| Pattern W3 | less rainy than average, temperatures over average April–July | 2015, 2016 |
| (b) Pests and Diseases Pressures | ||
| Pattern P1 | Very low downy mildew at harvest, grape moths at a very high level in first generation and high level in third generation | 2015, 2016 |
| Pattern P2 | High number of moths at harvest, high severity of powdery mildew and low severity of downy mildew at harvest | 2014 |
| Pattern P3 | At harvest, very high downy mildew and low powdery mildew pressure, very high number of second-generation grape moths | 2013 |
| Variable | Model | Adjusted Means | ||||
|---|---|---|---|---|---|---|
| Model Type | p-Value | Cv | C1 | C2 | C3 | |
| Per-pathogen results | ||||||
| Downy mildew incidence | C-YP | 0.01 | 0.27 ab | 0.30 ab | 0.40 a | 0.27 b |
| Downy mildew severity in infected plots | C-YP-V | 0.31 | 0.27 | 0.34 | 0.29 | 0.12 |
| Powdery mildew incidence | C-P | 0.0002 | 0.0049 b | 0.068 a | 0.044 ab | 0.038 b |
| Powdery mildew severity in infected plots | C-YP-V | 0.15 | 0.10 | 0.048 | 0.053 | 0.033 |
| Botrytis incidence | C-YP | 0.0001 | 0.36 a | 0.26 a | 0.18 b | 0.23 ab |
| Botrytis severity in infected plots | C-YP-V | 0.16 | 0.14 | 0.10 | 0.13 | 0.079 |
| Grape moth incidence | C-YP | 0.68 | 0.90 | 0.63 | 0.62 | 0.56 |
| Grape moth severity in infected plots | C-YP-V | 0.02 | 0.40 a | 1.18 a | 0.41 a | 0.31 a |
| Synthetic indicators | ||||||
| Frequency of plots with AIDB exceeding 10% | C-YP | 0.002 | 31.6 ab | 42.2 a | 33.6 a | 25.3 b |
| AIDB in infected plots | C-YP-V | 0.37 | 41.1 | 44.1 | 43.5 | 25.5 |
| % healthy berries | C-YP-V | 0.29 | 81.4 | 65.1 | 65.5 | 74.7 |
© 2020 by the authors. Licensee MDPI, Basel, Switzerland. This article is an open access article distributed under the terms and conditions of the Creative Commons Attribution (CC BY) license (http://creativecommons.org/licenses/by/4.0/).
Share and Cite
Merot, A.; Fermaud, M.; Gosme, M.; Smits, N. Effect of Conversion to Organic Farming on Pest and Disease Control in French Vineyards. Agronomy 2020, 10, 1047. https://doi.org/10.3390/agronomy10071047
Merot A, Fermaud M, Gosme M, Smits N. Effect of Conversion to Organic Farming on Pest and Disease Control in French Vineyards. Agronomy. 2020; 10(7):1047. https://doi.org/10.3390/agronomy10071047
Chicago/Turabian StyleMerot, Anne, Marc Fermaud, Marie Gosme, and Nathalie Smits. 2020. "Effect of Conversion to Organic Farming on Pest and Disease Control in French Vineyards" Agronomy 10, no. 7: 1047. https://doi.org/10.3390/agronomy10071047
APA StyleMerot, A., Fermaud, M., Gosme, M., & Smits, N. (2020). Effect of Conversion to Organic Farming on Pest and Disease Control in French Vineyards. Agronomy, 10(7), 1047. https://doi.org/10.3390/agronomy10071047