Article

Genotype × Light Quality Interaction on Rose Architecture

1
IRHS-UMR1345, Université d’Angers, INRAE, Institut Agro, SFR 4207 QuaSaV, 49071 Beaucouzé, France
2
ASTREDHOR, Institut Technique de l’Horticulture, 75682 Paris, France
*
Author to whom correspondence should be addressed.
Agronomy 2020, 10(6), 913; https://doi.org/10.3390/agronomy10060913
Submission received: 27 May 2020 / Revised: 22 June 2020 / Accepted: 23 June 2020 / Published: 25 June 2020
(This article belongs to the Special Issue Control of LED Lighting Based on Plant Physiological Principles)

Abstract

:
Plant shape, and thereby plant architecture, is a major component of the visual quality of ornamental plants. Plant architecture results from growth and branching processes and is dependent on genetic and environmental factors such as light quality. The effects of genotype and light quality and their interaction were evaluated on rose bush architecture. In a climatic growth chamber, three cultivars (Baipome, Knock Out® Radrazz and ‘The Fairy’) with contrasting architecture were exposed to three different light spectra, using white (W), red (R), and far-red (FR) light-emitting diodes (LEDs), i.e., W, WR, and WRFR. The R/FR ratio varied between treatments, ranging from 7.5 for WRFR to 23.2 for WR. Light intensity (224.6 μmol m−2 s−1) was the same for all treatments. Plants were grown up to the order 1 axis flowering stage, and their architecture was digitized at two observation scales—plant and axis. Highly significant genotype and light quality effects were revealed for most of the variables measured. An increase in stem length, in the number of axes and in the number of flowered axes was observed under the FR enriched light, WRFR. However, a strong genotype × light quality interaction, i.e., a genotype-specific response was highlighted. More in-depth eco-physiological and biochemical investigations are needed to better understand rose behavior in response to light quality and thus identify the determinants of the genotype × light quality interaction.

1. Introduction

Ornamental plants for garden decoration have been commercialized in spring for quite a number of years. The plants are sold at the beginning of vegetation, or even at the beginning of flowering, and are necessarily grown in pots. One of the essential criteria for their visual quality is their overall shape, inherent to their architectural construction, i.e., the establishment across space of the different aerial organs according to the organization rules specific to each species [1].
Plant architecture depends on genetic and environmental factors, as well as on their interaction [2,3,4]. Plant shape can thus be genetically controlled by varietal improvement and/or cultivation by environmental control, such as modified light quality [5], water restriction [6,7], or mechanical stimulation [8]. However, these methods are applied more or less empirically by breeders and horticulturists. More extensive knowledge about the genotype × environment interaction would lead to a more effective control of the plant architecture, and consequently of its shape.
Plant architecture is complex to analyze, particularly in ornamental woody bushes, characterized by different types of axes and several orders of branching [9,10]. Its analysis has often been limited to a few architectural characteristics that can be easily measured manually, such as stem length and diameter [7,11,12].
Taking into account the entire plant architecture would make it possible to identify new variables potentially more explanatory of the observed variability. To meet this objective, we developed a method for analyzing the entire plant architecture by 3D digitalization of rose [9,13]. This species was chosen for: (i) its architectural complexity, characterized by several orders of branching, (ii) its architectural variability, ranging from a spreading to an upright growth habit, and (iii) its ornamental economic importance [14].
In this method, the plant architecture is broken down into axes and internods, which can be characterized morphologically (diameter and length), topologically (by determining succession and branching relationships), and geometrically (by characterizing their organization in space) [9,10,13]. An almost exhaustive description of the plant architecture is obtained and generates a large number of variables, many of which are inaccessible manually. For example, two types of axes—short and long—have been identified in rose [9].
The effect of genetic and environmental factors on rose architecture was demonstrated using this method [2,3,4]. Most architectural variables, such as the number of internodes, are moderately to strongly heritable [2,4]. Nevertheless, some of them (e.g., the number of branches, axis length) are highly influenced by the environment, more particularly by light intensity and water supply [3,7]. A strong genotype × environment interaction has been demonstrated and can be explained by contrasting or even opposing responses of genotypes to the environment, such as water supply [2,3,4].
Other environmental factors such as light quality strongly influence plant architecture [15,16]. Several families of photoreceptors allow the plant to perceive changes in the light quality and thus adapt its development. Red light—red (R; 600–700 nm) and far-red (FR; 700–800 nm)—is perceived by phytochromes, while blue light (B; 400–500 nm) is perceived by several families of photoreceptors, especially cryptochromes [15,16].
Elongation, branching, and flowering are particularly affected by red and blue lights [15,16]. A decreased R/FR ratio led to increased elongation, reduced branching, and accelerated flowering in chrysanthemum [5,17,18,19]. The same has been found true for snapdragon [20]. In contrast, the addition B light inhibited stem elongation in tomato, cucumber, and pepper [21] and increased the number of flower buds in impatiens [22].
The effect of red and blue lights on rose architecture has been poorly studied [11,12,23,24,25]. Few changes in plant architecture have been observed to date. However, the light spectrum modification devices used in those studies only tested a few wavelength ratios, i.e., the R/FR ratio and B light intensity [11,12,23,24,25]. In addition, the effect of these ratios was only evaluated on a few architectural characteristics such as axis length and diameter, without taking the different types of axes and the orders of branching into account, and on one or two varieties, without taking the variability of the genotypic response into account, as often observed in rose [2,3,4].
The light-emitting diode (LED) technology recently made it possible to manipulate the light spectrum, and made it easy to modify B, R and FR wavelength ratios and test a wider range of combinations in many horticultural species [15,16]. We conducted a series of tests in rose using a lighting device composed of white (W), R, and FR LEDs to select three light conditions characterized by different B/R and R/FR ratios and test whether they modified the plant architecture.
The objective of this study is to evaluate the effect of these three light conditions on the entire architecture of three varieties of bush rose chosen for their genotype-specific response to the environment [2,3,12].

2. Materials and Methods

2.1. Plant Material

The plant material was composed of three rose varieties with contrasting shapes: Baipome and ‘The Fairy’ (ground cover), chosen for their architectural plasticity, and Knock Out® Radrazz (upright bush), chosen for its insensitivity to light quality [2,3,12].
The plants were obtained from cuttings taken from mother plants, grown in pots in a greenhouse. The cuttings consisted of a single metamer taken from the median zone of the stems. The cuttings were planted in plugs (35 mm in diameter and 40 mm in height), composed of a non-woven cloth containing a mixture of fine peat and perlite. The rooting phase took place in the greenhouse, under a plastic tunnel. The mean temperature was 22 °C during the day and 18 °C at night, and relative humidity was maintained at saturation by a fine mist humidifier.
The young plants were potted four weeks later in 0.5–l pots, in a substrate composed of peat (50%), perlite (40%), and coconut fiber (10%) and then acclimatized in a greenhouse for one week.

2.2. Experimental Conditions

After this acclimatization phase, the plants were grown in a climatic chamber composed of two shelves (3.80 × 0.80 m). Mineral nutrition was provided by fertirrigation, in subirrigation, with a balanced liquid fertilizer (N–P2O5–K2O 3–2–6), a pH of 6.5 and an average electrical conductivity of 1.2 mS cm−1.
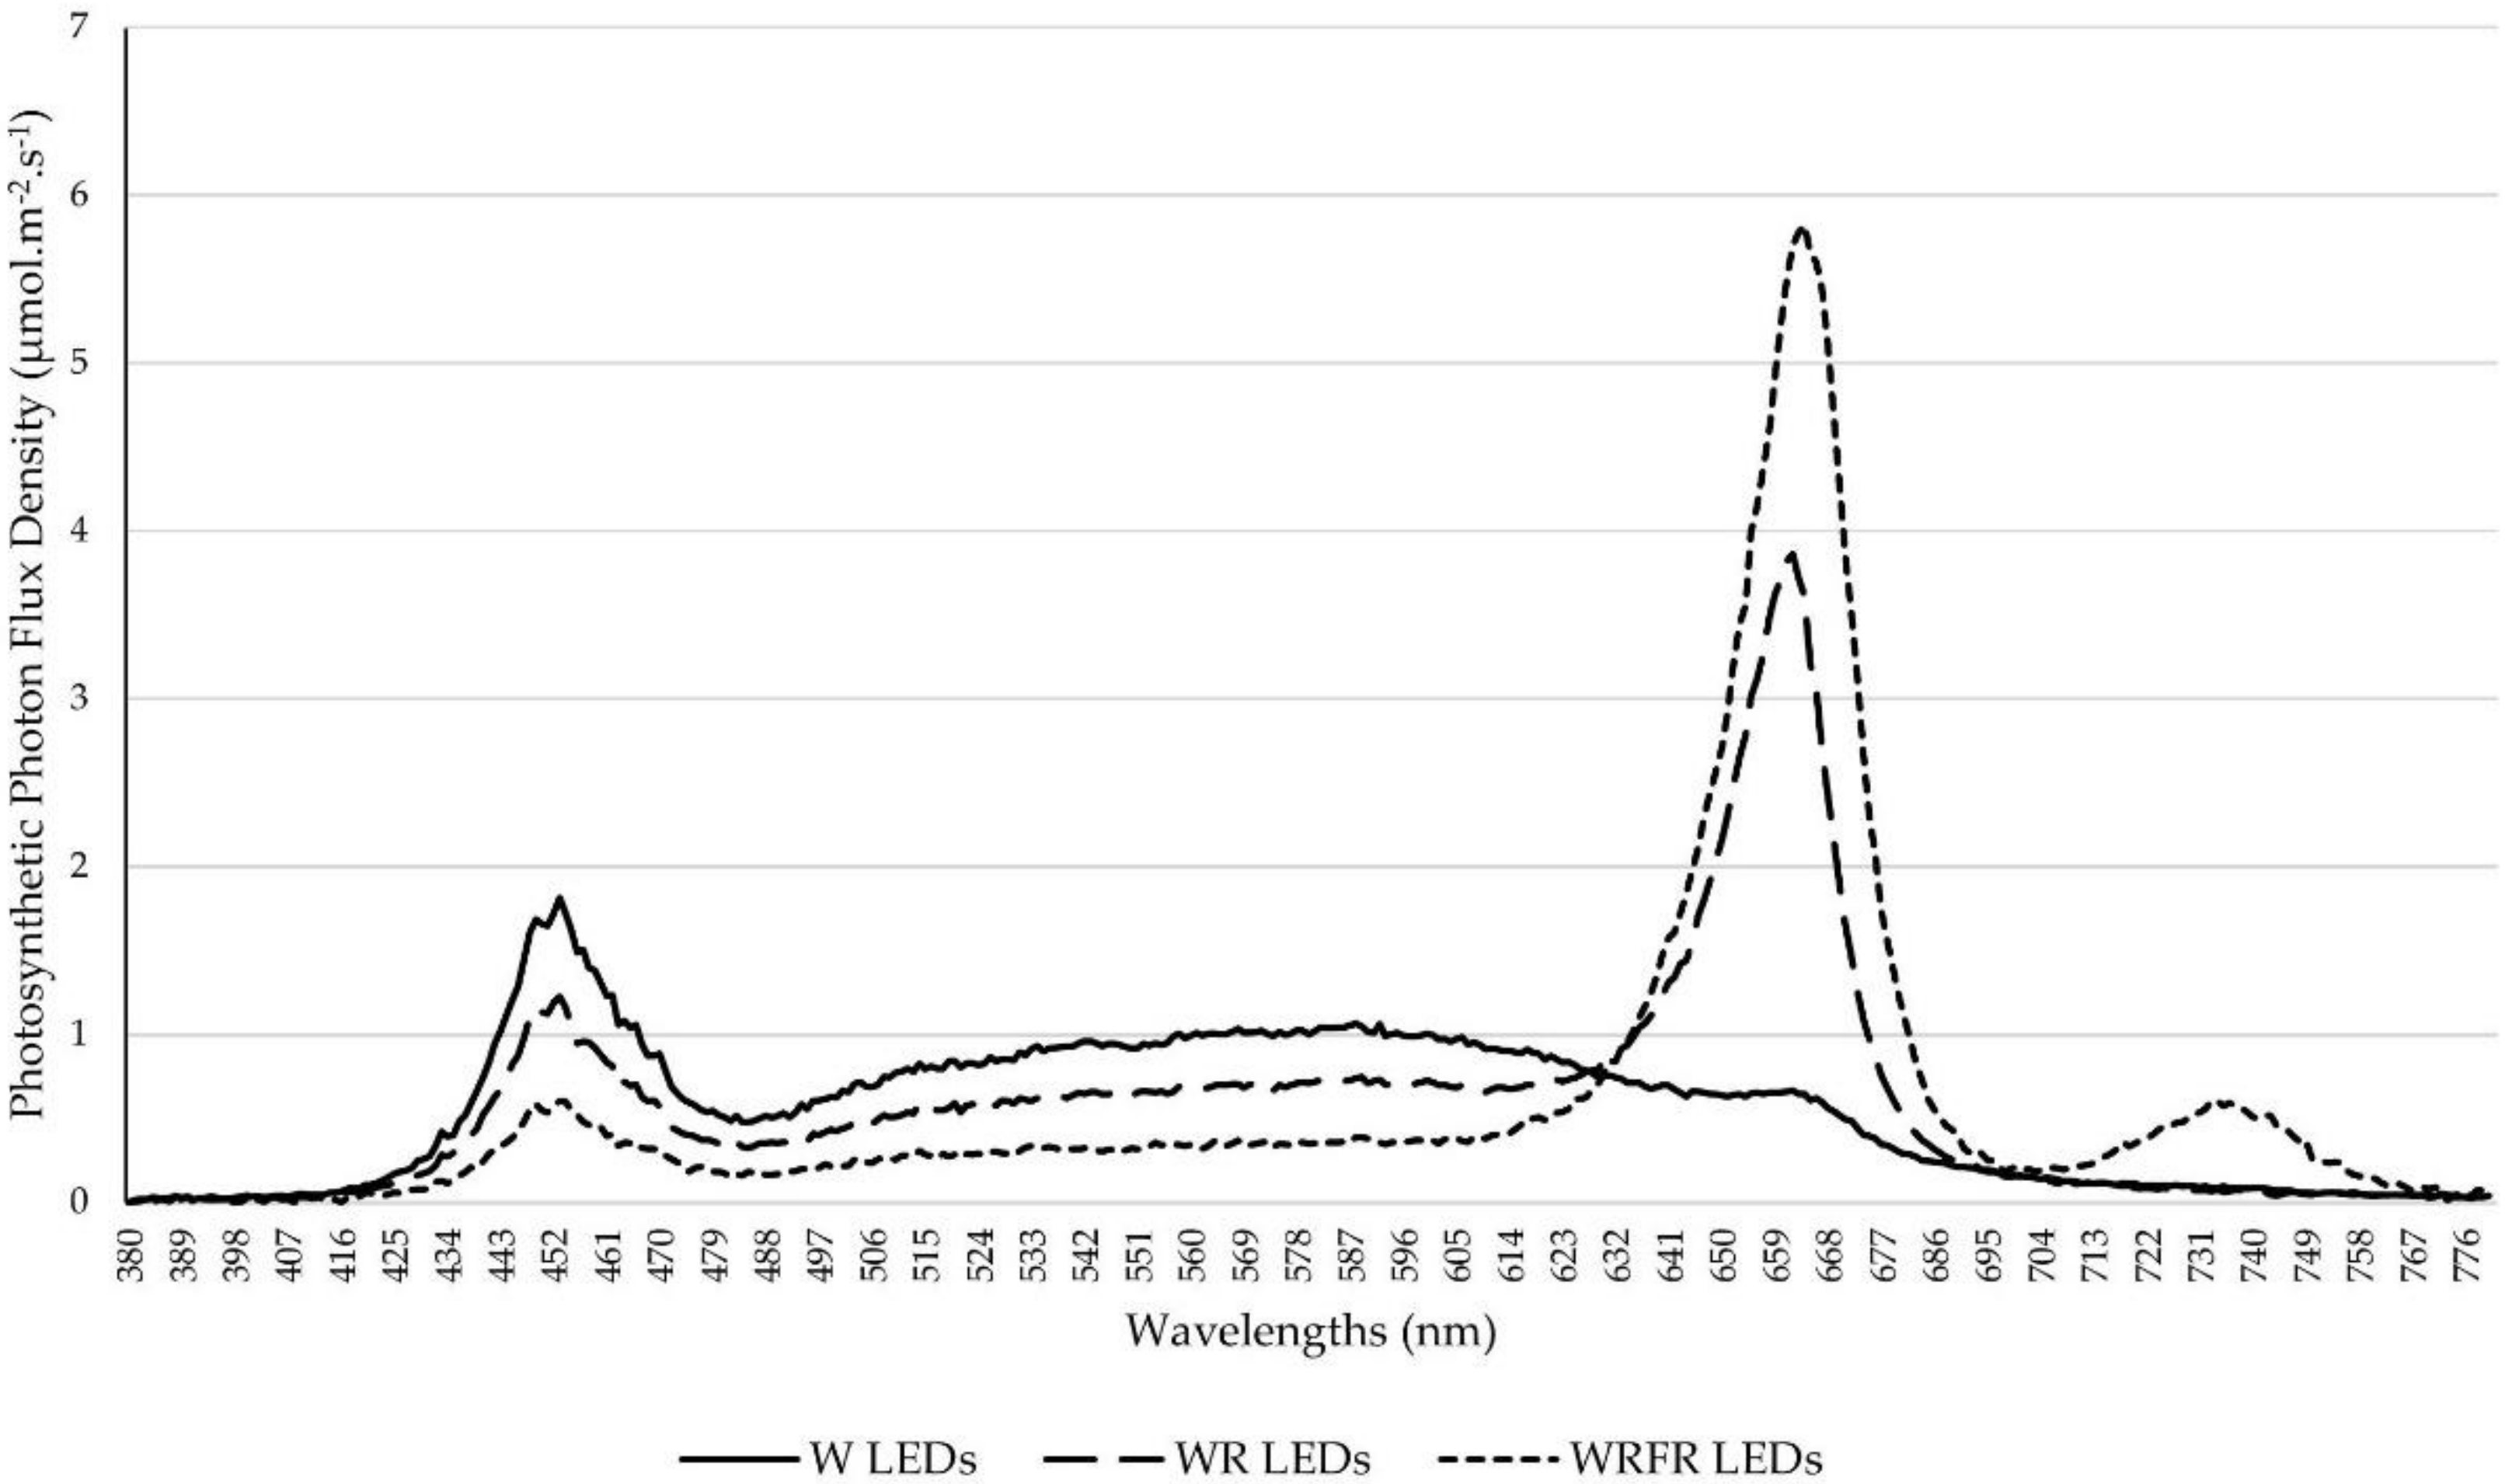
The air temperature was maintained at 20 °C during the day and 18 °C at night, with a relative humidity of 70%. The plants were subjected to a photoperiod of 16 h light/8 h dark, with an average photosynthetic photon flux density (PPFD; 400–700 nm) of 224.6 ± 20.1 µmol m−2 s−1 (a day light integral of 12.9 mol m−2 d−1) provided by a LED lighting device composed of panels of 12 W, R, and FR LED tubes (Cesbron, Saint Sylvain d’Anjou, France) according to the light condition tested. The climatic chamber was divided into three compartments separated by a white opaque panel making it possible to test three light conditions simultaneously, with the following spectral characteristics: the light spectrum of condition 1 (W) was composed of 65.8 µmol m−2 s−1 of B (or 29.0% of PPFD; 400–500 nm), 97.0 µmol m−2 s−1 of green (G; 42.7%; 500–600 nm), 64.1 µmol m−2 s−1 of R (28.3%; 600–700 nm), and 6.6 µmol m−2 s−1 of FR (700–800 nm) light on average; condition 2 (WR) was composed of 39.1 µmol m−2 s−1 of B (17.8%), 57.8 µmol m−2 s−1 of G (26.2%), 123.5 µmol m−2 s−1 of R (56.0%), and 5.3 µmol m−2 s−1 of FR light; condition 3 (WRFR) was composed of 22.8 µmol m−2 s−1 of B (10.1%), 33.3 µmol m−2 s−1 of G (14.7%), 170.4 µmol m−2 s−1 of R (75.2%), and 22.8 µmol m−2 s−1 of FR light (Figure 1). The PPFD and light spectra were measured using a Rainbow Light MR16 spectrometer (Rainbow Light Technology CO., LTD, Taiwan) placed at the top of pot. The spectral characteristics (PPFD, relative quantum efficiency (RQE), G/B, B/R, and R/FR ratios) of the three light conditions tested are specified in the Table 1. No significant difference was observed for PPFD and RQE between the light conditions (Table 1).
The experiment took place from November 2017 to March 2018 and was repeated in spring 2018, from February to May.
For the measurements, nine plants per variety and light condition were randomly selected (in the center of the shelf) at mid-culture (measurement point 1) and at the ‘opened flower of the order 1 axis’ stage, corresponding to the end of cultivation (measurement point 2).

2.3. Description of Plant Shape

At measurement point 2, the plant shape was described from a photograph, using the free image analysis software program ImageJ (National Institutes of Health, USA). A photograph of the widest side of the plant was taken in a standardized way, using a gray background for better color contrast. This photograph was then analyzed using ImageJ software. The convex envelope of the plant was first traced using the ’convex hull selection’ function, and then analyzed using the predefined morphometric variables of the ’set measurements’ function (Table 2).

2.4. Description of Plant Architecture

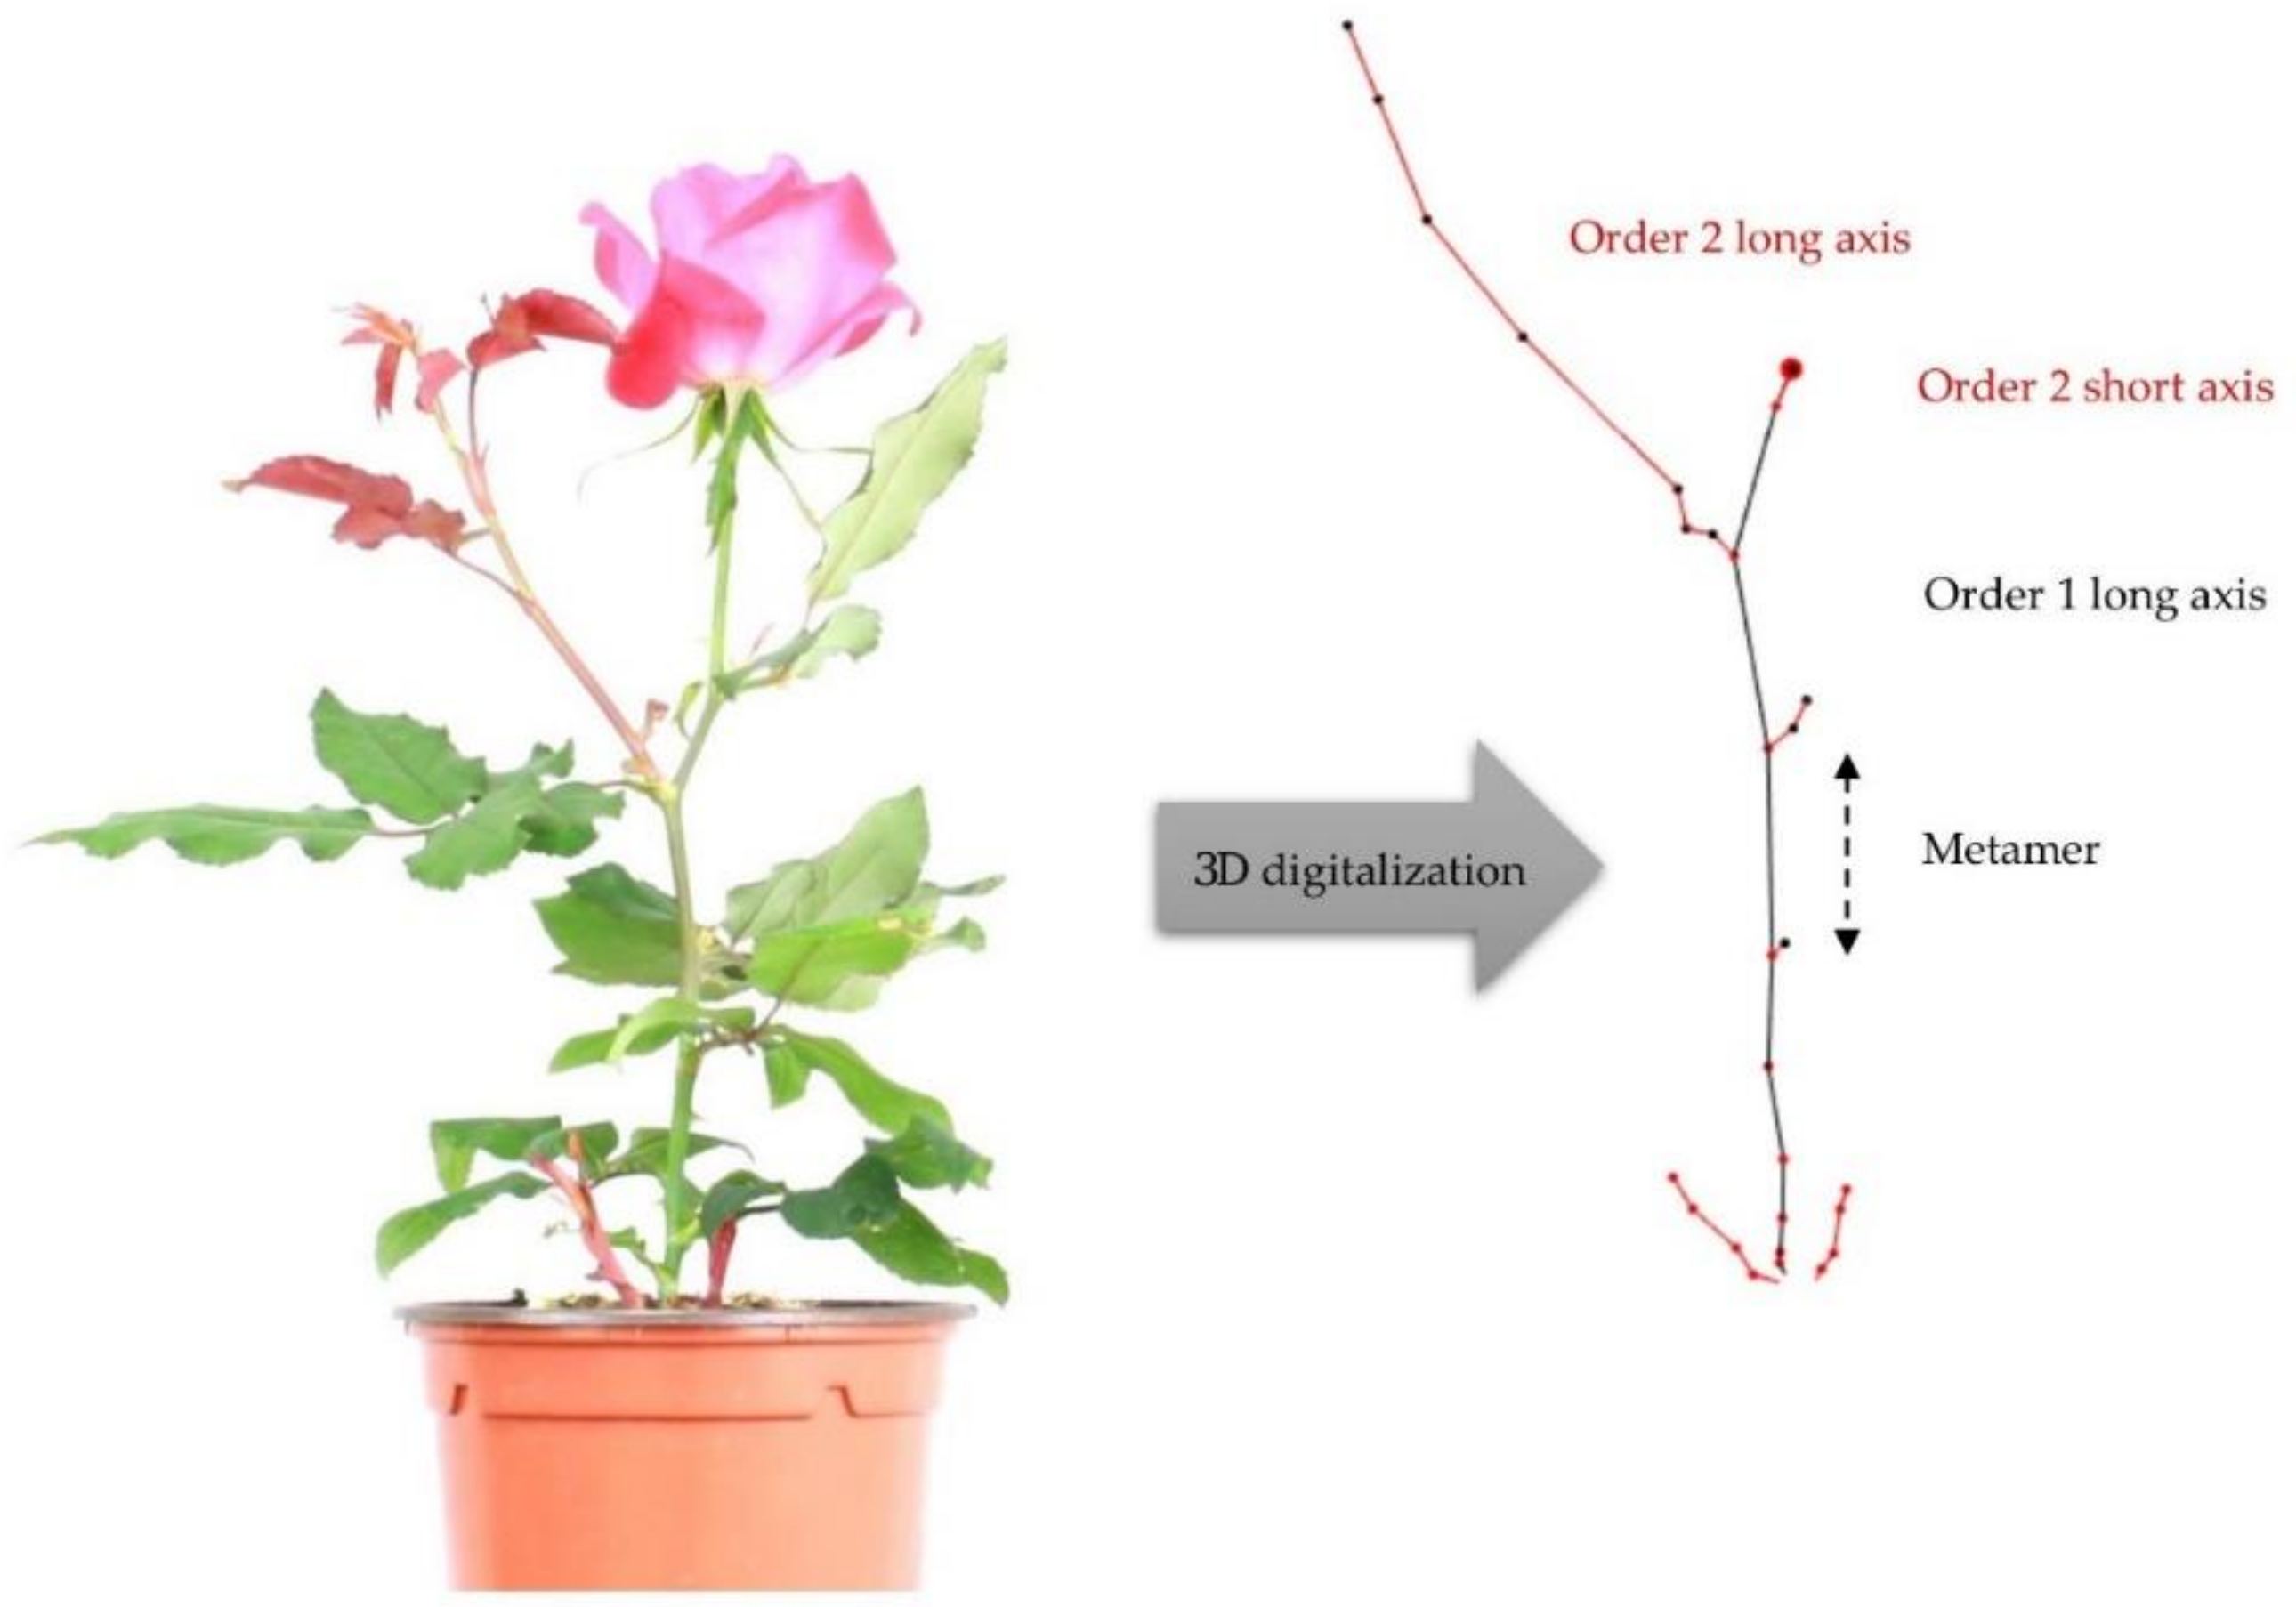
The plant architecture is characterized by two components—the axis and the metamer—and one metamer is composed of one internode, one node, one axillary bud and one leaf (Figure 2) [26]. These components have topological (succession or branching) relationships among them. The architectural analysis was carried out at two observation scales—the plant and the axis.
The following variables were measured at measurement point 1: the length (LA1), number of metamers (NbMetA1) and number of branches (NbA2) of the order 1 axis.
The following variables were measured at measurement point 2 (Table 3):
  • at the plant scale, the number of axes and determined (i.e., flowering) axes, according to the order of branching, distinguishing the short axes from the long ones as defined by [9], with short axes comprising one to four metamers and long axes comprising five or more metamers;
  • at the axis scale, for the two types of axes, their morphology (length and number of metamers), according to the order of branching.
Three categories of variables were thus measured at the plant and axis scale: elongation (length and number of metamers that make up a long and short axis, etc.), branching (number of axes, etc.) and flowering (number of determined axes, etc.).
The architectural measurements were made using a Microscribe 3D digitizer (Solution Technologies, Oella, MD, USA) and the data were saved in an Excel spreadsheet. A database gathering all the measurements made at the two observation scales was built. The architectural variables were extracted from these data using a specially developed R script.

2.5. Data Analysis

The variables, measured at measurement point 2, were grouped into three categories as previously defined, i.e., elongation, branching and flowering for architectural description (Table 3). They were subjected to a principal component analysis (PCA) to represent all the variables in a set of linear combinations uncorrelated with one another and accounting for an increasingly weaker part of the observed variability. The first two principal components were selected for our analysis. For each of them, the variables that best contributed to their formation were classified, and the best qualified of the above-mentioned categories was selected. This approach was also applied to the morphometric variables used to describe plant shape.
A complementary architectural analysis was carried out to specify the position of branching. Three new variables were measured mainly at the order of branching 2, namely the numbers of order 3 short axes carried by order 2 long axes in apical (NbSA3_Top), median (NbSA3_Med) and basal (NbSA3_Bas) position.
An analysis of variance was carried out to evaluate the genotype effect, the light quality effect and their interaction for the variables measured at measurement points 1 and 2 from a mixed linear model, with the repetition of the experiment as a random factor and for a probability p < 0.05:
Pijk = μ + Gi + Lj + (G × L)ij + rk + eijk
where P is the phenotypic value of genotype i, for light spectrum j and repetition k; µ is the mean for all genotypes, light spectra and repetitions; G is the fixed effect of genotype i; L is the fixed effect of light spectrum j; G × L is the fixed effect of their interaction; r is the random effect of the experimental repetition k; e is the residual error.
The model was estimated using the maximum likelihood (ML) method. Then, a post-hoc comparison of means (Tukey test) was performed based on the adjusted means (least-square means) for a probability p < 0.05. The statistical analyses were carried out using the lme4 and multcomp R packages (R Foundation for Statistical Computing, Vienna, Austria).

3. Results

3.1. Genotype, Light Quality Effect, and their Interaction on Plant Architecture: Measurement Point 1

A significant genotype effect was observed for the three variables measured, with a longer and more branched order 1 axis for Baipome and ‘The Fairy’ (Table 4). A significant effect of light quality was also demonstrated, but only for LA1, with two groups of light conditions: W and WR for the shortest axes, and WRFR for the longest axes. A 24.1% increase in elongation was observed under WRFR compared to W (Table 4).
A significant genotype × light quality interaction was observed for LA1 and NbA2, due to very contrasting genotypic responses to light quality (Table 4): under WRFR compared to W, Baipome and ‘The Fairy’ were characterized by: (i) better elongation, with a lengthening of LA1 ranging from +16.1% for Baipome to +32.7% for ‘The Fairy’ and (ii) better branching, with NbA2 ranging from +9.5% for Baipome to +13.9% for ‘The Fairy’. Knock Out® Radrazz did not respond to the light quality.

3.2. Selection of the most Explanatory Morphometric and Architectural Variables of the Variability Observed at Measurement Point 2

Twelve morphometric variables were measured at the plant scale and were submitted to a PCA. Principal components 1 and 2 accounted for 55.2% and 24.2% of variability, respectively, and 79.4% of total variability. Among the variables, the easiest ones to interpret and those that most contributed to the formation of these components were selected. They were the surface of the convex envelope (Area; 13.0%) for the first component, and circularity (Circ; 18.2%) for the second component (Table 2).
Eighteen plant architecture variables were measured at the plant and axis scale and were submitted to a PCA. Principal components 1 and 2 accounted for 49.0% and 18.2% of variability, respectively, and 67.2% of total variability.
The variables that most contributed to component formation were the following ones, classified by category (Table 3):
For component 1,
  • branching variables, the most contributory ones being NbA (11.0%), NbSA (10.9%), and NbSA3 (9.8%);
  • flowering variables, the most contributory ones being NbDetA (10.8%), NbDetSA (10.6%), and NbDetSA3 (9.5%).
For component 2,
  • elongation variables, the most contributory ones being LSA (14.5%), LSA2 (16.5%), and LSA3 (13.4%).
The PCA made it possible to select the most explanatory variables of observed variability while representing the three categories of variables, i.e., LSA, LSA2, and LSA3 for elongation variables, NbA, NbSA, and NbSA3 for branching variables, and NbDetA, NbDetSA, and NbDetSA3 for flowering variables.

3.3. Genotype, Light Quality Effect and Their Interaction on the Plant Shape and Architecture: Measurement Point 2

A significant genotype effect was observed for the two selected morphometric variables, with a more ovoid and horizontal shape for Baipome and ‘The Fairy’ (Table 5; Figure 3). A significant effect of light quality was also demonstrated, but only for Area, with two groups of light conditions: W and WR for the least voluminous plants, and WRFR for the most voluminous plants. A 36.8% increase was observed under WRFR compared to W (Table 5; Figure 3).
A significant genotype effect was observed for the nine selected architectural variables, with more branched and flowered plants for Baipome and ‘The Fairy’ (Table 6). The same was true for the light quality, as follows (Table 6):
For the elongation variables:
  • A significant light quality effect was observed for the length of the short axes (LSA), with two groups of light conditions: W and WR for the shortest axes, and WRFR for the longest axes. A 29.3% elongation was observed under WRFR compared to W. This increase was also observed for the order 2 (LSA2; +42.6%) and order 3 short axes (LSA3; +19.7%).
For the branching variables:
  • A significant light quality effect was observed for the number of axes (NbA), with two groups of light conditions: W and WR for the least branched plants, and WRFR for the most branched plants. A 33.7% increase of NbA was observed under WRFR compared to W. This increase was also observed for the short axes (NbSA; +38.7%), especially those positioned in order 3 (NbSA3; +61.4%).
For the flowering variables:
  • A significant light quality effect was observed for the number of determined axes (NbDetA), with three groups of light conditions: WR for the least flowered plants, WRFR for the most flowered plants, and W for the intermediate plants. A 40.2% increase was observed under WRFR compared to W. A significant light quality effect was also observed for the number of determined short axes (NbDetSA), including those positioned in order 3 (NbDetSA3), with two groups of light conditions: W and WR for the least flowered plants, and WRFR for the most flowered plants. Increases of 44.3% for NbDetSA and 61.1% for NbDetSA3 were observed under WRFR compared to W.
A significant genotype × light quality interaction was observed for the nine selected architectural variables except LSA and LSA2, due to very contrasting genotypic responses to light quality. Under WRFR compared to W, Baipome, and ‘The Fairy’ were characterized by: (i) better elongation, with a lengthening of LSA3 ranging from +27.4% for Baipome to +38.5% for ’The Fairy’, (ii) better branching, with NbSA3 ranging from +46.3% for ’The Fairy’ to +97.8% for Baipome, and (iii) better flowering, with NbDetSA3 ranging from +50.0% for ‘The Fairy’ to +89.4% for Baipome. Knock Out® Radrazz, did not respond to the light quality (Table 6).

3.4. Positioning of the Branches (Order 3 Short Axes) on the Order 2 Long Axes

A significant genotype effect was observed for the three measured architectural variables, with a higher apical branching for Baipome and ‘The Fairy’ (Table 7). A significant light quality effect was also demonstrated for NbSA3_Top and NbSA3_Med, with two groups of light conditions: W and WR for the least branched plants, and WRFR for the most branched plants in apical and median position. Increases of 57.9% for NbSA3_Top and 68.6% for NbSA3_Med were observed under WRFR compared to W (Table 7).
A significant genotype × light quality interaction was observed for NbSA3_Top and NbSA3_Med, due to highly contrasting genotypic responses to light quality. Under WRFR compared to W, Baipome and ‘The Fairy’ were characterized by: (i) better apical branching (NbSA3_Top), with increases ranging from 45.1% for ‘The Fairy’ to 89.1% for Baipome, and (ii) better median branching (NbSA3_Med), with increases ranging from 50.9% for ‘The Fairy’ to 109.3% for Baipome. Knock Out® Radrazz did not respond to the light quality (Table 7).

4. Discussion

Morphometric analysis using ImageJ free software is simple to implement from plant photographs. The twelve morphometric variables proposed by ImageJ were reduced to two (surface of the convex envelope (Area) and circularity (Circ)) to describe the observed shape variability using PCA. The study of these variables highlighted an effect of genotype and light quality on plant shape, with a higher surface of the convex envelope under the WRFR condition.
This first approach led us to characterize the effect of light quality and its interaction with the genotype on plant architecture, which determines plant shape. To describe the observed variability, nine architectural variables were selected by PCA. Among these variables, the number of determined axes (NbDetA), the number of order 3 short axes (NbSA3) and the length of the short axes (LSA) had been identified in previous works describing the architecture of: (i) eight rose cultivars with contrasting shapes and (ii) two segregated progenies used for the genetic analysis of rose architecture [4,13]. These converging results confirm the robustness of these variables to discriminate rose plants of different architectures. In this work, the architectures of the three varieties with contrasting shapes were perfectly differentiated, with a significant genotype effect for the nine selected variables.
A significant effect of light quality was observed for most of the measured elongation, branching, and flowering variables, regardless of the plant developmental stage, with two groups of light conditions: W and WR on the one hand, and WRFR on the other hand, differentiated spectrally by their B/R and R/FR ratios, while the G/B ratio remained the same.
Rose was insensitive to variations in the B/R ratio, more specifically to the reduction of B and G light intensity in favor of R light. No significant difference between the W and WR light conditions was observed for plant architecture. The same was true for basil [27]. For light conditions close to ours (B24G32R44 and B16G10R74), no significant differences were observed for leaf area and plant width, or for photosynthetic activity. However, in this study, differences in photosynthetic activity were observed under B–R light compared to B–G–R light for different leaf stages. For these photosynthetic wavelengths, B and R lights are mainly absorbed by the upper leaf stages, while G light penetrates deeper into the canopy and is absorbed by the lower leaf stages [28,29]. The decrease in photosynthetic activity of the lower stages under WR compared to W may have been offset by an increase in the activity of the upper stages.
In basil, however, plants were taller under the condition richer in G light and characterized by a high G/B ratio (1.3) [27]. In these conditions, G light might induce stem elongation and antagonize the B light effects [28,30]. This antagonistic effect of G light on B light might explain the absence of architectural modifications between the W and WR light conditions recorded in our study, characterized by a high G/B ratio (1.5).
Under the light condition enriched in FR-WRFR-the plants exhibited: (i) longer short axes (+29.3% compared to W) whatever the order of branching and (ii) a higher number of short axes and flowered short axes, more particularly at the order 3 (+61.4% for NbSA3 and +61.1% for NbDetSA3 compared to W).
The lengthening of the axes and the acceleration of flowering have been observed in many species with low light intensity and a low R/FR ratio—the shade avoidance syndrome [31]. In Arabidopsis thaliana and sunflower, stem elongation has been found correlated with increased levels of the growth hormones auxins and gibberellins in the internodes [32,33]. In tobacco, elongation has also been found accompanied by increased sugar concentrations in the stems providing the energy and carbon required for growth [34]. The sink strength of the stem might be favored by gibberellins [35,36,37].
In Arabidopsis thaliana, flowering was accelerated under low light intensity and a low R/FR ratio [38], probably involving phytochromes B, D and E [39,40], as well as PHYTOCHROME AND FLOWERING TIME 1 (PFT1) [41]. Flowering was also accelerated under high light intensity and a high R/FR ratio [38], possibly associated with increased sucrose concentrations in the leaves and the stem apex, and involving photosynthesis. In our study, the acceleration of flowering, observed under the light condition enriched in FR-WRFR-might also be associated with photosynthesis. The presence of FR light might indeed increase the photosynthetic activity: (i) of the lower leaf layers by penetrating deeper into the canopy and distributing light more evenly within the canopy thanks to internode elongation [42,43] and (ii) by improving photosystem II efficiency [44,45,46]. Other morphological changes induced by FR light, not measured in this study but observed in other species (petiole elongation, increased leaf area, and increased leaf length/width ratio), might also promote light interception and increase overall photosynthesis [43,47,48].
By contrast with the shade avoidance syndrome, a higher number of branches was observed under the FR-enriched (WRFR) condition, particularly in the apical position. The same was true for chrysanthemum, in which bud break and sugar concentrations increased in the basal stem under a low R/FR ratio [49]. Sugars might control bud break in many species [50,51]. They play a trophic role. In rose, a high metabolic activity of sucrose is indeed associated with bud break and might increase the sink strength of the bud [52,53,54]. Sugars might also play a signaling role and cause many hormonal changes, e.g., (i) auxin export from the bud to the stem, (ii) inhibition of the strigolactone signaling pathway, and thereby of the effects of auxin, and (iii) stimulation of cytokinin biosynthesis [55,56]. Bud break might therefore depend on sugar availability for the bud, but also on bud competition with the different sink organs [55,57]. Sugar distribution between the different organs might be influenced by light quality in rose. Increased sink strength of the stem apex was indeed observed when FR light was added to R light [23]. Thus, the higher overall photosynthesis and the sink strength of the stem apex under the WRFR condition might have increased sugar availability for apical buds and favored apical bud break.
A strong genotype × light quality interaction was also observed for the elongation, branching and flowering variables in our study, regardless of the plant developmental stage. As expected, two types of genotype-specific responses occurred. Baipome and ‘The Fairy’, chosen for their architectural plasticity, responded to light quality [2,3], while Knock Out® Radrazz remained insensitive, as previously demonstrated by [12], even though it can respond to light intensity [7]. A strong genotype × environment interaction was also observed in previous works for the elongation and branching variables [2,3]. Year (i.e., amounts of cumulated radiation)—specific QTLs involved in the control of branching, more particularly order 3 short axes (NbSA3), were highlighted in rose by [4]. They are believed to be at the origin of the genotype × environment interaction observed in this study. They co-locate with an environmentally sensitive branching repressor, BRANCHED1.
More in-depth eco-physiological and biochemical investigations are needed to better understand the response of rose to light quality, in particular the lack of response of Knock Out® Radrazz, and thus identify the determinants of the genotype × light quality interaction.
Production of compact, branched plants is requested for ornamental plants. This study shows that acting on light quality makes it possible to modify the entire plant architecture and thereby its shape. Of the three light conditions tested, the addition of FR light, usually used to increase photosynthetic activity and therefore biomass, produced the most branched plants, with relative stem elongation. A light spectrum reinforced in B would limit this effect, as demonstrated in petunia by [58].
This work was carried out in a climatic chamber, where the light effect was strengthened compared to greenhouse conditions which involve solar radiation. This is exactly the objective targeted by this new culture system, i.e., to reach a total control of the culture cycle, independently from the cycle of seasons, with a very high regularity of the climatic conditions, especially for light and temperature.
These interesting results obtained in rose suggest that this culture system in a totally artificialized environment, where the light quality can be modified, could be applied to other horticultural species. The objective would be to “deseasonalize” production cycles and shorten them, while improving plant architecture, more particularly branching, and thereby commercial quality.

5. Conclusions

A significant effect of light quality on rose architecture was demonstrated in this study, with two groups of light conditions: W and WR on the one hand, and WRFR on the other hand, differentiated spectrally by their B/R and R/FR ratios. Compared to W and WR conditions, the plants grown under the light condition enriched in FR-WRFR-exhibited longer axes, with earlier flowering related to the shade avoidance syndrome. However, these plants were also more branched. Furthermore, a strong genotype × light quality interaction was demonstrated. More in-depth eco-physiological and biochemical analyses are needed to better understand this interaction and identify its biological determinants.
This work suggests that rose architecture could be controlled by light quality. The WRFR light condition produced branched plants, with a relative stem lengthening, which meets the qualitative expectations of the ornamental pot plant market. However, the interaction of the genotype makes it difficult to generalize the use of WRFR light. A better understanding of the genotype × light quality interaction is therefore essential for optimal application.

Author Contributions

Conceptualization, L.C. and P.M.; methodology, C.L.B. and M.G.U.U.; validation, L.C.; formal analysis, L.C., C.L.B. and T.A.; investigation, L.C., C.L.B., T.A. and S.S.; resources, C.L.B.; writing-original draft preparation, L.C. and P.M.; writing-review and editing, L.C. and S.S.; supervision, L.C. All authors have read and agree to the published version of the manuscript.

Funding

This research was financed by the French Ministry of Agriculture and Fisheries (Compte d’Affectation Spéciale pour le Développement Agricole et Rural; CASDAR) within the framework of the IRRADIANCE project.

Acknowledgments

The authors would like to thank Rémi Gardet and his team (PHENOTIC platform, UMR IRHS) for their technical assistance in plant management and Annie Buchwalter for proofreading the English language in this manuscript.

Conflicts of Interest

The authors declare no conflict of interest.

References

  1. Boumaza, R.; Demotes-Mainard, S.; Huché-Thélier, L.; Guérin, V. Visual characterization of the esthetic quality of the rosebush. J. Sens. Stud. 2009, 24, 774–796. [Google Scholar] [CrossRef]
  2. Crespel, L.; Le Bras, C.; Relion, D.; Morel, P. Genotype × year interaction and broad-sense heritability of architectural characteristics in rose bush. Plant Breed. 2014, 133, 412–418. [Google Scholar] [CrossRef]
  3. Li-Marchetti, C.; Le Bras, C.; Relion, D.; Citerne, S.; Huché-Thélier, L.; Sakr, S.; Morel, P.; Crespel, L. Genotypic differences in architectural and physiological responses to water restriction in rose bush. Front. Plant Sci. 2015, 6, 355. [Google Scholar] [CrossRef] [Green Version]
  4. Li-Marchetti, C.; Le Bras, C.; Chastellier, A.; Relion, D.; Morel, P.; Sakr, S.; Hibrand-Saint Oyant, L.; Crespel, L. 3D Phenotyping and QTL analysis of a complex character: Rose bush architecture. Tree Genet. Genomes 2017, 13, 112. [Google Scholar] [CrossRef]
  5. Rajapakse, N.C.; Kelly, J.W. Influence of spectral filters on growth and postharvest quality of potted miniature roses. Sci. Hortic. 1993, 56, 245–255. [Google Scholar] [CrossRef]
  6. Morel, P. Growth control of Hydrangea macrophylla through water restriction. Acta Hortic. 2001, 548, 51–58. [Google Scholar] [CrossRef]
  7. Demotes-Mainard, S.; Huché-Thélier, L.; Morel, P.; Boumaza, R.; Guerin, V.; Sakr, S. Temporary water restriction or light intensity limitation promotes branching in rose bush. Sci. Hortic. 2013, 150, 432–440. [Google Scholar] [CrossRef]
  8. Morel, P.; Crespel, L.; Galopin, G. Effect of mechanical stimulation on the growth and branching of garden rose. Sci. Hortic. 2012, 135, 59–64. [Google Scholar]
  9. Morel, P.; Galopin, G.; Donès, N. Using architectural analysis to compare the shape of two hybrid tea rose genotypes. Sci. Hortic. 2009, 120, 391–398. [Google Scholar] [CrossRef]
  10. Crespel, L.; Morel, P.; Galopin, G. Architectural and genetic characterization in Hydrangea aspera subsp. aspera Kawakami group, H. aspera subsp. sargentiana and their hybrids. Euphytica 2012, 184, 289–299. [Google Scholar]
  11. Cerny, T.A.; Faust, J.E.; Layne, D.R.; Rajapakse, N.C. Influence of photoselective film and growing season on stem growth and flowering of six plant species. J. Am. Soc. Hortic. Sci. 2003, 128, 486–491. [Google Scholar] [CrossRef] [Green Version]
  12. Abidi, F.; Girault, T.; Douillet, O.; Guillemain, G.; Sintes, G.; Laffaire, M.; Ben Ahmed, H.; Smiti, S.; Huché-Thélier, L.; Leduc, N. Blue light effects on rose photosynthesis and photomorphogenesis. Plant Biol. 2013, 15, 67–74. [Google Scholar] [CrossRef] [PubMed]
  13. Crespel, L.; Sigogne, M.; Donès, N.; Relion, D.; Morel, P. Identification of relevant morphological, topological and geometrical variables to characterize the architecture of rose bushes in relation to plant shape. Euphytica 2013, 191, 129–140. [Google Scholar] [CrossRef] [Green Version]
  14. Gudin, S. Rose: Genetics and breeding. Plant Breed. Rev. 2000, 17, 159–189. [Google Scholar]
  15. Demotes-Mainard, S.; Péron, T.; Corot, A.; Bertheloot, J.; Le Gourrierec, J.; Travier, S.; Crespel, L.; Morel, P.; Huché- Thélier, L.; Boumaza, R.; et al. Plant responses to red and far-red lights, applications in horticulture. Env. Exp. Bot. 2016, 121, 4–21. [Google Scholar] [CrossRef]
  16. Huché-Thélier, L.; Crespel, L.; Le Gourrierec, J.; Morel, P.; Sakr, S.; Leduc, N. Light signaling and plant responses to blue and UV radiations-Perspectives for applications in horticulture. Environ. Exp. Bot. 2016, 121, 22–38. [Google Scholar] [CrossRef]
  17. Kattak, A.M.; Pearson, S. Spectral filters and temperature effects on the growth and development of chrysanthemums under low light integral. Plant Growth Reg. 2006, 49, 61–68. [Google Scholar] [CrossRef]
  18. Lund, J.B.; Blom, T.J.; Aaslyng, J.M. End-of-day lighting with different red/far-red ratios using light emitting diodes affects plant growth of Chrysanthemum × morifolium Ramat ‘Coral Charm’. Hortscience 2007, 42, 1609–1611. [Google Scholar] [CrossRef] [Green Version]
  19. Hisamatsu, T.; Sumimoto, K.; Shimizu, H. End-of-day far-red treatment enhances responsiveness to giberellins and promotes stem extension in chrysanthemum. J. Hortic. Sci. Biotechnol. 2008, 83, 695–700. [Google Scholar] [CrossRef]
  20. Park, Y.; Runkle, E.S. Far-red radiation promotes growth of seedlings by increasing leaf expansion and whole-plant net assimilation. Environ. Exp. Bot. 2017, 136, 41–49. [Google Scholar] [CrossRef] [Green Version]
  21. Snowden, M.C.; Cope, K.R.; Bugbee, B. Sensitivity of seven diverse species to blue and green light: Interactions with photon flux. PLoS ONE 2016, 11. [Google Scholar] [CrossRef]
  22. Wollaeger, H.M.; Runkle, E.S. Growth and acclimation of impatiens, salvia, petunia, and tomato seedlings to blue and red light. Hortscience 2015, 50, 522–529. [Google Scholar] [CrossRef] [Green Version]
  23. Mor, Y.; Halevy, A.H.; Porath, D. Characterization of the light reaction in promoting the mobilizing ability of rose shoot tips. Plant Physiol. 1980, 66, 996–1000. [Google Scholar] [CrossRef] [PubMed] [Green Version]
  24. Terfa, M.T.; Poudel, M.S.; Roro, A.G.; Gislerød, H.R.; Olsen, J.E.; Torre, S. Light emitting diodes with a high proportion of blue light affects external and internal quality parameters of pot roses differently than the traditional high pressure sodium lamp. Acta Hortic. 2012, 956, 635–642. [Google Scholar] [CrossRef]
  25. Terfa, M.T.; Solhaug, K.A.; Gislerød, H.R.; Olsen, J.E.; Torre, S. A high proportion of blue light increases the photosynthesis capacity and leaf formation rate of Rosa × hybrida but does not affect time to flower opening. Physiol. Plant. 2013, 148, 146–159. [Google Scholar] [CrossRef] [PubMed]
  26. White, J. The plant as a metapopulation. Annu. Rev. Ecol. Evol. Syst. 1979, 10, 109–145. [Google Scholar] [CrossRef]
  27. Dou, H.; Niu, G.; Gu, M. Photosynthesis, morphology, yield, and phytochemical accumulation in basil plants influenced by substituting green light for partial red and/or blue light. HortScience 2019, 54, 1769–1776. [Google Scholar] [CrossRef] [Green Version]
  28. Kim, H.H.; Goins, G.D.; Wheeler, R.M.; Sager, J.C. Green-light supplementation for enhanced lettuce growth under red- and blue-light-emitting diodes. HortScience 2004, 39, 1617–1622. [Google Scholar] [CrossRef] [Green Version]
  29. Terashima, I.; Fujita, T.; Inoue, T.; Chow, W.S.; Oguchi, R. Green light drives leaf photosynthesis more efficiently than red light in strong white light: Revisiting the enigmatic question of why leaves are green. Plant Cell Physiol. 2009, 50, 684–697. [Google Scholar] [CrossRef] [Green Version]
  30. Meng, Q.; Kelly, N.; Runkle, E.S. Substituting green or far-red radiation for blue radiation induces shade avoidance and promotes growth in lettuce and kale. Environ. Exp. Bot. 2019, 162, 383–391. [Google Scholar] [CrossRef]
  31. Casal, J.J. Shade avoidance. Arabidopsis Book 2012. [Google Scholar] [CrossRef] [PubMed] [Green Version]
  32. Kurepin, L.V.; Emery, R.J.N.; Pharis, R.P.; Reid, D.M. Uncoupling light quality from light irradiance effects in Helianthus annuus shoots: Putative roles for plant hormones in leaf and internode growth. J. Exp. Bot. 2007, 58, 2145–2157. [Google Scholar] [CrossRef] [PubMed] [Green Version]
  33. Kurepin, L.V.; Walton, L.J.; Hayward, A.; Emery, R.J.N.; Pharis, R.P.; Reid, D.M. Interactions between plant hormones and light quality signaling in regulating the shoot growth of Arabidopsis thaliana seedlings. Botany 2012, 90, 237–246. [Google Scholar] [CrossRef]
  34. Kasperbauer, M.J.; Tso, T.C.; Sorokin, T.P. Effects of end-of-day red and far-red radiation on free sugars, organic acids and amino acids of tobacco. Phytochemistry 1970, 9, 2091–2095. [Google Scholar] [CrossRef]
  35. Kaufman, P.B.; Ghosheh, N.; Ikuma, H. Promotion of growth and invertase activity by gibberellic acid in developing Avena internodes. Plant Physiol. 1968, 43, 29–34. [Google Scholar] [CrossRef] [Green Version]
  36. Morris, D.A.; Arthur, E.D. Effects of gibberellic acid on patterns of carbohydrate distribution and acid invertase activity in Phaseolus vulgaris. Physiol. Plant. 1985, 65, 257–262. [Google Scholar] [CrossRef]
  37. Wu, L.; Mitchell, J.P.; Cohn, N.S.; Kaufman, P.B. Gibberellin (GA3) enhances cell wall invertase activity and mRNA levels in elongating dwarf pea (Pisum sativum) shoots. Int. J. Plant Sci. 1993, 154, 280–289. [Google Scholar] [CrossRef]
  38. King, R.W.; Hisamatsu, T.; Goldschmidt, E.E.; Blundell, C. The nature of floral signals in Arabidopsis. I. Photosynthesis and a far-red photoresponse independently regulate flowering by increasing expression of FLOWERING LOCUS T (FT). J. Exp. Bot. 2008, 59, 3811–3820. [Google Scholar] [CrossRef] [Green Version]
  39. Halliday, K.J.; Koornneef, M.; Whitelam, G.C. Phytochrome B and at least one other phytochrome mediate the accelerated flowering response of Arabidopsis thaliana L. to low red/far-red ratio. Plant Physiol. 1994, 104, 1311–1315. [Google Scholar] [CrossRef] [Green Version]
  40. Franklin, K.A.; Praekelt, U.; Stoddart, W.M.; Billingham, O.E.; Halliday, K.J.; Whitelam, G.C. Phytochromes B, D, and E act redundantly to control multiple physiological responses in Arabidopsis. Plant Physiol. 2003, 131, 1340–1346. [Google Scholar] [CrossRef] [Green Version]
  41. Cerdán, P.D.; Chory, J. Regulation of flowering time by light quality. Nature 2003, 423, 881–885. [Google Scholar] [CrossRef] [PubMed]
  42. Smith, H.L.; McAusland, L.; Murchie, E.H. Don’t ignore the green light: Exploring diverse roles in plant processes. J. Exp. Bot. 2017, 68, 2099–2110. [Google Scholar] [CrossRef] [PubMed]
  43. Zhang, Y.; Zhang, Y.; Yang, Q.; Li, T. Overhead supplemental far-red light stimulates tomato growth under intra-canopy lighting with LEDs. J. Int. Agric. 2019, 18, 62–69. [Google Scholar] [CrossRef] [Green Version]
  44. Zhen, S.; van Iersel, M.W. Far-red light is needed for efficient photochemistry and photosynthesis. J. Plant Physiol. 2017, 209, 115–122. [Google Scholar] [CrossRef] [Green Version]
  45. Yang, F.; Fan, Y.; Wu, X.; Cheng, Y.; Liu, Q.; Feng, L.; Chen, J.; Wang, Z.; Wang, X.; Yong, T.; et al. Auxin-to-gibberellin ratio as a signal for light intensity and quality in regulating soybean growth and matter partitioning. Front. Plant Sci. 2018, 9, 56. [Google Scholar] [CrossRef] [Green Version]
  46. Yang, F.; Liu, Q.; Cheng, Y.; Feng, L.; Wu, X.; Fan, Y.; Raza, M.A.; Wang, X.; Yong, T.; Liu, W.; et al. Low red/far-red ratio as a signal promotes carbon assimilation of soybean seedlings by increasing the photosynthetic capacity. BMC Plant Biol. 2020, 20, 148. [Google Scholar] [CrossRef] [Green Version]
  47. Heraut-Bron, V.; Robin, C.; Varlet-Grancher, C.; Guckert, A. Phytochrome mediated effects on leaves of white clover: consequences for light interception by the plant under competition for light. Ann. Bot. 2001, 88, 737–743. [Google Scholar] [CrossRef]
  48. Kalaitzoglou, P.; van Ieperen, W.; Harbinson, J.; van der Meer, M.; Martinakos, S.; Weerheim, K.; Nicole, C.C.S.; Marcelis, L.F.M. Effects of continuous or end-of-day far-red light on tomato plant growth, morphology, light absorption, and fruit production. Front. Plant Sci. 2019, 10, 322. [Google Scholar] [CrossRef] [Green Version]
  49. Yuan, C.Q.; Ahmad, S.; Cheng, T.R.; Wang, J.; Pan, H.T.; Zhao, L.J.; Zhang, Q. Red to far-red light ratio modulates hormonal and genetic control of axillary bud outgrowth in chrysanthemum (Dendranthema grandiflorum ‘Jinba’). Int. J. Mol. Sci. 2018, 19, 1590. [Google Scholar] [CrossRef] [Green Version]
  50. Leduc, N.; Roman, H.; Barbier, F.; Péron, T.; Huché-Thélier, L.; Lothier, J.; Demotes-Mainard, S.; Sakr, S. Light signaling in bud outgrowth and branching in plants. Plants 2014, 3, 223–250. [Google Scholar] [CrossRef] [Green Version]
  51. Rameau, C.; Bertheloot, J.; Leduc, N.; Andrieu, B.; Foucher, F.; Sakr, S. Multiple pathways regulate shoot branching. Front. Plant Sci. 2015, 5, 741. [Google Scholar] [CrossRef] [PubMed] [Green Version]
  52. Girault, T.; Abidi, F.; Sigogne, M.; Pelleschi-Travier, S.; Boumaza, R.; Sakr, S.; Leduc, N. Sugars are under light control during bud burst in Rosa sp. Plant Cell Environ. 2010, 33, 1339–1350. [Google Scholar] [CrossRef] [PubMed]
  53. Henry, C.; Rabot, A.; Laloi, M.; Mortreau, E.; Sigogne, M.; Leduc, N.; Lemoine, R.; Sakr, S.; Vian, A.; Pelleschi-Travier, S. Regulation of RhSUC2, a sucrose transporter, is correlated with the light control of bud burst in Rosa sp. Plant Cell Environ. 2011, 34, 1776–1789. [Google Scholar] [CrossRef] [PubMed]
  54. Rabot, A.; Henry, C.; Ben Baaziz, K.; Mortreau, E.; Azri, W.; Lothier, J.; Hamama, L.; Boumaza, R.; Leduc, N.; Pelleschi-Travier, S.; et al. Insight into the role of sugars in bud burst under light in the rose. Plant Cell Physiol. 2012, 53, 1068–1082. [Google Scholar] [CrossRef] [Green Version]
  55. Barbier, F.; Péron, T.; Lecerf, M.; Perez-Garcia, M.D.; Barrière, Q.; Rolík, J.; Boutet-Mercy, S.; Citerne, S.; Lemoine, R.; Porcheron, B.; et al. Sucrose modulates the key hormonal mechanisms controlling bud outgrowth in Rosa hybrida. J. Exp. Bot. 2015, 66, 2569–2582. [Google Scholar] [CrossRef] [Green Version]
  56. Bertheloot, J.; Barbier, F.; Boudon, F.; Perez-Garcia, M.D.; Péron, T.; Citerne, S.; Dun, E.; Beveridge, C.; Godin, C.; Sakr, S. Sugar availability suppresses the auxin-induced strigolactone pathway to promote bud outgrowth. New Phytol. 2019, 225, 866–879. [Google Scholar] [CrossRef] [Green Version]
  57. Schneider, A.; Godin, C.; Boudon, F.; Demotes-Mainard, S.; Sakr, S.; Bertheloot, J. Light regulation of axillary bud outgrowth along plant axes: An overview of the roles of sugars and hormones. Front. Plant Sci. 2019, 10, 1296. [Google Scholar] [CrossRef] [Green Version]
  58. Park, Y.; Runkle, E.S. Blue radiation attenuates the effects of the red to far-red ratio on extension growth but not on flowering. Environ. Exp. Bot. 2019, 168, 103871. [Google Scholar] [CrossRef]
Figure 1. Spectral distribution of three light conditions from white (W), red (R), and far-red (FR) light-emitting diodes (LEDs).
Agronomy 10 00913 g001
Figure 2. Representation of the plant architecture obtained by 3D digitalization with two types of axes (short and long), one metamer, and two branching orders: order 1 and order 2.
Agronomy 10 00913 g002
Figure 3. Overall shape of Baipome, ‘The Fairy’ and Knock Out® Radrazz grown in a climatic chamber under three light conditions—W, WR, and WRFR—up to the ‘opened flower of the order 1 axis’ stage, corresponding to the end of cultivation (measurement point 2).
Agronomy 10 00913 g003
Table 1. Spectral characteristics of the three light conditions tested.
Light ConditionPPFD (µmol m−2 s−1)RQE (µmol m−2 s−1)G/BB/RR/FRr/fr
W227.0 a1193.9 a1.5 a1.0 c9.6 b6.7 a
WR220.4 a195.0 a1.5 a0.3 b23.2 c48.4 c
WRFR226.5 a206.5 a1.5 a0.1 a7.5 a9.3 b
PPFD, photosynthetic photon flux density; RQE, relative quantum efficiency; G/B, green light (500–600 nm) over blue light (400–500 nm) ratio; B/R, blue light (400–500 nm) over red light (600–700 nm) ratio; R/FR, first red light (600–700 nm) over far-red light (700–800 nm) ratio; r/fr, second red light (660–670 nm) over far-red light (730–740 nm) ratio. Means followed by the same lowercase letter in the same column are not significantly different (Fisher LSD test, p < 0.05).
Table 2. List of the morphometric variables measured and the contribution of these variables to the formation of principal components (PC) 1 and 2 of the principal component analysis.
VariablesCodeContribution of Variables (%)
PC1PC2
Area of the convex hull (cm2)Area13.03.6
Percentage of the area occupied by the plant in the convex hull (%)Area_Frac3.39.9
Perimeter of the convex hull (cm)Perim14.90.1
Height of the smallest rectangle enclosing the convex hull (cm)Height_Rec9.06.4
Width of the smallest rectangle enclosing the convex hull (cm)Width_Rec14.30.3
Length of the primary axis of the best fitting ellipse (cm)Prim_El14.10.9
Length of the secondary axis of the best fitting ellipse (cm)Sec_El7.313.6
Angle between the primary axis and a parallel line to the x-axis of the image (°)Angle_El2.210.6
Ratio of primary axis and secondary axis of the ellipseAR1.523.7
Circularity 1Circ4.318.2
The longest distance between any two points along the convex hull’s perimeter: Feret’s diameter (cm)Feret_diam14.60.3
Angle between Feret’s diameter and a line parallel to the x-axis of the image (°)Angle_Feret1.512.3
1 4π*area/perim2. A value of 1.0 indicates a perfect circle. As the value approaches 0.0, it indicates an increasingly elongated shape.
Table 3. List of the architectural variables measured at measurement point 2 according to the three defined categories (elongation, branching, and flowering), and contribution of these variables to the formation of principal components (PC) 1 and 2 of the principal component analysis.
VariablesCodeContribution of Variables (%)
PC1PC2
Elongation
Length of the order 2 long axesLLA24.27.3
Number of metamers of the order 2 long axesNbMetLA26.41.3
Length of the short axesLSA0.114.5
Number of metamers of the short axesNbMetSA0.14.6
Length of the order 2 short axesLSA20.016.5
Number of metamers of the order 2 short axesNbMetSA20.38.8
Length of the order 3 short axesLSA31.013.4
Number of metamers of the order 3 short axesNbMetSA32.04.1
Branching
Number of axesNbA11.00.3
Number of order 2 long axesNbLA26.36.6
Number of short axesNbSA10.90.1
Number of order 2 short axesNbSA23.011.4
Number of order 3 short axesNbSA39.80.9
Flowering
Number of determined axesNbDetA10.80.0
Number of order 2 determined long axesNbDetLA28.90.3
Number of determined short axesNbDetSA10.60.0
Number of order 2 determined short axesNbDetSA24.98.6
Number of order 3 determined short axesNbDetSA39.51.1
Table 4. Least-square means (LS means) of elongation and branching variables measured on the order 1 axis at measurement point 1 for Baipome (Bai), Knock Out® Radrazz (KO) and ‘The Fairy’ (TF) grown in a climatic chamber under three light conditions: W, WR, and WRFR.
GenLA1 (cm)MeanNbMetA1MeanNbA2Mean
WWRWRFRWWRWRFRWWRWRFR
Bai22.4a 121.7 a26.0 b23.4B 222.4 a20.8 a22.7 a22.0 B16.8 ab15.5 a18.4 b15.7 B
KO13.2 a12.8 a15.9 a13.9 A11.5 a12.3 a11.7 a11.8 A1.1 a1.1 a1.8 a1.4 A
TF26.6 a27.5 a35.3 b29.8 C24.7 a24.7 a25.6 a25.0 C13.7 a17.7 b15.6 ab16.9 B
Mean20.7 a20.6 a25.7 b 19.5 a19.3 a20.0 a 10.5 a11.4 a11.9 a
LA1, length of the order 1 axis; NbMetA1, number of metamers of the order 1 axis; NbA2, number of order 2 axes. 1 Means followed by the same lowercase letter in the same line are not significantly different (Tukey test, p < 0.05). 2 Means followed by the same uppercase letter in the same column are not significantly different (Tukey test, p < 0.05).
Table 5. Least-square means (LS means) of morphometric variables measured at measurement point 2 and selected for Baipome (Bai), Knock Out® Radrazz (KO) and ‘The Fairy’ (TF) grown in a climatic chamber under three light conditions: W, WR and WRFR.
GenArea (cm2)MeanCircMean
WWRWRFRWWRWRFR
Bai1000.4 a 11035.7 ab1305.2 b1113.8 C 20.7 a0.7 a0.7 a0.7 B
KO402.6 a375.6 a536.6 a438.3 A0.8 a0.8 a0.8 a0.8 C
TF609.9 a567.2 a912.4 b696.5 B0.6 a0.6 a0.6 a0.6 A
Mean670.9 a659.5 a918.1 b 0.7 a0.7 a0.7 a
Area, area of the convex envelope; Circ, circularity. 1 Means followed by the same lowercase letter in the same line are not significantly different (Tukey test, p < 0.05). 2 Means followed by the same uppercase letter in the same column are not significantly different (Tukey test, p < 0.05).
Table 6. Least-square means (LS means) of elongation, branching and flowering variables measured at measurement point 2 and selected for Baipome (Bai), Knock Out® Radrazz (KO) and ‘The Fairy’ (TF) grown in a climatic chamber under three light conditions: W, WR, and WRFR.
GenLSA (cm)MeanLSA2 (cm)MeanLSA3 (cm)Mean
WWRWRFRWWRWRFRWWRWRFR
Bai6.7 a 17.0 a7.6 a7.1 A 27.7 a8.4 a9.1 a8.4 A5.1 a5.2 ab6.5 b5.6 A
KO7.9 a8.7 a11.8 b9.5 B11.0 a11.0 a17.9 b13.3 B6.8 a6.2 a6.6 a6.5 B
TF7.8 a7.7 a9.6 a8.4 AB11.6 a10.9 a16.0 a12.8 B6.5 a6.4 a9.0 b7.3 C
Mean7.5 a7.8 a9.7 b 10.1 a10.1 a14.4 b 6.1 a5.9 a7.3 b
GenNbAMeanNbSAMeanNbSA3Mean
WWRWRFRWWRWRFRWWRWRFR
Bai58.2 a54.1 a78.2 b63.5 B42.6a38.6 a60.4 b47.2 B18.4 a13.4 a36.4 b22.7 B
KO7.7 a7.8 a9.1 a8.2 A3.5 a3.5 a4.9 a4.0 A1.6 a1.8 a2.4 a1.9 A
TF77.3 a69.1 a103.9 b83.4 C62.3 a54.4 a85.3 b67.3 C41.5 a37.6 a60.7 b46.6 C
Mean47.7 a43.7 a63.8 b 36.2 a32.2 a50.2 b 20.5 a17.6 a33.1 b
GenNbDetAMeanNbDetSAMeanNbDetSA3Mean
WWRWRFRWWRWRFRWWRWRFR
Bai33.6 a26.5 a44.3 b34.8 B26.4 a20.9 a35.7 b27.7 B11.3 a6.9 a21.4 b13.2 B
KO2.7 a2.8 a4.8 a3.5 A0.6 a0.7 a2.1 a1.1 A0.3 a0.5 a1.0 a0.6 A
TF55.5 a49.6 a79.4 b61.5 C46.1 a41.1 a67.7 b51.6 C31.4 a29.7 a47.1 b36.1 C
Mean30.6 b26.3 a42.9 c 24.4 a20.9 a35.2 b 14.4 a12.4 a23.2 b
LSA, length of the short axes; LSA2, length of the order 2 short axes; LSA3, length of the order 3 short axes; NbA, number of axes; NbSA, number of short axes; NbSA3, number of order 3 short axes; NbDetA, number of determined axes; NbDetSA, number of determined short axes; NbDetSA3, number of order 3 determined short axes. 1 Means followed by the same lowercase letter in the same line are not significantly different (Tukey test, p < 0.05). 2 Means followed by the same uppercase letter in the same column are not significantly different (Tukey test, p < 0.05).
Table 7. Least-square means (LS means) of branching variables measured on the order 2 axes at measurement point 2 for Baipome (Bai), Knock Out® Radrazz (KO) and ‘The Fairy’ (TF) grown in a climatic chamber under three light conditions: W, WR, and WRFR.
GenNbSA3_TopMeanNbSA3_MedMeanNbSA3_BasMean
WWRWRFRWWRWRFRWWRWRFR
Bai12.8 a 19.1 a24.2 b15.4 B 24.3 a3.0 a9.0 b5.4 B1.2 a1.2 a3.2 b1.9 B
KO1.1 a1.3 a1.6 a1.3 A0.2 a0.2 a0.5 a0.3 A0.3 a0.3 a0.3 a0.3 A
TF29.5 a27.0 a42.8 b33.1 C10.8 a9.2 a16.3 b12.1 C1.2 a1.3 a1.5 a1.4 B
Mean14.5 a12.5 a22.9 b 5.1 a4.2 a8.6 b 0.9 a0.9 a1.7 a
NbSA3_Top, number of order 3 short axes on order 2 long axes in the apical zone; NbSA3_Med, number of order 3 short axes on order 2 long axes in the median zone; NbSA3_Bas, number of order 3 short axes on order 2 long axes in the basal zone. 1 Means followed by the same lowercase letter in the same line are not significantly different (Tukey test, p < 0.05). 2 Means followed by the same uppercase letter in the same column are not significantly different (Tukey test, p < 0.05).

