1. Introduction
Tomatoes (
Solanum lycopersicum L.) are an important economic crop worldwide, with the greatest area of cultivation among vegetables [
1]. In 2018, the total tomato production exceeded 182 million tons over a cultivation area of 4.7 million hectares [
2]. Tomatoes have a subtropical origin, thus requiring large amounts of irrigation water during summer, which is the cropping season for processing tomatoes in dry areas of Southern Italy. However, in these areas, the scarce availability of irrigation water resources and the lack of rainfall during summertime limit a sustainable cultivation for high water-demanding crops, such as processing tomatoes; besides, the irrigation issues have seriously been worsened due to climate change effects. Indeed, to maximize tomato yields, soil water availability at the root zone must be maintained near field capacity throughout the growth period [
3].
Under a semi-arid environment, the development of water-saving irrigation strategies may encourage farmers to revise their irrigation scheduling approach towards a more efficient water management, in order to limit water consumption and bring to satisfactory yields. Deficit irrigation approaches result in a reduced water application while maintaining adequate yields and enhancing overall fruit quality [
4]. This is also for tomatoes, where the validity of the adoption of this water-saving irrigation strategy has been largely documented [
4,
5,
6,
7]. One of the greatest benefits of deficit irrigation is that, besides saving large amounts of water, it allows to lessen the production costs, to improve water productivity (i.e., the efficiency in its use) and, overall, to reduce the impact of the crop to the environment, as compared to conventional irrigation [
8]. However, not all stages of the crop-growing season are sensitive to water stress due to deficit irrigation similarly.
In tomato crops, the most sensitive phenological phase to water stress is generally flowering [
6]. Significant effects of water deficit at fruit ripening on tomato yields under greenhouse conditions have been also reported [
9]. The relationship between soil water deficits at critical stages and the physiological and productive behavior of tomatoes is quite complex and long studied, although controversial results have been reported [
1]. Models to estimate the effects of evapotranspiration (ET) were developed as well, either at each growth stage or for the whole growth period, on crop yields. Some of them, like the date crop water production function (DCWPF) [
10] or Minhas model with its water deficit sensitivity indexes [
11] can be applied to optimize the irrigation water management in areas of water scarcity.
As aforementioned, the effects of irrigation at different stages of the crop growing season have been extensively studied in tomatoes, although mostly upon fruit yield and quality [
12,
13,
14,
15]. However, detailed studies on the relationships between crop physiology and growth in field-grown tomatoes exposed to different deficit irrigation regimes are still lacking. The identification of the most critical stages to water stress through the measurement of some plant water status parameters may contribute to a better manipulation of deficit irrigation in processing tomatoes. Indeed, both soil water and climate conditions may greatly affect the physiological parameters (stomatal conductance, transpiration and pre-dawn leaf water potential) of the crop, even under unrestricted soil water content conditions [
16].
The goal of this study was to assess the effects of deficit irrigation applied to the crop-growing season or at critical stages on physiology, growth, yield and water use efficiency in field-grown processing tomatoes under a semi-arid Mediterranean environment of South Italy, in order to identify the most water stress-sensitive period and optimize irrigation water management under water scarcity conditions.
2. Materials and Methods
2.1. Open-Field Experiment
Field experiment was conducted during the 2012 season in a site on the Eastern coast of Sicily (South Italy, 10 m a.s.l., 37°03′ N Lat, 15°18′ E Long) on a moderately deep Calcixerollic Xerochrepts soil. The soil characteristics were: clay 24.0%, sand 35.0%, silt 41.0%, organic matter 1.20%, pH 8.0, total N 0.5‰, available P 48 mg kg−1, exchangeable K 940 mg kg−1, bulk density 1.3 g cm−3, field capacity (−0.03 MPa) 0.25 g g−1 and wilting point (−1.5 MPa) 0.15 g g−1. Fallow preceded the cultivation of tomato crops.
In a randomized complete block experimental design with three replicates, seven irrigation treatments were studied (
Table 1). The cultivar Hypeel F1 (Seminis Inc., Oxnard, CA, USA) of the processing tomato (
Solanum lycopersicum L.) was used for the experiment.
Plants were transplanted at the four-leaf stage on June 9 in a single plot of 38.4 m2 (4.8 m × 8 m). Plants were spaced at 0.75 m between rows and 0.40 m within rows, resulting in a plant density of approximately 3.3 plants m−2. Before transplanting 75, 100 and 100 kg ha−1 of N (as ammonium sulphate), P2O5 (as mineral perphosphate) and K2O (as potassium sulphate), respectively, were distributed. Approximately 30 days after transplant (DAT), a further 75 kg ha−1 of N (as ammonium nitrate) was supplied as top dressing.
A drip-irrigation system was used. At the time of transplanting, the irrigation water was supplied to fulfil the field capacity at approximately 0.3 m of depth. Thereafter, the volume of irrigation water to supply was determined on the basis of the maximum available soil water content (ASWC) in the first 0.4 m of soil, where most of roots are expected to grow, calculated with the following formula:
where
V = water amount (approximately 34 mm), 0.66 = fraction of promptly available soil water permitting unrestricted evapotranspiration,
FC = soil water at field capacity (25% of soil dry weight),
WP = soil water at wilting point (15% of soil dry weight), ρ = bulk density (g cm
−3) and
D = soil depth (0.4 m). Irrigation water was supplied when the sum of daily evapotranspiration (
ETc) corresponded to
V:
where
ET0 = reference ET, measured by means of a class A pan (mm),
kp = pan coefficient, equal to 0.80 in a semi-arid environment and
kc = crop coefficient [
3]. Total amount of water distributed to each irrigation treatment is reported in
Table 1. No chemical herbicides were used for weed control. A hand-weeding was performed once only, since the crop covered the soil, and weeds could no longer grow.
The following meteorological variables were recorded daily throughout the crop-growing season: air temperature, rainfall, class A pan evaporation, using a data logger (CR10, Campbell Scientific, Logan, UT, USA) located approximately 50 m from the experimental field.
Along the experiment from mid-July, when plants started to flower, to the end of August, when they were at the ripening stage of fruits, soil water content was measured, at 2 to 3-day intervals, by means of gypsum blocks (Soilmoisture Equipment Corp., Santa Barbara, CA, USA) located at 0.15 and 0.30-m soil depths in all replicates of each irrigation treatment. Thereafter, the available soil water content (ASWC), as a percentage of the maximum available water and according to the following formula, was calculated [
17]:
where
WC = soil water content (g g
−1 dry soil),
FC = soil water content at field capacity (0.25 g g
−1 dry soil) and
WP = soil water content at the wilting point (0.15 g g
−1 dry soil).
ASWC ranged between 100% (field capacity) and 0% (wilting point).
2.2. Physiological Measurements
Leaf transpiration (E, mmol H2O m−2s−1) and stomatal conductance (gs, mol m−2s−1) were measured along the growing season at 10 subsequent dates after transplanting (DAT) from mid-July to the end of August by means of a null balance “steady-state” porometer (Model LI-1600, Li-Cor, Inc., Lincoln, NE, USA). Measurements were made on clear sunshine hours between 11:00 h and 13:00 (solar time) in fully developed and healthy leaves. One reading was carried out on three randomly chosen, fully expanded young leaves from each plot.
Leaf water potential (ψ, MPa) was also measured before sunrise (03:00–05:00 h solar time, “pre-dawn” water potential) at 3–5-day intervals starting in August up to early September by means of a pressure chamber (Soilmoisture Equipment Corp., Santa Barbara, CA, USA). Briefly, a leaflet was excised at the petiole level from a young fully expanded leaf (on the top part of the plant) using a razor blade. The leaflet was partly sealed in the pressure chamber, with the cut end of the petiole protruding through the seal. The chamber was pressurized with compressor gas until the appearance of water in the cut surface (detectable using a magnifying glass). At that point, the pressure was recorded. As for E and gs, one reading was carried out on three randomly chosen, fully expanded young leaves from each plot.
2.3. Plant Measurements
At five dates, from middle of July to early August (34, 38, 46, 53 and 60 DAT), two representative plants were sampled destructively from each experimental plot, and flowers and fruits (when present) were counted. After that, plant parts (root, stem, leaves, flowers and fruits when present) were dried in a thermo-ventilated oven at 65 °C until constant weight (about 3 days) for dry matter (DW) measurement (g DW plant−1).
2.4. Calculations
The crop was hand-harvested when the ripe fruit rate reached ~95% (early September). At harvest, total fruit yield (t ha
−1) was measured, and irrigation water use efficiency (IWUE, kg m
−3) was calculated from the different irrigation treatments as the ratio of total yield (kg) and total water applied by irrigation (m
3) [
13].
2.5. Statistical Analyses
Data of physiological (E, gs and ψ) and plant production (number of flowers, number of fruits, shoot dry weight, root dry weight and fruit production) measurements were subjected to a one-way repeated-measures analysis of variance (ANOVA) where date of measurement represents the within-subjects factor and the irrigation treatment the between-subjects factor (SPSS, PASW Statistics 18). When the Mauchly’s sphericity test failed to meet the assumption of sphericity, the univariate results were adjusted by using the Greenhouse-Geisser Epsilon and the Huynh-Feldt Epsilon correction factors. Following the univariate test satisfying the sphericity for within-subject effects, the F-values and associated p-values for between-subject effects were tested. Means were separated by the Tukey’s test at a 95% confidence level. For data of the number of flowers and number of fruits per plant, shoot dry weight and root dry weight, a supplemental ANOVA was carried out separately for the date of measurement.
Data of final yield and irrigation water use efficiency (IWUE) were statistically analyzed by a one-way analysis of variance (ANOVA) using CoStat version 6.003 (CoHort Software, Monterey, CA, USA). Differences between means were evaluated as described above.
Plant dry weight variations over time were interpolated by a nonlinear iterative regression method (SigmaPlot11, Systat Software Inc., San Jose, CA, USA) using the following exponential function:
where
a = maximal value of
y,
x = time (DAT),
x0 = time (DAT) to reach 50% of maximal value
a and
b = fitting parameter of the curve. Thereafter, using values of the curve, crop growth rate (CGR, g DW plant
−1d
−1) was calculated as follows:
where
W2 and
W1 are the values of the plant dry weight (g) at times
t2 and
t1, respectively, on the curve. Finally, the maximum value of CGR (CGRmax) was considered [
18].
The relationships between leaf transpiration and stomatal conductance measured in plants under no water limitation (F treatment) and vapor pressure deficit (VPD, kPa) in the atmosphere were described by using a nonlinear function (SigmaPlot11, Systat Software Inc., San Jose, CA, USA). VPD was calculated using air relative humidity (RH, %) and air temperature (°C) recorded by the same “steady-state” porometer at the moment of physiological measurements [
19].
3. Results
3.1. Meteorological Trend
The meteorological course during the crop-growing season was typical of the semi-arid Mediterranean environment, with a hot and dry summer (
Figure 1).
Maximum temperature ranged between 27.6 °C (in June) and 43.4 °C (in July), with the minimum between 14.0 °C (in June) and 22.4 °C (in July). Total rainfall up to August was <10 mm; therefore, soil water availability was totally due to irrigation. Reference evapotranspiration (ET0) follows the course of the air temperature, and values exceeding 9 mm d−1 were recorded in the first 10-day period and at the end of July.
3.2. Soil Water Content
Soil water content fluctuated during the growth season, according to the irrigation time. It maintained the highest levels at both soil depths under the F regime throughout the crop-growing season (
Figure 2). However, even under these experimental conditions, despite continuous irrigation, soil water deficits sometimes exceeded 66% (threshold for irrigation). Indeed, the volume of water supplied by irrigation (approximately constant) was indirectly calculated on the ETc basis, not on the actual soil water content at the irrigation time [
20]. Therefore, it is likely that this volume of water sometimes was not adequate to fill the soil up to field capacity even under the F regime.
In the D treatment, irrigation tended to fulfil the upper layers of the soil. Under no irrigation during flowering (NI, FE and DE), soil water contents during the measurements period were always beneath the field capacity at both soil depths. In plots irrigated only at flowering, soil water contents exhibited trends similar to that of the F regime, although, in FFL, only in the upper layer of soil. In DFL, the water content kept higher in the upper layers of the soil (15 cm), up to approximately 50 DAT. However, just after irrigation suspension (at 54 DAT), the soil water content in both FFL and DFL dropped to levels lower than the field capacity already at 57 DAT.
3.3. Course of Leaf Transpiration and Stomatal Conductance
ANOVA evidenced a highly significant effect of the irrigation treatment (
I) and time of measurement (
T) upon all the physiological parameters examined (
p ≤ 0.001) (
Table 2). The significant interaction
I ×
T (
p ≤ 0.001) suggests that the physiological response of tomato plants to changing soil water contents varies with the time of measurement.
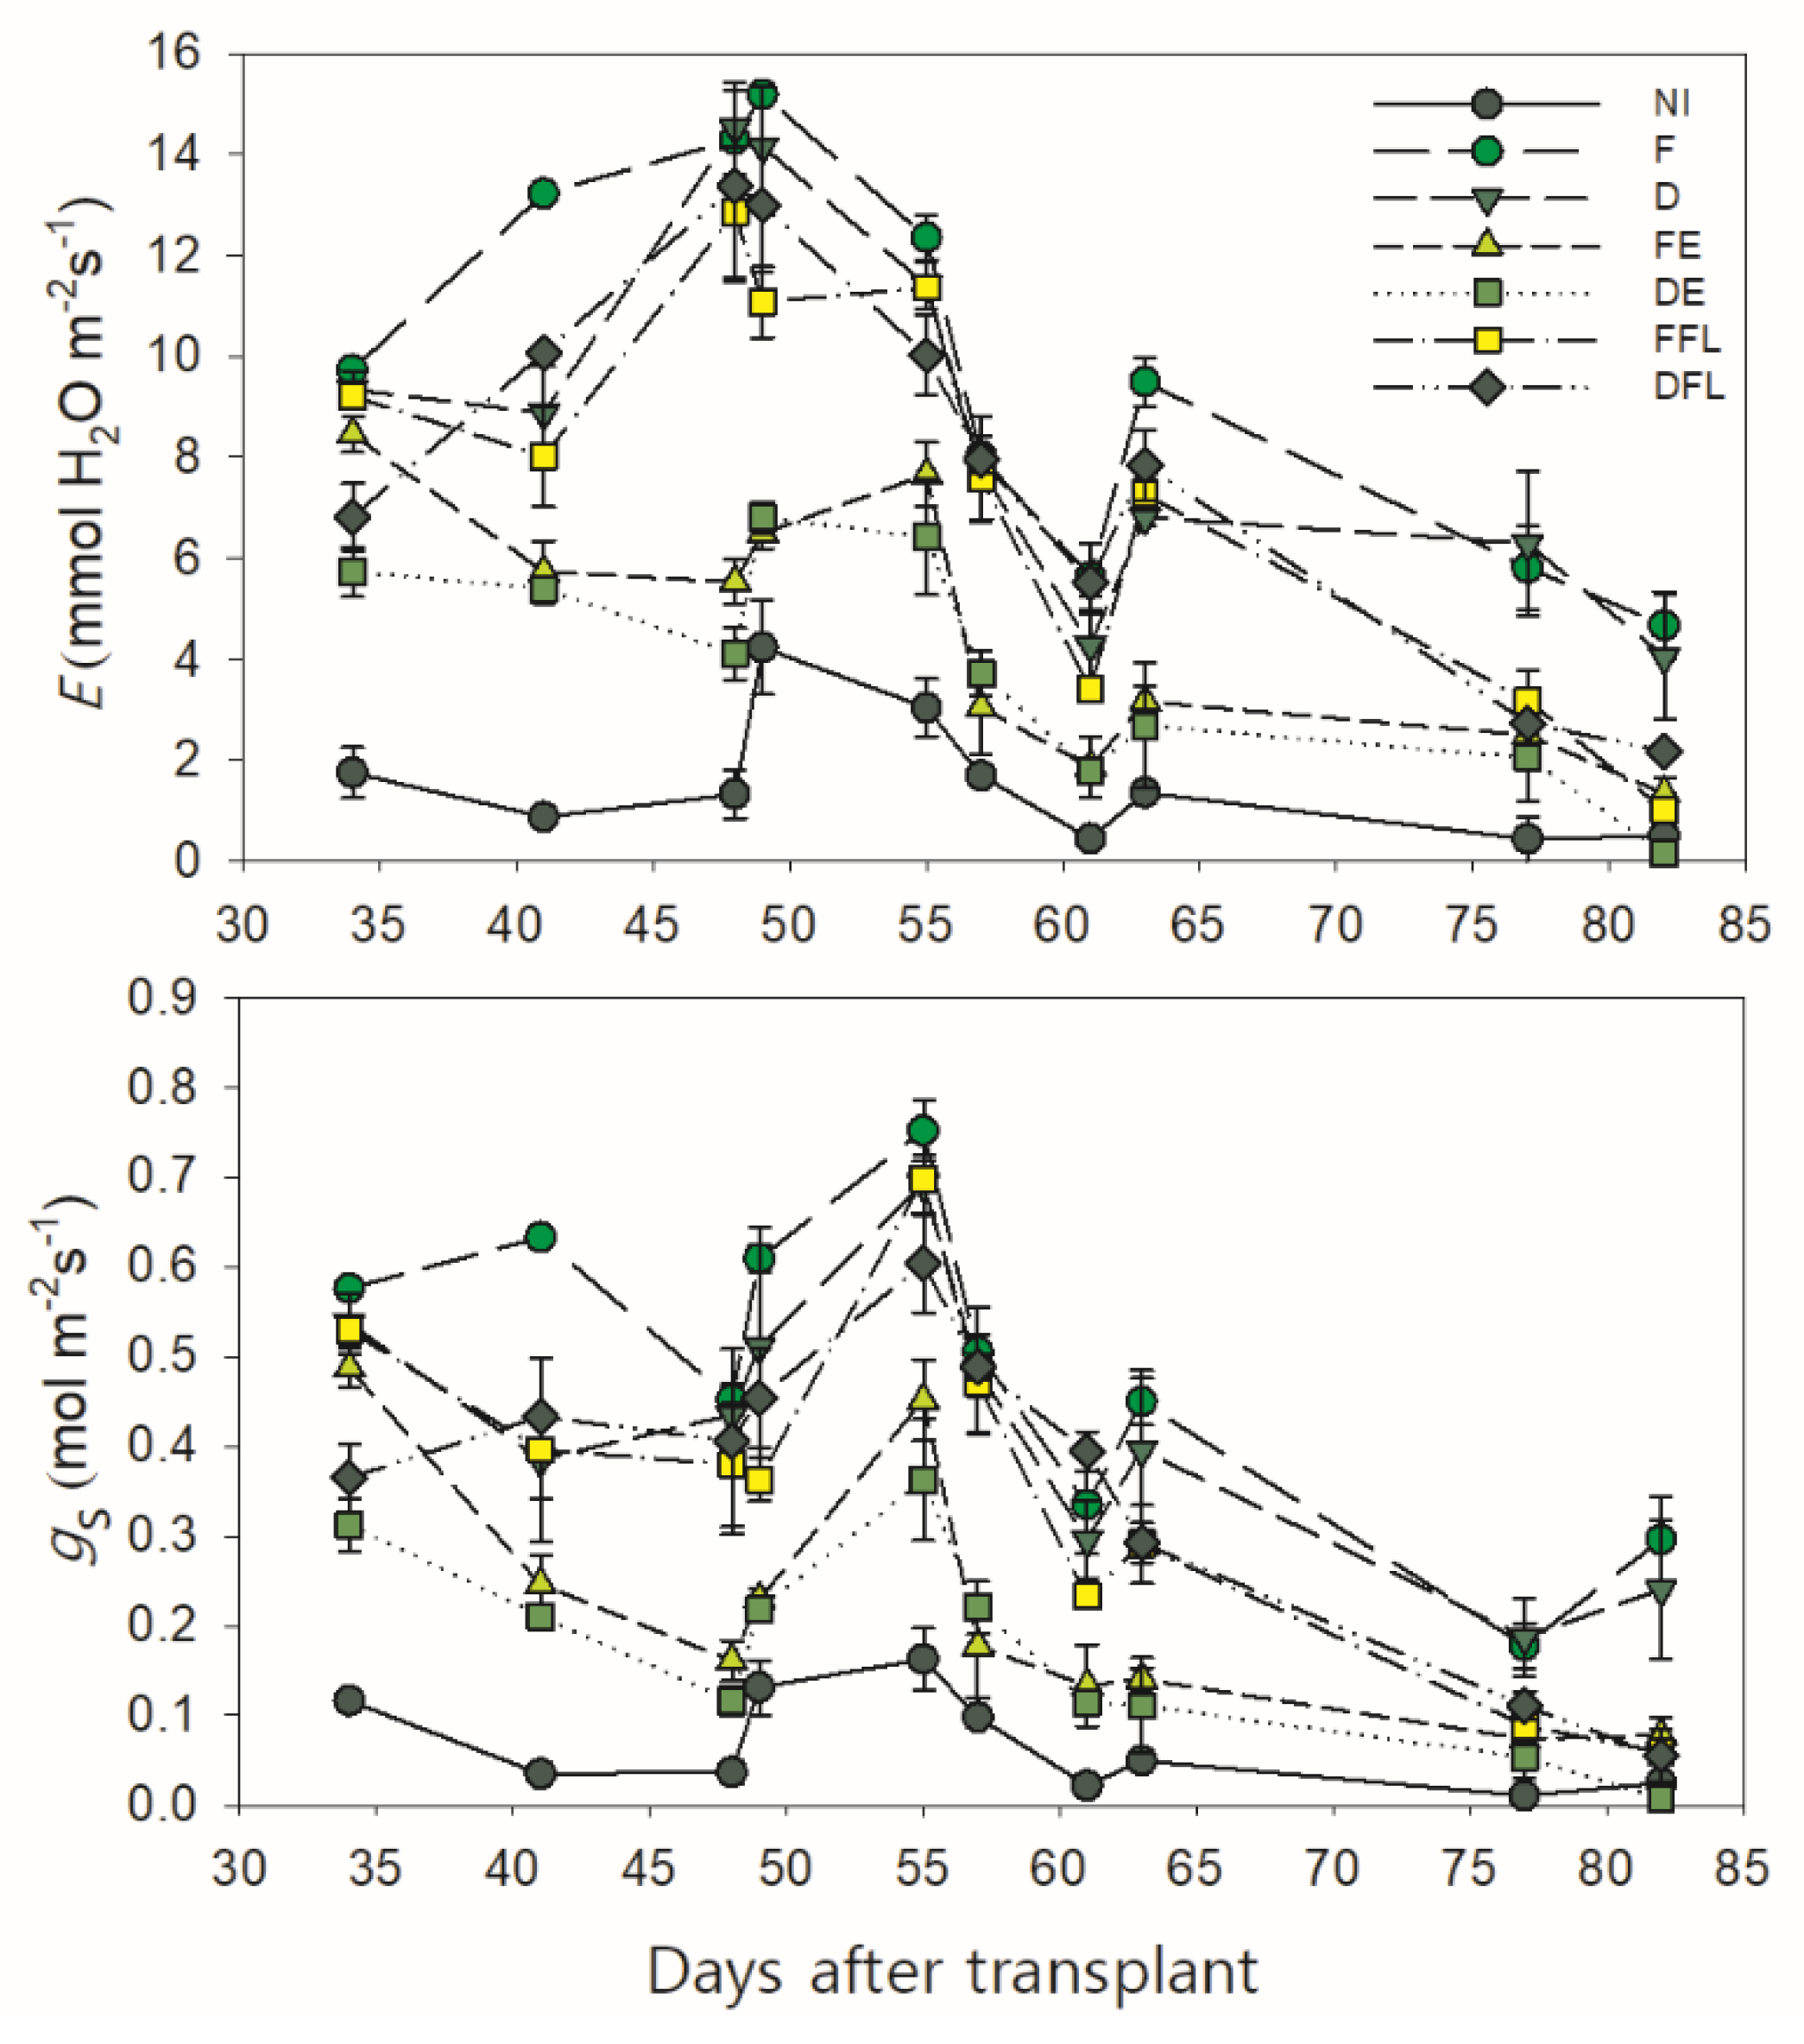
Leaf transpiration (
E) and stomatal conductance (
gs) were measured from approximately a month after transplanting (when plants were at the floral initiation and water treatments were overall differentiated) onward (
Figure 3). In all the experimental situations,
E exhibited an increasing trend from the initial measurement up to approximately 50 DAT, when the first fruit buds were quite visible. After that,
E steeply decreased down to values ≤5.55 mmol H
2O m
−2s
−1 measured at 61 DAT in all water treatments.
This was probably due to quite a low air humidity and quite a high air temperature recorded in that period (between 52 and 62 DAT), which determined a high VPD and, consequently, a high water demand from the atmosphere. This, in turn, induced a partial stomatal closure and a reduced E even under the unrestricted soil water conditions in F. Indeed, an exponential function well describes the overall changes in
E and
gs measured in plants under good soil water conditions (those of F), according to the variation in VPD (
Figure 4).
The course of this function indicates that an increase in the VPD determines a progressive raise in both parameters up to a maximum (at a VPD of approximately 1.9 kPa for E and 1.7 kPa for gs on the curve). Beyond this, the values of E and gs start to decline down to a minimum at 2.4 kPa of the VPD.
Later on, the leaf transpiration increased again except under severe soil water deficit conditions (NI, FE and DE), thus slowly decreasing down to the minimum measured late in the growing season (82 DAT), when plants started to senesce.
Same trend was observed for stomatal conductance, although its maximum value was achieved later (approximately 55 DAT) than that measured for E.
According to the water supply, plots continuously irrigated (F and D) and those receiving water at flowering only (FFL and DFL) maintained higher rates of leaf transpiration and stomatal conductance over those exposed to a drying soil (NI, FE and DE), with maximum values ≥11 mmol H2O m−2s−1 (for E) and 0.56 mol m−2s−1 (for gs) in all.
3.4. Course of “Predawn” Water Potential
The course of water potential (ψ) at the first hours of the day (“predawn”) was measured under nonlimiting air temperature and relative humidity conditions to the plant-water flux (
Figure 5). Predawn ψ was measured during the growing season, starting from the first days of August (55 DAT), when plants were near the end of the flowering period, to early September (88 DAT). Under rainfed conditions (NI), predawn ψ kept always the lowest values (<−0.50 MPa), and at the end of growing season, it was −1.06 MPa.
Under no irrigation at flowering (FE and DE), ψ exhibited a fluctuating trend, dropping down to final values <−0.70 MPa. Under a continuous water supply, ψ always kept values ≥−0.38 MPa in plants fully irrigated (F), which indicated an adequate plant water status. In FFL and DFL, the water potential after the irrigation suspension was kept high, even if the soil water content kept constantly lower than the field capacity from 57 DAT onward.
3.5. Course of Shoot and Root Dry Biomasses
The statistical analysis evidenced a significant effect of the irrigation treatment (
I) and time of measurement (
T) upon both the shoot and root dry biomasses (
p ≤ 0.001). However, significant interactions (
p ≤ 0.01) were also observed (
Table 3).
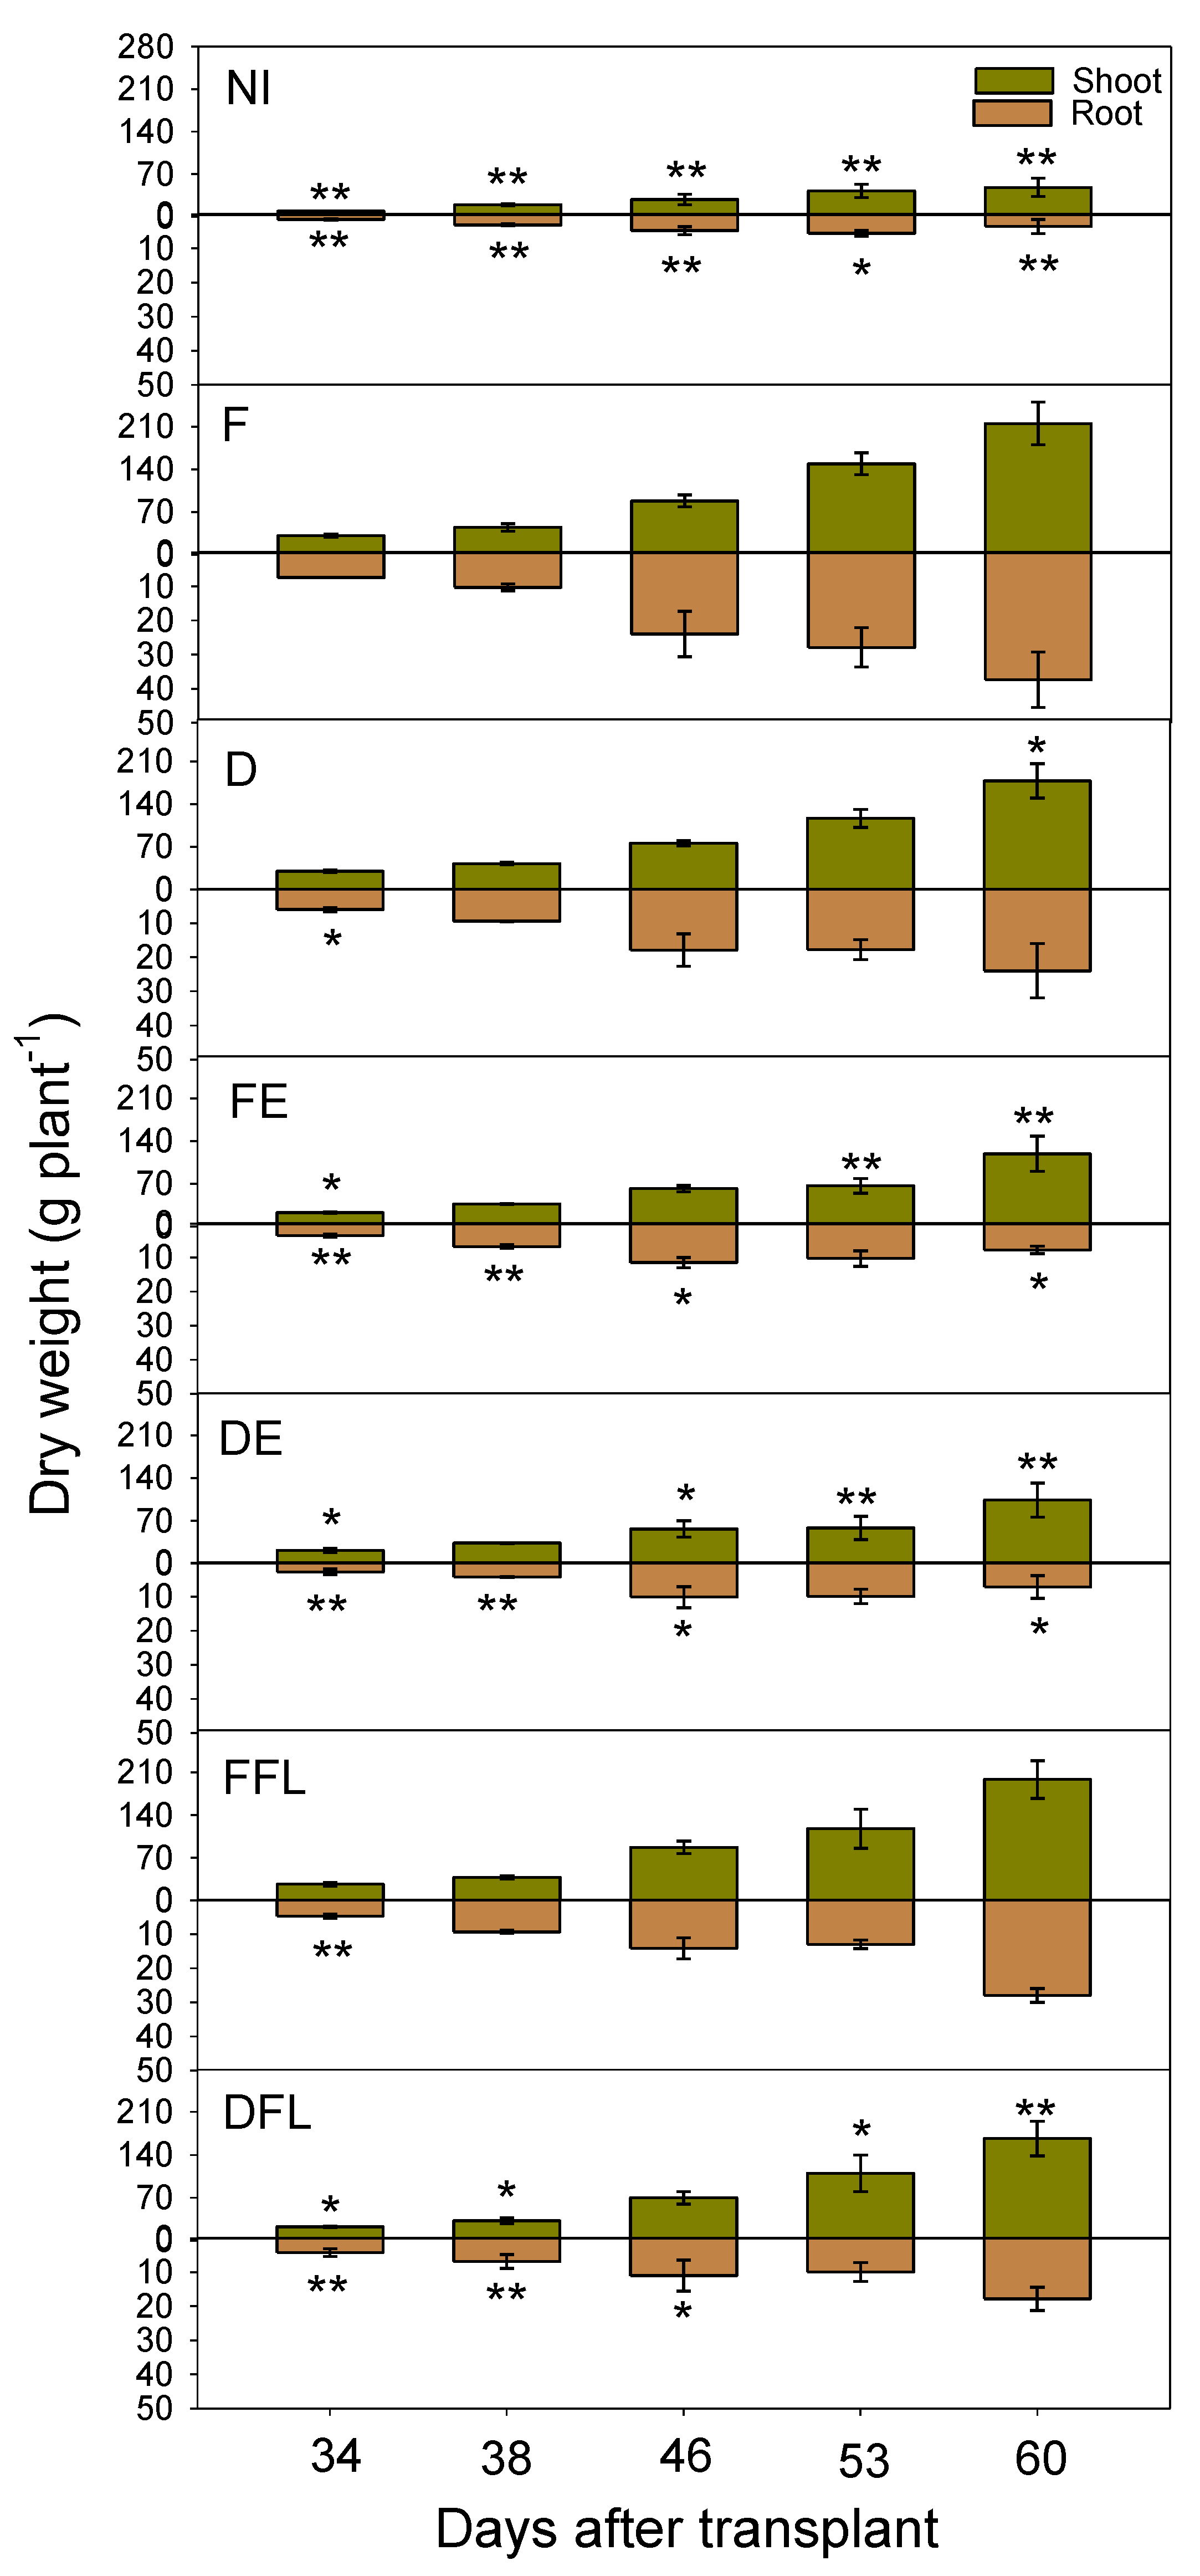
Indeed, the above-ground dry biomass progressively increased in all experimental situations (
Figure 6). Up to approximately 38 DAT, no great difference was evidenced among the irrigation treatments in the rate of biomass accumulation. After that, plants irrigated up to floral initiation (FE and DE treatments) accumulated dry biomasses with lower rates and 53 days after transplant; when plants were near the end of flowering, no further plant growth occurred. Under these experimental situations, the total dry biomass started to increase again later on due to the fruit-set contribution. Under full and deficit irrigations for the entire season (F and D, respectively) or during flowering only (FFL and DFL, respectively), dry biomasses were progressively accumulated up to the end of the growing season, with greater rates, as expected, in F. Under no irrigation conditions (NI), plants accumulated dry biomasses with low rates until the end of the growing season (low fruit contributions).
Root growth was quite proportional to that of shoots in plants fully irrigated for the whole growing season. Differently, roots stopped growing when plants achieved full flowering (approximately 46 DAT onward) in the other water treatments. However, rewatering during flowering in FFL and DFL led to a regrowth of root apparatuses. Root growth was scarce under dry conditions (NI).
Maximum crop growth rate (CGRmax) calculated from the values of the dry plant biomass vs. time (DAT) on the interpolation curve (0.95 ≤ R2 ≤ 0.99) ranged between 1.89 (NI) and 10.97 (FFL) g DW plant−1d−1. High CGRmax (10.29 g DW plant−1d−1) also corresponded to the F treatment, while under deficit irrigation (D), it was lowered to 8.58 g DW plant−1d−1. This last value was further reduced (to 7.64 g DW plant−1d−1).
3.6. Course of Flower and Fruit Number
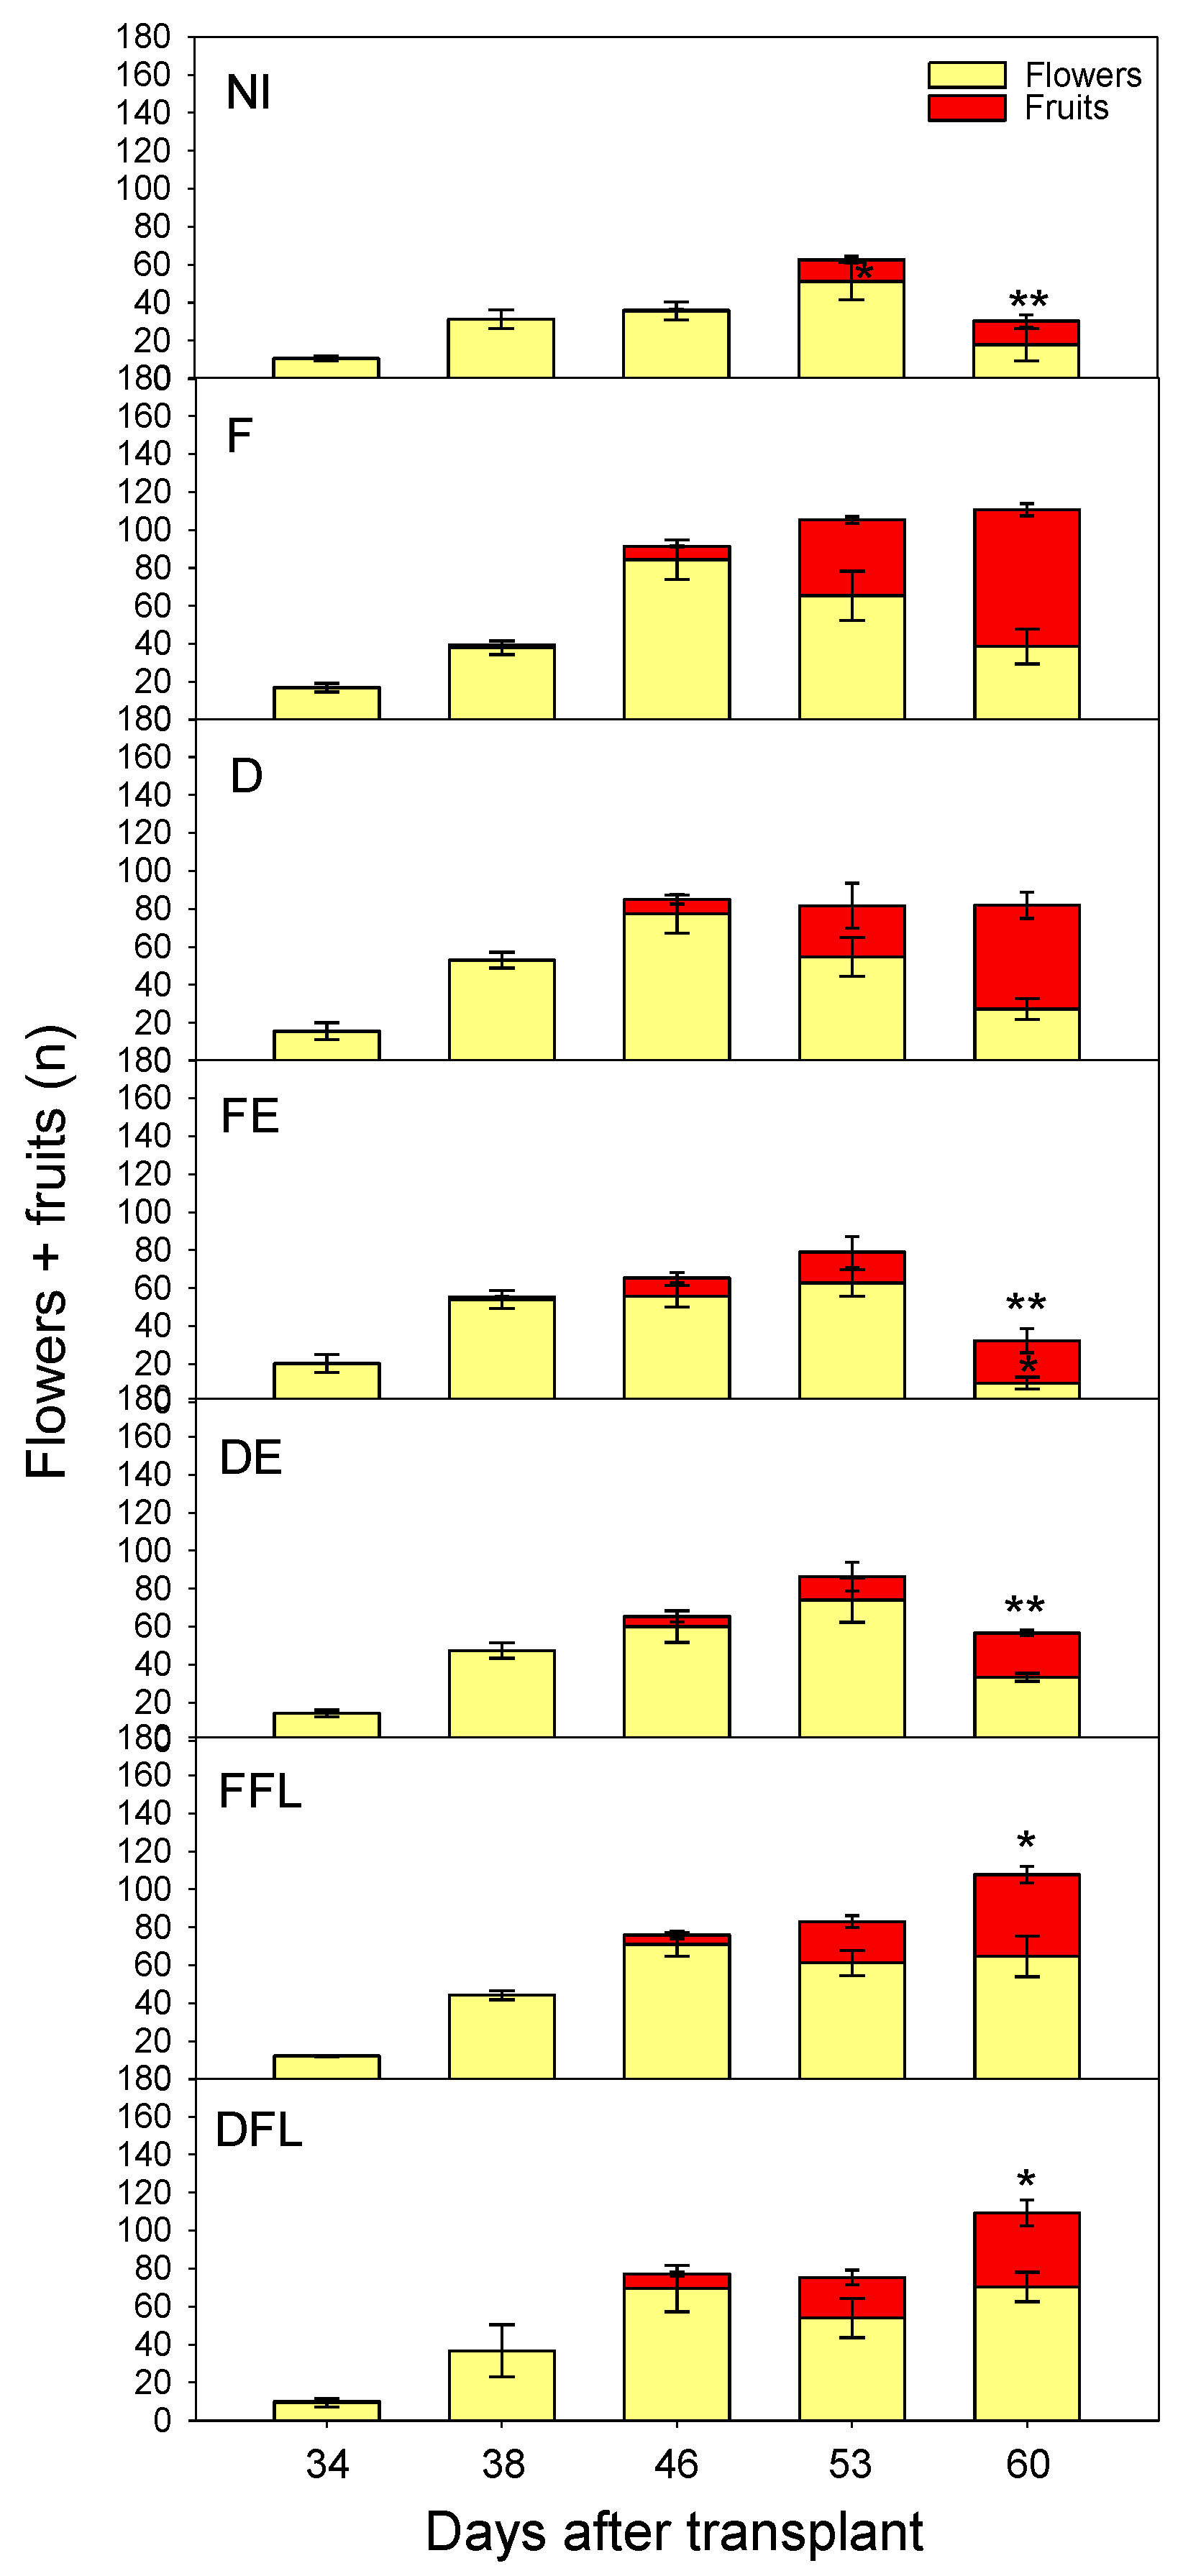
The number of flowers and that of fruits were significantly affected by the irrigation regime (p ≤ 0.05) and, to greater extent, by the time of measurements (p ≤ 0.05). Significant effects of I × T were also evidenced by ANOVA (p ≤ 0.05).
In particular, the number of flowers per plant progressively increased with time, up to a maximum that, in NI, FE and DE, was achieved later (at 53 DAT) than the other water treatments (at 46 DAT) (
Figure 7).
The first fruits appeared approximately 46 days after transplant, when excluding plants under dry conditions (NI) that, at that time, still did not have fruits. In F, after 53 DAT, the sum of flowers and fruits kept constant, indicating no flower drop. In FFL and DFL, rewatering at flowering induced a rise in flower production at 60 DAT. No irrigation at flowering in NI, FE and DE caused a quite pronounced drop of flowers. As a result, less fruits were produced under these experimental conditions.
3.7. Course of Fruit Production
According to the course of the number of flowers and fruits with time, the fruit production per plant along the crop season was maintained constantly higher in F and lower in NI after 50 DAT (
I effect significant at
p ≤ 0.001) (
Figure 8).
Under irrigation limited to the flowering period, plants receiving 50% ETc exhibited a fruit production course similar to that of plants fully irrigated (100% ETc), with a production at 60 DAT anyway lower than that of plants under a deficit irrigation for the whole season (D treatment) (I × T, p ≤ 0.001). In fact, the rise in flower production occurring in response to reirrigation at flowering did not induce an equal rise in fruit production, since probably the irrigation suspension after flowering did not allow most of the new flowers to turn into fruits. Under no irrigation at flowering (FE and DE), plants produced constantly less than those of the irrigated.
3.8. Fruit Yield and Water Productivity
Final fruit yields varied from 51.02 t ha
−1 (F) to 3.81 t ha
−1 (NI), with significant differences (
p ≤ 0.01) among treatments (
Table 4). Irrigation at a reduced rate in D determined a 16% fruit loss, with a final yield that slightly (
p ≤ 0.05) but not significantly differed from that of the F treatment and 44% water saved. In FFL and DFL, as mentioned above, the raised number of flowers per plant due to rewatering during the flowering period was not followed by an equal increase in plant productivity. Therefore, irrigation only at flowering resulted in a water consumption that was approximately 48% and 69% (in FFL and DFL, respectively) lower than that of long-season full irrigation (F); however, 55% (in FFL) and 58% (in DFL) fruit yields were lost.
No significant difference in final yield was observed between the two rates of irrigation (full and deficit), irrespective of the irrigation scheduling (irrigation cut-off before the start of flowering or irrigation at flowering only).
Irrigation water use efficiency (IWUE) was maximized in D treatments (IWUE >19 kg m−3). IWUE in FE and DE was greater than 13 kg m−3; however, yields were not economically convenient (yield losses >69%). Irrigation limited to the flowering period had low efficiency at a 100% rate (FFL, IWUE 11.05 kg m−3) but high at a 50% rate (DFL, IWUE >16 kg m−3).
3.9. Relationships of Physiological Parameters vs. Plant Production Traits
Plant water status significantly influenced the rate of dry biomass accumulation along the crop season. Positive relationships were described between the water potential, leaf transpiration and stomatal conductance at 55 DAT vs. a maximum value of CGR, i.e., that calculated between 53 and 60 DAT (r = 0.90 ** for ψ and 0.97 *** for both
E and
gs) (
Table 5).
The plant water status significantly affected the reproductive process. Indeed, positive relationships (r = 0.91**) were described between leaf transpiration at 41 DAT (a few days after the restart of irrigation in FFL and DFL) and the number of flowers measured at 46 DAT, indicating that good soil water conditions during flowering positively affect the plant water status and, thus, the reproductive activity. As a result, those plants highly transpiring produced more flowers than those less transpiring. Flowers produced at 46 DAT were also positively correlated with stomatal conductance at 41 DAT (r = 0.91**).
Even closer positive relationships of leaf transpiration (r = 0.92**) and stomatal conductance (r = 0.96***) at 41 DAT were described vs. the number of fruits at 60 DAT, i.e., those deriving from flowers produced earlier (at 46 DAT). Indeed, the number of fruits produced at 60 DAT was in turn positively correlated with that of flowers measured at 46 DAT (r = 0.97***) but not with that of flowers produced later on (53 DAT, r = 0.31ns). This indicates that, irrespective of the experimental conditions, more or less all flowers first produced turned into fruits, but only a portion of those produced later (after 53 DAT) in response to reirrigation at flowering (as occurred in FFL and DFL treatments) produced fruits. Indeed, the final yield result positively correlated with the number of flowers produced early (r = 0.88**) but not with those produced late (at 53–60 DAT, r < 0.2ns).
Plant water status greatly affected the final fruit yield. Indeed, the leaf transpiration and stomatal conductance measured during flowering (up to approximately 55 DAT) well predicted the final plant productivity, being well-correlated with the final fruit yield (r > 0.84**). As well, good plant water conditions later on, at fruit onset, as indicated by a low predawn water potential at 63 DAT, positively influenced the final fruit yield (r = 0.96***).
4. Discussion
Tomatoes are reported as moderately sensitive to water stress, with sensitivity mostly depending on the cultivar and the growing stage at which soil water deficit occurs [
3,
4].
In this research, the physiological responses of processing tomatoes to irrigation at different rates and critical stages were examined in a semi-arid environment. Under full irrigation conditions over the growth season, the plants exhibited the highest rates of both leaf transpiration and stomatal conductance; this was mostly because of the high turgor capacity [
21]. Conversely, under water-stressful conditions, plants tended to close the stomata (low
gs) in order to limit water losses through transpiration (low
E) [
7]. Nevertheless, according to the observed level of ASWC, close to the wilting point all along the flowering period and later on (from 40 DAT onward), plants not irrigated from flowering (FE and DE) still survived, as revealed by the high values of
E (>4.44 mmol H
2O m
−2s
−1) up to 55 DAT, even at the long-term 100% soil water deficit. These observations suggest that tomato plants, although sensitive to water stress, may survive to a prolonged soil water deficit.
The relationships among the different traits were also examined for a better comprehension on how the physiological parameters are associated with plant productivity in processing tomatoes when irrigation is applied at critical stages. However, it is well-known that the soil texture greatly affects water availability and, thus, the plant hydraulic status [
22]; therefore, it is feasible to expect the same physiological response in tomato plants under soil features similar to those of the present study.
According to what was observed in a cultivar of processing tomatoes cultivated under climatic conditions similar to those of the present research [
16], the plant water status is not the only factor regulating stomatal aperture. Indeed, the atmospheric conditions experienced by tomato plants during the growing season strongly influenced their physiological response to irrigation, and even in well-watered plants, the vapor pressure deficit (VPD), when exceeding 1.8 kPa, limited the stomatal opening, thus reducing the plant-water flux to the atmosphere. As a result, both the stomatal conductance and leaf transpiration were strongly reduced in the F treatment, although the corresponding predawn water potential was still quite high (−0.2 MPa). Similarly, Thompson et al. [
23] reported that low humidity (i.e., high VPD) reduces
gs in tomatoes, with a different extent depending on the genotype. Besides seasonal trends, the same effects of a changing VPD upon leaf transpiration, stomatal conductance and assimilation patterns were observed in well-irrigated plants of a grapevine. In particular, while no clear daily changes occurred in gas exchanges under a low atmospheric evaporative water demand (i.e., low VPD), a decrease in both
E and
gs, as well as in the assimilation rate, occurred under a high atmospheric evaporative water demand (i.e., high VPD) [
24].
Close positive relationships between the leaf transpiration and stomatal conductance measured at early flowering vs. the number of flowers produced indicated how the plant water status at flowering greatly affected its reproductive behavior (the higher the leaf transpiration and stomatal conductance, the greater the number of flowers produced). Indeed, flowering has been reported as the most sensitive stage of tomatoes to water stress [
25,
26]. Torrecillas et al. [
27] noticed that, differently than what happened in wild types, plants of domesticated tomatoes promptly reacted to temporary rewatering after suffering a prolonged period of water stress through a fast stomata reopening. This did not occur in wild tomatoes, where six days after rewatering, stomata were still closed, allowing plants to retain turgor. The high
E and
gs measured in the current research in FFL and DFL during flowering after a long-term soil water deficit may reveal a prompt reaction of tomato plants to rewatering but, at the same time, an inefficient stomatal control for water losses, which involves an inadequate plant recovery once irrigation is suspended again. In fact, high levels of
E and
gs as measured at the end of flowering or even later did not involve high yields, basically because not all flowers produced in large amounts later on in response to rewatering (as in FFL and DFL treatments) produced fruits. With this in mind,
E and
gs measured at early or mid-flowering, more than those measured at the end of this stage or later on, may be considered as valuable indicators to predict crop productivity in processing tomatoes. Similar results were obtained in a germplasm of local tomatoes cultivated in a semi-arid environment of Sicily, where the greatest yields were achieved with those genotypes with the highest levels of leaf transpiration measured at 50 DAT [
28].
The water potential was not measured at the floral initiation. However, when values of ψ at 55 DAT (beyond mid-flowering) were regressed vs. E and gs measured at the same time, strict relationships were observed (r = 0.93 ** in both cases); i.e., the plant water status greatly affects its physiological behavior. Therefore, it is likely that the water potential, if measured previously (e.g., at 41 DAT, as for E and gs), would be correlated to the final yield even more strictly than the leaf transpiration and stomata conductance were. Moreover, a high VPD depresses the rates of both the leaf transpiration and stomatal conductance, therefore altering the physiological response of the crop even under unrestricted soil water conditions. Contrastingly, the predawn ψ was less influenced by high temperatures and low air humidity, keeping low values under full irrigation, even at a high VPD.
In this research, the fruit yield was maximized when irrigation was applied at the highest rate (100% ETc) for the whole season. However, the adoption of a deficit irrigation strategy where irrigation at a lower rate (50% ETc) for the whole season is applied allowed to reduce yield losses to a minimum (<16%) while saving a great amount of water (up to 44%). This result somehow provides evidence that deficit irrigation at flowering did not significantly compromise the allocation of the plant energy sources, resulting in only very limited productivity losses.
Irrigation only at the vegetative stage adversely affected the crop productivity, causing yield losses >68%. In turn, irrigation limited to the flowering period, even at a reduced rate (50% ETc), slightly alleviated the water stress induced by a very early cut-off of irrigation, leading to a final yield that, although moderate, was anyway greater than that obtained with an early suspension of irrigation at the flowering onset. This is consistent with the literature, where a greater impact of water stress during flowering than during the vegetative stage, on the fruit yield, mainly ascribable to floral abortion, has been reported on tomatoes [
1,
6]. However, irrigation limited to the flowering period was not as beneficial to the tomato crop as expected, especially when irrigation was applied at the highest rate (100%). Indeed, in FFL and DFL treatments, although the number of fruits measured at 60 DAT was even higher than that of the D treatment, the final yield was significantly lower. In particular, in FFL, yield losses (55%) were greater than water saving (48%) (low IWUE). Studies evidenced how, in tomatoes, the water deficit at any growth stage does not adversely affect the number of fruits produced but significantly reduces their single weight [
8,
14].
According to the literature [
4,
5,
14], the IWUE was positively affected by the water deficit. A high water productivity (IWUE >13 kg m
−3) corresponded to the plot with irrigation during the vegetative stage only (FE and DE). Similarly, da Silva et al. [
15] observed that the highest levels of water productivity in tomatoes occurring with a 50% irrigation replacement, and in relation to irrigation suspension, the longer the number of days without the irrigation before a harvest, the higher the water productivity. In the current study, yields in FE and DE were not economically sustainable (<16 t ha
−1). This fact highlights how irrigation for the whole season, even at reduced rates, is important to minimize fruit losses in processing tomatoes. Similar findings were reported for some cultivars of processing tomatoes cultivated under the same climatic conditions of Eastern Sicily [
3,
4,
29].
5. Conclusions
The results of the present study reveal how the irrigation limited to the vegetative stage or to flowering, at a full (100% ETc) or reduced rate (50% ETc), greatly influences the physiological behavior of tomato plants cultivated under a semi-arid environment. Leaf transpiration and stomatal conductance measured at early or mid-flowering, more than that measured later on, may be adopted as valuable indicators to predict the crop productivity. However, their accuracy may be altered under particular environmental conditions (i.e., a high vapor pressure deficit (VPD)), being strongly hindered even under unrestricted soil water conditions. In this sense, the predawn water potential, being little affected by the VPD, is more reliable than the leaf transpiration and stomatal conductance under these climatic conditions.
The results also confirm that, in tomatoes, irrigation for the whole season is important to maximize the fruit yield. However, a balance between the improved irrigation water use efficiency (IWUE) and satisfactory yield can be achieved through the adoption of a deficit irrigation strategy where a moderate water stress is induced by irrigation at a 50% ETc rate. Indeed, the adoption of irrigation strategies that optimize (reaching the most sustainable value), more than maximizing (reaching the overall maximum value) the IWUE, may contribute to making the crop more profitable. The flowering stage is confirmed as sensitive to drought stress; therefore, severe soil water deficits during this stage adversely affect crop productivity, leading to final low fruit yields. Indeed, yield losses were greater when the irrigation was suspended during flowering. Alternatively, in areas of dry summers where irrigation water is scarcely available, as that of the present experiment, irrigation could be omitted during the vegetative stage and limited (at a reduced rate, e.g., 50% ETc) to the flowering period, keeping in mind that water-saving is more or less proportional to yield losses.

 ,
, 


