Project Report

Technologies for Sustainable Biomass Supply—Overview of Market Offering

VTT Technical Research Centre of Finland Ltd., Tietotie 3, 02150 Espoo, Finland
Agronomy 2020, 10(6), 798; https://doi.org/10.3390/agronomy10060798
Submission received: 30 April 2020 / Revised: 28 May 2020 / Accepted: 2 June 2020 / Published: 4 June 2020
(This article belongs to the Special Issue Precision Agriculture for Sustainability)

Abstract

:
This article introduces a collection of Information and Communications Technologies (ICT), Internet of Things (IoT), and Industry 4.0 technologies utilized in (or applicable to) biomass supply chains that constitute the current state-of-the-art along with their brief descriptions. The scoping of technologies has been conducted by means of direct interactions with bioeconomy stakeholders and technology providers, analysis of the reports from bioeconomy-related projects, literature surveys, and internet searches. It is to highlight that technology mapping investigated here is focused on commercially available tools and services, which usually come with support, thus removing the necessity for expert knowledge or unusual technical proficiency. The list with over 100 items represents the current best knowledge of its creators and it is currently available through the ICT-BIOCHAIN project platform, serving as a database with technology descriptions and capability for updating the information. The ultimate objective of the database and the platform is to serve as a common point facilitating the cross-sectorial connection, where biomass stakeholders looking for new ICT, IoT, and Industry 4.0 solutions to make their work more efficient and sustainable can browse and filter out the records of their interest and obtain the contact information of the providers.

1. Introduction

With the rapidly growing human population (see Figure 1) as well as the awareness of its impact on natural resources, the sustainability of agricultural production and supply chains is of utmost importance. Biomaterials can replace fossil sources in a wide variety of chemical manufacturing (e.g., cosmetics, biofuels) [1], but the corresponding increase in demand for biomass cannot be satisfied by superseding food production with, e.g., cultivation of high-energy crops. Neither further deforestation to gain land for additional arable fields can be accepted. Therefore, the optimal use and value maximization of available bioresources throughout all stages of a supply chain from production until the end use (farming, preprocessing, storage, transportation, etc.) becomes critical. Fortunately, there are various technological solutions and services offering help or assistance. The aim of this work is to review technologies and tools available on the market, which can contribute to the increased sustainability of biomass supply chains.
There are tools designed for a specific stage in a value chain. For instance, monitoring of the field condition (soil humidity, pH, rainfalls, wind) [3,4], growth rate, or ripeness [5,6,7] can help farmers to maximize the production by, e.g., indicating a need for fertilization or an optimal time for harvesting. Local storage providers can monitor the water content of the biomass products in order to avoid unnecessary load for transportation, while at the same time preserving the desired parameters, and thus quality and value. In the case of agricultural production, storage temperature and humidity need continuous monitoring and control to maintain the high standards of the food chain [8]. Logistics providers can use location tracking to optimize their services through fleet management and efficient communication with customers. Meanwhile, other technologies can be applied throughout an entire supply chain. For example, identification labels and environment sensors (humidity, temperature) can be used at any stage, assuring the quality and safety of a given agro-product, while also boosting the reliability of storage or the logistics efficiency [9]. Yet another group consists of Information and Communications Technologies (ICT) tools such as online databases and platforms, which can be crucial in forming new supply chains and/or optimizing those already existing. For example, they may include mapping data of the available and potential bioresources [10], websites with specific knowledge or its providers [11], contact medium for stakeholders [12], and even online trading platforms [13,14].
It is easy to see that there are numerous opportunities within the biomass supply chains to take advantage of new technological solutions. With a growing bioeconomy market and its demands, increasing the adoption level of new technologies is essential for boosting the sustainability and efficiency.

2. Materials and Methods

The mapping of technologies and solutions introduced here has been performed within the ICT-BIOCHAIN project [15] with the intention to raise bioeconomy stakeholders’ awareness of available tools that can help their operations become more sustainable and profitable. The resulting database is searchable and has been publicly available since April 2020 through the project website at https://ictbiochain.eu/platform/ict-solutions/.
The process started with the creation of a common data collection template (see Appendix A Figure A1) in order to ensure the descriptions were uniform regardless of their provenience. The format includes specific inputs, which can help the user to filter database search results by various criteria reflecting his interests and preferences, such as technology readiness level (TRL), year of deployment, or country of origin. Database entries also provide information on the current and possible future application within a biomass supply chain, selected technical aspects, and benefits including the overall environmental impact. Cost estimates allow the potential users to assess the time and/or production scale needed to achieve a satisfactory return on investment. Contact information is given in order to enable collaboration between bioeconomy stakeholders and technology providers.
The scoping of technologies has been conducted by means of:
  • direct contacts with collaborators of the project partners, including bioeconomy stakeholders, technology developers, and providers of services;
  • analysis of the reports from various European and national projects related to bioeconomy or its technological advancements;
  • literature surveys;
  • internet search.
The inputs on technologies and solutions offered by companies come from the descriptions provided by the producers or are based on information from their websites. Tools and applications developed within research projects and not yet commercialized were described by their developers. In case there was no response from the contact person or the website was not available anymore, the corresponding solution was considered abandoned and excluded from this collection. Due to time and resource limitations of the project, the resulting database should be considered as an indicative snapshot in time. Therefore, the online platform will be equipped with a feedback channel, through which new entries and updates can be suggested.
The Section 3.1, Section 3.2, Section 3.3, Section 3.4 and Section 3.5 introduce examples of commercially available technologies selected to demonstrate the diversity of solutions and their applicability at different stages of a supply chain. Then, Section 3.6 presents a number of statistical classifications (by level of complexity, geographical origin, application area, TRL, and technological subsector) of all database entries performed using the following methods. TRL assessment was performed using definitions of the European Commission (EC) as specified in the Annex G of the EC’s “General Annexes to the Work Programme 2016/17” [16] presented in Table 1. If the technology developer or service provider specified TRL as a range, the upper value was used for statistics. In case the TRL was not available (e.g., description of a tool is based on its website), it was assessed so that commercially available tools and services were assigned TRL 9, whereas technologies not yet commercialized were marked as TRL not available (TRL N/A). Country entry is based on the location of the technology developer or service provider. In the case of companies offering their products internationally and having divisions in multiple countries, the location of headquarters is chosen. For research projects, the country of the developing institution is preferred if it is known; otherwise, the country of consortium leader is used. The scoping work provided technologies of different types and complexity. Basic technologies are the fundamental building blocks usually combined with other techniques to form a complete solution. They provide functionality of a single type. For instance, it can be sensing (temperature, moisture, etc.), wireless communications (cellular networks [17], WiFi [18], Bluetooth [19], LoRa [20], etc.), positioning and tracking using global navigation satellite systems (GNSS) such as GPS [21], identification (barcodes, radio frequency identification (RFID) [22,23]), or security (blockchain and various encryption codes). Complex solutions involve more than one basic technology (e.g., sensing and communications and data analysis and visualisation) and are typical for commercial offerings. A separate class of tools are online platforms and databases, which include trading platforms, discussion panels, thematic information portals, as well as databases of available resources or stakeholders’ contact information. Finally, the solutions can be classified by technological subsector into three groups:
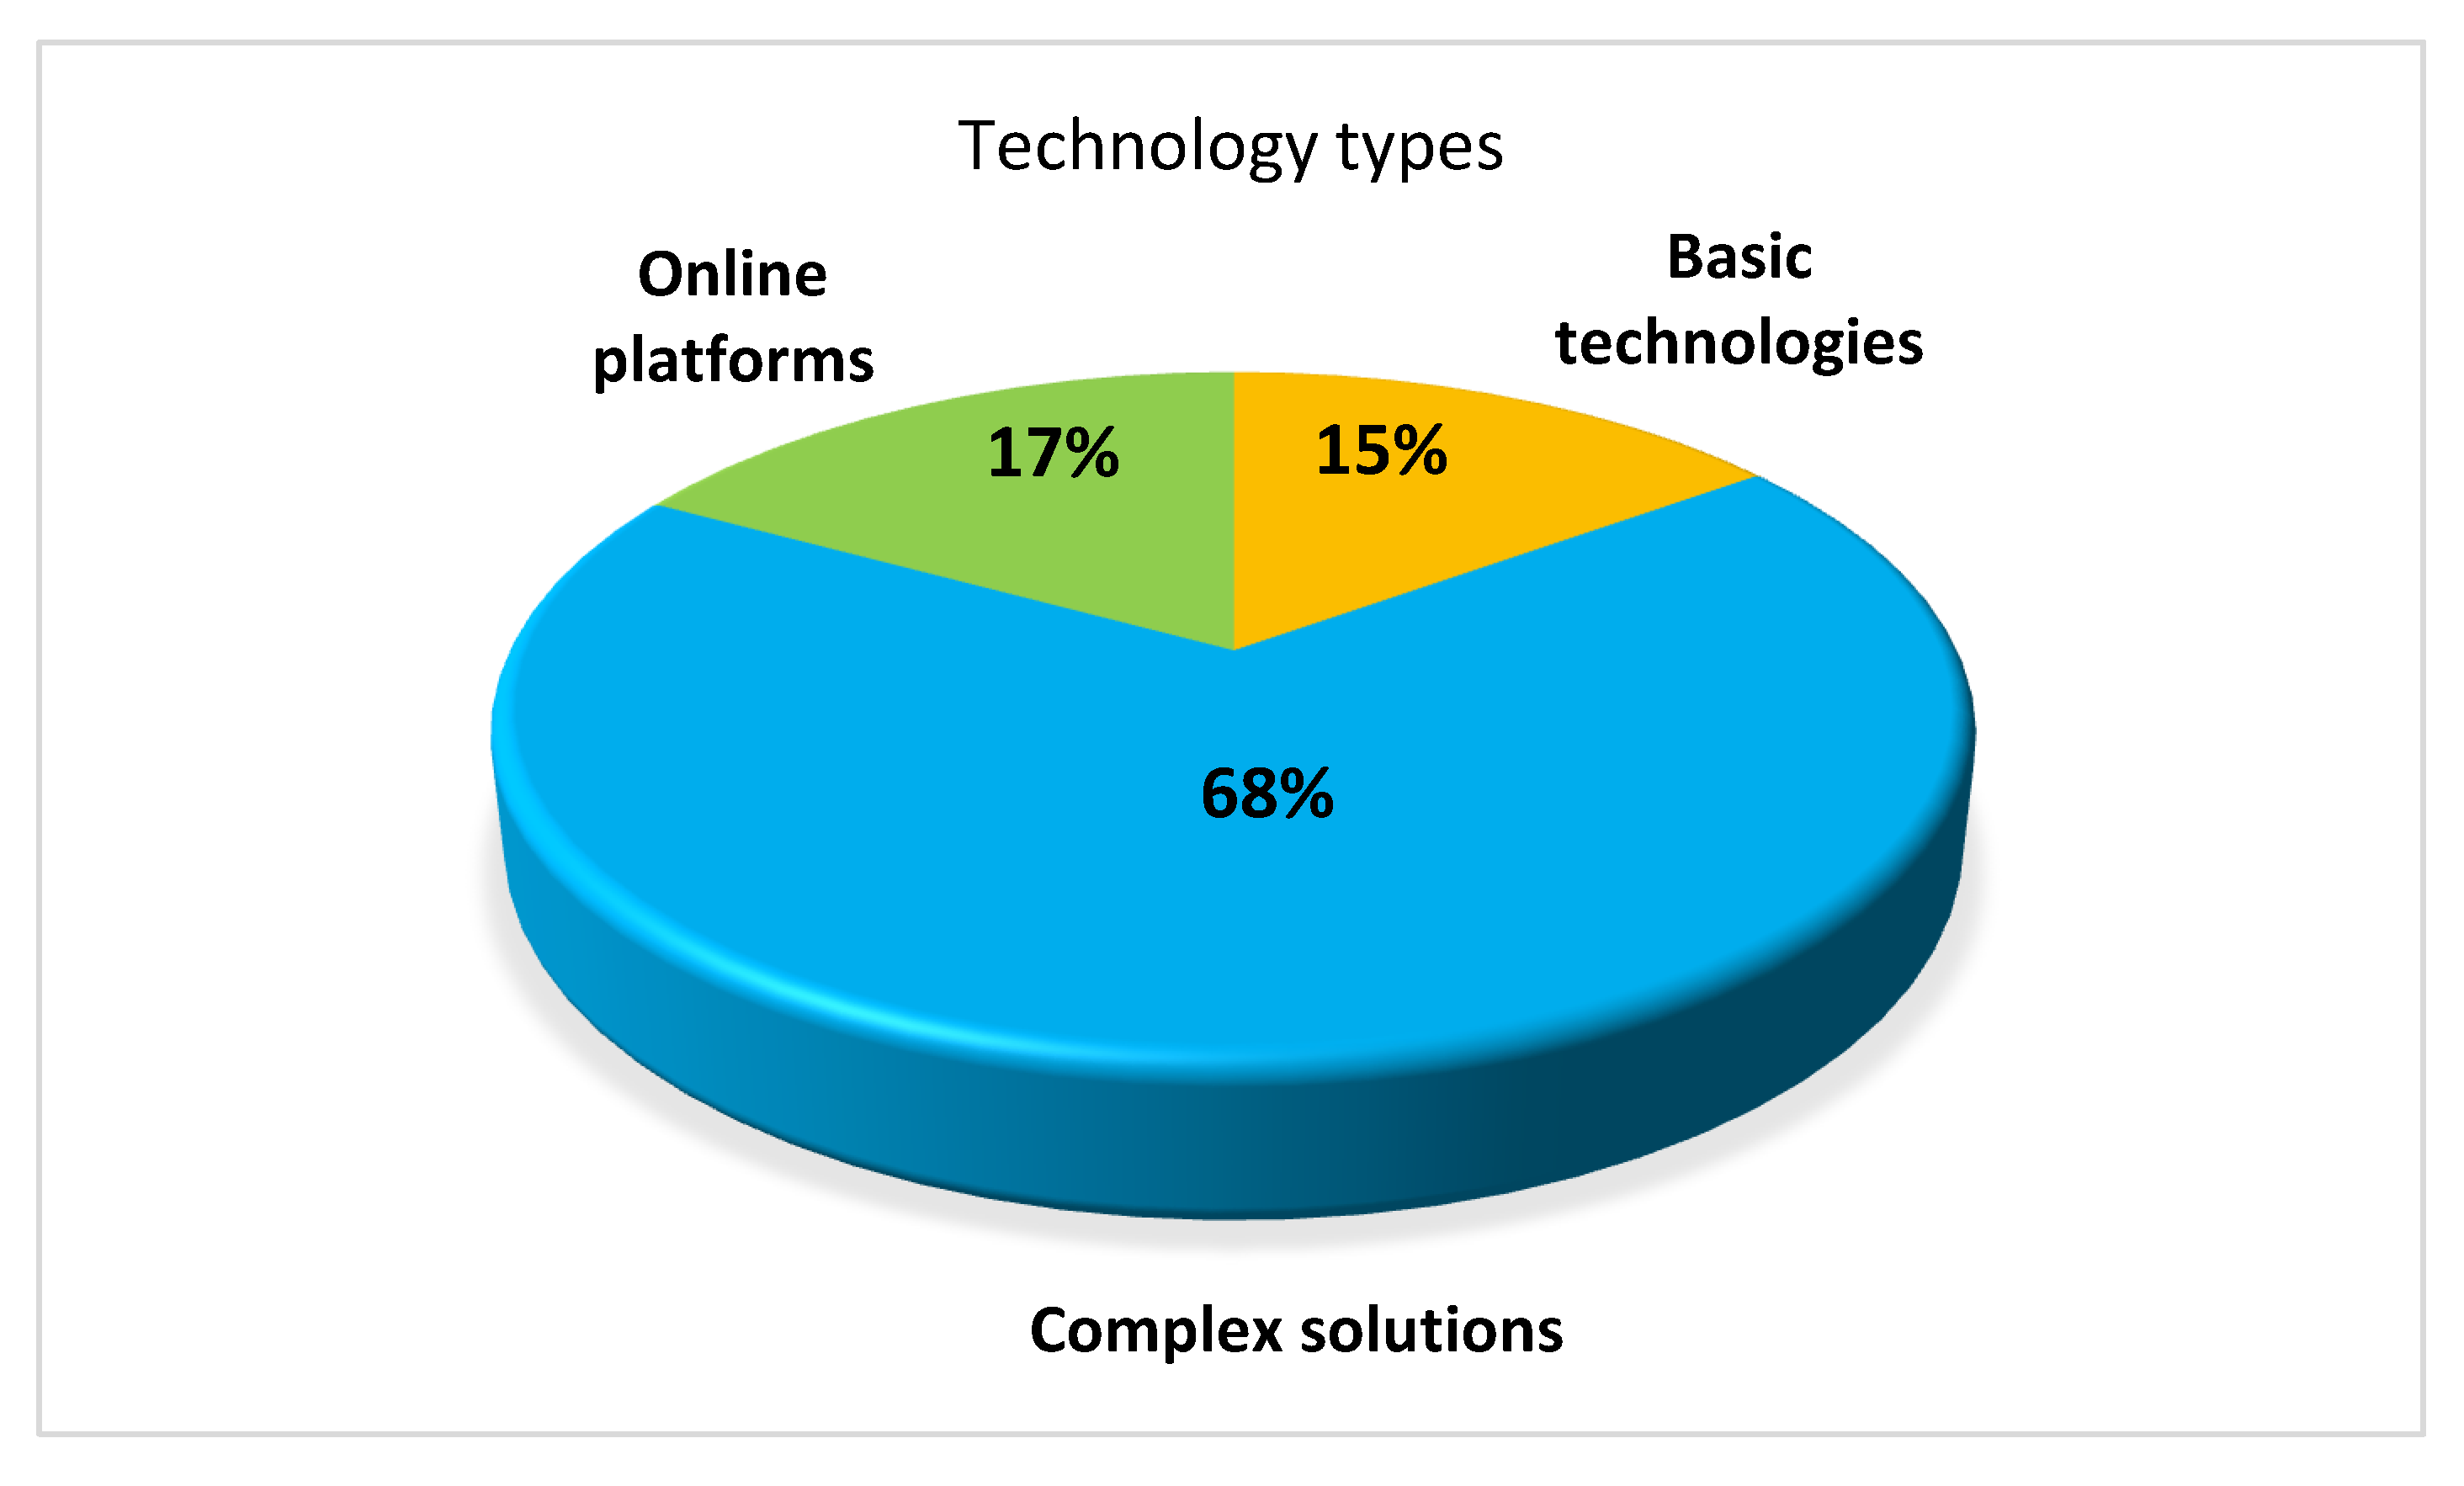
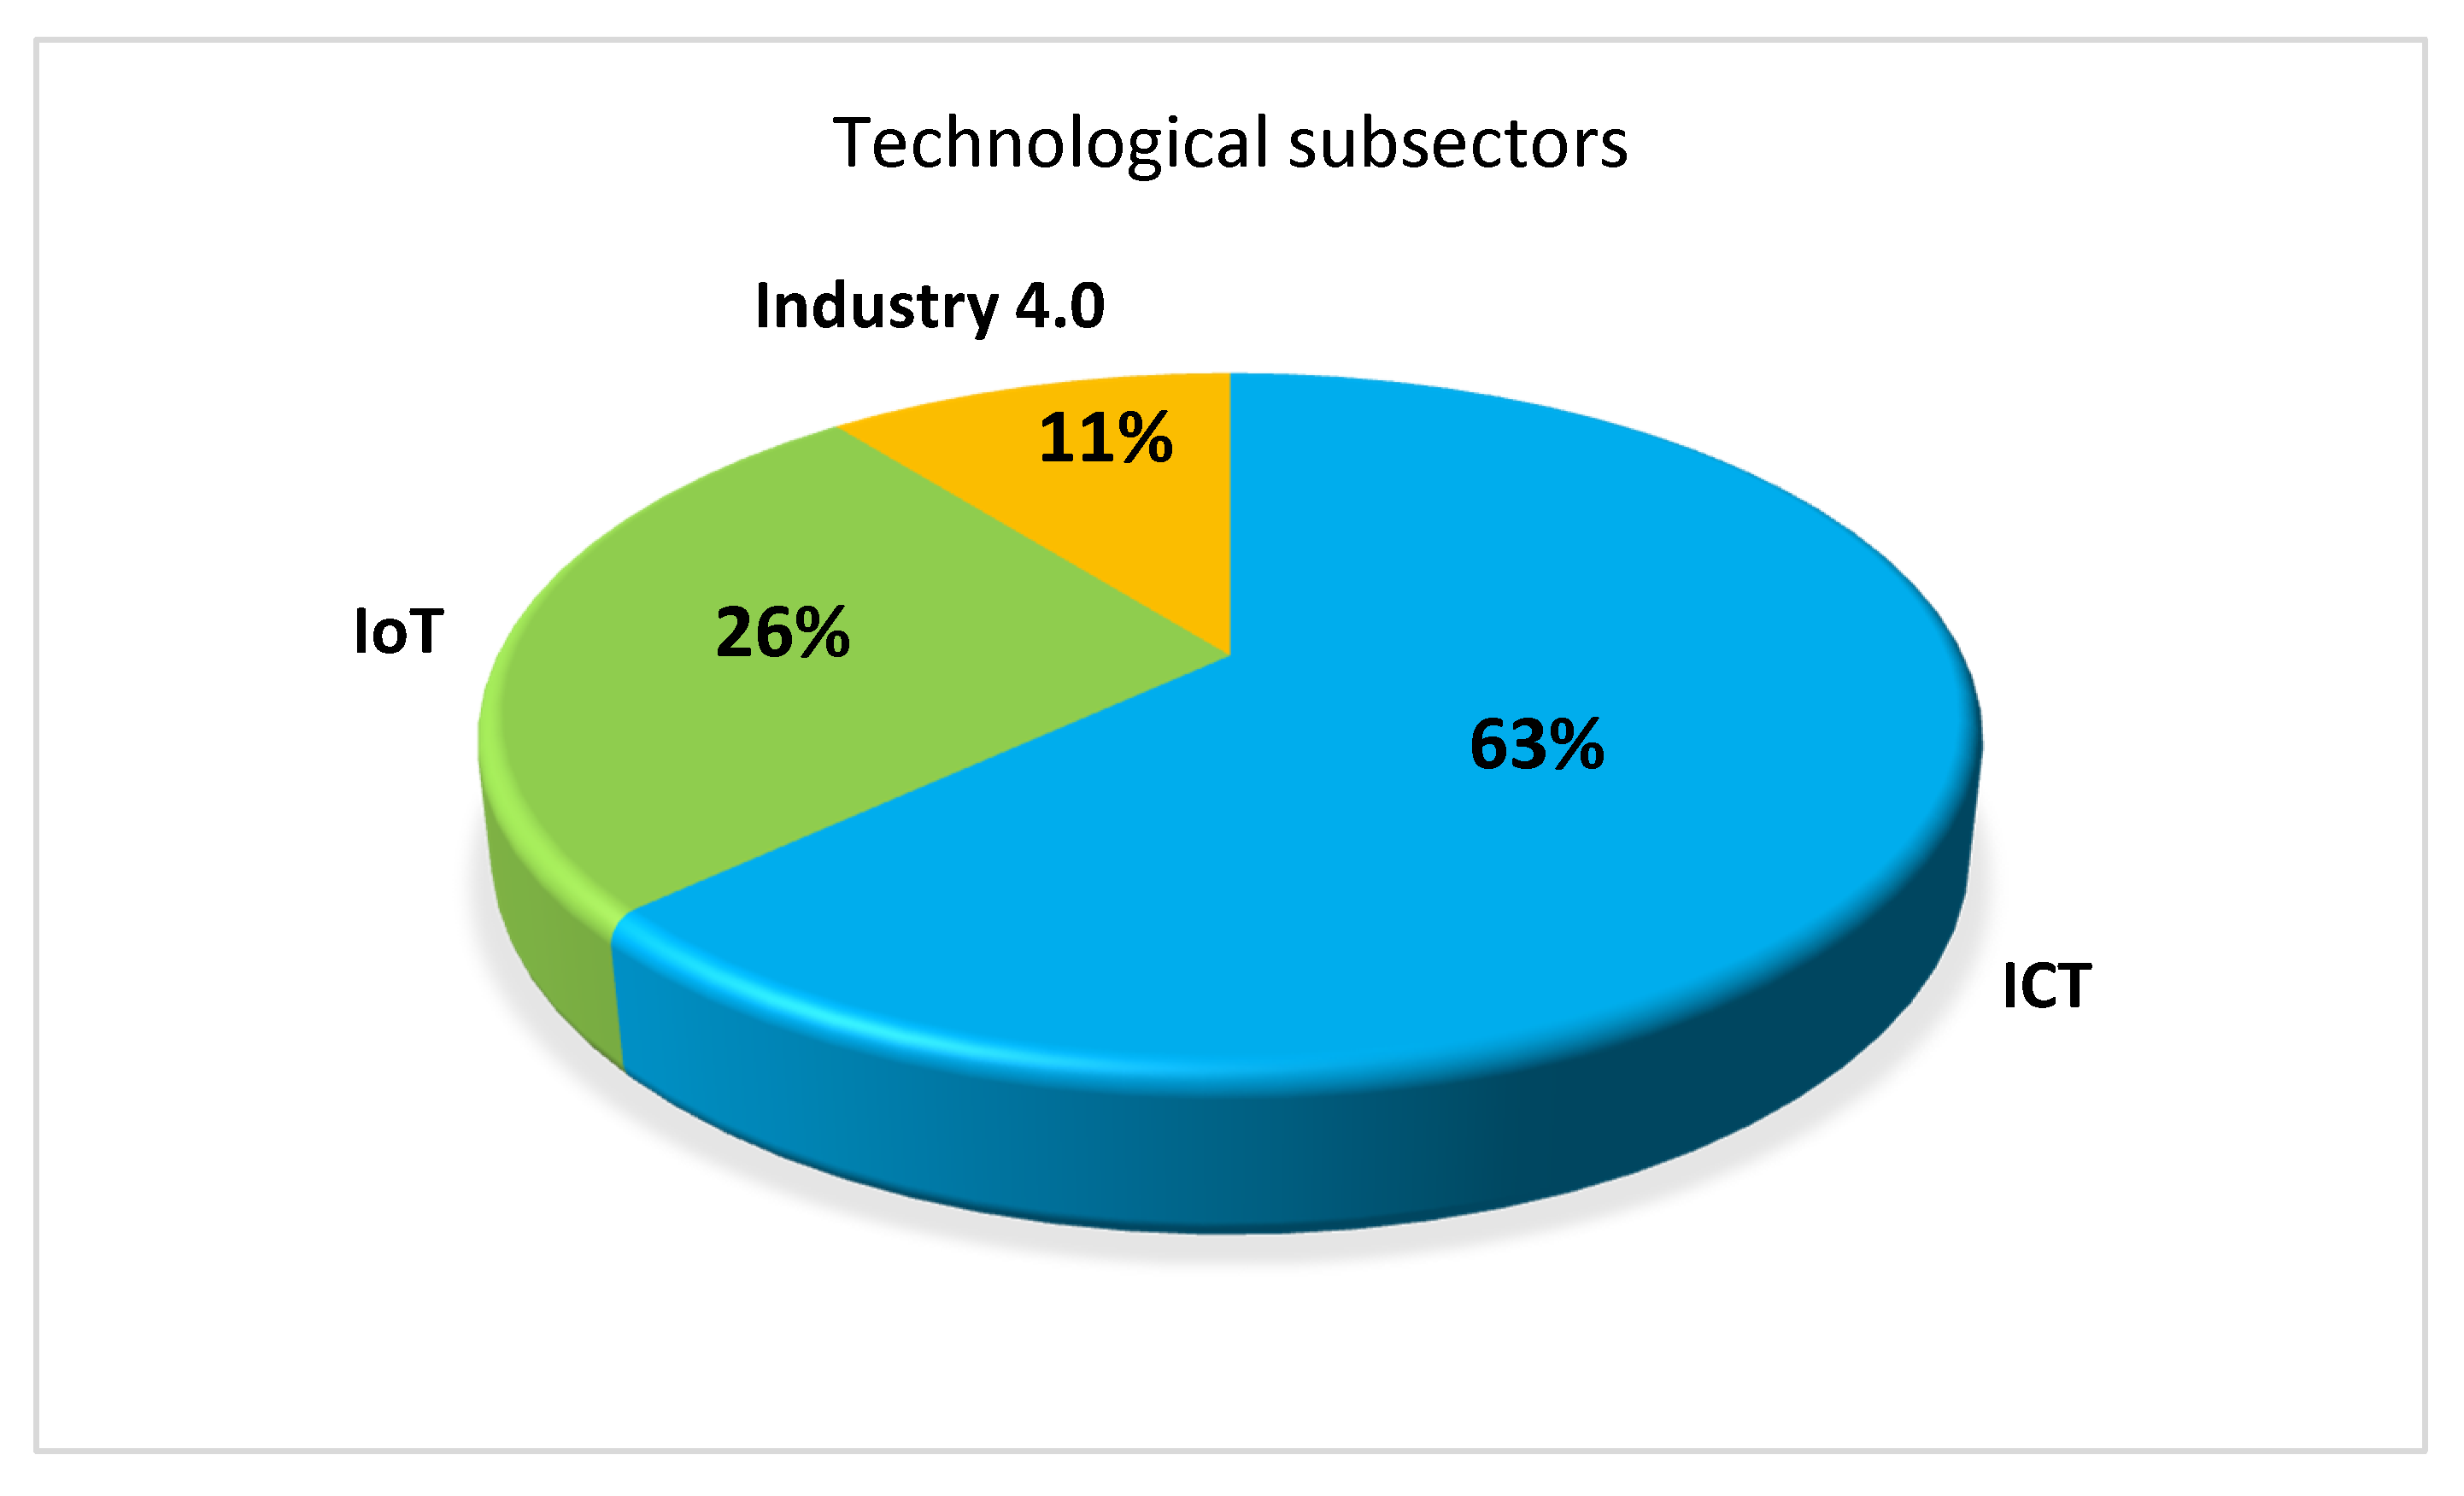
  • Information and Communications Technologies (ICT) include software, models, databases, and online platforms;
  • Internet of Things (IoT) tools additionally include sensors, measurement data collection, analysis and visualization;
  • Industry 4.0 solutions are even more complex. In addition to sensory data collection and analysis, they include feedback path to the system, providing it with an intelligent automation of processes.

3. Results

Over 100 technologies and tools, which are already being used within biomass value chains or have a significant potential to be applied to them, have been identified during the scoping work. The following subsections present examples of technological solutions applicable to various stages of a value chain. However, it should be noted that this division is somewhat artificial as some technologies and tools can be applied at multiple stages.

3.1. Tools for Precision Farming

Data analysis and management tools have potential to maximize the production, both in amounts and quality, within the available resources. The management tools used for decades in other industries, known as enterprise resource planning (ERP), are adapted specifically to agricultural production. One example is ERPagro [24], which integrates multiple aspects of farming at the stages of preharvesting (production planning, crop programming, seedbed management, field reports, fertilization planning, supply warehouses), postharvesting (control of production, marketing, sales and dispatch management, accounting, traceability and food safety), and business management (analytical tools, business intelligence, scorecards, custom reports). Similarly, WinforstPro toolset [25], designed specifically for forestry, integrates wood management, logistics, customer administration, contract management, and geographic information system (GIS). Some tools focus on analytical predictions of production output, development of pests, and market evolution in order to help make better decisions in advance, and thus maximize the profitability and sustainability of the production. For instance, tools such as Olivia [26], Solania [27], and Berria [28] rely on machine learning algorithm to make predictions.
There are also specific sensor tools, which provide the analytical systems with information on the state of the field and crops. These can either rely on ground-based probes or use unmanned aerial vehicle (UAV) [29] equipped with hyperspectral cameras [30], or laser scanners [31] for field monitoring, and GPS receiver for mapping the outcome to a precise location. An example of the first group is ag-weather station from Sencrop [32], which can monitor rainfalls, temperature, humidity, wind, and leaf wetness in remote fields. Wirelessly transferred data help the user make better decisions concerning pesticides, seeding, or irrigation without the necessity for frequent visits to the fields. In the second group, Sacrops [33] relies on hyperspectral imaging for early detection of plagues and diseases (minimizing losses by timely and localized use of phytosanitary products) as well as for determination of fruit maturity level (indicating optimal harvesting time).

3.2. Tools for Storage and Logistics

At the stages of storage and logistics, two main groups of tools are in use, namely:
  • those for assuring proper storing conditions by monitoring parameters of the environment and of the produce itself;
  • those related to identification and tracking.
Haytech [34] is a good example of solutions from the first group. It is designed for remote and continuous monitoring of the hay temperature. Fermentation is inevitable for fresh hay. It leads to a quality degradation and even spontaneous combustion. Robust sword-shaped probes are easy to insert into square or round bales. The measurements data is wirelessly transferred to a custom base station, which sends it to the cloud for storage or remote inspection. Application provided with the system allows setting temperature threshold levels, at which it sends an automatic alert via a text message (SMS). Since each probe has a unique code, the problematic spot can easily be identified. In this way, a spontaneous fire or quality deterioration can be prevented, or in the case of loose hay storage, the use of hay dryer and thus energy costs can be optimized. With certain modifications to the probe construction, similar systems can also be used for grains [35] and other types of biomass, such as peat, woodchips, and waste [36].
Another group of technologies is dedicated to identification and tracking. Products can be tagged using barcodes or two-dimensional derivatives such as quick response (QR) codes. Each code can have assigned certain information, such as harvesting/packaging place and time. Depending on the type of product, the markings can be printed directly on items or packages or attached as a sticker or a reusable tag. A big advantage of these systems is that a smartphone or a tablet using its onboard camera can serve as a reader. Numerous alternative applications for code generation and reading, including freely distributed, are available. Another approach is the radio frequency identification (RFID), in which the tags are usually in the form of a sticker with a tiny electronic chip and printed antenna used for both communications and energy harvesting from the reader’s signal. Such tags can also be equipped with simple sensors, e.g., for periodical temperature measurements. The advantage is that RFID does not require direct line of sight between the reader and the tag, and multiple tags can be read simultaneously at gates. However, dedicated readers are needed [22]. Modules of ERP systems can combine the inputs from the reader and mobile device’s GPS receiver and clock for registering and tracking of item’s geolocation and logistic events.
Different user needs drive the solution providers’ offerings. Specific operation environment may impose new challenges that need to be overcome before the technology can be applied. For instance, Signumat tagging system [37], developed for forestry, consists of plastic tags (based on numbers, text, barcodes, QR codes, or RFID), as well as a dedicated fast-application tool. A special hammer with reloadable automatic tags magazine allows for single blow attachment of the tag. In this way, each log can quickly be labeled right at the site of harvest with minimal labor effort, assuring its traceability from the very beginning.
In logistics, fleet management plays a very important role. It allows for monitoring parameters related to ownership (vehicle descriptions, leasing contracts, status) and usage (maintenance schedules, fuel consumption). Some systems additionally equip vehicles with GPS receivers for real-time tracking and route optimization. Multiple solutions exist on the market, either as a part of an ERP system or a standalone tool, including applications available at no cost, e.g., Odoo Fleet [38].

3.3. Quality Control

The quality control might be applied at various and multiple stages within the value chain. In this way, it is possible to assess its weak link, i.e., the point at which the product quality becomes deteriorated. Alternatively, an analysis of the biomass quality (e.g., moisture level, energetic value, nutrition content, etc.) helps to optimize business decisions (buy, sell, store, preprocess) and to achieve the price that reflects the real value. Examples of such tools include GrainSense [39] and Celignis rapid biomass analysis [40]. GrainSense applies near-infrared spectroscopy (NIRS) to quickly analyze protein, moisture, carbohydrates, and oil contents from crops. A handheld device paired via Bluetooth with a mobile app on user’s smartphone needs about a teaspoon of kernels and provides the results within seconds directly in the field. The test outcomes appended with phone’s location information can be saved in the cloud for archiving and further inspection. Currently, it operates on wheat, barely, and rapeseeds, while rye and oat are supported only in selected countries. Celignis also uses NIRS for the rapid analysis of wide variety of biomass. The feedstock includes energy crops, agricultural residues and wastes, industrial residues and wastes, municipal wastes, and biorefinery products. The one-day turnaround process consists of grinding, NIRS scanning, modelling, and analysis. Proprietary models are developed for each type of biomass assuring the NIRS analysis closely corresponds to outcomes of labor-, time-, and cost intensive wet-chemistry. Determined analytes include sugars, lignin and extractives, as well as thermal properties (ashes). Despite the same underlying basic technology (NIRS), these are significantly different solutions, targeted at diverse markets.
Quality control based on continuous monitoring of environmental conditions may provide means to assure the process or product complies with applicable regulations. For instance, Quanturi wireless compost temperature monitoring system [41] provides real-time and continuous temperature monitoring to optimize the transformation process of biowaste into compost. It includes a set of durable probes that wirelessly transfer the temperature information to a custom base station, which sends collected data to the cloud for monitoring and analysis with either computer or mobile app. The temperature history gives a complete view of the composting process from fermentation to curing and maturation without a need for tedious and risky (dangerous fumes) manual measurements and documentation. The generated reports are a guarantee for sanitary authorities and customers that compost has been produced in compliance with the regulations in effect.

3.4. Markets and Trading Platforms

There are plenty of regional online market platforms dedicated to either timber or agricultural products. For instance, administrations of national forests have typically their own dedicated platforms for timber auctions (e.g., Ref. [42,43]). Other platforms, such as Ositrade [44] and Agri Marketplace [45], are focused on agricultural produce and target at international implementations. They cover the complete value chain from farm to fork, providing price transparency (bidding), traceability, automated contracts, and documentation secured by blockchain technology. Another group of trading platforms is focused on the renewable energy sources (e.g., wood chips, pellets, or peat) [46,47,48], sometimes combining trade with information on market, legal aspects, and bioenergy-related tools and service providers [49].

3.5. Online Databases and Other Tools

The importance of information for achieving sustainability cannot be stressed enough. It helps planning and decision-making. In addition to various sensory systems described in the previous sections, useful data can also come from online newsfeeds, databases, models, and statistical reports. Eurostat [50] provides pan-European statistics at national level for all members of European Union, regarding various aspects of economy (production, trade, utilization) divided into themes such as agriculture, fishery, forestry, transport, and waste. It is a reliable source of current and historical data.
For investments in sectors relying on biomass, such as chemical or bioenergy production, it is crucial to know the amount and composition of the available resources. The Scottish Bioresource Mapping Tool [51] is a unique approach to map and model the bioresources arising every year. It provides knowledge of available biomass with its type and geographic breakdown for modelling the existing and potential new supply chains, in order to support biorefinery investments and efficient biomass utilization. Although it was originally developed for Scotland, the tool has successfully been applied to map biomass arising in the regions of South-East Ireland and Andalusia, Spain, within the ICT-BIOCHAIN project. Increased efficiency, reduced costs, and thus improved sustainability are the objectives of the MooV service [52] dedicated to optimization of supply chains. It finds the best configuration (locations of distribution centers, opening new or merging the existing production sites, combination of different transport modes) that meets the specific requirements of the client’s business.

3.6. Statistical Analysis of the Database Entries

Various classifications of the database entries are possible. The following charts present statistical insights on the technologies, tools, and services identified within the ICT-BIOCHAIN project. For instance, different levels of complexity are represented in the database. Figure 2 shows the proportions between the groups of basic technologies, complex solutions, and online platforms.
Figure 3 shows the geographical span of the technological solutions. It is worth noting that most of the basic technologies, such as cellular communications, are available through multiple providers in each country. Therefore, these cases were simply grouped and labeled as “Worldwide” in the chart. Countries of the project consortium partners might seem overrepresented. That is due to the method used in the survey, where direct contact with local stakeholders provided significant number of inputs. Moreover, high scores of Austria, Italy, and Spain are due to the fact that certain companies offer a wide palette of tools and solutions, quickly adding to the statistics.
Another interesting classification comes from division by area of application, presented in Figure 4. Different sectors of economy are represented. Forestry was traditionally a dominant source of biomass, and thus the number of solutions associated with this area is the largest. However, development of technologies for precision agriculture is a rapidly growing sector. The “Other” group includes all those solutions that are:
  • applicable throughout the whole chain;
  • used with other types of biomass (e.g., sludge);
  • used in multiple sectors;
  • not yet applied to biomass but indicating a potential for such use.
Distribution of tools according to their technology readiness level, shown in Figure 5, reflects the objectives of the search. The project targeted at maximizing the potential benefits to the stakeholders, and thus focused mainly on tools and services readily available on the market. The lack of solutions with TRL 8 is mainly due to the classification methodology, where items with TRL in the range of 7–9 were assigned to the group of TRL 9.
Figure 6 presents the distribution of the findings among the ICT, IoT, and Industry 4.0 subsectors. The overwhelming dominance of ICT is not surprising since it is the most agile sector. Software tools can relatively easily be adapted to different markets, since usually there are less constraints of physical instrumentation than, e.g., in IoT systems. Industry 4.0 solutions, on the other hand, are quite often tightly related to a certain process and an application site, and thus call for customized implementations.

4. Discussion

Sustainability concerns have led to a development of a wide variety of technologies targeting at improving efficiency of biomass supply chains from precision farming through to intelligent storage and logistics through to optimal exploitation by the end user. As this study shows, many solutions are mature and are offered commercially with customer support. So, why are the implementations still rather limited?
Among the objectives of the ICT-BIOCHAIN project was the establishment of two digital innovation hubs (DIHs) [53] in South-East Ireland and in Andalusia, Spain. During the DIH launching events, workshops for stakeholders were organized to probe the level of technological solutions applied as well as barriers for adoption process of new tools. The most commonly pointed out obstacles belonged to three groups:
  • economical—high cost, unknown cost/benefit ratio, limited access to financing, granularity of production and lack of scale;
  • cultural—difficulty understanding each other (different vocabularies), lack of trust, reluctance to changes in traditional processes, need for proven business cases in similar applications;
  • technical—low awareness of available solutions, lack of technical expertise, lack of assistance, need for user training, need for customized solution, technologies too quickly becoming outdated.
These answers indicate that new technologies are often perceived as expensive and complicated, requiring a specific skillset and substantial financial resources. However, novel tools and services are generally user-friendly, and their providers are ready to assist the customer also after the implementation phase. The solutions are often affordable and offers can be trimmed to match different needs and scales of operation. Moreover, implementations should be seen as an investment rather than an expense, since the benefits outweigh the costs. Therefore, DIHs should take an active role in raising the awareness by demystifying the technologies and bridging the gap between developers and biomass stakeholders by providing cross-sectoral networking opportunities, helping them to find suitable business partners, cooperation models, funding instruments, and legal assistance.

5. Conclusions

Growing awareness of environmental impact caused by human activity, both locally and at a global scale, spurred a trend of replacing fossil sources with renewable bio-based materials [1]. This in turn drives increased demand for biomass, which makes the efficiency and sustainability of an entire biomass value chain a prime objective. In order to help farmers and other stakeholders, numerous tools and services have been developed for agricultural production, storage, and logistics, often by adapting technologies already used in other economy sectors. The presented examples indicate the diversity of available tools with potential to boost the sustainability of bioeconomy. However, agriculture has been a rather traditional and conservative sector, and thus raising the awareness of available hi-tech solutions and lowering the barrier to their adoption is of utmost importance. Independent institutions such as European Digital Innovation Hubs can play a crucial role in bridging bioeconomy stakeholders and technology providers by boosting their mutual understanding and providing support in forming cross-sectorial cooperation.

Funding

This project has received funding from the Bio-Based Industries Joint Undertaking under the European Union’s Horizon 2020 research and innovation program under grant agreement No 792221.

Acknowledgments

The author would like to acknowledge the support from all project partners: Consejería de Agricultura, Ganadería, Pesca y Desarrollo Sostenible, Institute of Technology, Tralee, Fundación Corporación Tecnológica de Andalucía, Fraunhofer gesellschaft zur foerderung der angewandten forschung E.V., Industrial Biotechnology Innovation Centre (“IBioIC”)—University of Strathclyde, Sustainable Innovations Europe S.L, and Irish Bioeconomy Foundation. Especially, James Gaffey, Pat Doody, Marta Macias Aragonés, Gloria de la Viña Nieto, Regina Demtschenko, and Johan Belfrage, are acknowledged for their contribution to development of the template used for data collection and their help in scoping of the technologies available in various parts of Europe. Additionally, the author would like to thank Maria Natividad Pérez-Camacho and Ana Martinez for their contribution to the quality improvement of the article.

Conflicts of Interest

The author declares no conflict of interest.

Appendix A

Figure A1. Template used to collect information about the ICT, IoT, and Industry 4.0 technologies, tools, and solutions for biomass supply chains.
Agronomy 10 00798 g0a1

References

  1. USDA. Foreign Agricultural Service. In EU Bio-Based Economy and Its Inputs; USDA Foreign Agricultural Service: Washington, DC, USA, 2015. [Google Scholar]
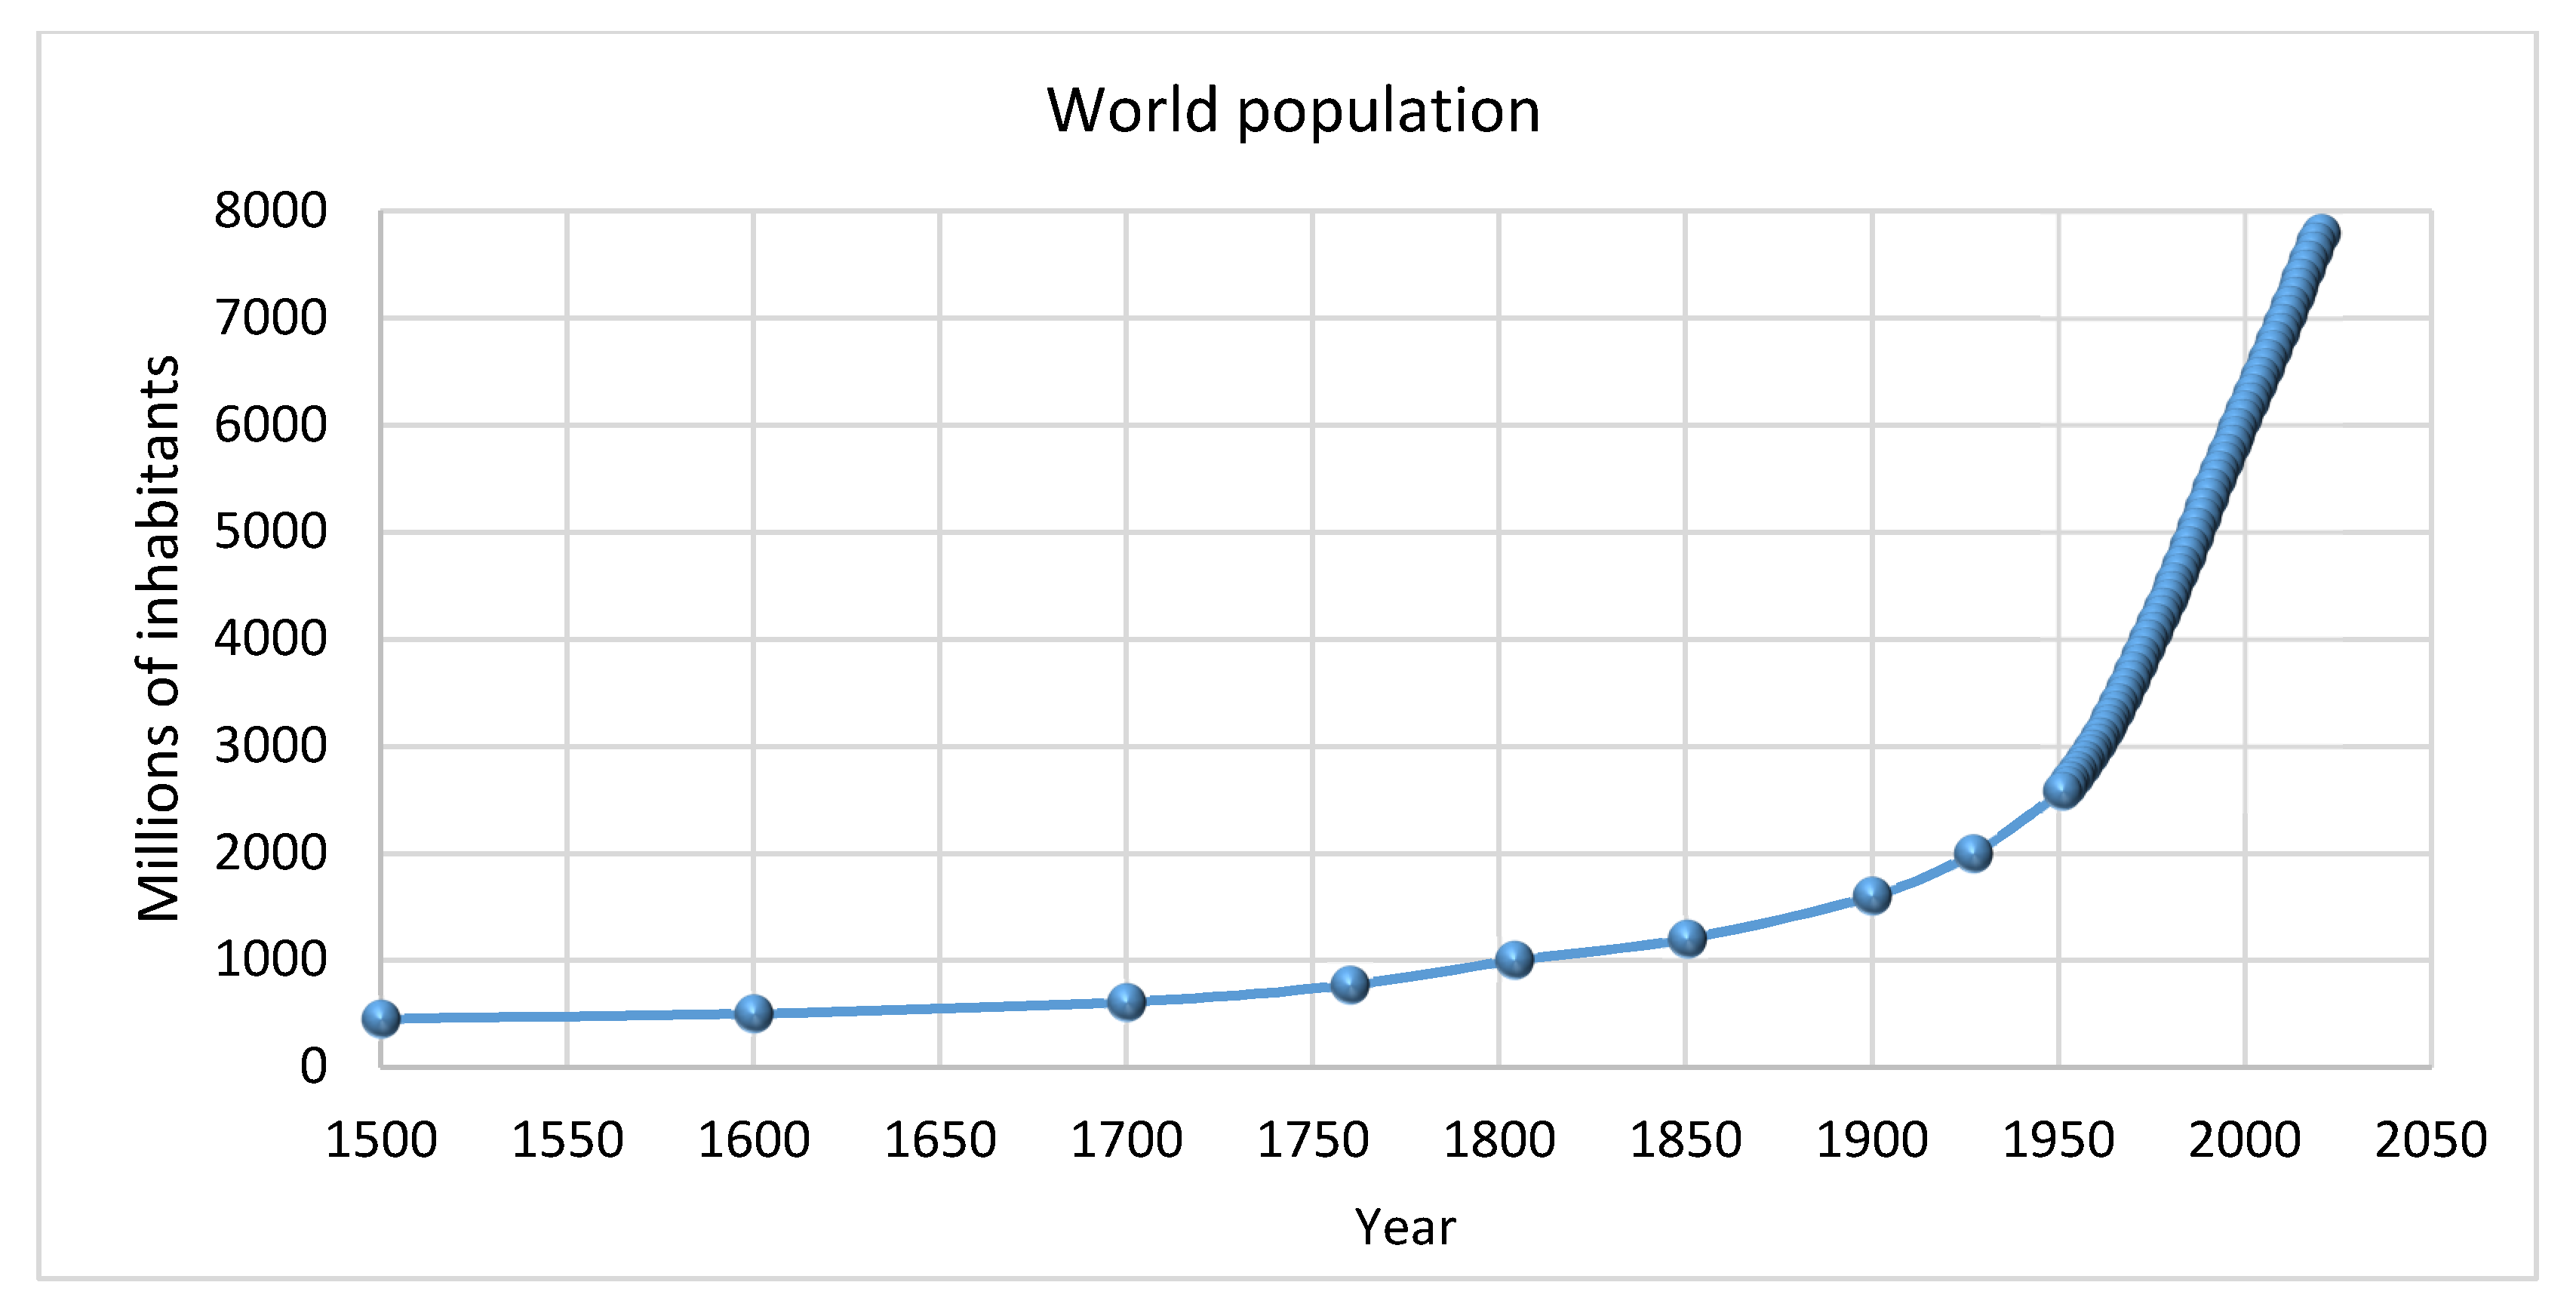
  2. World Population by Year. Available online: https://www.worldometers.info/world-population/world-population-by-year/ (accessed on 6 April 2020).
  3. Maresma, Á.; Lloveras, J.; Martínez-Casasnovas, J.A. Use of Multispectral Airborne Images to Improve In-Season Nitrogen Management, Predict Grain Yield and Estimate Economic Return of Maize in Irrigated High Yielding Environments. Remote Sens. 2018, 10, 543. [Google Scholar] [CrossRef] [Green Version]
  4. Bhatnagar, V.; Chandra, R. IoT-Based Soil Health Monitoring and Recommendation System. In Internet of Things and Analytics for Agriculture; Pattnaik, P., Kumar, R., Pal, S., Eds.; Springer: Singapore, 2020; Volume 2, pp. 1–21. [Google Scholar]
  5. Méndez, V.; Pérez-Romero, A.; Sola-Guirado, R.; Miranda-Fuentes, A.; Manzano-Agugliaro, F.; Zapata-Sierra, A.; Rodríguez-Lizana, A. In-Field Estimation of Orange Number and Size by 3D Laser Scanning. Agronomy 2019, 9, 885. [Google Scholar] [CrossRef] [Green Version]
  6. Sabzi, S.; Abbaspour-Gilandeh, Y.; García-Mateos, G.; Ruiz-Canales, A.; Molina-Martínez, J.M.; Arribas, J.I. An Automatic Non-Destructive Method for the Classification of the Ripeness Stage of Red Delicious Apples in Orchards Using Aerial Video. Agronomy 2019, 9, 84. [Google Scholar] [CrossRef] [Green Version]
  7. Fernández-Espinosa, A.J. Combining PLS regression with portable NIR spectroscopy to on-line monitor quality parameters in intact olives for determining optimal harvesting time. Talanta 2016, 148, 216–228. [Google Scholar] [CrossRef] [PubMed]
  8. Labs, W. Automated temperature monitoring and control ensure food safety. Food Eng. 2017, 1279, 96675. [Google Scholar]
  9. Fusco, R. Avoiding the danger zone with temperature monitoring. Food Qual. Saf. 2018, 25, 42–43. [Google Scholar]
  10. Biomass Supply (Europe). Available online: https://s2biom.wenr.wur.nl/web/guest/biomass-supply (accessed on 23 May 2020).
  11. Biomass. Available online: https://ec.europa.eu/knowledge4policy/glossary/biomass_en (accessed on 23 May 2020).
  12. Bioenergy Europe. Available online: https://bioenergyeurope.org/ (accessed on 23 May 2020).
  13. BiomassTrade. Available online: https://www.biomass-trade.eu/ (accessed on 23 May 2020).
  14. BioMasMarket. Available online: https://www.biomasmarket.com/ (accessed on 23 May 2020).
  15. ICT-BIOCHAIN Project. Available online: https://ictbiochain.eu/ (accessed on 30 April 2020).
  16. Annex G of the European Commission’s General Annexes to the Work Programme 2016/17. Available online: https://ec.europa.eu/research/participants/data/ref/h2020/other/wp/2016-2017/annexes/h2020-wp1617-annex-ga_en.pdf (accessed on 30 April 2020).
  17. What Is Cellular Communications: Mobile Technology. Available online: https://www.electronics-notes.com/articles/connectivity/cellular-mobile-phone/what-is-cellular-communications.php (accessed on 30 April 2020).
  18. What is WiFi: IEEE 802.11. Available online: https://www.electronics-notes.com/articles/connectivity/wifi-ieee-802-11/what-is-wifi.php (accessed on 30 April 2020).
  19. What is Bluetooth Technology: Basics & Overview. Available online: https://www.electronics-notes.com/articles/connectivity/bluetooth/what-is-bluetooth-technology-basics-summary.php (accessed on 30 April 2020).
  20. LoRa Wireless for M2M & IoT. Available online: https://www.electronics-notes.com/articles/connectivity/lora/what-is-lora-basics-m2m-iot.php (accessed on 30 April 2020).
  21. What is Satellite Navigation SatNav, GNSS. Available online: https://www.electronics-notes.com/articles/satellites/satellite-navigation-satnav/what-is-satnav-gnss-technology.php (accessed on 30 April 2020).
  22. What Is RFID: Radio Frequency Identification Technology. Available online: https://www.electronics-notes.com/articles/connectivity/rfid-radio-frequency-identification/what-is-rfid-technology-basics.php (accessed on 30 April 2020).
  23. Kelepouris, T.; Pramatari, K.; Doukidis, G. RFID-enabled traceability in the food supply chain. Ind. Manag. Data Syst. 2007, 107, 183–200. [Google Scholar] [CrossRef]
  24. ERPagro. Available online: https://www.hispatec.es/en/ (accessed on 30 April 2020).
  25. WinforstPro. Available online: https://www.latschbacher.com/en/winforstpro-enterprise-resource-planning/ (accessed on 30 April 2020).
  26. Olivia. Available online: https://www.ec2ce.com/olivia/ (accessed on 30 April 2020).
  27. Solania. Available online: https://www.ec2ce.com/solania/ (accessed on 30 April 2020).
  28. Berria. Available online: https://www.ec2ce.com/berriainfo/ (accessed on 30 April 2020).
  29. Tsouros, D.C.; Bibi, S.; Sarigiannidis, P.G. A Review on UAV-Based Applications for Precision Agriculture. Information 2019, 10, 349. [Google Scholar] [CrossRef] [Green Version]
  30. Adão, T.; Hruška, J.; Pádua, L.; Bessa, J.; Peres, E.; Morais, R.; Sousa, J.J. Hyperspectral Imaging: A Review on UAV-Based Sensors, Data Processing and Applications for Agriculture and Forestry. Remote Sens. 2017, 9, 1110. [Google Scholar] [CrossRef] [Green Version]
  31. Pérez-Ruiz, M.; Rallo, P.; Jiménez, M.R.; Garrido-Izard, M.; Suárez, M.P.; Casanova, L.; Valero, C.; Martínez-Guanter, J.; Morales-Sillero, A. Evaluation of Over-The-Row Harvester Damage in a Super-High-Density Olive Orchard Using On-Board Sensing Techniques. Sensors 2018, 18, 1242. [Google Scholar] [CrossRef] [PubMed] [Green Version]
  32. Ag-Weather Station. Available online: https://sencrop.com/en/ (accessed on 30 April 2020).
  33. Sacrops. Available online: http://www.soltel.es/en/sacrops/ (accessed on 30 April 2020).
  34. Haytech. Available online: https://quanturi.com/pages/haytech (accessed on 30 April 2020).
  35. Quanturi Grain Monitoring System. Available online: https://quanturi.com/pages/grain (accessed on 30 April 2020).
  36. Quanturi Temperature Monitoring System. Available online: https://quanturi.com/pages/other-industries (accessed on 30 April 2020).
  37. Signumat. Available online: https://www.latschbacher.com/en/tagging-technology/signumat-forestline/ (accessed on 30 April 2020).
  38. Odoo Fleet. Available online: https://www.odoo.com/page/fleet (accessed on 30 April 2020).
  39. GrainSense. Available online: https://www.grainsense.com/ (accessed on 30 April 2020).
  40. Celignis Analytical. Available online: https://www.celignis.com/NIRanalysis.php (accessed on 30 April 2020).
  41. Wireless Compost Temperature Monitoring. Available online: https://quanturi.com/pages/compost (accessed on 30 April 2020).
  42. Trading platform of Austrian Federal Forests. Available online: https://www.holzauktionen.at/ (accessed on 30 April 2020).
  43. Trading Platform of Polish State Forests. Available online: https://www.e-drewno.pl/stock/?lang=en (accessed on 30 April 2020).
  44. Ositrade. Available online: https://www.ositrade.fr/eng/index.html (accessed on 30 April 2020).
  45. Agri Marketplace. Available online: https://agrimp.com/ (accessed on 30 April 2020).
  46. BaltPool Biomass Exchange. Available online: https://www.baltpool.eu/en/ (accessed on 30 April 2020).
  47. BiomassPool Energy Biomass Exchange. Available online: https://biomasspool.com/ (accessed on 30 April 2020).
  48. Finbex Bioenergy Electronic Trading Platform. Available online: https://finbex.fi/ (accessed on 30 April 2020).
  49. E-Biomasa Trading Platform. Available online: http://www.ebiomasa.pl/gielda-biomasy (accessed on 30 April 2020).
  50. EUROSTAT. Available online: https://ec.europa.eu/eurostat/data/statistics-a-z/abc (accessed on 30 April 2020).
  51. Scottish Bioresource Mapping Tool. Available online: http://www.ibioic.com/what_we_do/scottish_bioresource_mapping_tool/d1142/ (accessed on 30 April 2020).
  52. MooV. Available online: https://vito.be/en/product/moov (accessed on 30 April 2020).
  53. Digital Innovation Hubs (DIHs) in Europe. Available online: https://ec.europa.eu/digital-single-market/en/digital-innovation-hubs (accessed on 26 April 2020).
Figure 1. Development of the world population over recent centuries. Plot based on the data from Worldometer’s “World Population by Year” [2].
Agronomy 10 00798 g001
Figure 2. Proportions between solutions of different types according to their level of complexity.
Agronomy 10 00798 g002
Figure 3. Number of identified technologies, tools, and services per country.
Agronomy 10 00798 g003
Figure 4. Number of identified technologies, tools, and services in different application sectors.
Agronomy 10 00798 g004
Figure 5. Number of technologies with different technology readiness level (TRL).
Agronomy 10 00798 g005
Figure 6. Proportions between solutions in different technological subsectors.
Agronomy 10 00798 g006
Table 1. European Commission’s classification and definitions of technology readiness levels (TRL).
LevelDefinition
TRL 1basic principles observed
TRL 2technology concept formulated
TRL 3experimental proof of concept
TRL 4technology validated in lab
TRL 5technology validated in relevant environment (industrially relevant environment in the case of key enabling technologies)
TRL 6technology demonstrated in relevant environment (industrially relevant environment in the case of key enabling technologies)
TRL 7system prototype demonstration in operational environment
TRL 8system complete and qualified
TRL 9actual system proven in operational environment (competitive manufacturing in the case of key enabling technologies; or in space)

