Article

Mapping Productivity and Essential Biophysical Parameters of Cultivated Tropical Grasslands from Sentinel-2 Imagery

by
Amparo Cisneros
1,*,
Peterson Fiorio
1,
Patricia Menezes
2,
Nieves Pasqualotto
3,
Shari Van Wittenberghe
3,
Gustavo Bayma
4 and
Sandra Furlan Nogueira
4
1
Biosystems Engineering Department, Luiz de Queiroz School of Agriculture, University of São Paulo, 13918–110 Piracicaba, SP, Brazil
2
Brazilian Agricultural Research Corporation (EMBRAPA), Embrapa Pecuária Sudeste, Washington Luiz, Km 234, Fazenda Canchim, 13560-970 São Carlos, SP, Brazil
3
Image Processing laboratory (IPL), University of Valencia, 46980 Valencia, Spain
4
Brazilian Agricultural Research Corporation (EMBRAPA), Embrapa Meio Ambiente, Rodovia SP-340, Km 127,5, Tanquinho Velho, 13918−110 Jaguariúna, SP, Brazil
*
Author to whom correspondence should be addressed.
Agronomy 2020, 10(5), 711; https://doi.org/10.3390/agronomy10050711
Submission received: 27 March 2020 / Revised: 8 May 2020 / Accepted: 12 May 2020 / Published: 15 May 2020
(This article belongs to the Special Issue Remote Sensing of Agricultural Monitoring)

Abstract

:
Nitrogen (N) is the main nutrient element that maintains productivity in forages; it is inextricably linked to dry matter increase and plant support capacity. In recent years, high spectral and spatial resolution remote sensors, e.g., the European Space Agency (ESA)’s Sentinel satellite missions, have become freely available for agricultural science, and have proven to be powerful monitoring tools. The use of vegetation indices has been essential for crop monitoring and biomass estimation models. The objective of this work is to test and demonstrate the applicability of different vegetation indices to estimate the biomass productivity, the foliar nitrogen content (FNC), the plant height and the leaf area index (LAI) of several tropical grasslands species submitted to different nitrogen (N) rates in an experimental area of São Paulo, Brazil. Field reflectance data of Panicum maximum and Urochloa brizantha species’ cultivars were taken and convoluted to the Sentinel-2 satellite bands. Subsequently, different vegetation indices (Normalized Difference Vegetation Index (NDI), Three Band Index (TBI), Difference light Height (DLH), Three Band Dall’Olmo (DO), and Normalized Area Over reflectance Curve (NAOC)) were tested for the experimental grassland areas, and composed of Urochloa decumbens and Urochloa brizantha grass species, which were sampled and destructively analyzed. Our results show the use of different relevant Sentinel-2 bands in the visible (VIS)–near infrared (NIR) regions for the estimation of the different biophysical parameters. The FNC obtained the best correlation for the TBI index combining blue, green and red bands with a determination coefficient (R2) of 0.38 and Root Mean Square Error (RMSE) of 3.4 g kg−1. The estimation of grassland productivity based on red-edge and NIR bands showed a R2 = 0.54 and a RMSE = 1800 kg ha−1. For the LAI, the best index was the NAOC (R2 = 0.57 and RMSE = 1.4 m2 m−2). High values of FNC, productivity and LAI based on different sets of Sentinel-2 bands were consistently obtained for areas under N fertilization.

1. Introduction

The increase in food demand and land use pressure has driven changes in Brazilian cattle production. In the period from 1950 to 2006, beef production increased about six times, making the country one of the world’s largest cattle producers [1]. Spatial mapping analysis of Brazilian pastures between 1985 (118 million ha) and 2017 (178 million ha) indicated that the greatest expansion of livestock occurred between 1985 and 2002. In this period an increase in Brazilian pasture areas of 57 million ha occurred, mostly in the northern region of the country and, to a lesser extent, in the Midwest. After 2002, the pasture area remained relatively stable, varying around 3 million ha by 2017 [2]. From the 2000s, adoption of new technologies by the producers led to an increase in productivity, which reflected in increases in the animal stocking rate of pastures and in the individual weight gain of the cattle [1]. According to De Alencar et al. [3], the main grass species cultivated for their high production potential are crops of the genera Pennisetum, Cynodon, Panicum, and Urochloa. The grasses of the genus Urochloa, as well as Panicum, are among the most used forage plants in animal production systems in Brazil [4].
In order to improve their productive capacity, the establishment of pasture management methodologies, and for ecological purposes, information on forage biomass growth dynamics in pastures is very important [5]. Thus, the study of methods that characterize the pasture environment is essential, because they enable improvement of the efficiency of forage use, offering more reliable answers in relation to the animal feeding and provide a better financial return to the producer.
Soil fertility and nutrient availability directly affect the plant growth and pasture productivity, and insufficient nutrient replacement is pointed out as one of the causes of pasture degradation in Brazil [6]. Nitrogen (N) is generally considered the main nutrient for maintaining productivity in forage, increasing the production of dry matter and, consequently, the pasture support capacity in animal unit by hectare (AU/ha) ([7] and [8]). More specifically, the positive influence of N on dry matter increase has been quantified by increases in (1) blade/thatch ratio, (2) crude protein content, and (3) leaf area index (LAI) for different tropical grassland types [3,9,10,11,12,13,14,15].
The estimation of forage mass in pastures can be performed through direct and indirect methods, but indirect methods have advantages over direct methods, since they do not require cutting the sampled forage biomass and allow evaluation over large areas [16]. Remote sensing methodologies provide an answer to the questions related to extensive tropical grassland management, allowing to estimate productivity in extensive pasture areas without in situ destructive sampling. Salimon et al. [17] state that the use of remote sensing facilitates the measurement of forage biomass through a contrast between different wavelengths and the other targets, besides presenting a low cost and being able to cover large areas in a short space of time. Spectral reflectance of canopy covers can provide a fast and non-destructive method for the evaluation of biophysical parameters, such as LAI, biomass, height, or N content in the plant.
Different ways of retrieving the LAI, biomass, plant height, or N biophysical information using satellite information have been proposed. As stated by Sudduth et al. [18], many of the algorithms used by the sensors use as input data spectral information from the canopy of plants in the form of vegetation indices, which generally involve the region of visible (VIS) and near infrared (NIR) [19], regions from 370 to 700 nm and from 780 to 1500 nm, respectively. The potential of vegetation indices to determine biophysical variables has been widely demonstrated in numerous studies: they are intuitive, simple, and fast [20,21,22]. According to Gnyp et al. [23], the use of vegetation indices is essential for crop monitoring during its development and for biomass estimation models, as input data. Studies with vegetation indices have emerged seeking to identify the best spectral bands to estimate biophysical parameters of specific crop types [24,25,26]. The reflectance of the canopy depends, hereby, on a complex interaction of several internal and external factors that can vary significantly in time and space, and also from one crop type to another [27]. Hence, the best way to find efficient and robust indices is to use large and diverse field datasets, with a variety of different treatments [28].
Foliar nitrogen content (FNC) is correlated with the leaf chlorophyll content, which has a strong spectral influence on the vegetation spectrum. Hence, chlorophyll-related absorption bands in the VIS region are often selected to obtain information of the N status or productivity at large spatial areas [29]. However, it is expected that the spectral response of the pastures will be directly influenced by the amount of N in the plant, allowing to observe the different amount of N remotely.
For agricultural monitoring by remote sensing, the spatial resolution should ideally be 20 m and, preferably, 10 m in order to make site-specific management possible [30]. A temporal resolution of less than a week would be required to follow-up acute changes in crop condition and provide timely response in management practices. In this context, Sentinel-2 is an Earth observation mission developed by ESA (European Space Agency) within the Copernicus program devoted to site-specific monitoring. Sentinel-2 is a constellation of satellites, Sentinel-2A and Sentinel-2B at the moment, launched by the ESA on 23 June 2015, and 7 March 2017, respectively. They occupy the same sun-synchronous orbit at an altitude ~786 km, but are separated by 180°. The Sentinel-2 satellites generate high-resolution spectral images and support the monitoring of vegetation within the different growth stages due to its wide bandwidth and high temporal frequency, 10 days at the equator with one satellite and 5 days with the 2 satellites under cloudless conditions, resulting in 2 to 3 days at mid-latitudes. Each Sentinel-2 satellite has an instrument/sensor (MSI) with a swath of 290 km. It provides a versatile set of 13 spectral bands from VIS, NIR, and shortwave-infrared (SWIR). Compared to other latest operative sensors, Sentinel-2 incorporates three new spectral bands in the red-edge region, which are centered at 705, 740, and 783 nm, providing essential information for the vegetation state analysis [31]. Hence, the Sentinel−2 mission offers enhanced opportunities for agricultural monitoring when compared to other multispectral operational missions, such as Landsat.
In this respect, the objective of this study is to test different vegetation indices, using hyperspectral field data resampled to the Sentinel-2 satellite spectral configuration, to estimate essential biophysical parameters (productivity, FNC, plant height and LAI) of tropical cultivated grasslands subject to different doses of N in the São Paulo region. With this, we aim to investigate the Sentinel-2 based application of vegetation indices for the productivity of grasslands, serving a large benefit for the animal production systems in Brazil. In addition, a recommendation for N fertilization will be made, based on the productivity data from different grasslands.

2. Materials and Methods

2.1. Experimental Field Area Set-Up and In Situ Measurements

The field experiments were conducted at the Escola Superior de Agricultura “Luiz de Queiroz” (ESALQ/USP), in Piracicaba, state of São Paulo, Brazil (22°42′15″ S, 47°37′23″ W, 546 m altitude). The soil of the area is classified as Eutric Nitosol [32]. The climate of the location is Cwa, according to the Köppen–Geiger classification, with hot summers and dry winters, with an average temperature below 18 °C in the coldest month and above 22 °C in the hottest month [33]. The plots were cultivated by drag seeding, with the grasses Panicum maximum cv. ‘Mombasa’ and Urochloa brizantha cv. ‘Marandu’ sown in early February 2016. The experimental area was composed of 16 Marandu plots and 16 Mombasa plots. Each plot had an area of 20 m2. Four N treatments were applied to both grass species and four repetitions per treatment (4 treatments/species × 4 plots/treatment). The treatments consisted of applying the doses of 0, 25, 50, and 75 kg N ha−1 on Mombasa and Marandu grassland (Figure 1 and Table 1). Fertilizations were performed with urea, containing a volume of 46% of N.
To control soil moisture without compromising the cultivation throughout the study cycle a sprinkler irrigation system was installed in the study site. In order to obtain structural differences within the canopy and to respect the ideal time of harvest, fixed harvest cuts each 21 days were adopted for the Mombasa grassland and 28 days for the Marandu one.
To standardize the harvest cuts, the methodology proposed by Silva et al. [4] was followed. Before cutting the plant height, forage wet mass was determined. After compiling the plant height and forage wet mass, two height classes of cut grass were defined [4]; with 30 cm for Panicum maximum cv. ‘Mombasa’ and 15 cm for Urochloa brizantha cv. ‘Marandu’. Data collection (plant height, leaf N, weight) after each harvest for the Mombasa grassland began in October 2016 until April 2017 (total harvest cuts = 7, harvest each 21 days), but no spectral data were collected in the period of December 2016, due to unfavorable weather factors. For the Marandu grassland, the field experiment began in October 2016 until April 2017 (total harvest cuts = 7, harvest each 28 days), lacking only spectral data collection in January 2017, due to the occurrence of rainfall during the cycle. The grassland canopy hyperspectral data were collected at the end of each crop cycle (21 days for Mombasa and 28 days for Marandu). Field spectrometry was carried out with a HandHeld 2 Spectroradiometer (ASD Inc., Boulder, CO, USA), which has a wavelength range of 325 to 1075 nm and a spectral sampling resolution of 1 nm. 10 canopy points were collected for each plot, by positioning the sensor at 1.5 m above the average height of the crop, which provided a circular field of view (FOV) of approximately 0.65 m in diameter, and an area of 0.34 m2. In total, 160 spectral sampling points were collected before harvest for each grassland type.
To obtain forage mass, a square frame of 0.7 m2 was constructed and randomly dropped into each plot. Subsequently, the wet biomass collected inside the frame was weighed. After weighing the total fresh biomass, a sub-sample of approximately 200 g/plot of fresh biomass was taken for botanical separation, subdivided into the biomass components “leaf”, “sheath + thatch” and “dead” material. Next, the vegetative material was dried inside a forced ventilation oven at 65 °C for 72 h to determine the percentage of dry matter (dry weight/fresh weight) for each biomass fraction. After this procedure it was possible to estimate the percentage of dry matter of the biomass components for each treatment area and, consequently, to estimate the productive components (kg ha−1) of the total forage productivity omitting the biomass of the “dead” material (sheath + thatch). Seven productivity estimates (kg ha−1) were obtained for each plot.
To obtain the FNC (g kg−1), eight leaves were collected for each treatment for the seven collections being performed randomly within the plot. Leaf collection corresponded to the newest, fully developed and with the senescent process started. In the laboratory, the leaves were first washed in running water. After washing, the leaves were dried (65 °C) in paper bags, until reaching a constant weight. After drying, the samples were ground to determine the N content. The chemical analyses are determined in the extracts obtained by sulfuric digestion by means of the semi-micro Kjeldahl method [34].
Plant height (cm) was measured from the ground to the curvature of the most expanded leaf at two locations per plot. To estimate LAI destructively, a sample of known area (0.25 m2) was collected and, with the help of an integrator model LI-3100C (Li-Cor®), the leaf area was measured. The LAI (m2 m−2), in this case, was obtained by multiplying the total dry biomass collected in the field by the leaf area (leaf area/dry biomass) and divided by the known area (0.25 m2).

2.2. Sentinel-2 Imagery

The band configuration of Sentinel-2 is given in Table 2. The bands range from 443 nm to 2190 nm, featuring four bands at 10 m (VIS and NIR bands), six bands at 20 m (red-edge and SWIR) and three bands at 60 m (atmospheric correction) of spatial resolution.
The images were downloaded directly and free of charge from the ESA server (https://scihub.copernicus.eu/). ESA provides Level−1C images, being geometrically corrected, with top-of-atmosphere (TOA) reflectance; and Level−2A images, being geometrically and atmospherically corrected, with top-of-canopy (TOC) reflectance. We downloaded the Sentinel-2 image from 25 April 2018, to spatialize the values of vegetation indices, selecting this date because it is the image with the least amount of clouds during the whole experiment period. In addition, we used the Sentinel Application Platform (SNAP) toolbox to process these Level−1C images into Level−2A data, using the Sen2Cor procedure [35].

2.3. Statistical Analysis

2.3.1. Recommendations for N Fertilization

Fertilization practice depends on several factors, that must be analyzed beforehand to provide advice to farmers and practice a more adequate fertilization, as far as the agronomic aspects are concerned (greater efficiency in the use of fertilizers) and economic (increase in the producer’s net income). To make the recommendation of N fertilization for the two cultivars, graphics were made comparing doses and productivity.

2.3.2. ARTMO

The Automated Radiative Transfer Model Operator (ARTMO) is a scientific software package consisting of different Radiative Transfer Models (RTMs) and several estimation toolboxes that allow the development and optimization of algorithms to convert optical images into maps of vegetation properties [36]. First, the ARTMO software was used to convoluted the spectrum collected in field, totaling 520 spectra (from 400 to 920 nm), to the Sentinel-2 satellite bands, from band 1 to band 8a (Table 2).
According to Rivera et al. [37], the spectral indices assessment toolbox developed for the ARTMO software was used to calibrate and validate the generic formulas, providing all the possible band combinations from the VIS to the NIR (400–920 nm) region [38]. The method used for the selection of bands was cross-validated with the k-fold technique to ensure more robust results [39]. This method divides the available data into k subsets. From these k sub-datasets, k−1 sub-datasets are selected as a calibration dataset and a single sub-dataset is used for model validation. The cross-validation process is then repeated k times, with each of the k subsets used as the validation dataset. Thus, all data are used for calibration and validation. Here, we use a cross-validation procedure of 4 times (k = 4). After this process, the software provides different statistical evaluators (R, R2, NSE, RMSE, NRMSE) for the data analyzed, giving the option of ordering the results by statistic. In this study, the results are ordered by the determination coefficient R2. This methodology was applied to the spectral canopy reflectance data (n = 9) collected for two grassland cultivars (Mombasa and Marandu). From the best results provided by the ARTMO software, we selected those that, within a physical and statistical point of view, correlated better with each of the variables studied.

2.3.3. Spectral Vegetation Indices Analysis

Based on the indices established to obtain different biophysical parameters in the literature, several generic forms of vegetation indices (Table 3) were introduced in the spectral indices assessment toolbox along with the in situ data obtained throughout the experiment (productivity, FNC, height and LAI). The generic indices introduced in ARTMO contain common formulations used to obtain statistical relationships with different biophysical parameters of vegetation, including N (Table 3). The only index that remained the same as the original index described by the author was the Normalized Area Over reflectance Curve (NAOC) [40]. This index is used to estimate the chlorophyll content and is highlighted in Table 3 with a grey color. NAOC index is based on the calculation of the area over the reflectance curve, determined from the integral of the red–near-infrared interval divided by the maximum reflectance in that spectral region.

2.3.4. Spatial Analysis of Biophysical Parameters at the Larger Field Scale

The vegetation indices values showed in this work were generated with the cultivars Mombasa and Marandu field data from the experimental plot area (Figure 1), and were subsequently applied to the cultivars Urochloa brizantha cv. Piatã and Urochloa decumbens cv. ‘Decumbens’, which have similar characteristics to the cultivar of Marandu. The cultivars were grown at the experimental site from the Brazilian Agricultural Research Corporation (EMBRAPA) farm, São Paulo State (21°58′27″ S, 47°51′3″ W). To test and visualize the application of the parameter retrievals, Sentinel-2 imagery of this area was used to generate maps visualized with ArcGIS software (version 10.2) and interpreted based on the fertilization and grazing management.
The area was cultivated with Urochloa brizantha cv. ‘Piatã’ (Figure 2, systems A and C) and with Urochloa decumbens cv. ‘Decumbens’ (Figure 2, system B). The study area was divided into three systems (A, B, C) as can be seen in Figure 2, system A (paddock 1 and 2), system B (paddock 3 and 4) and system C (paddock 5 and 6) [45]. System A is a crop-livestock integration (iCL), in which every three years one third of the pasture area is cultivated with corn crop type. The iCL systems involves the cultivation of crops and pastures in the same area in rotational, consortia and/or succession plantations, allowing increased efficiency in natural resources use, environment preservation, production stability and producer income [46]. System A is composed of two repetitions (paddock 1 and 2), i.e., type of management, N fertilization, and rotated pasture method. Each repetition is composed of 6 plots, of which two are cultivated with corn. The area was uniformly fertilized with urea, with a 180 kg ha−1 dose of N, from November 2017 to May 2018. In this time, four fertilizations (45 kg of N) were already performed on each paddock, initially at intervals of 50 days and then at intervals of 35 days. The rotated pasture is characterized by the periodic and frequent change of animals from one paddock to another, to give a period of rest to the grasslands. System B is an extensive system with continuous grazing method and without fertilization, composed of two repetitions (paddock 3 and 4). This type of system is the most commonly used in Brazil due to the lower production cost. In our experimental study, this system has Urochloa decumbens grassland. System C is an intensive system with two repetitions (paddock 5 and 6) and a rotated pasture method. The area was also fertilized with N (180 kg ha−1 in the period from November 2017 to May 2018) and each repetition is composed of 6 plots.
The composition of the study area and its specific conditions is detailed in Table 4. Regarding the A and C systems, the management was the rotational method, with different development states of the Piatã grassland within the same system. However, in system C the management was the continuous grazing and, therefore, the entire area was characterized by the same Decumbens development state. The rotation cycle in iCL (System A) and intensive system (System C) was 36 days. In the paddock of the iCL was 9 days (with a rest period of 27 days) and in the intensive system the paddock is grazed for 6 days (with a rest period of 30 days).

3. Results

3.1. Productivity and FNC under Controlled N Fertilization

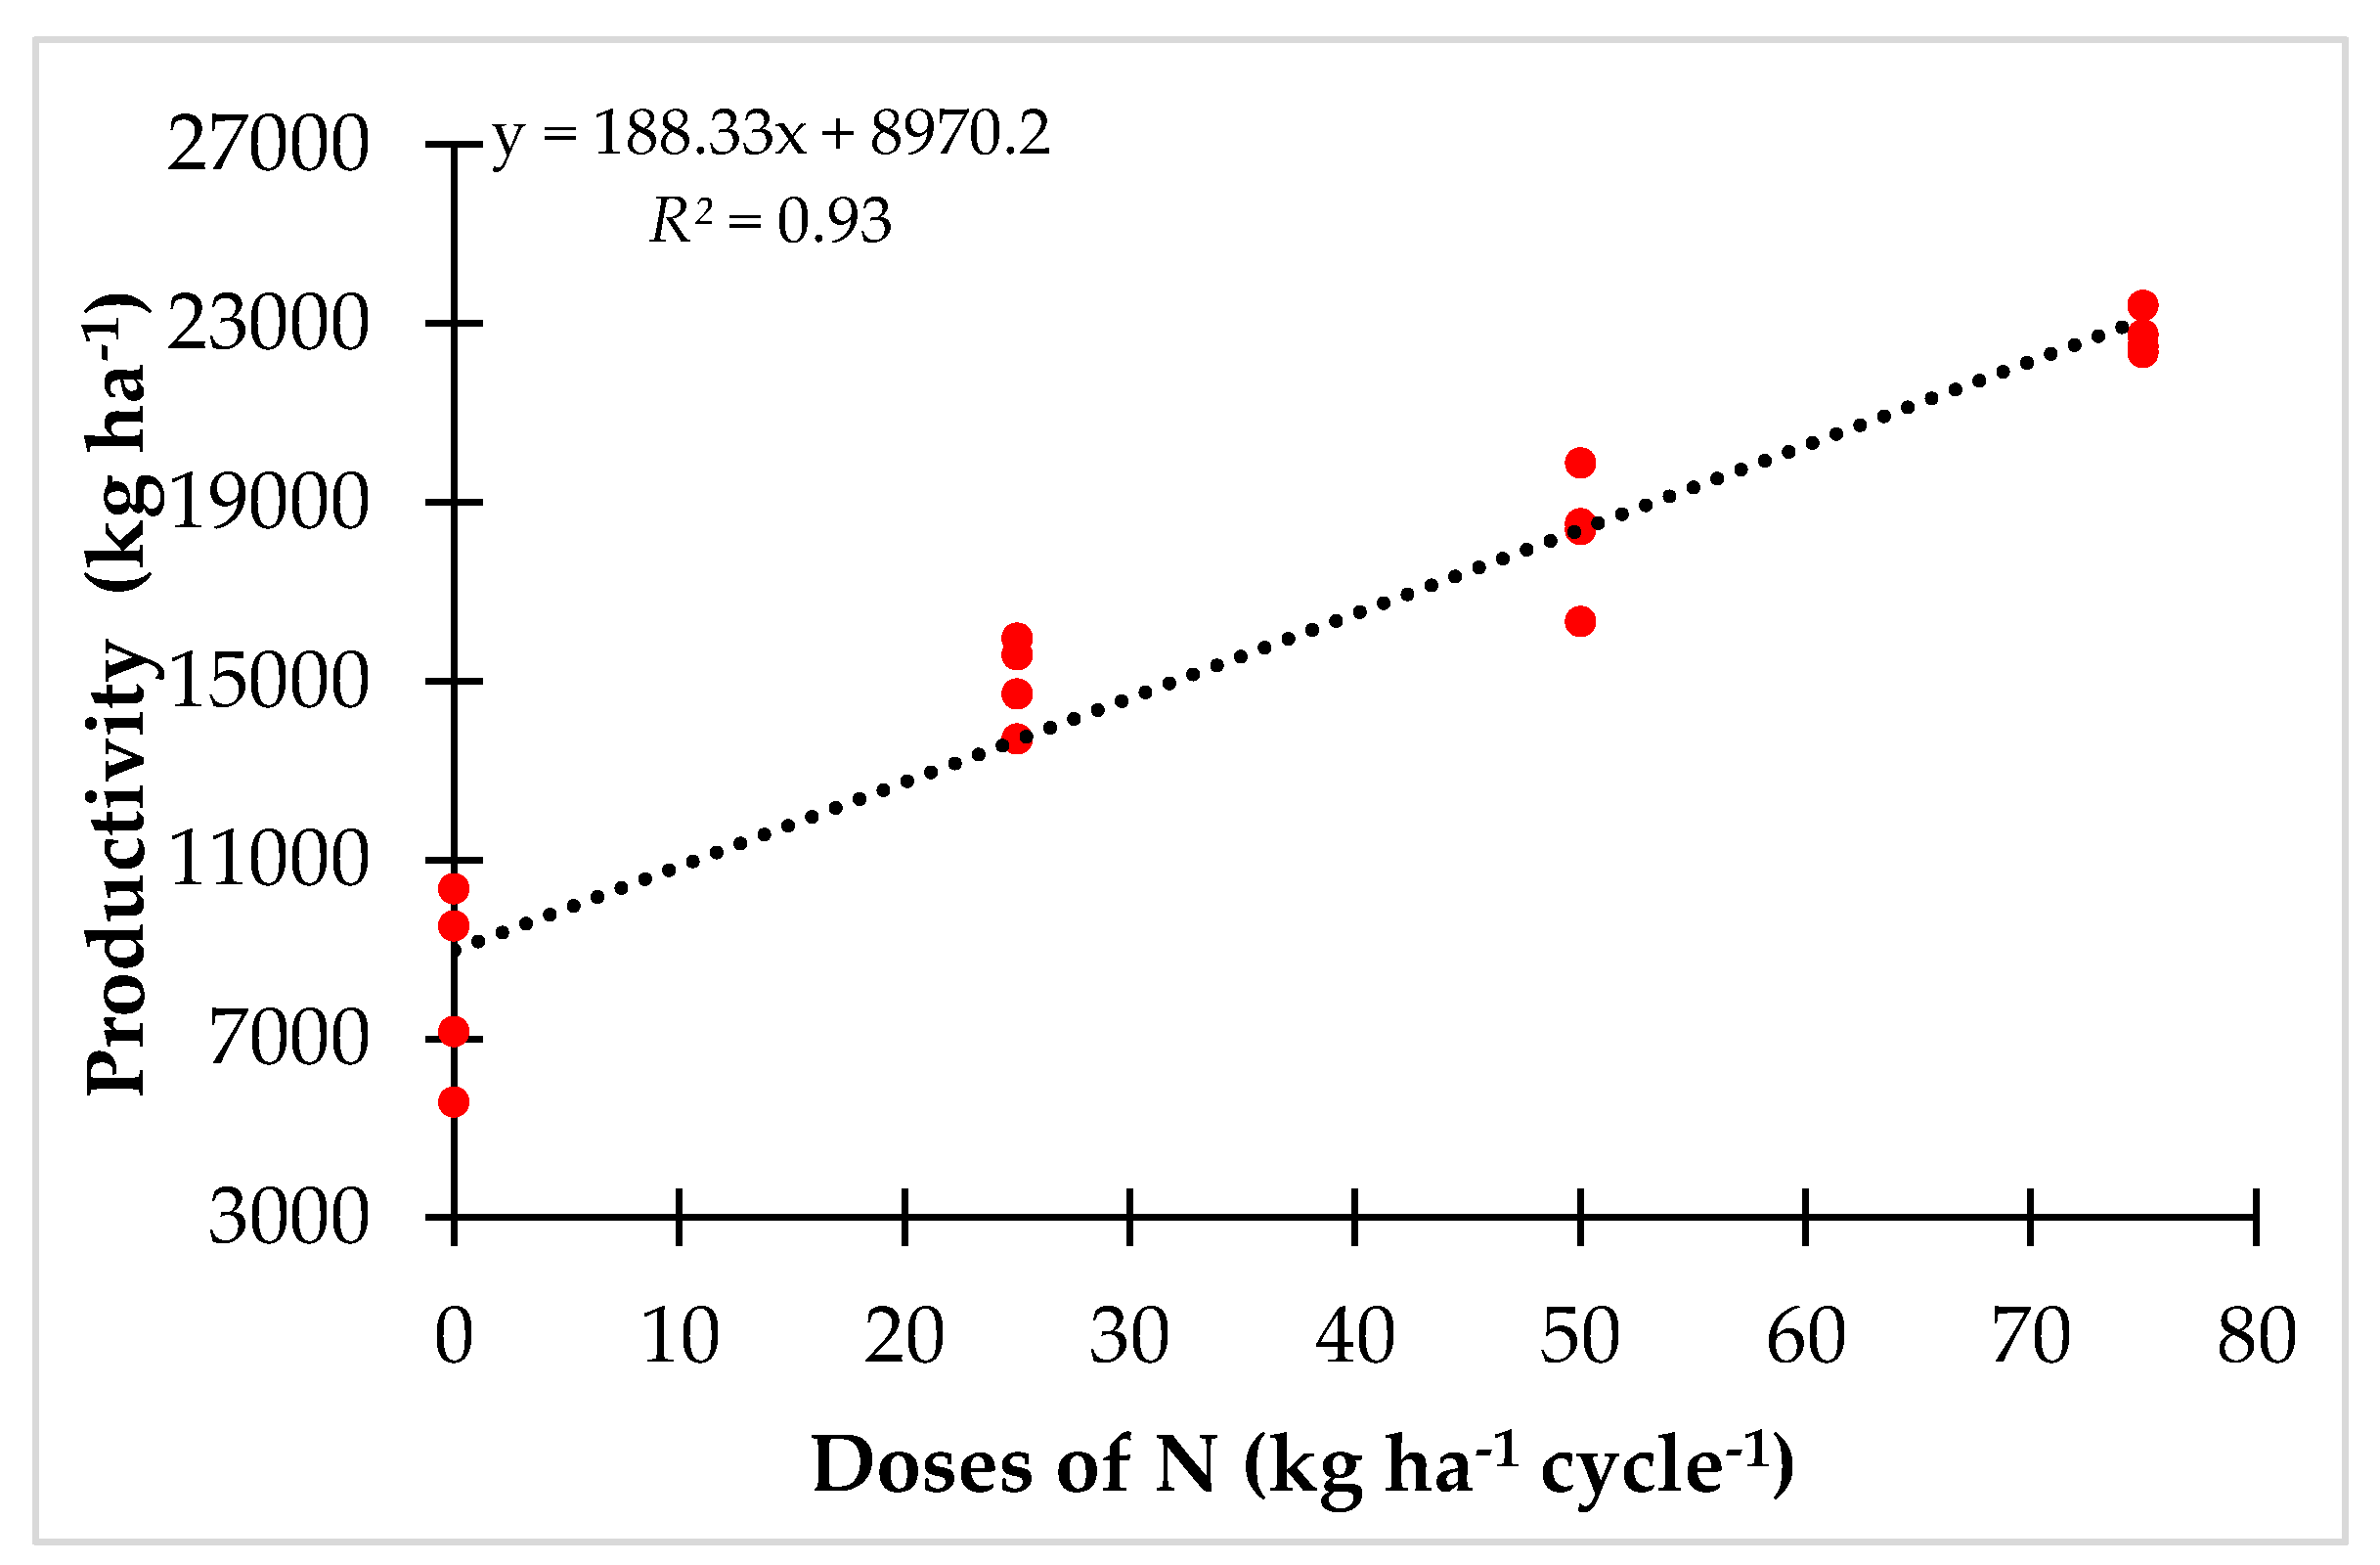
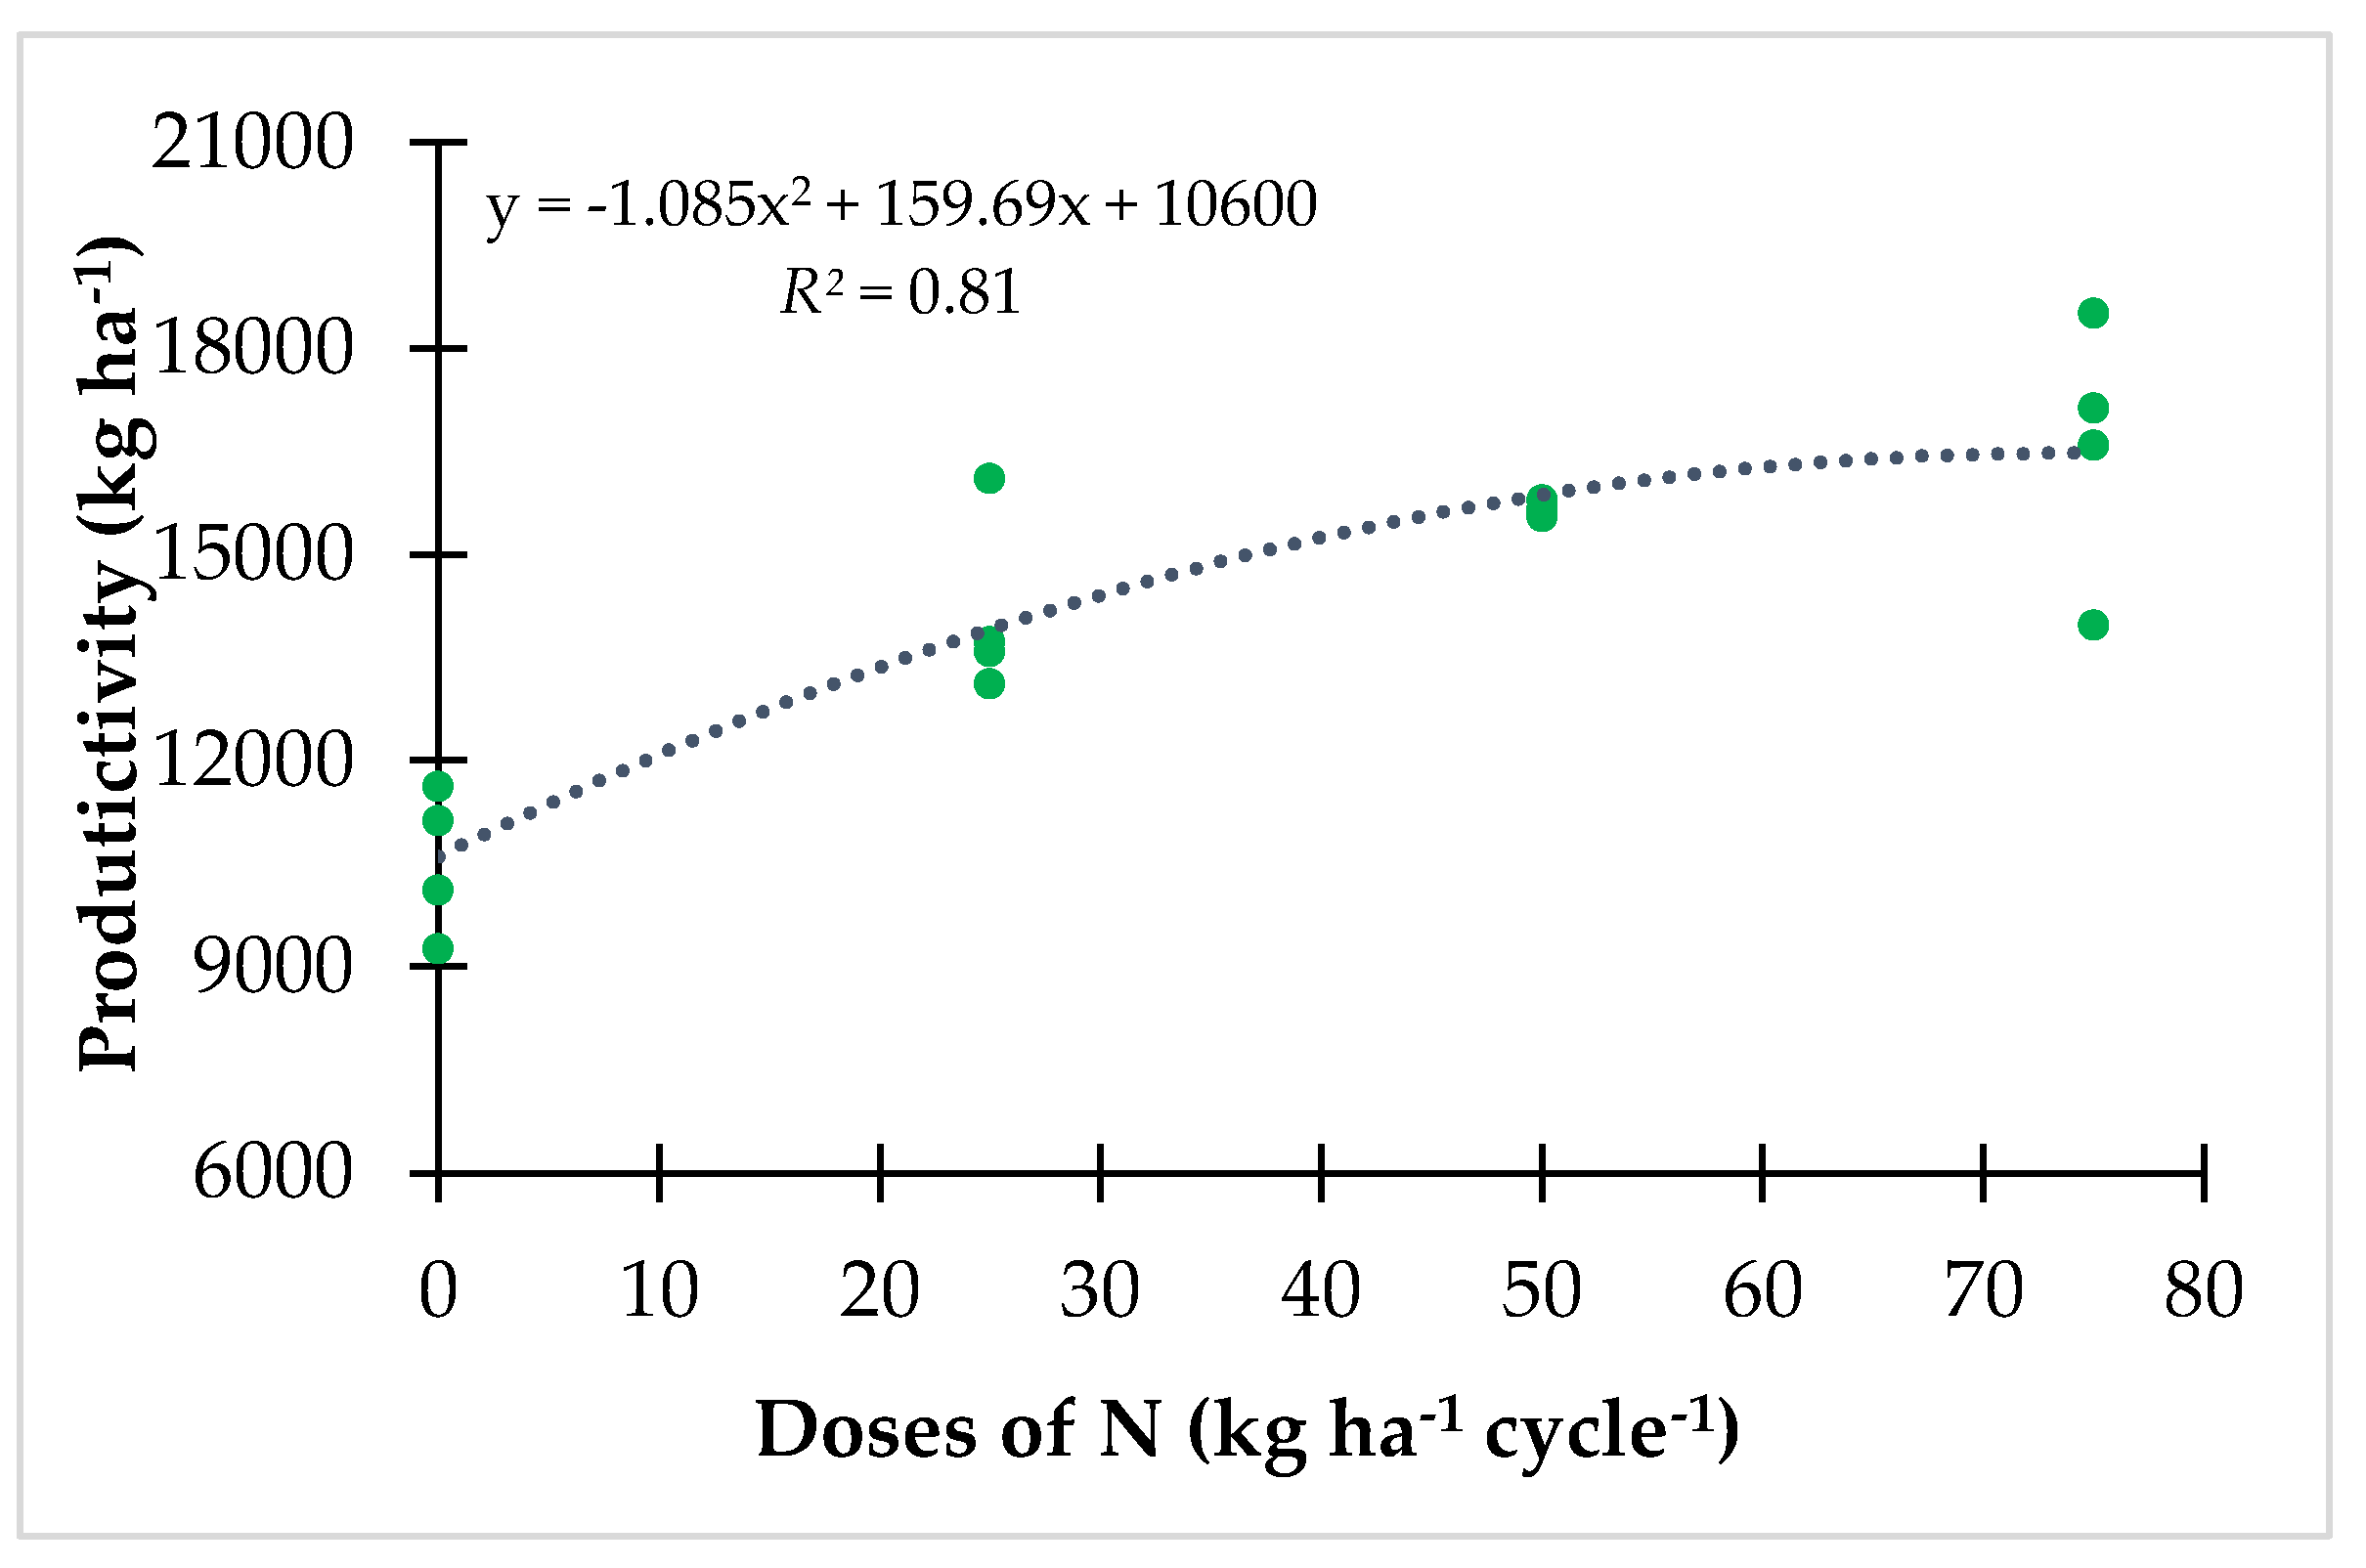
The recommendation for N fertilization proposed in this paper is supported on the results obtained from the productivity data for Mombasa and Marandu. The biomass productivities of the two grassland cultivars under N treatments were analyzed during the seven harvest collections. Figure 3 and Figure 4 show the results according to the four doses of N applied and the four repetitions conducted. In general, it could be affirmed that while increasing N doses the productivities increase in a linear form for the Mombasa cultivar (Figure 3) and polynomial form for the Marandu cultivar (Figure 4). The Mombasa productivity values oscillated from 5000 to 23,000 kg ha−1, and the highest productivity occurred for the highest dose applied (75 kg ha−1) obtaining an average value for the M3 treatment of 22,605 kg ha−1.
Regarding Marandu cultivar the productivity values varied between 9250 and 18,000 kg ha−1, and were fitted with a second order polynomial in function of N doses (Figure 4). Compared to the Mombasa cultivar, the effect of the highest N doses (75 kg ha−1) was less strong on the productivity outcome of Marandu.
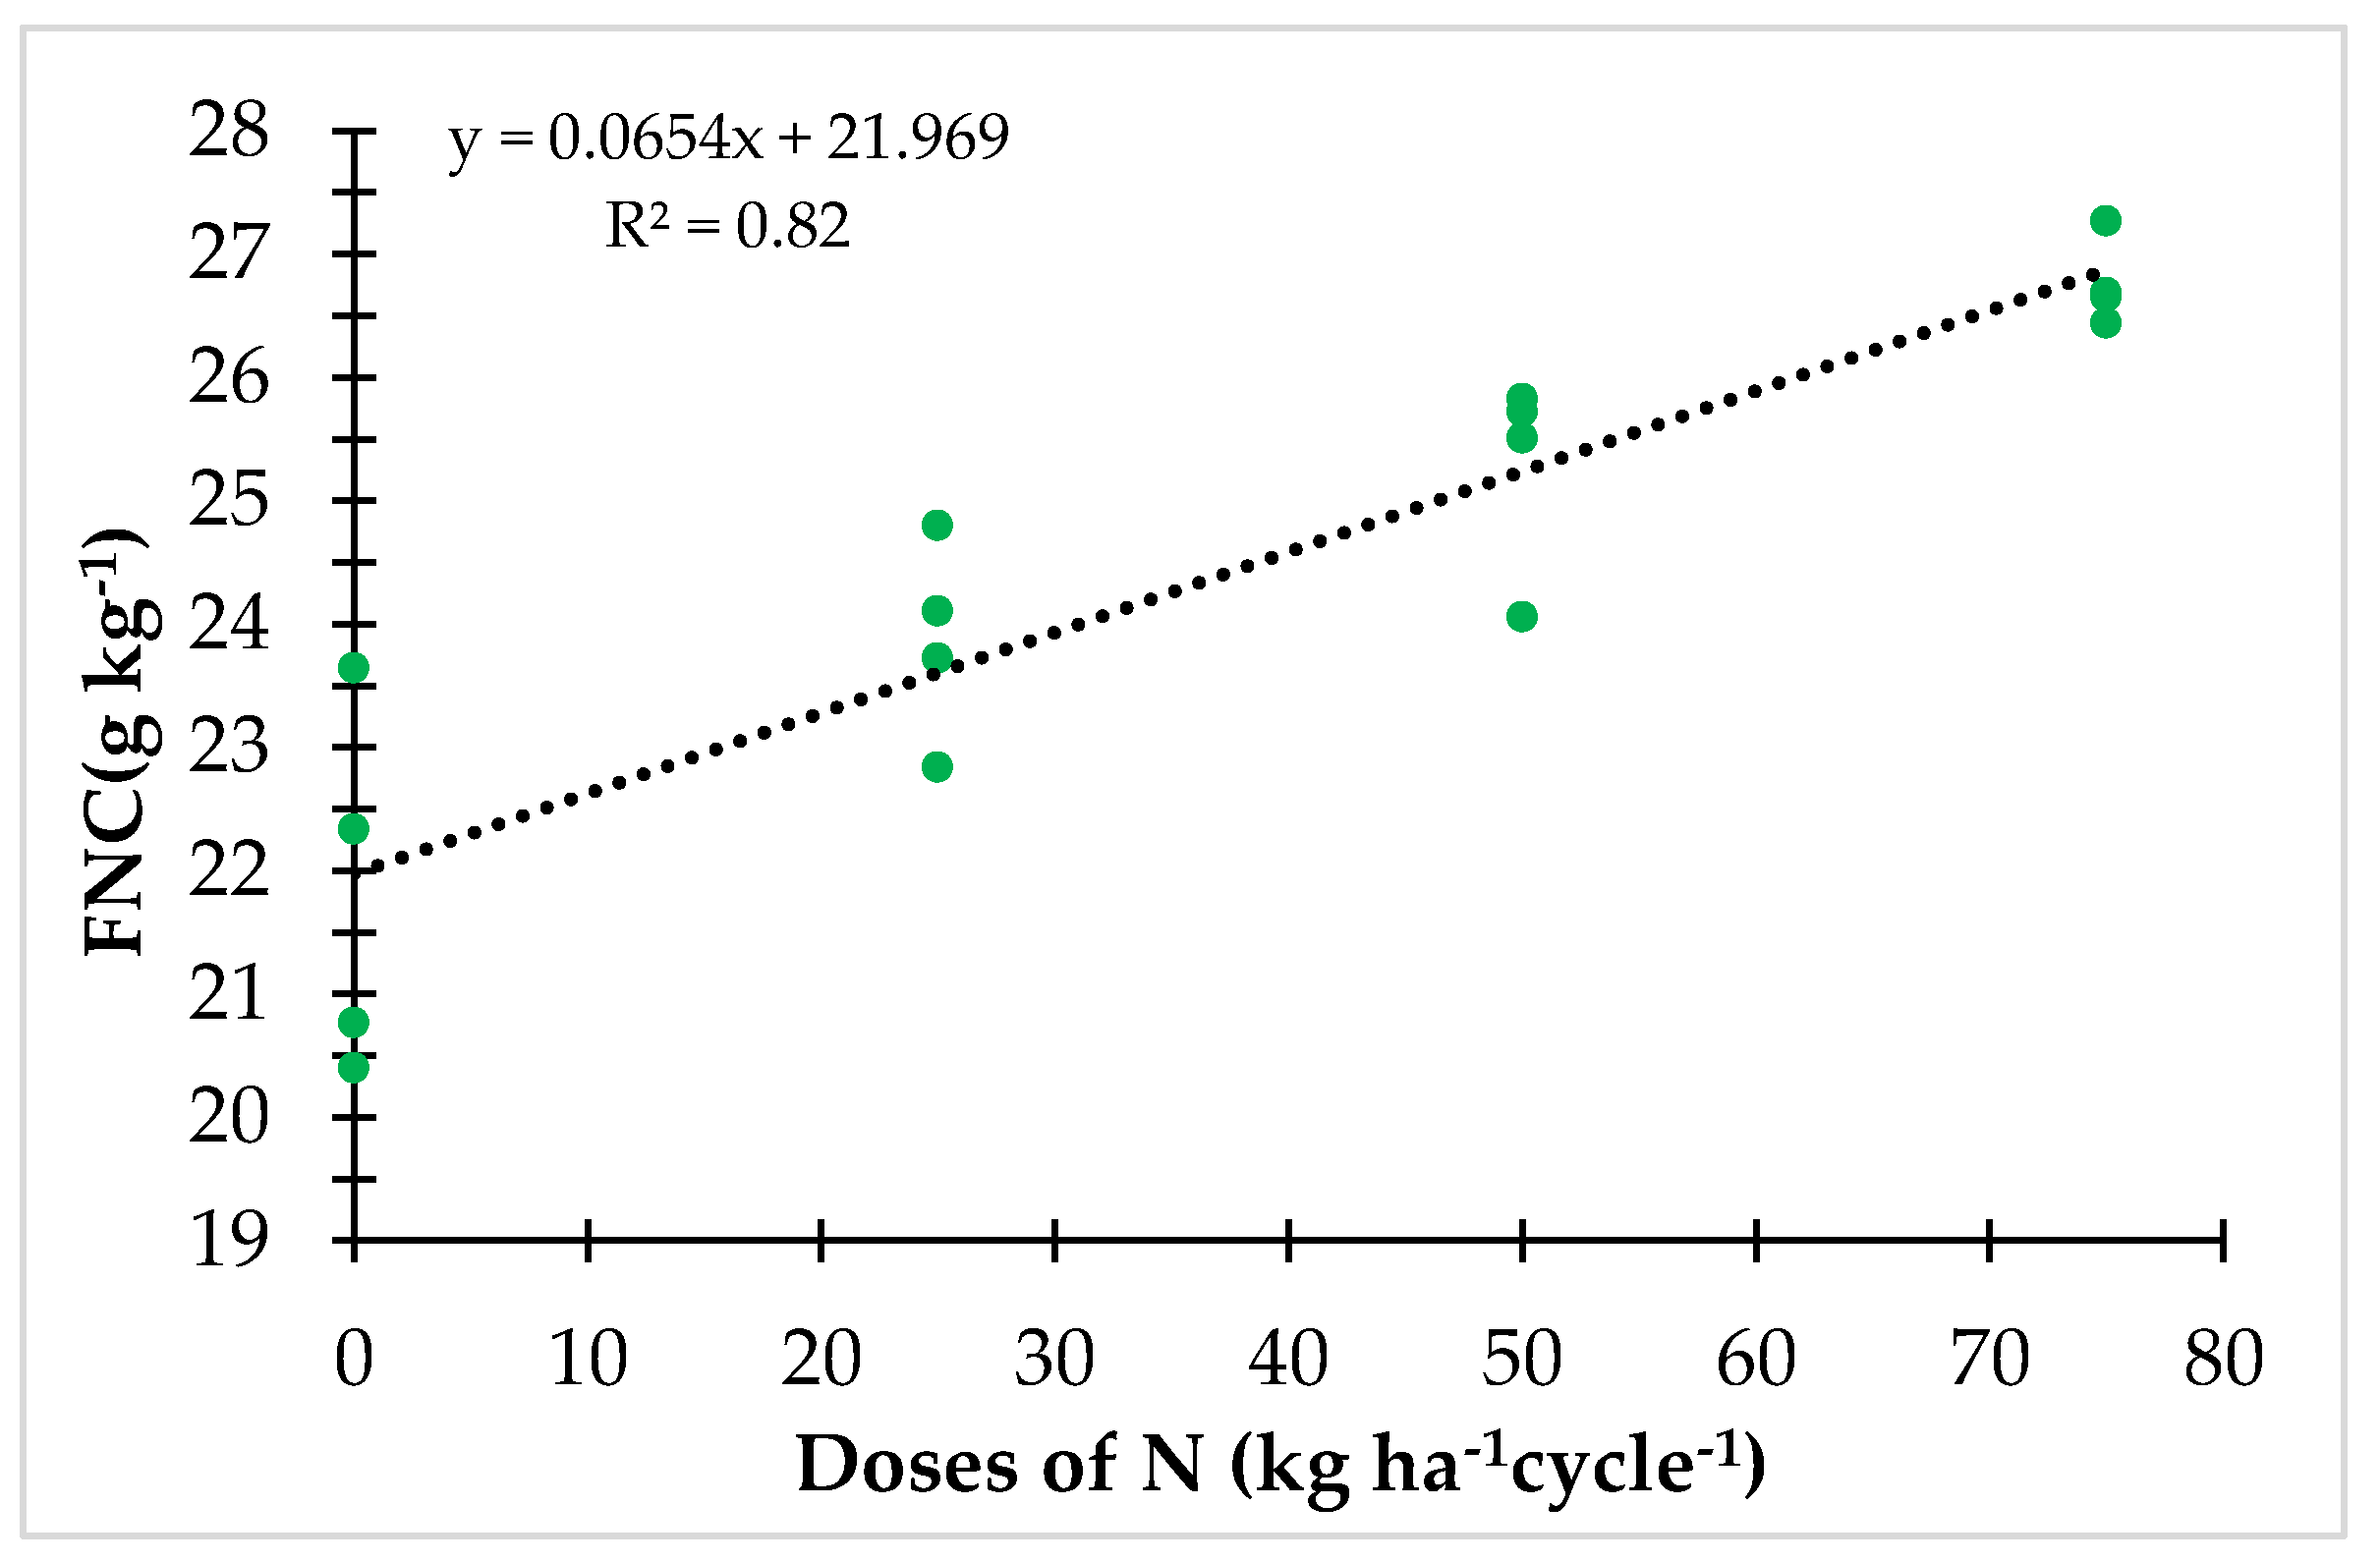
The FNC of the two grassland species under N treatments were analyzed in Figure 5 and Figure 6 showing the results according to the four doses of N applied and the four repetitions conducted. In general, it could be affirmed that while increasing N doses the FNC increase in a polynomial form for the Mombasa cultivar (Figure 5) and in a linear form for the Marandu cultivar (Figure 6). The N values of Mombasa cultivar oscillated from 21.5 to 30.1 g kg−1, and the highest FNC occurred for the highest dose applied (75 kg ha−1) obtaining an average value for the M3 treatment of 29.7 g kg−1. Similar results can be observed for the M2 treatment obtained, an average value of 29.6 g kg−1.
On the other hand, FNC values of Marandu cultivar varied between 20.4 and 27.3 g kg−1 with a linear function of N doses (Figure 6). Mombasa cultivar, the FNC value is highest (29.6 g kg−1) and it increases in a linear form depending on the dose, that is, the higher dose obtains the higher the N content. It should be noted that these data were extracted under the best conditions of water and nutrients. This is the reason that the values obtained for the Mombasa and Marandu cultivars ranged from 5500 to 23,000 kg ha−1 and the values obtained for the Piãta and Decumbens grassland ranged from 400 to 4000 kg ha−1.

3.2. Performance of Generic Indices

In this work, we analyze the main vegetation indices (Table 3) used to estimate essential biophysical parameters of the Mombasa and Marandu grasslands. The best performing vegetation indices were applied for mapping the biophysical parameters for the Piatã and Decumbens areas, in order to extend the methodology to other varieties of grasslands. For each biophysical parameter, it was observed that the best results were obtained for the dataset composed of both grassland type values, being the R2 higher than with each of the grasslands individually. Maps of the different biophysical parameters over the Piatã and Decumbens area have been generated using the vegetation indices calibrated with the Mombasa and Marandu data (Figures 8, 13 and 15). This was done to visually observe the behavior of the vegetation indices in other areas. Additional validation of the vegetation indices with specific field data of the Piatã and Decumbens grasslands is required in the future.
Table 5 shows the Sentinel-2 bands wavelengths with the best performance for the Mombasa and Marandu grasslands. From the best results provided by ARTMO ordered following the R2 statistic, we selected those that correlated best with each of the variables studied from a physical and statistical point of view.
For the height variable, the R2 were practically null (Table 5), since the two grassland types present some morphological differences. Although both have skeptical growth, under normal growing conditions the Mombasa grassland presents a higher size and wider and longer leaves than the Marandu one. The other variables (productivity, FNC, and LAI) produced better correlations. In Table 5, the best results, based on R2, were highlighted in grey. These vegetation indices results were further used to generate biophysical parameter maps obtained from the Sentinel-2 image of the experimental field.

3.2.1. Foliar Nitrogen Content (FNC)

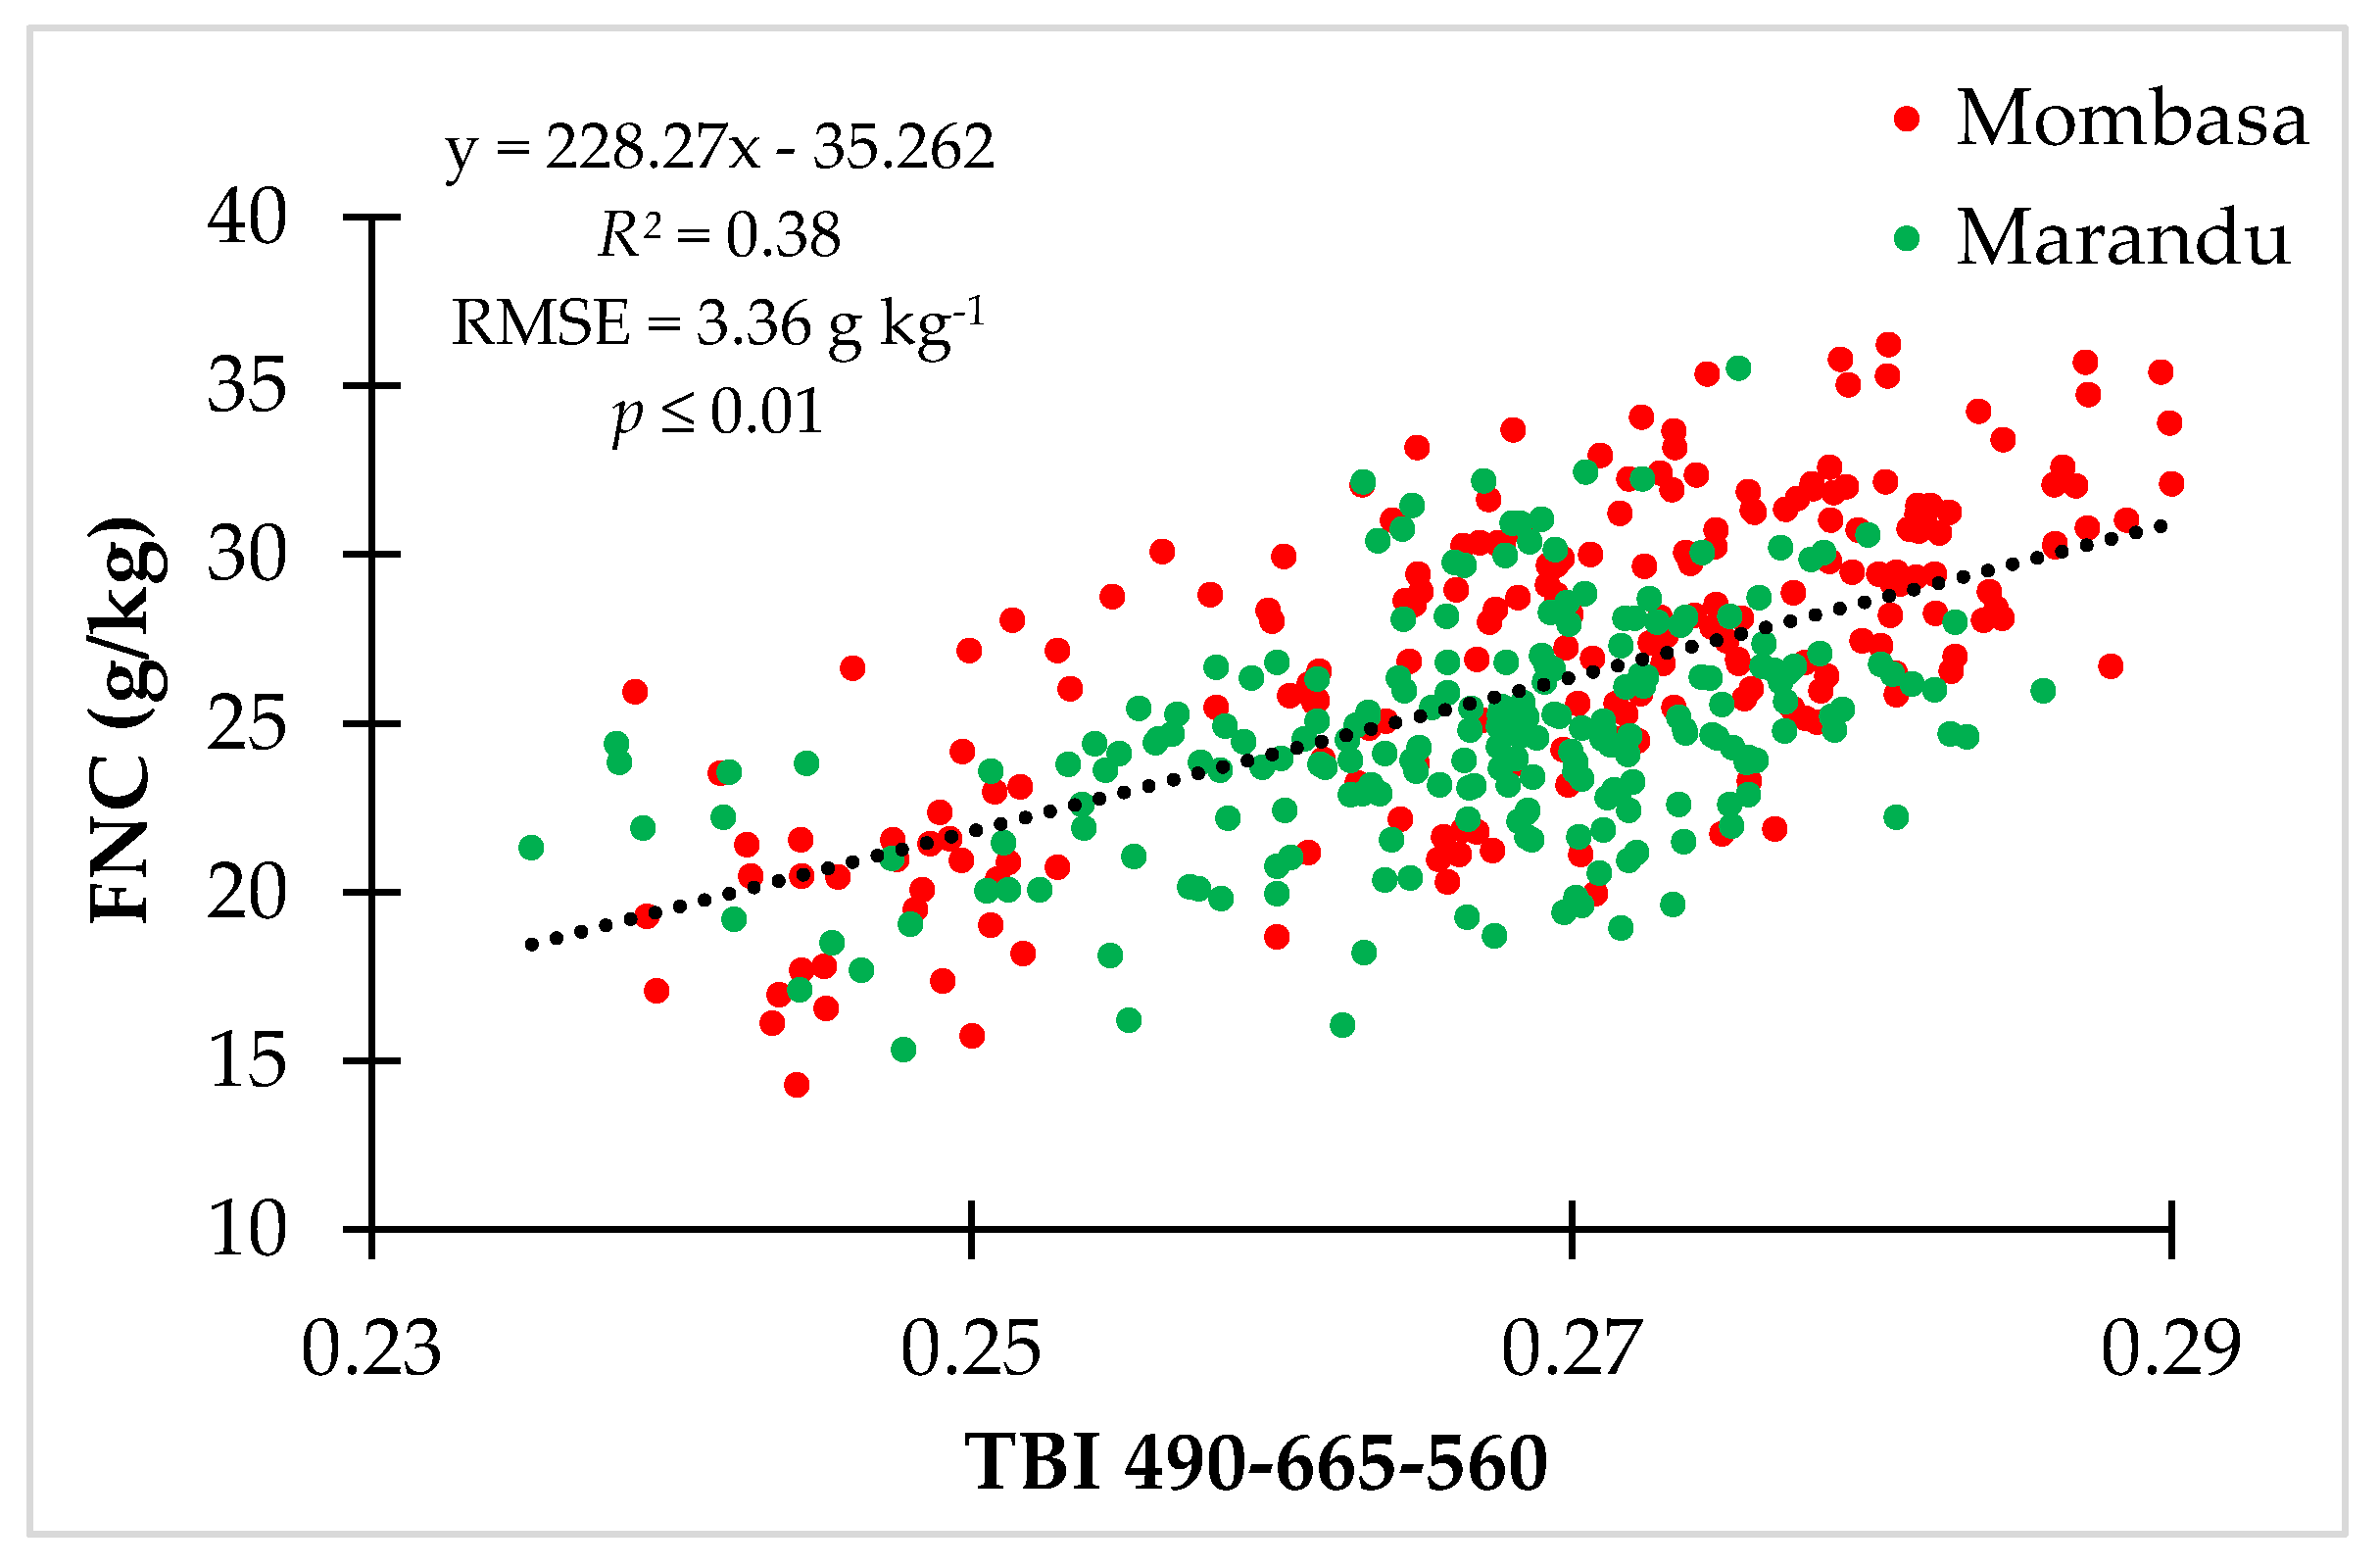
Figure 7 shows the best band combination to estimate the FNC parameter, using the blue (b1-490), green (b3-560), and red (b2-665) Sentinel-2 band in the Three Band Index (TBI) formulation. The model generated produces a = 0.38, RMSE = 3.4 g kg−1 and a p-value ≤ 0.01, with a linear fitting. Hence, the FNC can be calculated applying Equation (1) on Sentinel-2 image, as follows:
FNC   ( g / kg ) = 228.27 × ( R 490 R 665 + R 560 ) 35.26
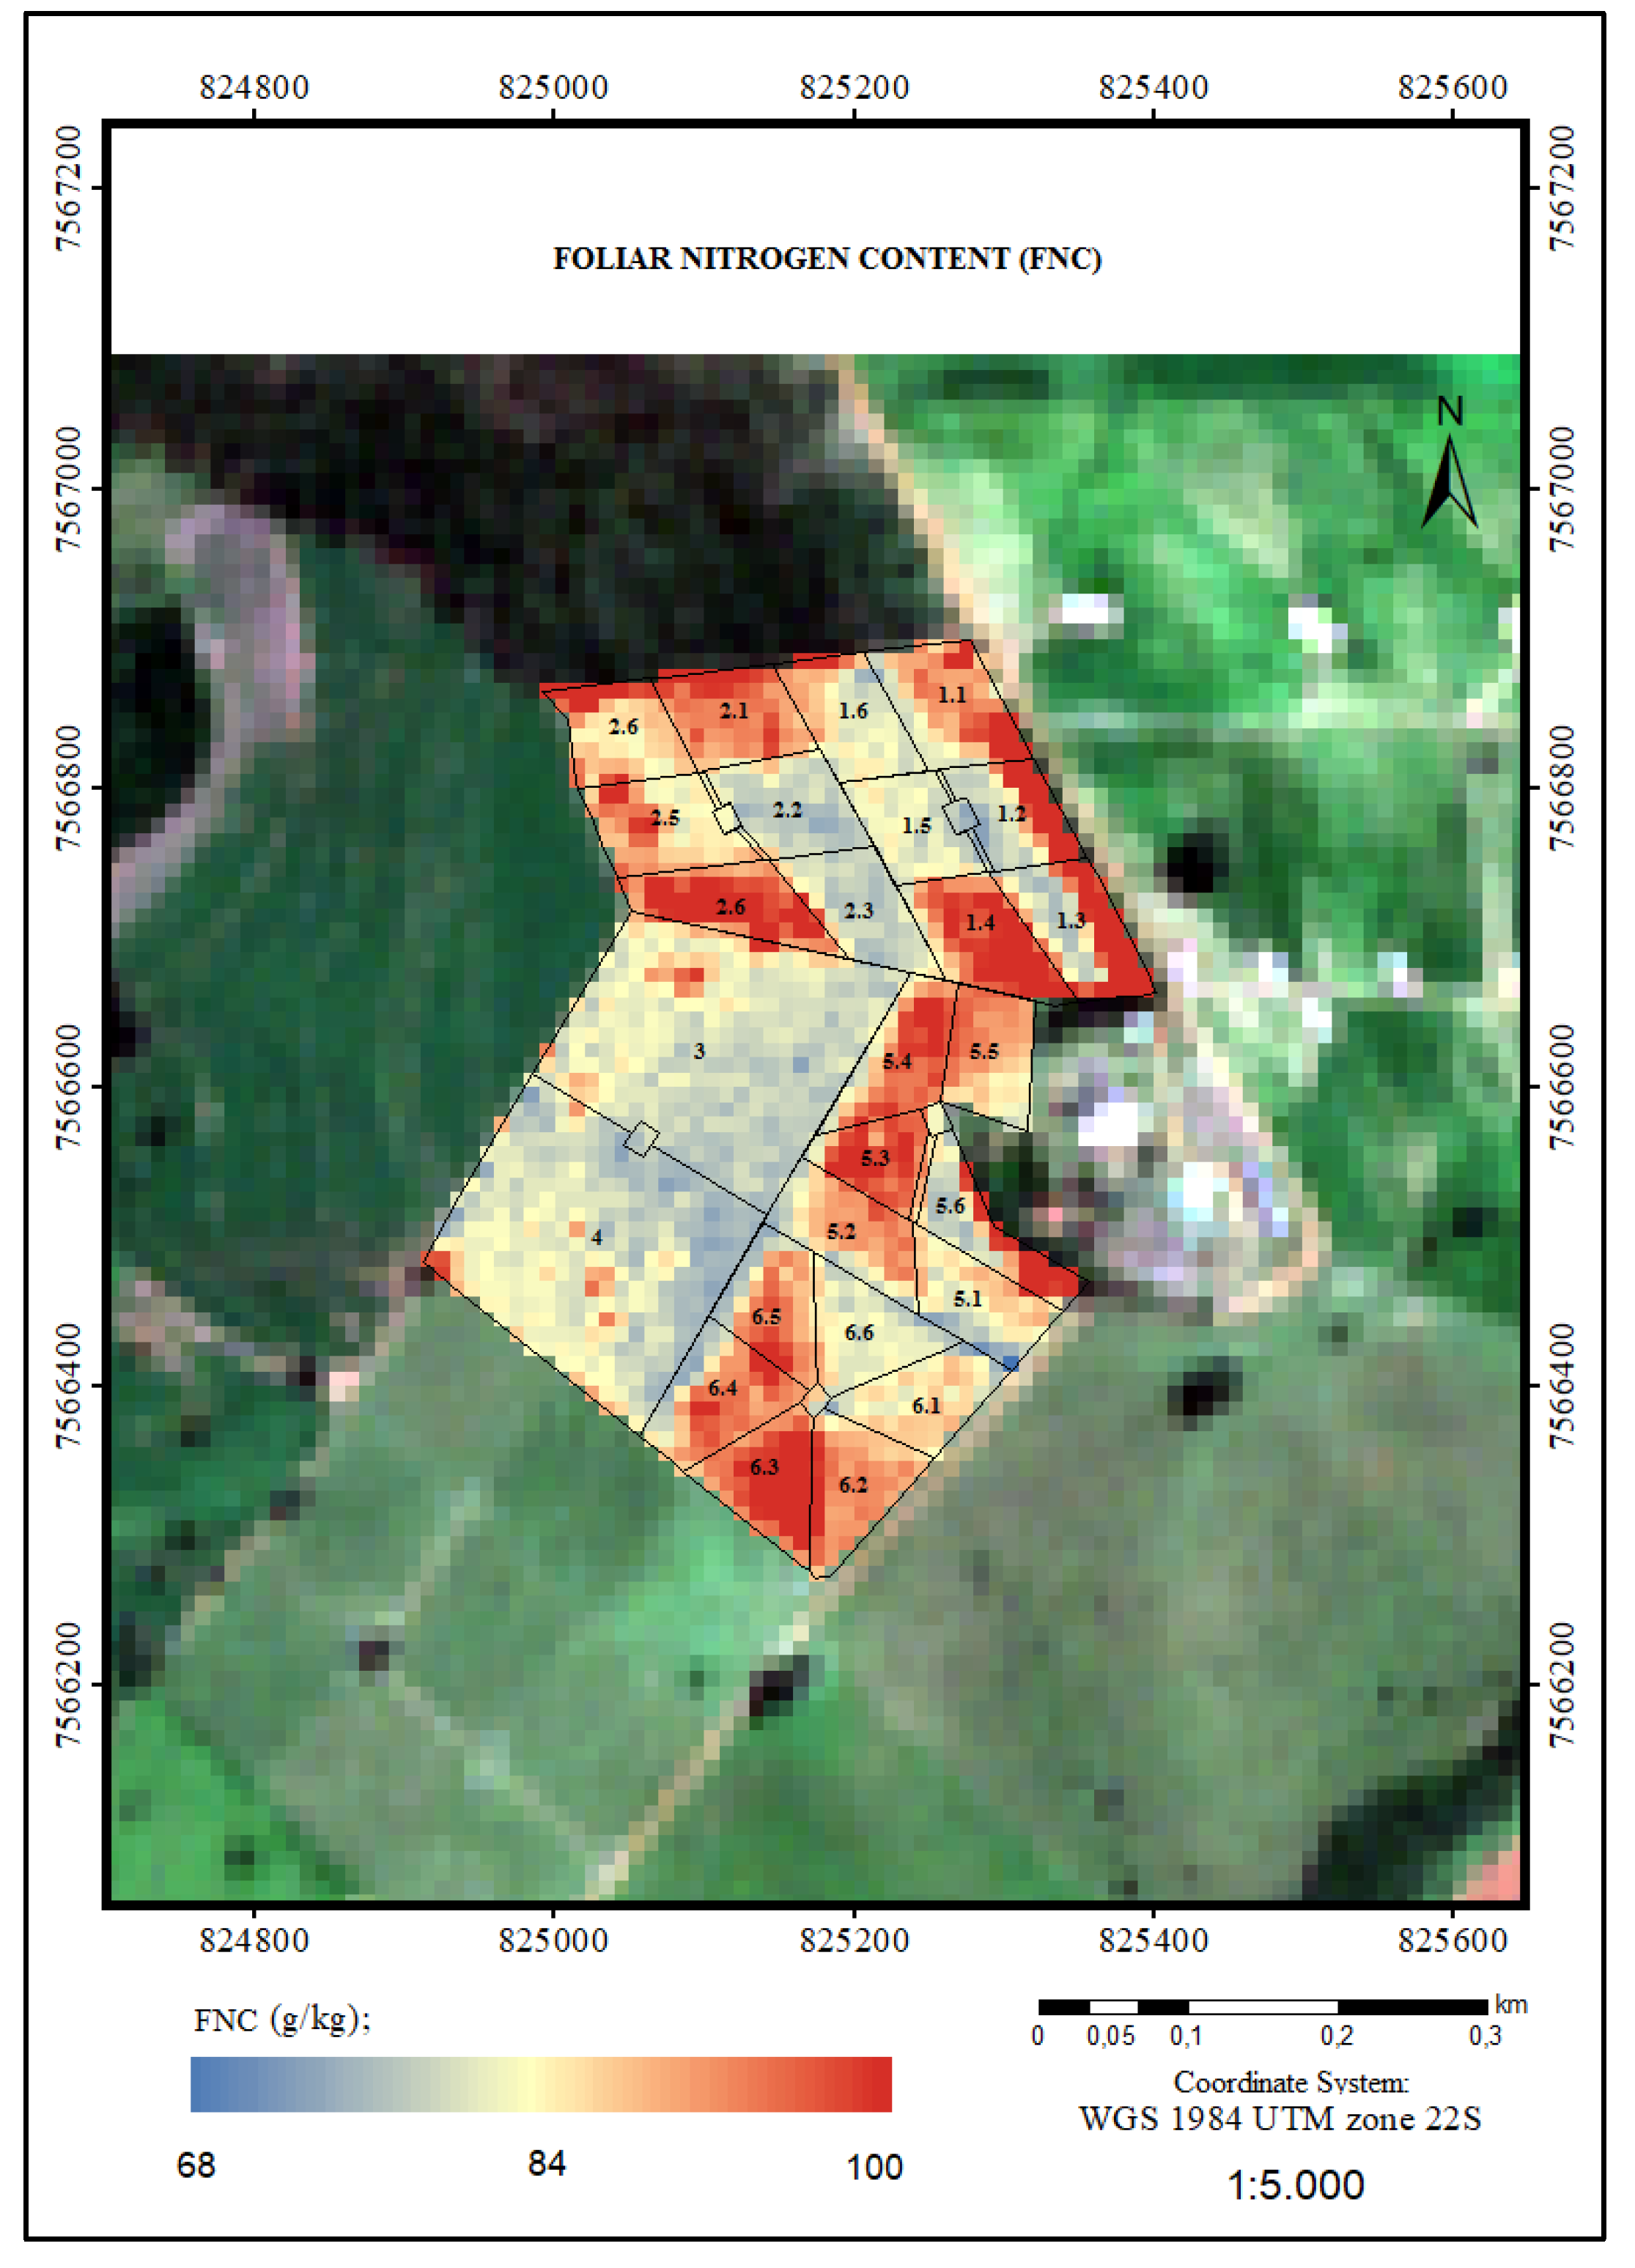
It should be noted that this model must be validated with field data but in order to scale up spatially the estimation of FNC, Equation (1) was applied in the April 25 Sentinel-2 image, obtaining the map represented in Figure 8. The difference in the range of values of the parameter FNC in Figure 7 (14–40 g kg−1) and Figure 8 (68–100 g kg−1) may be due to the fact that both areas were composed of different crop types and the type of management is different. Figure 8 shows that the highest FNC values are observed in system A, in the paddock under pasture (paddocks 1.4, 2.4) and in system C, in the paddocks 5.3 and 6.3 in a pre-pasture stage. The system B shows the lowest FNC values in all paddocks because it is in a grazing stage and it is the only system without fertilization process. In system A, the high FNC values along all the edge of the system are due to the influence of the trees present on the adjacent plots.

3.2.2. Leaf Area Index (LAI)

LAI is an important parameter of the vegetation canopy, because it is intrinsically connected to the total interception of photosynthetic active radiation, and therefore correlated with photosynthesis [47]. Three indices resulted in similar R2: TBI, NAOC and Normalized Difference Vegetation Index (NDI) (Table 5).
Figure 9 shows the correlation between TBI index and the LAI destructively measured. The generated model produced a R² = 0.56, RMSE = 1.5 m2 m−2 and a p-value ≤ 0.01, with a linear fitting. The bands selected by ARTMO were: b1-740; b2-783; b3-665, i.e., two red-edge bands and one red band. The LAI parameter can be calculated applying Equation (3) on Sentinel-2 image, as it follows:
LAI = 43.725 × ( R 740 R 783 + R 665 ) + 36.252
Figure 10 shows the correlation between LAI and NAOC index. The generated model produces a = 0.57, RMSE = 1.4 m2 m−2 and a p-value ≤ 0.01, with an exponential fitting. Thus, the LAI can be calculated applying Equation (3) on Sentinel-2 image, as it follows:
LAI = 0.038 × e [ 7.205 × ( 1 40 × R 665 + 35 × R 705 + 43 × R 740         118 × R 783 ) ]
The other index that presents a good correlation with the LAI is the two-band NDI, which uses the bands centered at 783 and 740 nm in the red-edge region, with 10 m of spatial resolution. Figure 11 shows the correlation between NDI and LAI. The generated model produces a R2 = 0.54, RMSE = 1.4 m2 m−2 and a p-value ≤ 0.01, given by:
LAI = 49.328 × ( R 783 R 740 R 783   + R 740 ) 1.211
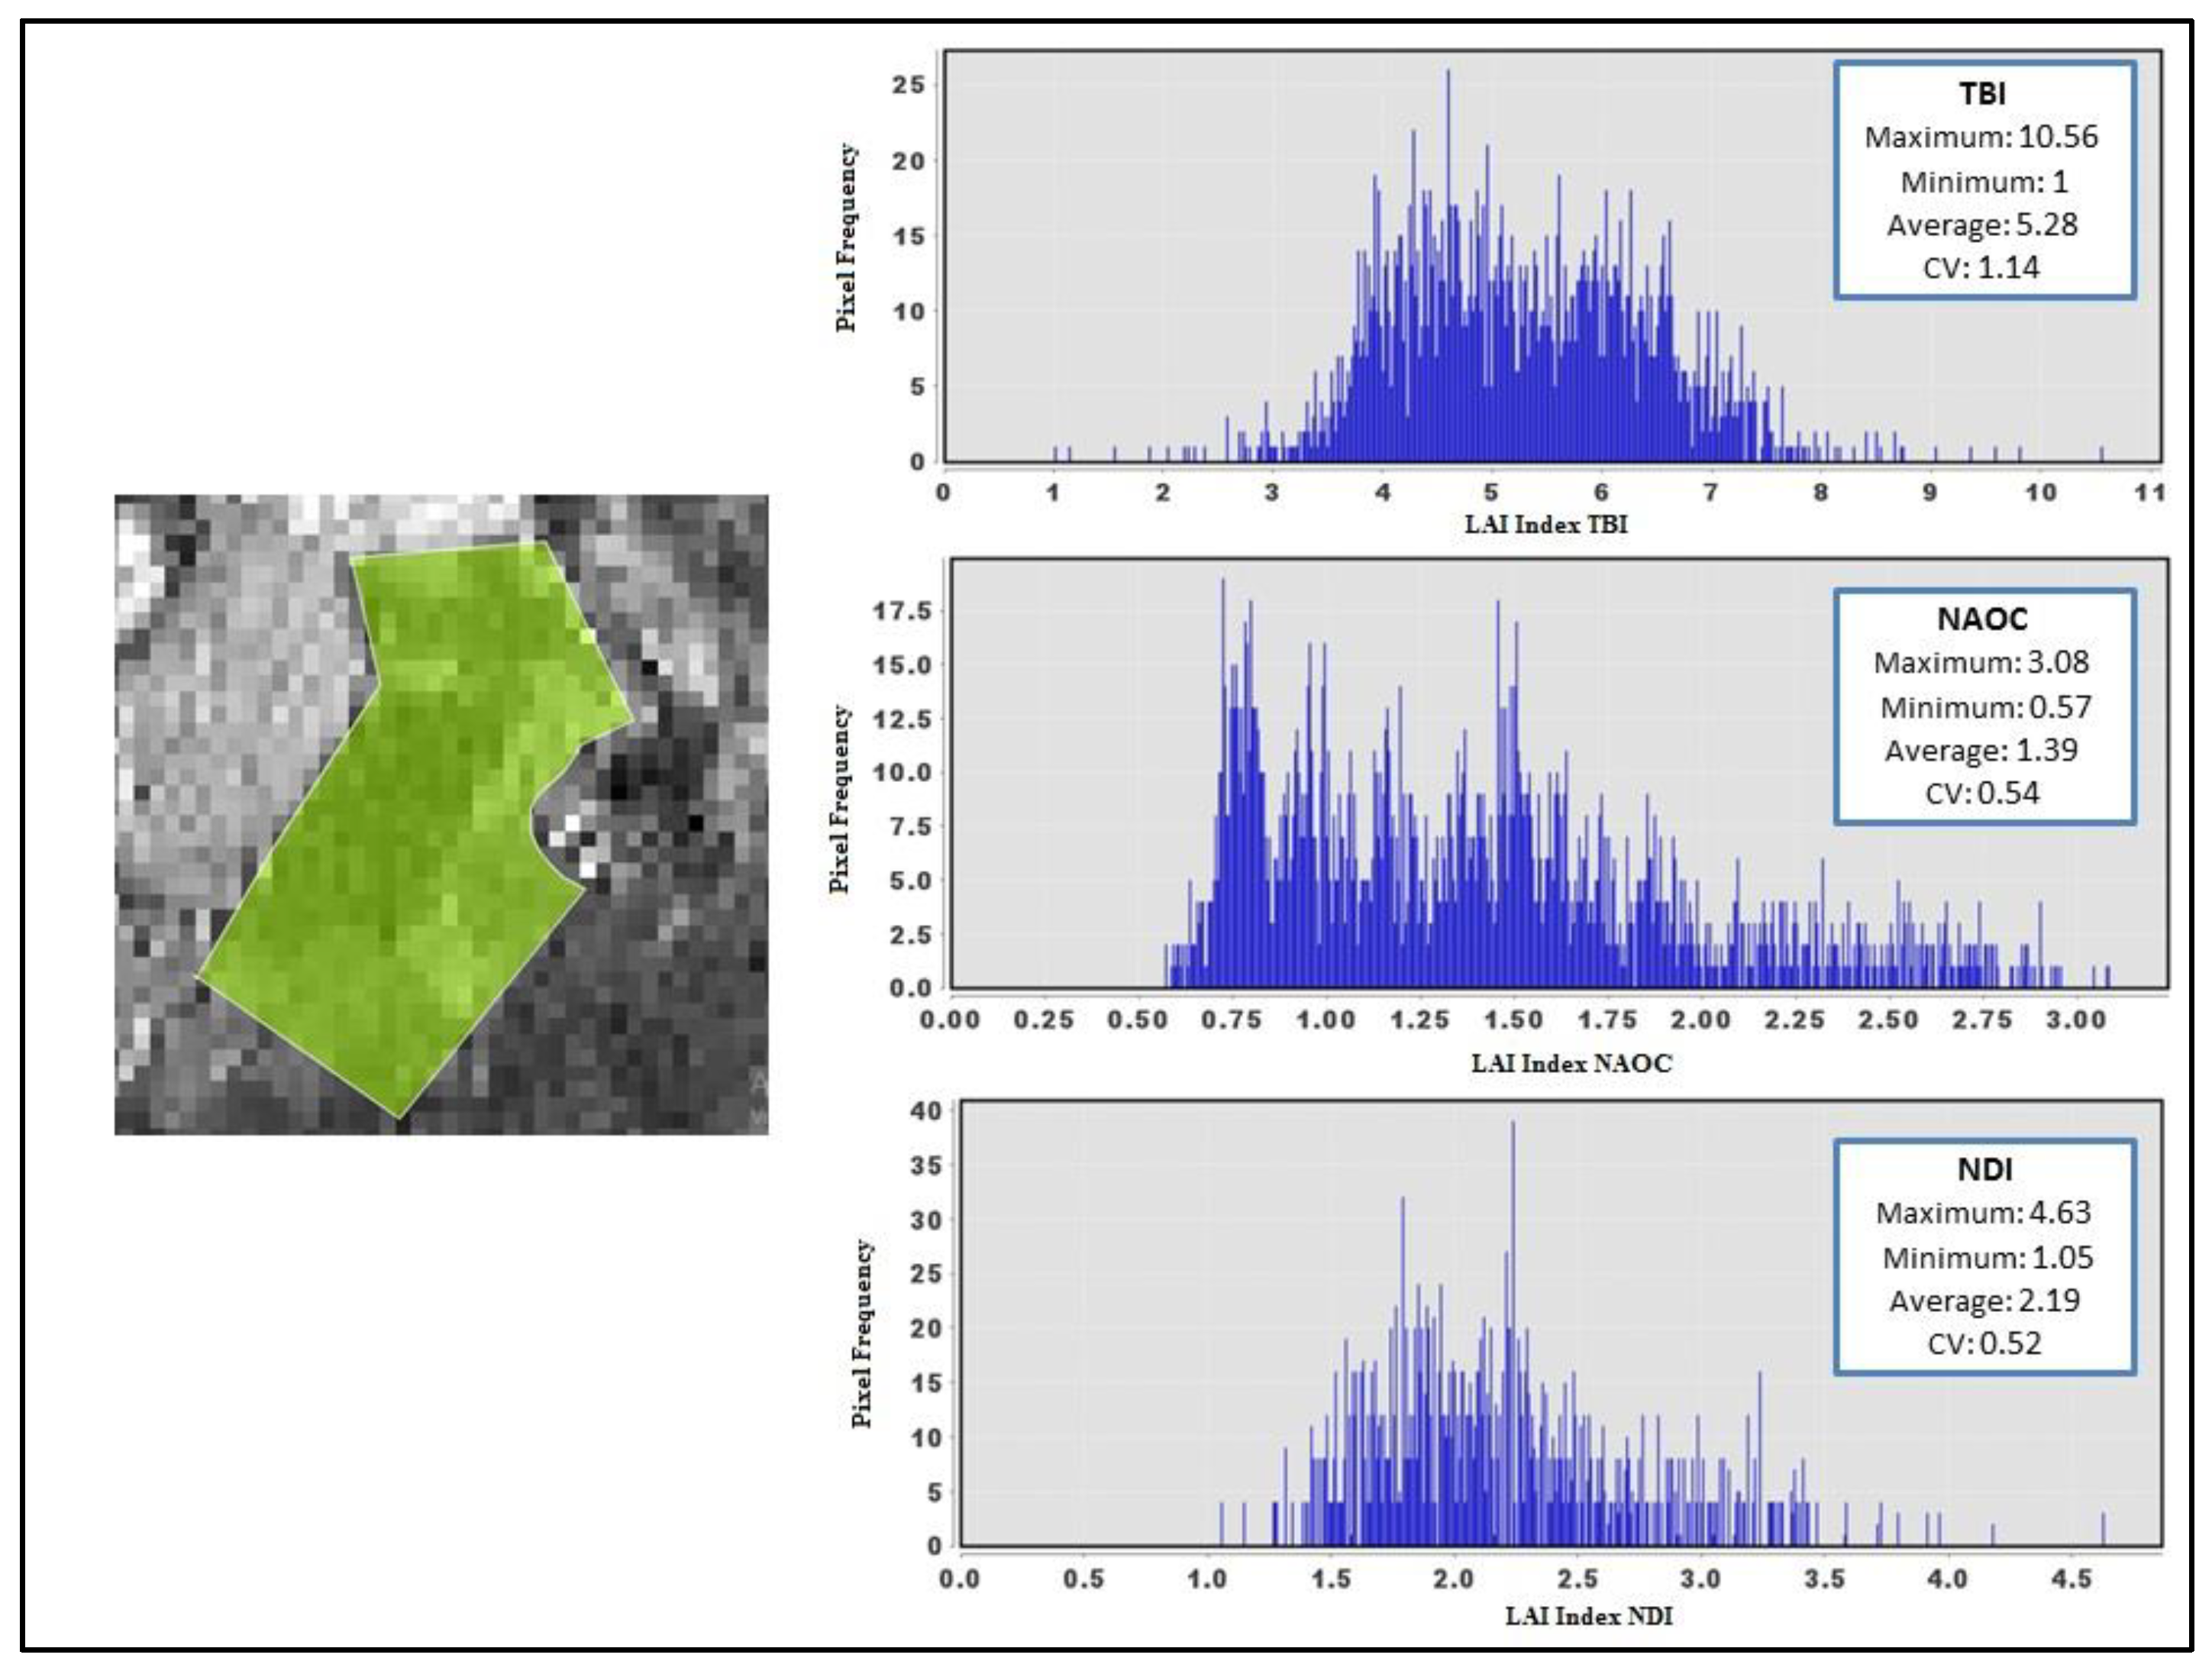
Similar results were obtained for TBI, NAOC, and NDI. However, for a better evaluation of these index performances, a Region of Interest (ROI) was built in the area of Piatã and Decumbens grasslands, containing 512 pixels, to evaluate the value distribution obtained for all pixels through the vegetation indices equations (2, 3 and 4). Figure 12 displays the histograms of the three indices studied, comparing the values obtained for the LAI variable and the number of repetitions for each value (histogram) of LAI in the pixels of the ROI performed. The processing of the information was performed through the SNAP software.
The NAOC, NDI, and TBI indices obtained similar results for LAI estimation. In order to discriminate between the indices, the LAI in situ values obtained by Brazilian Agricultural Research Corporation (EMBRAPA) were requested. The EMBRAPA LAI values were estimated using a formula with regression equations derived from in situ LAI and height data from June 2019 to November 2019. The dates do not correspond with those of this study but these LAI data were taken as a reference. According to the EMBRAPA results, they demonstrated that the LAI in the Piatã and Decumbens grassland area ranged between 0 and 4. Consequently, the TBI index was excluded because it gave LAI values between 0 and 10 (Figure 12). Analyzing the statistics of the other two indices, the NAOC was finally selected because it presented better statistics (R2 = 0.57, RMSE = 1.4 m2 m−2, CV = 0.54) than the NDI (R2 = 0.54, RMSE = 1.4 m2 m−2, CV = 0.52).
In order to spatially estimate the LAI and show the contrast in the field area, Equation (3) was applied in the Sentinel-2 image (Figure 13). The spatial resolution of the image used was 20 m due to the bands utilized. The LAI map is very similar to the FNC one (Figure 8), being the edges of system A influenced by the surrounding trees. The LAI values ranged from 0 to 3. The highest LAI values are obtained in systems A and B because of the fertilization process, being the system B the area with lowest LAI values (around 1).

3.2.3. Productivity

Figure 14 shows the regression between the Dall’Olmo (DO) vegetation index and productivity. For this parameter, the correlation with DO index presented higher R2. In this study, the best Sentinel-2 band combination for the DO index was: b1-865; b2-783; b3-740. The generated model produces a R2 = 0.54, RMSE = 1800 kg ha−1 and a p-value ≤ 0.01, with an exponential fitting. Thus, productivity can be calculated applying Equation (5) on Sentinel-2 image, as follows:
Productivity   ( kg   ha 1 ) = 218.6 × e 7.52 × R 865 × ( 1 R 783 1 R 740 )  
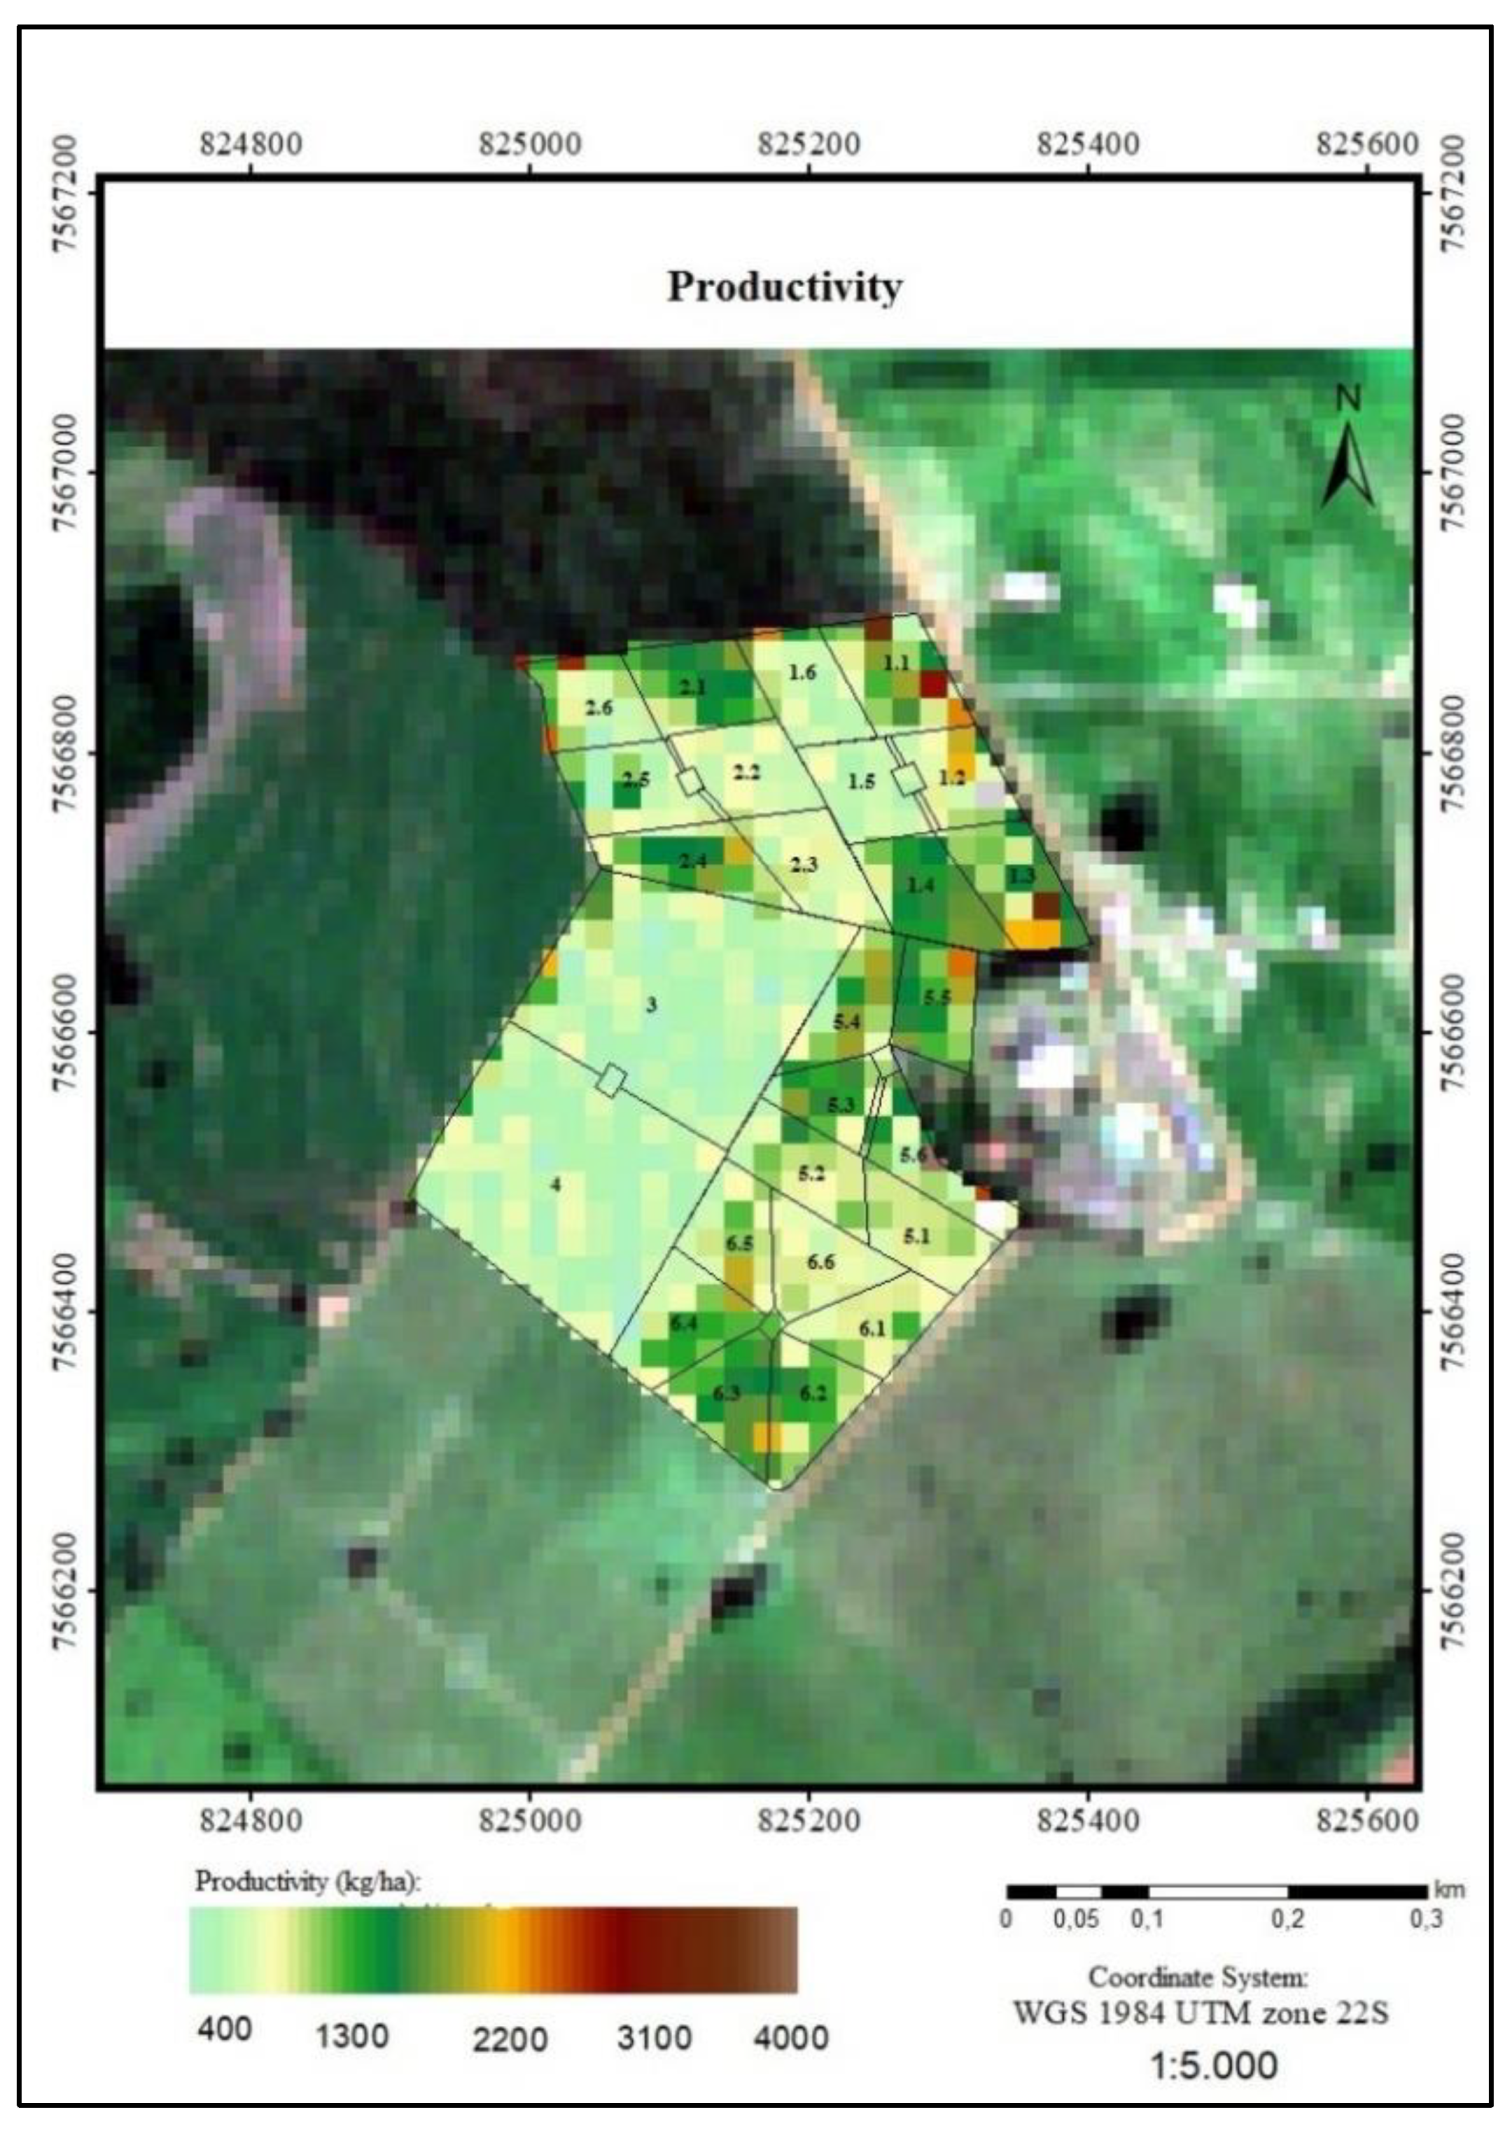
In order to spatially estimate productivity parameter, Equation (5) was applied in the Sentinel-2 image over Piatã and Decumbens grassland area (Figure 15).
The spatial resolution of the image bands showed in Figure 15 was 20 m. The forage biomass values found for the entire area ranged from 400 kg ha−1 to 4000 kg ha−1. In general, we can observe that for the systems that received fertilization (A and C), the highest productivity values were obtained. Moreover, the paddocks (mainly, 1.1 and 1.3, and paddock 2.6) seemed influenced by the surrounding trees in system A. Without concrete field validation, uncertainty of the estimations cannot be provided, but low to medium productivity values were retrieved for the areas in the experimental site.

4. Discussion

A fundamental issue in biophysical parameters estimation via vegetation indices, is the lack of a generally applicable index for various vegetation types. N directly interferes in the chlorophyll content and, consequently, in its spectral characteristics and in the variables that compose the final productivity. However, for the correct use of remote sensing in the monitoring of the Panicum maximum cv. ‘Mombasa’ and Uroclhoa brizantha cv. ‘Marandu’, a more detailed knowledge of its spectral behavior is still necessary.

4.1. Foliar Nitrogen Content (FNC)

We observed that our technique was sensitive to detect FNC discriminations in pastures under different conditions of fertilization, management and regrowth time (Figure 7 and Figure 8). The estimated FNC values found for the Piatã and Decumbens grasslands ranged from 68 g kg−1 to 100 g kg−1, being a result according to the amount of N applied to this area (180 kg ha−1 dose of N, from November 2017 to May 2018).
A comparison of 61 vegetation indices used for N estimation in rice areas was carried out by Tian et al. [42], reporting that improved TBIs produce better results than existing TBIs for N estimation in rice areas. Pacheco-Labrador et al. [48] also studied the performance of 82 vegetation indices for the Mediterranean Quercus ilex tree and determined for N prediction that the proposed TBIs also improved the results. However, their studies showed that these vegetation indices are sensitive to specific vegetation species, growth stages and study areas. This evidence can explain why the bands selected by ARTMO software for the two tropical grassland varieties studied are different from those cited by Tian et al. [42] in Table 3.
Bands in the VIS region generally correlate well with N content due to the correlation with photosynthetic pigments and their absorbance [49]. These pigments, found in chloroplasts, are chlorophyll (65%), xanthophyll (29%) and carotenes (6%). Within the absorption bands, there are two bands centered approximately at 480 nm possibly due to the presence of carotenes, and at 680 nm, related to the chlorophyll content. There is also a peak of reflectance around 550 nm, corresponding to the green region of the spectrum [50]. The index selected in this study for FNC retrieval indicates the importance of the blue band, with an increase in blue reflectance leading to an increase in FNC of the tropical fodder (b1-490; b2-665; b3-560). Interestingly, the blue band is not often used in N studies, in contrast to the red-edge bands which are correlated to chlorophyll content [22].
On the other hand, this study obtains the different values of FNC for the systems A, B, and C. The FNC values found for the entire area ranged from 68 g kg−1 to 100 g kg−1. In general, it can be observed that in the fertilized A and C systems, the paddocks in the pre-grazing stage had the highest FNC values, about 100 g kg−1. Due to, in the beginning of the pre-grazing stage (around 30 days of growth), the amount of biomass is higher and, therefore, the N content is also higher. The system B did not receive N fertilization and presented the lowest FNC values, ranging between 68 and 80 g kg−1.
Local FNC differences in the experimental area can possibly be devoted to management practices or environmental conditions of the field. For example, in system A, paddocks 1.1, 1.2, and 1.3, trees were present on the sideline of the area providing shade and, for this reason, neighboring pixels inside these areas probably presented higher values of FNC. Moreover, the paddocks 1.1 and 2.1 are in the pre-paste stage (growing for 27 days) and the pixels in these areas have a higher values of coloration when compared to the paddocks 1.2, 2.2, and 1.3, 2.3, showing a better vegetative intensity due to the higher biomass (longer growth time) and N content resulting from the past system fertilization [51]. Concerning paddocks 1.2, 2.2 and 1.3, 2.3, in the pixel coloring is similar although paddock 1.2, 2.2 is in growth stage (growing for 9 days) and paddock 1.3, 2.3 is in post grazing stage (growing for 3 days). The regrowth of pastures after defoliation at this time (April) is slower and the difference in the growth period (only 6 days) of the paddocks should not have been sufficient to promote difference within the image. Moreover, the growth rate of the forage grasses soon after pasture is related to the intensity of defoliation and is usually lower at the beginning of the sprouting [52].

4.2. Leaf Area Index

LAI is an important parameter of the plant canopy, as it is intrinsically linked to the capacity to intercept photosynthetic active radiation and, therefore, correlated with photosynthesis [47]. The red-edge region, indicating the contrast between high absorption in the red and high scattering in the far-red by leaves from vegetation, is commonly used for the remote estimation of LAI parameter [53]. However, due to absorption saturation in the red region [54], a far-red is also sometimes chosen as sensitive band. For example, Sentinel-2 LAI Index (SeLI) is a normalized index that uses the 705 and 865 nm centered bands, exploiting the red-edge region for low-saturating absorption sensitivity to photosynthetic vegetation [38]. In this study, the best combinations of bands for LAI estimations were obtained with bands located at red-edge and NIR regions, i.e., 740 and 783 nm. Figure 13 shows that LAI values found for the entire area ranged between 1 and 3. Only system B (no N fertilization) presented lower LAI values (around 1), when compared to the two other systems (A and C).
The finally selected vegetation indices to estimate LAI parameter was the NAOC index, which is based on the calculation of the area over the reflectance curve, determined from the integral of the red–near-infrared interval. Several authors have shown that exploiting a contiguous reflectance curve instead of using a few single bands sensitive to biophysical variables tend to be more promising to obtain good biophysical parameter retrieval results [55,56,57].

4.3. Productivity

Several studies demonstrate that narrowband vegetation indices can be crucial in providing essential and potential information to quantify biochemical or biophysical characteristics of vegetation [58,59]. Analyzed the responses of Tifton 85 grass (Cynodon spp.) to N fertilization using vegetation indices calculated from multispectral images, Simões et al., [60] obtained that the best rates to estimate productivity were NDI and Green Coverture Index (GCI). Tong et al., [61] studied C3 and C4 type grasses in China and found high correlations between productivity vegetation indices and bands located in VIS and NIR region. The best results observed by the authors for productivity estimation were obtained for the indices with three bands, being b1-711; b2-582; b3-718 (R2 = 0.730).
Here, the Dall’Olmo (DO) vegetation index were applied with best performing bands in the red-edge and NIR (740-783-865) spectral areas, showing that the productivity estimation was sensitive to detect differences in productivity in pastures under different conditions of fertilization, management and regrowth time (Figure 15). In general, we can observe that for the systems that received fertilization (A and C), the highest productivity values (2000 kg ha−1) were obtained. The unfertilized system B was under continuous manning, presenting lower forage biomass at the time of evaluation (800 kg ha−1) compared to the fertilized systems managed under rotational management. The lower fertilization in system B was also indicated by lower FNC values (Figure 6) showing consistent results between the retrieval of biophysical parameters based on different spectral bands.

5. Conclusions

Biomass productivities clearly range according to the N doses within a controlled fertilization field set-up used for spectral calibration of biophysical parameters. Based on multiple harvesting cuts, this experiment allowed us to gather a strong dataset for the development of the parameter retrieval equations, while at the same time allowed us to see the impact on fertilization (without grazing) for two species. In the case of the Mombasa cultivar, the recommended dose would be 75 kg ha−1 since it was the one that provided the highest productivity (23.3 tn ha−1). For the Marandu cultivar, the recommended dose, according to this study, would be between 50 kg ha−1 cycle−1 and 75 kg ha−1 cycle−1, since its productivities obtained similar performances, being 15.6 tn ha−1 for the 50 kg ha−1 cycle−1 and 16.8 tn ha−1 for the 75 kg ha−1 cycle−1. The recommendations in this article regarding N dosage are about ideal irrigation conditions.
In situ measured parameters combined with field spectroscopy allowed us to establish the best vegetation index applicable to the Sentinel-2 band settings for essential biophysical parameters retrieval for grassland species. From the four variables studied, three produced good statistics (FNC, productivity and LAI) and consistently showed the effect of fertilization and pasture management on the amount of biomass increases, productivity and LAI values. N fertilizers influence the characteristics of the canopy and its reflectance. The FNC obtained the best correlation for the TBI index with a R2 of 0.38 and RMSE of 3.4 g kg−1. For the productivity parameter, the best index found was the DO with (R2 = 0.54, RMSE = 1800 kg ha−1) and for the LAI, the best index was the NAOC (R2 = 0.57, RMSE = 1.4 m2 m−2). It was possible to observe that the data obtained through the Sentinel-2 satellite can contribute to the estimation of biophysical parameters in large areas and at high spatial resolution demonstrating local variation within the fields. Hereby it is shown that values of FNC, productivity and LAI, respectively, estimated from different bands in different spectral regions (VIS, red-edge and NIR), consistently showed high values in the areas of higher N fertilization, demonstrating the high potential of the different Sentinel-2 bands in agricultural monitoring for management purposes. Future studies should consider the validation of image satellite data with data obtained in the field and the systematic application of the methodology in a time-series approach.

Author Contributions

A.C. and P.F. designed the field campaigns; A.C. collected in situ multi-crop data, A.C., P.M., G.B. and S.F.N. analyzed the data and obtained the results; A.C., N.P. and S.V.W. wrote the paper; A.C. and P.F. proposed the general objectives and goals of the research, designed the methodology and supervised all the procedure. All authors have read and agreed to the published version of the manuscript.

Funding

This research received no external funding.

Acknowledgments

This work was supported by the pre-doctoral scholarship (14288/2015−1 and 143609−2018−1) of the CNPq (Conselho Nacional de Desenvolvimento Científico e Tecnológico) of the first author, and to FAPESP (Fundação de Amparo a Pesquisa do Estado de São Paulo), for the promotion of research project (2013/22435-9), which this research is part of. We would also like to thank the FLEXL3L4 project funded by the Ministry of Science and Innovation of Spain (RTI2018-098651-B-C51).

Conflicts of Interest

The authors declare no conflict of interest.

References

  1. Martha, G.B.; Alves, E.; Contini, E. Land-saving approaches and beef production growth in Brazil. Agric. Syst. 2012, 110, 173–177. [Google Scholar] [CrossRef] [Green Version]
  2. Parente, L.; Mesquita, V.; Miziara, F.; Baumann, L.; Ferreira, L. Assessing the pasturelands and livestock dynamics in Brazil, from 1985 to 2017: A novel approach based on high spatial resolution imagery and Google Earth Engine cloud computing. Remote Sens. Environ. 2019, 232, 111301. [Google Scholar] [CrossRef]
  3. De Alencar, C.A.B.; Cóser, A.C.; Martins, C.E.; De Oliveira, R.A.; Da Cunha, F.F.; Figueiredo, J.L.A. Altura de capins e cobertura do solo sob adubação nitrogenada, irrigação e pastejo nas estações do ano. Acta Sci.-Agron. 2010, 32, 21–27. [Google Scholar] [CrossRef] [Green Version]
  4. Da Silva, S.C. Fundamentos para o manejo do pastejo de plantas forrageiras dos gêneros Brachiaria e Panicum. In Proceedings of the Simpósio Manejo Estratégico Da Pastagem; Anais; UFV, DZO: Viçosa, Brazil, 2004; pp. 347–386. [Google Scholar]
  5. Zhang, B.; Zhang, L.; Xie, D.; Yin, X.; Liu, C.; Liu, G. Application of synthetic NDVI time series blended from landsat and MODIS data for grassland biomass estimation. Remote Sens. 2016, 8, 10. [Google Scholar] [CrossRef] [Green Version]
  6. Boddey, R.M.; MacEdo, R.; Tarré, R.M.; Ferreira, E.; De Oliveira, O.C.; De, C.; Cantarutti, R.B.; Pereira, J.M.; Alves, B.J.R.; Urquiaga, S. Nitrogen cycling in Brachiaria pastures: The key to understanding the process of pasture decline. Agric. Ecosyst. Environ. 2004, 103, 389–403. [Google Scholar] [CrossRef]
  7. Werner, J.C. Adubacao de Pastagens; Boletim té.; Instituto de Zootecnia: Nova Odessa, Brazil, 1986. [Google Scholar]
  8. Corsi, M.; Nussio, L.G. Manejo do capim-elefante: Correção e adubação do solo. In Simpósio sobre manejo da pastagem; FEALQ: Piracicaba, Brazil, 1993; Volume 10, pp. 87–115. [Google Scholar]
  9. Andrade, A.C.; Miranda, D.; Fonseca, D.A.; Queiroz, D.S.; Salgado, L.T.; Cecon, P.R. Adubaçao nitrogenada e potássica em capim-elefante (Pennisetum purpureum Schum. cv. Napier). Ciência Agrotec. 2003, edição esp, 1643–1651. [Google Scholar]
  10. Da Cunha, C.A.H. Relação Entre Comportamento Espectral, índice de área Foliar e produção de matéria seca em capim Tanzânia submetido a diferentes níveis de irrigação e doses de nitrogênio. Ph.D. Thesis, Universidade de São Paulo, São Paulo, Brazil, 2005. [Google Scholar]
  11. Cunha, O.F.R.; dos Santos, A.C.; de Araújo, L.C.; Ferreira, E.M. PRODUTIVIDADE DO Panicum maximum (MOMBAÇA) EM FUNÇÃO DE DIFERENTES NÍVEIS DE NITROGÊNIO. Rev. FZVA 2010, 17, 136–145. [Google Scholar]
  12. Fagundes, J.L.; Moreira, A.L.; de Freitas, A.W.P.; Henrichs, R.; Rocha, F.C. Forage production of Tifton 85 fertilized with nitrogen and subjected to continuous stocking. Rev. Bras. Saúde Prod. Anim. 2012, 13, 306–317. [Google Scholar] [CrossRef]
  13. Bruno, A.; Oliveira, B.; Andrade, A.C.; Magalhães, J.A.; Rodrigues, H.N.; Mehl, H.U.; José, F.; Santos, D. Produtividade do Capim-Digitária (Digitaria spp.) sob Diferentes Doses de Nitrogênio; Embrapa Meio-Norte: Guarapuava-PR, Brazil, 2015; Volume 9. [Google Scholar]
  14. Region, A.J.; Grande, R.; Sul, D. Determinação de Teores de Nitrogênio Foliar em Azevém (Lolium multiflo-rum Lam.); Nativo na Região do Alto Jacuí: Rio Grande Do Sul, Brazil, 2015. [Google Scholar]
  15. Foster, A.J.; Kakani, V.G.; Ge, J.; Gregory, M.; Mosali, J. Discriminant analysis of nitrogen treatments in switchgrass and high biomass sorghum using leaf and canopy-scale reflectance spectroscopy. Int. J. Remote Sens. 2016, 37, 2252–2279. [Google Scholar] [CrossRef]
  16. De Morais, L.F.; de Carvalho, C.A.B.; Anjos, A.N.A.; Viegas, C.R.; da Silva, P.H.F. Avanços na avaliação de pastagens cultivadas com forrageiras tropicais no Brasil. Braz. J. Appl. Technol. Agric. Sci. 2018, 11, 125–136. [Google Scholar]
  17. Salimon, C.; Anderson, L. How strong is the relationship between rainfall variability and Caatinga productivity? a case study under a changing climate. Ann. Braz. Acad. Sci. 2017, 90, 2121–2127. [Google Scholar] [CrossRef]
  18. Sudduth, K.A.; Drummond, S.T.; Kitchen, N.R. Operational characteristics of commercial crop canopy sensors for nitrogen application in maize. In Precision Agriculture; Stafford, J.V., Ed.; Wageningen Academic Publishers: Columbia, MO, USA, 2015; pp. 51–58. [Google Scholar]
  19. Molin, J.P.; Amaral, L.R.; Colaço, A. Agricultura de Precisão; Oficina de Textos: São Paulo, Brazil, 2015. [Google Scholar]
  20. Colombo, R.; Bellingeri, D.; Fasolini, D.; Marino, C.M. Retrieval of leaf area index in different vegetation types using high resolution satellite data. Remote Sens. Environ. 2003, 86, 120–131. [Google Scholar] [CrossRef]
  21. Gitelson, A.A.; Viña, A.; Ciganda, V.; Rundquist, D.C.; Arkebauer, T.J. Remote estimation of canopy chlorophyll content in crops. Geophys. Res. Lett. 2005, 32, 1–4. [Google Scholar] [CrossRef] [Green Version]
  22. Clevers, J.G.P.W.; Gitelson, A.A. Remote estimation of crop and grass chlorophyll and nitrogen content using red-edge bands on Sentinel-2 and -3. Int. J. Appl. Earth Obs. Geoinf. 2013, 23, 334–343. [Google Scholar] [CrossRef]
  23. Gnyp, M.L.; Bareth, G.; Li, F.; Lenz-Wiedemann, V.I.S.; Koppe, W.; Miao, Y.; Hennig, S.D.; Jia, L.; Laudien, R.; Chen, X.; et al. Development and implementation of a multiscale biomass model using hyperspectral vegetation indices for winter wheat in the North China Plain. Int. J. Appl. Earth Obs. Geoinf. 2014, 33, 232–242. [Google Scholar] [CrossRef]
  24. Gianquinto, G.; Orsini, F.; Fecondini, M.; Mezzetti, M.; Sambo, P.; Bona, S. A methodological approach for defining spectral indices for assessing tomato nitrogen status and yield. Eur. J. Agron. 2011, 35, 135–143. [Google Scholar] [CrossRef]
  25. Kooistra, L.; Clevers, J.G.P.W. Estimating potato leaf chlorophyll content using ratio vegetation indices. Remote Sens. Lett. 2016, 7, 611–620. [Google Scholar] [CrossRef] [Green Version]
  26. Vincini, M.; Amaducci, S.; Frazzi, E. Empirical estimation of leaf chlorophyll density in winter wheat canopies using Sentinel-2 spectral resolution. IEEE Trans. Geosci. Remote Sens. 2014, 52, 3220–3235. [Google Scholar] [CrossRef]
  27. Baret, F.; Guyot, G. Potentials and limits of vegetation indices for LAI and APAR assessment. Remote Sens. Environ. 1991, 35, 161–173. [Google Scholar] [CrossRef]
  28. Glenn, E.P.; Huete, A.R.; Nagler, P.L.; Nelson, S.G. Relationship between remotely-sensed vegetation indices, canopy attributes and plant physiological processes: What vegetation indices can and cannot tell us about the landscape. Sensors 2008, 8, 2136–2160. [Google Scholar] [CrossRef] [Green Version]
  29. Van Wittenberghe, S.; Verrelst, J.; Rivera, J.P.; Alonso, L.; Moreno, J.; Samson, R. Gaussian processes retrieval of leaf parameters from a multi-species reflectance, absorbance and fluorescence dataset. J. Photochem. Photobiol. B Biol. 2014, 134, 37–48. [Google Scholar] [CrossRef]
  30. Mulla, D.J. Twenty five years of remote sensing in precision agriculture: Key advances and remaining knowledge gaps. Biosyst. Eng. 2013, 114, 358–371. [Google Scholar] [CrossRef]
  31. Drusch, M.; Del Bello, U.; Carlier, S.; Colin, O.; Fernandez, V.; Gascon, F.; Hoersch, B.; Isola, C.; Laberinti, P.; Martimort, P.; et al. Sentinel-2: ESA’s Optical High-Resolution Mission for GMES Operational Services. Remote Sens. Environ. 2012, 120, 25–36. [Google Scholar] [CrossRef]
  32. Santos, H.G.; Jacomine, P.K.T.; Anjos, L.H.C.; Oliveira, V.Á.D.; Lumbreras, J.F.; Coelho, M.R.; de Almeida, J.A.; Cunha, T.J.F.; de Oliveira, J.B. Sistema Brasileiro de Classificação de Solos, 3rd ed.; Embrapa: Brasilia, Brazil, 2013. [Google Scholar]
  33. Kottek, M.; Grieser, J.; Beck, C.; Rudolf, B.; Rubel, F. World Map of the Köppen-Geiger climate classification updated. eschweizerbartxxx Meteorol. Zeitschrift 2006, 15, 259–263. [Google Scholar] [CrossRef]
  34. Malavolta, E.; Vitti, G.C.; de Oliveira, S.A. Avaliação do estado nutricional das plantas: Principios e aplicações, 3rd ed.; Associação Brasileira para Pesquisa da Potassa e do Fosfato: Piracicaba, Brazil, 1988. [Google Scholar]
  35. Louis, J.; Debaecker, V.; Pflug, B.; Main-knorn, M.; Bieniarz, J. Sentinel-2 Sen2Cor: L2A processor for users. In Proceedings of the Living Planet Symposium 2016, Prague, Czech Republic, 9–13 May 2016; Volume 2016. [Google Scholar]
  36. Verrelst, J.; Romijn, E.; Kooistra, L. Mapping vegetation density in a heterogeneous river floodplain ecosystem using pointable CHRIS/PROBA data. Remote Sens. 2012, 4, 2866–2889. [Google Scholar] [CrossRef] [Green Version]
  37. Rivera, J.P.; Verrelst, J.; Delegido, J.; Veroustraete, F.; Moreno, J. On the semi-automatic retrieval of biophysical parameters based on spectral index optimization. Remote Sens. 2014, 6, 4927–4951. [Google Scholar] [CrossRef] [Green Version]
  38. Pasqualotto, N.; Delegido, J.; Van Wittenberghe, S.; Rinaldi, M.; Moreno, J. Multi-crop green LAI estimation with a new simple sentinel-2 LAI index (SeLI). Sensors (Switzerland) 2019, 19, 904. [Google Scholar] [CrossRef] [Green Version]
  39. Snee, R. Validation and regression models: Methods and examples. Technometrics 1977, 19, 415–428. [Google Scholar] [CrossRef]
  40. Delegido, J.; Alonso, L.; González, G.; Moreno, J. Estimating chlorophyll content of crops from hyperspectral data using a normalized area over reflectance curve (NAOC). Int. J. Appl. Earth Obs. Geoinf. 2010, 12, 165–174. [Google Scholar] [CrossRef]
  41. Rouse, J.; Haas, R.; Schell, J.; Deering, D. Monitoring vegetation systems in the Great Plains with ERTS. In Proceedings of the 3rd Earth Resources Technology Satellite-1 Symposium; National Aeronautics and Space Administration: Washington, DC, USA, 1973; pp. 309–317. [Google Scholar]
  42. Tian, Y.C.; Yao, X.; Yang, J.; Cao, W.X.; Hannaway, D.B.; Zhu, Y. Assessing newly developed and published vegetation indices for estimating rice leaf nitrogen concentration with ground- and space-based hyperspectral reflectance. F. Crop. Res. 2011, 120, 299–310. [Google Scholar] [CrossRef]
  43. Gower, J.F.R. Observations of in situ fluorescence of chlorophyll-a in Saanich Inlet. Boundary-Layer Meteorol. 1980, 18, 235–245. [Google Scholar] [CrossRef]
  44. Dall’Olmo, G.; Gitelson, A.A.; Rundquist, D.C. Towards a unified approach for remote estimation of chlorophyll-a in both terrestrial vegetation and turbid productive waters. Geophys. Res. Lett. 2003, 30, 8–11. [Google Scholar] [CrossRef] [Green Version]
  45. Bayma-silva, G.; Santos, P.M. Protocolo de campo para investigação, calibração e validação de métodos para estimativa de massa de forragem baseados em sensoriamento remoto orbital e proximal de forragem baseados em sensoriamento remoto orbital e proximal 1; Embrapa Informática Agropecuária: Campinas, SP, Brazil, 2019; Volume 133. [Google Scholar]
  46. da Silva, R.F.; de Fátima Guimarães, M.; de Aquino, A.M.; Mercante, F.M. Análise conjunta de atributos físicos e biológicos do solo sob sistema de integração lavoura-pecuária. Pesqui. Agropecu. Bras. 2011, 46, 1277–1283. [Google Scholar] [CrossRef] [Green Version]
  47. Asrar, G.; Kanemasu, E.T.; Jackson, R.D.; Pinter, P.J. Estimation of total above-ground phytomass production using remotely sensed data. Remote Sens. Environ. 1985, 17, 211–220. [Google Scholar] [CrossRef]
  48. Pacheco-Labrador, J.; González-Cascón, R.; Pilar Martín, M.; Riaño, D. Understanding the optical responses of leaf nitrogen in mediterranean holm oak (Quercus ilex) using field spectroscopy. Int. J. Appl. Earth Obervation Geoinf. 2014, 26, 105–118. [Google Scholar] [CrossRef] [Green Version]
  49. Novo, E.M.L. Sensoriamento Remoto: Principios e Aplicações, 4th ed.; Blücher, E., Ed.; Blusher: São Paulo, Brazil, 2010; ISBN 9788521205401. [Google Scholar]
  50. Rosa, R. Introdução ao Sensoriamento Remoto, 7th ed.; EDUFU, Ed.; EDUFU: Uberlândia, Brazil, 2009; ISBN 9788570781246. [Google Scholar]
  51. Abrahão, S.A.; De Assis, F.; Pinto, D.C.; Queiroz, D.M. Índices de vegetação de base espectral para discriminar doses de nitrogênio em capim-tanzânia Vegetation spectral indices to discriminate nitrogen rates in tanzania grass. Rev. Bras. Zootec. 2009, 38, 1637–1644. [Google Scholar]
  52. Parsons, A.J.; Chapman, D.F. The principles of pasture growth and utilization. In Grass: Its Production and Utilization; Hopkins, A., Holmes, W., Eds.; Blackwell Science for the British Grassland Society: Oxford, UK, 2000; ISBN 0632050179. [Google Scholar]
  53. Curran, P.J.; Dungan, J.L.; Gholz, H.L. Exploring the relationship between reflectance red edge and chlorophyll content in slash pine. Tree Physiol. 1990, 7, 33–48. [Google Scholar] [CrossRef] [PubMed]
  54. Kira, O.; Nguy-Robertson, A.L.; Arkebauer, T.J.; Linker, R.; Gitelson, A.A. Informative spectral bands for remote green LAI estimation in C3 and C4 crops. Agric. For. Meteorol. 2016, 218–219, 243–249. [Google Scholar] [CrossRef] [Green Version]
  55. Pasqualotto, N.; Delegido, J.; Van Wittenberghe, S.; Verrelst, J.; Rivera, J.; Moreno, J. Retrieval of canopy water content of different crop types with two new hyperspectral indices: Water Absorption Area Index and Depth Water Index. Int. J. Appl. Earth Obs. Geoinf. 2018, 67, 69–78. [Google Scholar] [CrossRef]
  56. Malenovský, Z.; Ufer, C.; Lhotáková, Z.; Clevers, J.G.P.; Schaepman, M.; Albrechtová, J.; Cudlín, P. A new hyperspectral index for chlorophyll estimation of a forest canopy: Area under curve normalised to maximal band depth between 650 and 725 nm. EARSeL eProceedings 2006, 5, 161–172. [Google Scholar]
  57. Mutanga, O.M.C.; Skidmore, A.K.; Kumar, L.; Ferwerda, J. Estimating tropical pasture quality at canopy level using band depth analysis with continuum removal in the visible domain. Int. J. Remote Sens. 2005, 26, 1093–1108. [Google Scholar] [CrossRef]
  58. Darvishzadeh, R.; Skidmore, A.; Schlerf, M.; Atzberger, C.; Corsi, F.; Cho, M. LAI and chlorophyll estimation for a heterogeneous grassland using hyperspectral measurements. ISPRS J. Photogramm. Remote Sens. 2008, 63, 409–426. [Google Scholar] [CrossRef]
  59. Foster, A.J.; Kakani, V.G.; Mosali, J. Estimation of bioenergy crop yield and N status by hyperspectral canopy reflectance and partial least square regression. Precis. Agric. 2017, 18, 192–209. [Google Scholar] [CrossRef]
  60. Simões, C.R.; Rossiello, R.O.P.; Graciosa, M.G.; Machado, M.L.; Silva, C.F. da Imagens multiespectrais para avaliação de índice de área foliar e massa seca do capim “Tifton 85”, sob adubação nitrogenada. Ciênc. Rural 2015, 45, 697–703. [Google Scholar] [CrossRef] [Green Version]
  61. Tong, X.; Duan, L.; Liu, T.; Singh, V.P. Combined use of in situ hyperspectral vegetation indices for estimating pasture biomass at peak productive period for harvest decision. Precis. Agric. 2019, 20, 477–495. [Google Scholar] [CrossRef]
Figure 1. Experimental area with N treatments for the cultivars Mombasa (M) and Marandu (B) without fertilization (M0/B0), with 25 kg ha−1 cycle (M1/B1), with 50 kg ha−1 cycle (M2/B2) and with 75 kg ha−1 (M3/B3) cycle. The treatments were applied after each harvest cut made, completing seven applications. The sprinkler irrigation system, the blocks and the sampling route followed in the field were also designed for hyperspectral data collection.
Agronomy 10 00711 g001
Figure 2. Distribution of the Piatã and Decumbens grassland, divided into three systems (A, B, C). The management of system A is crop-livestock integration (iCL), system B is an extensive system with continuous grazing method, and system C is intensive under rotated grazing method. Each one has two area repetitions: system A (paddocks 1 and 2), system B (paddocks 3 and 4), and system C (paddocks 5 and 6). Systems A and C are composed of six plots each. The numbers in the graph identify the plots. System B did not receive N, while systems A and C received, in total, 180 kg ha−1, which was applied four times with doses of 45 kg ha−1 for each time.
Agronomy 10 00711 g002
Figure 3. Biomass productivity (“leaf” and “sheath + thatch” biomass components) of Mombasa cultivar with different doses of N.
Agronomy 10 00711 g003
Figure 4. Biomass productivity (“leaf” and “sheath + thatch” biomass components) of Marandu cultivar with different doses of N.
Agronomy 10 00711 g004
Figure 5. Foliar nitrogen content (FNC) values of Mombasa cultivar with different doses of N.
Agronomy 10 00711 g005
Figure 6. FNC values of Marandu cultivar with different doses of N.
Agronomy 10 00711 g006
Figure 7. FNC (g kg−1) graphic representation, as a function of the TBI vegetation index based on Sentinel-2 bands in the Marandu and Mombasa experimental study area.
Agronomy 10 00711 g007
Figure 8. FNC (g kg−1) map with 10 m spatial resolution, estimated from Equation (1) applied on the Sentinel−2 image of 25 April 2018, over Piatã and Decumbens grassland area.
Agronomy 10 00711 g008
Figure 9. Graphic representation of LAI destructively measured (m2 m−2) as a function of the TBI index (Three Band Index) in the Marandu and Mombasa experimental study area.
Agronomy 10 00711 g009
Figure 10. Graphic representation of destructively measured LAI (m2 m−2) as a function of the NAOC vegetation index in the Marandu and Mombasa experimental study area.
Agronomy 10 00711 g010
Figure 11. Graph representation of LAI (m2 m−2) as a function of the NDI index in the experimental Marandu and Mombasa study area.
Agronomy 10 00711 g011
Figure 12. Area of interest (Piatã and Decumbens grassland) and the pixel frequency histogram for the LAI variable, based on the vegetation indices studied: TBI, NAOC, and NDI, showing the minimum, maximum, average and coefficient of variation (CV).
Agronomy 10 00711 g012
Figure 13. LAI (m2 m−2) map with 20 m spatial resolution estimated with Equation (3) applied on the Sentinel-2 image of 25 April 2018, over Piatã and Decumbens grassland area.
Agronomy 10 00711 g013
Figure 14. Biomass productivity as a function of the DO vegetation index in the Marandu and Mombasa experimental study area.
Agronomy 10 00711 g014
Figure 15. Productivity map (kg ha−1) with 20 m spatial resolution, estimated with Equation (2) applied on the Sentinel-2 image of 25 April 2018, over Piatã and Decumbens grassland area.
Agronomy 10 00711 g015
Table 1. Description of experimental treatments for Mombasa (M) and Marandu (B).
CultivarTreatments N (kg ha−1 Cycle) NameDescription
Panicum maximum cv. ‘Mombasa’0M0Control
25M1Lower Dose
50M2Medium Dose
75M3High Dose
Urochloa brizantha cv. ‘Marandu’0B0Control
25B1Lower Dose
50B2Medium Dose
75B3High Dose
Table 2. Sentinel-2 bands settings.
Band NumberMainly FunctionCentral Wavelength (nm)Bandwidth (nm)Spatial Resolution (m)
1Coastal aerosol4432760
2Blue4909810
3Green5604510
4Red6653810
5Vegetation red-edge7051920
6Vegetation red-edge7401820
7Vegetation red-edge7832820
8Near Infrared (NIR)84214510
8aVegetation red-edge8653320
9Water vapor9452660
10Short Wave Infrared (SWIR)-cirrus13807560
11SWIR161014320
12SWIR219024220
Table 3. Generic vegetation indices that were introduced in ARTMO, related to biophysical parameters. Rλ represents the reflectance and λ the wavelength. The generic name of each index has been established in this study.
ReferenceFormula Generic Name AbbreviationGeneric Formula
[41] R 800 R 670 R 800 + R 670 Normalized
Difference Vegetation Index
NDI R 1 R 2 R 1 + R 2
[42]   R 705   R 717 + R 491 .Three Ratio Band IndexTBI   R 1   R 2 + R 3
[43] R 676 0.5 ( R 746 + R 665 ) Difference light HeightDLH R 1 0.5 ( R 2 + R 3 )
[44] R 740 750 × ( 1 R 660 670 1 R 720 730 ) Three Band Dall’OlmoDO R 1 × ( 1 R 2 1 R 3 )
[40] 1 643 795 R λ d λ R 795   × ( 795 643 )   Normalized Area Over reflectance CurveNAOCSame as the original
Table 4. State of development and fertilization of the Piatã and Decumbens grass pasture in the production systems (A, B and C), on 25 April 2018. Corn = areas under maize cultivation in iCL systems; growth = paddocks in regrowth in areas under rotated management; pre-pasture = paddocks just before the animals enter the areas under rotated grazing; grazing = paddocks being grazed by the animals; post-grazing = paddocks soon after the animals leave rotating grazing areas.
SystemsRepetition of the AreaPaddock Fertilization (kg ha−1)CornGrowthPre
Grazing
GrazingPost
Grazing
A11.1180 x
1.2180 x
1.3180 x
1.4180 x
1.5180x
1.6180x
22.1180 x
2.2180 x
2.3180 x
2.4180 x
2.5180x
2.6180x
B330 x
440 x
C55.1180 x
5.2180 x
5.3180 x
5.4180 x
5.5180 x
5.6180 x
66.1180 x
6.2180 x
6.3180 x
6.4180 x
6.5180 x
6.6180 x
Table 5. Results of the best bands obtained from the Sentinel-2 satellite for the different vegetation indices, as a function of the biophysical parameters studied (productivity, FNC, height and leaf area index (LAI)) for Mombasa and Marandu dataset. The best results are shown shaded.
IndexFNC (g/kg)Productivity (kg ha−1)Height (cm)LAI (m2 m−2 or Dimensionless)
NDI   R 443 R 560   R 443 + R 560   R 665 R 443   R 665 + R 443   R 865 R 842   R 865 + R 842   R 783 R 740   R 783 + R 740
R2 = 0.18R2 = 0.37R2 = 0.06R2 = 0.54
TBI   R 490   R 665 + R 560   R 443   R 665 + R 490   R 443   R 665 + R 490   R 740   R 783 + R 665
R2 = 0.38R2 = 0.45R2 = 0.15R2 = 0.56
NAOC 1 ( R 665 × 40 ) + ( R 705 × 35 ) + ( R 740 × 43 ) ( R 783 × 118 )
R2 = 0.13R2 = 0.34R2 = 0.08R2 = 0.57
DLH R 443 0.5 ( R 665 + R 490 ) R 865 0.5 ( R 740 + R 842 )   R 783 0.5 ( R 865 + R 443 ) R 783 0.5 ( R 865 + R 740 )
R2 = 0.28R2 = 0.25R2 = 0.002R2 = 0.42
DO R 443 × ( 1 R 740 1 R 560 ) R 865 × ( 1 R 783 1 R 740 ) R 490 × ( 1 R 865 1 R 842 ) R 783 × ( 1 R 705 1 R 842 )
R2 = 0.24R2 = 0.54R2 = 0.006R2 = 0.40