Article

Mapping Maize Cropping Patterns in Dak Lak, Vietnam Through MODIS EVI Time Series

1
Center for Agricultural Research and Ecological Studies (CARES), Faculty of Environment, Vietnam National University of Agriculture, Trau Quy, Gia Lam, Hanoi 100000, Vietnam
2
Faculty of Agronomy, Vietnam National University of Agriculture, Trau Quy, Gia Lam, Hanoi 100000, Vietnam
3
Department of Natural Resources, Faculty of Geo-Information Science and Earth Observation, University of Twente, P.O. Box 217, 7500 AE Enschede, The Netherlands
4
Department of Agronomy, Kansas State University, 2004 Throckmorton PSC, 1712 Claflin Road, Manhattan, KS 66506-0110, USA
5
Faculty of Agriculture and Forestry, Tay Nguyen University, 567 Le Duan, Buon Ma Thuot 630000, Đak Lak, Vietnam
*
Authors to whom correspondence should be addressed.
Agronomy 2020, 10(4), 478; https://doi.org/10.3390/agronomy10040478
Submission received: 19 February 2020 / Revised: 19 March 2020 / Accepted: 20 March 2020 / Published: 1 April 2020
(This article belongs to the Special Issue Remote Sensing of Agricultural Monitoring)

Abstract

:
Land use maps specifying up-to-date acreage information on maize (Zea mays L.) cropping patterns are required by many stakeholders in Vietnam. Government statistics, however, lag behind by one year, and the official land use maps are only updated at 5-year intervals. The aim of this study was to apply the Savitzky–Golay algorithm to reconstruct noisy Enhanced Vegetation Index (EVI) time series (2003–2018) from Terra Moderate Resolution Imaging Spectroradiometer (MODIS) Vegetation Indices (MOD13Q1) to allow timely detection of changes in maize crop phenology, and then to employ a linear kernel Support Vector Machine (SVM) classifier on the reconstructed EVI time series to prepare the present-day maize cropping pattern map of Dak Lak province of Vietnam. The method was able to specify the spatial extent of areas cropped to maize with an overall map accuracy of 79% and could also differentiate the areas cropped to maize just once versus twice annually. The by-district mapped maize acreage shows a good agreement with the official governmental data, with a 0.93 correlation coefficient (r) and a root mean square deviation (RMSD) of 1624 ha.

1. Introduction

Maize (Zea mays L.) crop has an increasing importance in the economy of Vietnam. According to the latest national statistical survey [1] by 2018 the total maize area cultivated across the country was roughly 1,104,000 hectares, from which close to 10% is located in Dak Lak. Over the past 20 years, the maize cropping area has almost doubled, leaping from 663,000 hectares in 1997 [2]. This increase was mostly driven by the growing demand from some of the largest animal feed, meat [3] and food companies that have been operating in Vietnam since 1986.
In Dak Lak, maize fields are located either on hillslopes or in valleys, depending on the water demand of the crop, which is mostly grown under rainfed conditions. Only soils with high fertility and organic matter are used, due to the economic and terrain difficulties faced by farmers to fertilize crops. Many of the maize fields lie within the boundaries of either forest production land or fallow land, and hence it is crucial for forest management and land administration units to know how these lands are managed by locals and if there is any sign of forest encroachment. It is also important for the government and agroindustry to know where they could expect the most productive maize-producing regions to expand their activities. Most of the time, this information would come from either the official statistical data, which are often not up-to-date and commonly released two years later, or from estimates provided by local agencies.
Traditional methods for estimating cropland areas, such as the census household-based survey or the cadastral ground survey, are very time-consuming and may not reflect the real situation on the ground by the time the data are released. A less cost-and-time consuming and robust method that can provide objective and near real-time monitoring of crop types and their phenology stages is thus in high demand [4,5,6,7]. From remote sensing, the annual cycle of vegetation phenology can be inferred and characterized by four transition dates that define the most important phenological stages of vegetation dynamics at annual time scales [8]. These transition dates are known as green-up, maturity, senescence and dormancy. Today, with the growing development of advantaged technology, earth observation from satellites and other space-borne instruments have provided a spatially explicit and efficient way for cropland monitoring not only at large extents (e.g., regional) but also at local levels (e.g., field plot) [9,10,11].
To map and monitor the cropland at a regional scale, remotely sensed data have to provide wide geographical coverage, high temporal and adequate spatial resolutions, and must be available at minimum cost [12,13]. Extensively used sources of remotely sensed data such as the National Oceanic and Atmospheric Administration (NOAA) for the advanced very high resolution radiometer (AVHRR) and Landsat have some of these characteristics, but neither can meet the requirement for both spatial and temporal coverages, hence they are limited for such purposes [13]. For detailed crop mapping, Landsat Thematic Mapper (TM)/Enhanced Thematic Mapper Plus (ETM+)/Operational Land Imager (OLI) data have demonstrated their suitability [14,15]. In areas where crops are produced over large areas with relatively homogeneous cover and uniform cropping season, Landsat data are a reliable source [16]. In areas where information on crops and cropping seasonality are poor, Landsat might only be able to distinguish cropland from non-cropland [17]. Moreover, one should take into account that in humid tropical regions many crops have only a 3–4 month growing season, during which cloud cover occurs frequently. As a consequence, Landsat data become scarce, and often only few images with less than 10% cloud coverage become available each year. This is not sufficient to detect crop phenology and changes in crop cover [18,19]. Improvement to overcome these disadvantages can be made when Landsat data are combined with other multitemporal sensor data that have a higher revisiting frequency at a larger spatial footprint (i.e., MODIS) and with data with a higher spatial resolution (i.e., Sentinel-2) [20,21,22]. Although with large pixels, AVHRR data have almost daily coverage of the surface of the Earth, which can be used to generate weekly to 10-day maximum value composites, allowing capture of vegetation phenology via the normalized difference vegetation index (NDVI) or similar indices at national [23,24] and global scales [25,26,27,28]. The advantage of AVHRR is its temporal resolution at the cost of a limited spectral and spatial resolution. Its 1-km spatial resolution means that there is a high chance of mixed pixels in agricultural areas with small fields and complex land cover patterns [29,30]. Turner et al. [31] stated that in order to map in detail the variability and complexity of cropland systems at landscape levels, higher resolution than the AVHRR data are required.
MODIS, an abbreviation of the Moderate Resolution Imaging Spectroradiometer, is an instrument on board NASA’s Terra and Aqua spacecraft. MODIS provides daily coverage of the earth surface at 250-m resolution. It offers an opportunity for more detailed monitoring and mapping land use land cover (LULC) covering large territories [32]. Liu et al. [33] used MODIS 8-day Enhanced Vegetation Index (EVI) to map cropping patterns, which were defined by the planting sequence and spatial arrangement of crops by field [34], of Henan province in China for three consecutive years. A threshold-model method was used to retrieve phenological metrics, producing an overall accuracy of approximately 84% in extracting the cropping patterns. Temporal NDVI and EVI from MODIS TERRA provided a successful discrimination in phenology and the ability to map large areas of soybean and maize in the state of Paraná, Brazil for the 2010/2011 and 2011/2012 crop years [35]. Vintrou et al. [36] used a landscape stratification of MODIS MOD13Q1 16-day NDVI time series at 250-m pixel resolution to produce a crop map for Mali. They concluded that the MOD13Q1 NDVI-based method produced a better map, compared to the other global products that were available at that time. Time series of optical remote sensing vegetation index (VI) data are often noisy, due to cloud contamination. To understand crop phenology and cropping season variations through interpreting time series of optical remote sensed VI data, noise-reduction methods to reconstruct those temporal VI data are widely used. Use of filter-based methods that employ a predefined filter to fill the gaps and smooth the multi-temporal data in a local moving window, such as the Savitzky–Golay (SG) filter, are very common [37,38,39,40,41]. The SG filter performs a least-squares-fit over a set of consecutive values within a fixed window by a polynomial of a certain degree [42]. Chen et al. [37] embedded the SG filter into a time series model to reconstruct MVC SPOT-VGT image data of China. They were able to conclude that SG is, although simple, a very robust method to smooth noisy NDVI data and to fill out missing pixel values. A study by Zhou et al. [43] compared the performance of four different remote sensing time series reconstruction methods over space and biome types. He found that for tropical and subtropical regions, the SG approach yielded the best results.
To translate the crop phenological data constructed from VI time series into a cropping pattern map, different classification approaches can be selected, following either an unsupervised or a supervised approach. The Support Vector Machine (SVM) classification algorithm is a supervised approach where samples must be taken to train the VI time series. An SVM network is a learning machine for two-group classification problems [44]. An SVM classifies data by finding the best hyperplane that separates all data points of one class from those of the other class. Foody and Mathur [45] used discriminant analysis, decision tree, feed forward neural network and SVM algorithms to classify crop types in a village in eastern England from airborne thematic mapper imagery. They found that of the four algorithms, SVM provided the best overall classification accuracy for mapping winter–spring crops. A similar conclusion concerning SVM classification accuracy was drawn from a study conducted in England and Spain by Pal and Mather [46]. They compared SVM with artificial neural network and maximum likelihood algorithms and showed that the SVM achieves a higher degree of classification precision than either the machine learning (ML) or the artificial neural network (ANN) classifier, and that the SVM can be used with limited training datasets and high-dimensional data.
In Dak Lak, due to the complexity of the landscape and the recent intensification of practiced cropping systems, and the absent of any prior maize cropping patterns map, we applied the SG filter on MODIS Terra MOD13Q1 Enhanced Vegetation Index (EVI) data to reconstruct the temporal EVI data and employed the SVM classification system on the SG smoothed-and-gap filled EVI time series to identify maize cropping patterns.

2. Materials and Methods

2.1. Study Area

Dak Lak province is located centrally within the Central Highlands region of Vietnam and is also known as Tay Nguyen (Figure 1). The region includes 5 provinces of Lam Dong, Dak Nong, Dak Lak, Gia Lai and Kon Tum. Of these 5 provinces, Dak Lak is the largest and is famous for its production of Robusta coffee, tropical fruits and some major commodity crops such as maize, sweet potato (Ipomoea batatas), cassava (Manihot esculenta) and sugarcane (Saccharum officinarum). Dak Lak is also the largest rice (Oryza sativa) producing province in the region. The province is divided into 14 districts of which the largest is Ea Sup and the smallest is Buon Ho.
The region has a tropical savanna climate with two distinctive seasons, one rainy season (from May to October) and the other dry (from November to April). The annual daily average temperature in Dak Lak is 24.3 °C. The total annual precipitation is about 1688 mm. The driest month is January when the total average rainfall is only 3 mm, making it impossible to grow any rainfed crop. The wettest month is August, receiving a total average of 300 mm of rain.
The cropping seasons for most annual crops start at the end of March or during April. Their cropping season lengths vary between 4 and 10 months. There are two cropping seasons for maize each year. The first maize crop is sown commonly in April and harvested in August. The second crop is sown around mid-August and harvested from mid-December until mid-January of the following year.

2.2. Data

2.2.1. Secondary Data

The official statistics of 2018 were available to the public by the end of 2019. These data were collected from the Department of Agriculture and Rural Development in Buon Ma Thuot, Dak Lak, Vietnam, and were served as a comparison data source to the mapped maize acreage using MODIS imagery. The statistics are available only at the district level and simply provide the total cultivated maize acreage for each district. According to these data, the total cultivated maize acreage of the whole province was 100,030 hectares.
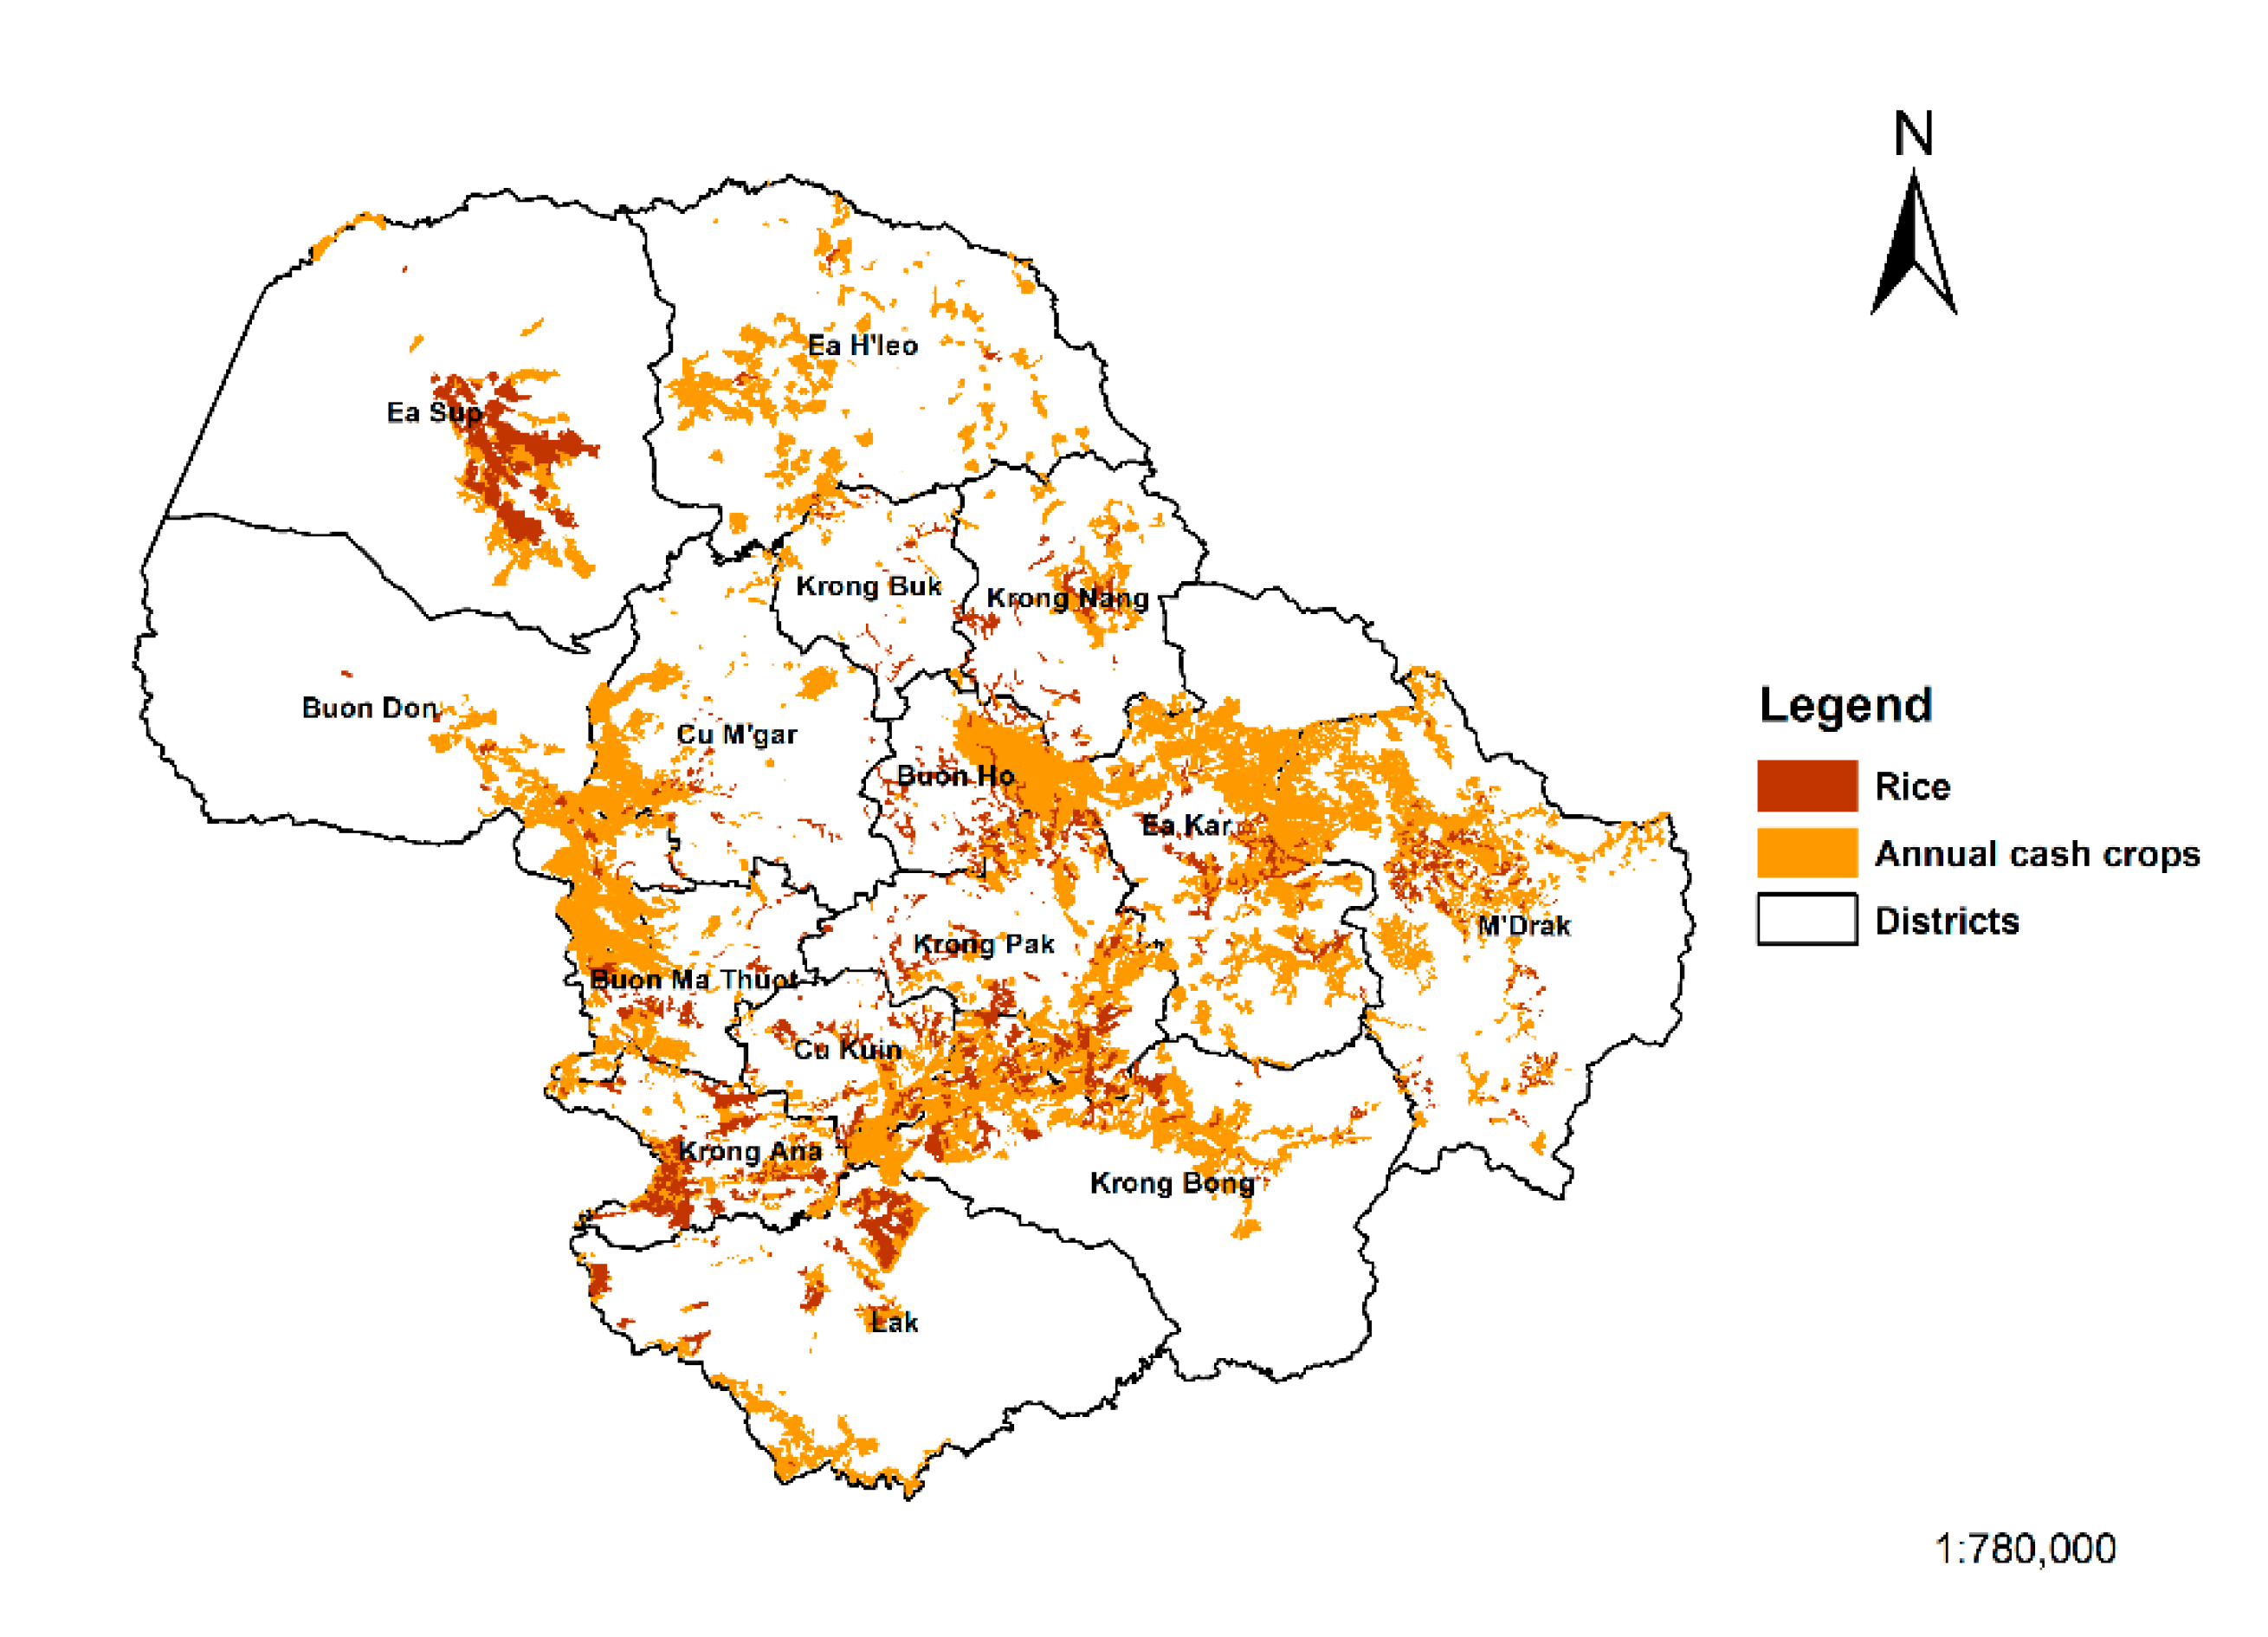
The most updated land use distribution map, which is the official 2015 land use map, was collected from the General Department of Land Administration in Hanoi, Vietnam. This map (Figure 2) has for us only one relevant land use category named ‘annual cash crops’; it includes cultivated maize in addition to several other cash crops. The relevant comparison was between the spatial distribution of our maize cropping patterns map with the distribution of ‘annual cash crops’ as presented in the official 2015 map.

2.2.2. MODIS MOD13Q1 EVI

MODIS MOD13Q1 data version 6 (MOD13Q1.006) were downloaded for the time period between 2003 and 2018. MOD13Q1 is a 16-day global product at a 250-m resolution, which offers both NDVI and EVI data. These are computed from atmospherically-corrected bi-directional surface reflectance that have been masked for water, clouds, heavy aerosols and cloud shadows [47]. As stated by Didan [47], the EVI is an improvement over the NDVI because it minimizes canopy background variations and maintains sensitivity over dense vegetation conditions. The EVI also uses the blue band to remove residual atmospheric contamination caused by smoke, sub-pixel thin cloud and haze.
MOD13Q1 EVI and pixel reliability were extracted and organized per-year separately prior to SG algorithm processing. Pixel reliability is a quality control index, providing pixel quality as a ranking system with 8-bit integer values stretching from −1 to 3. Only pixels with the summary Quality Assurance (QA) stated as ‘good’ were used, while all others were eliminated as unsuitable. The MOD13Q1 EVI data was pre-processed in Interactive Data Language (IDL) programming.

2.2.3. Field Survey Data

A field survey was conducted in December 2018. In total, 1544 crop fields were visited during the survey. All the fields were chosen based on the information obtained through various discussions between team members and local authorities on where and which communes/districts one would expect to find maize fields. Based on that information, visited maize fields were chosen if the fields’ owners would be available for an interview. The other crop fields were selected more randomly in surrounding areas. During each field visit, geographical location was recorded by a handheld Garmin GPS receiver to an accuracy of approximately 6 m. The landowner was asked to provide detailed information on his/her field farming history and practices. This information included maize or other crop variety grown, followed crop-calendar, fertilizer application, overall field management, cropping patterns and harvested yield.
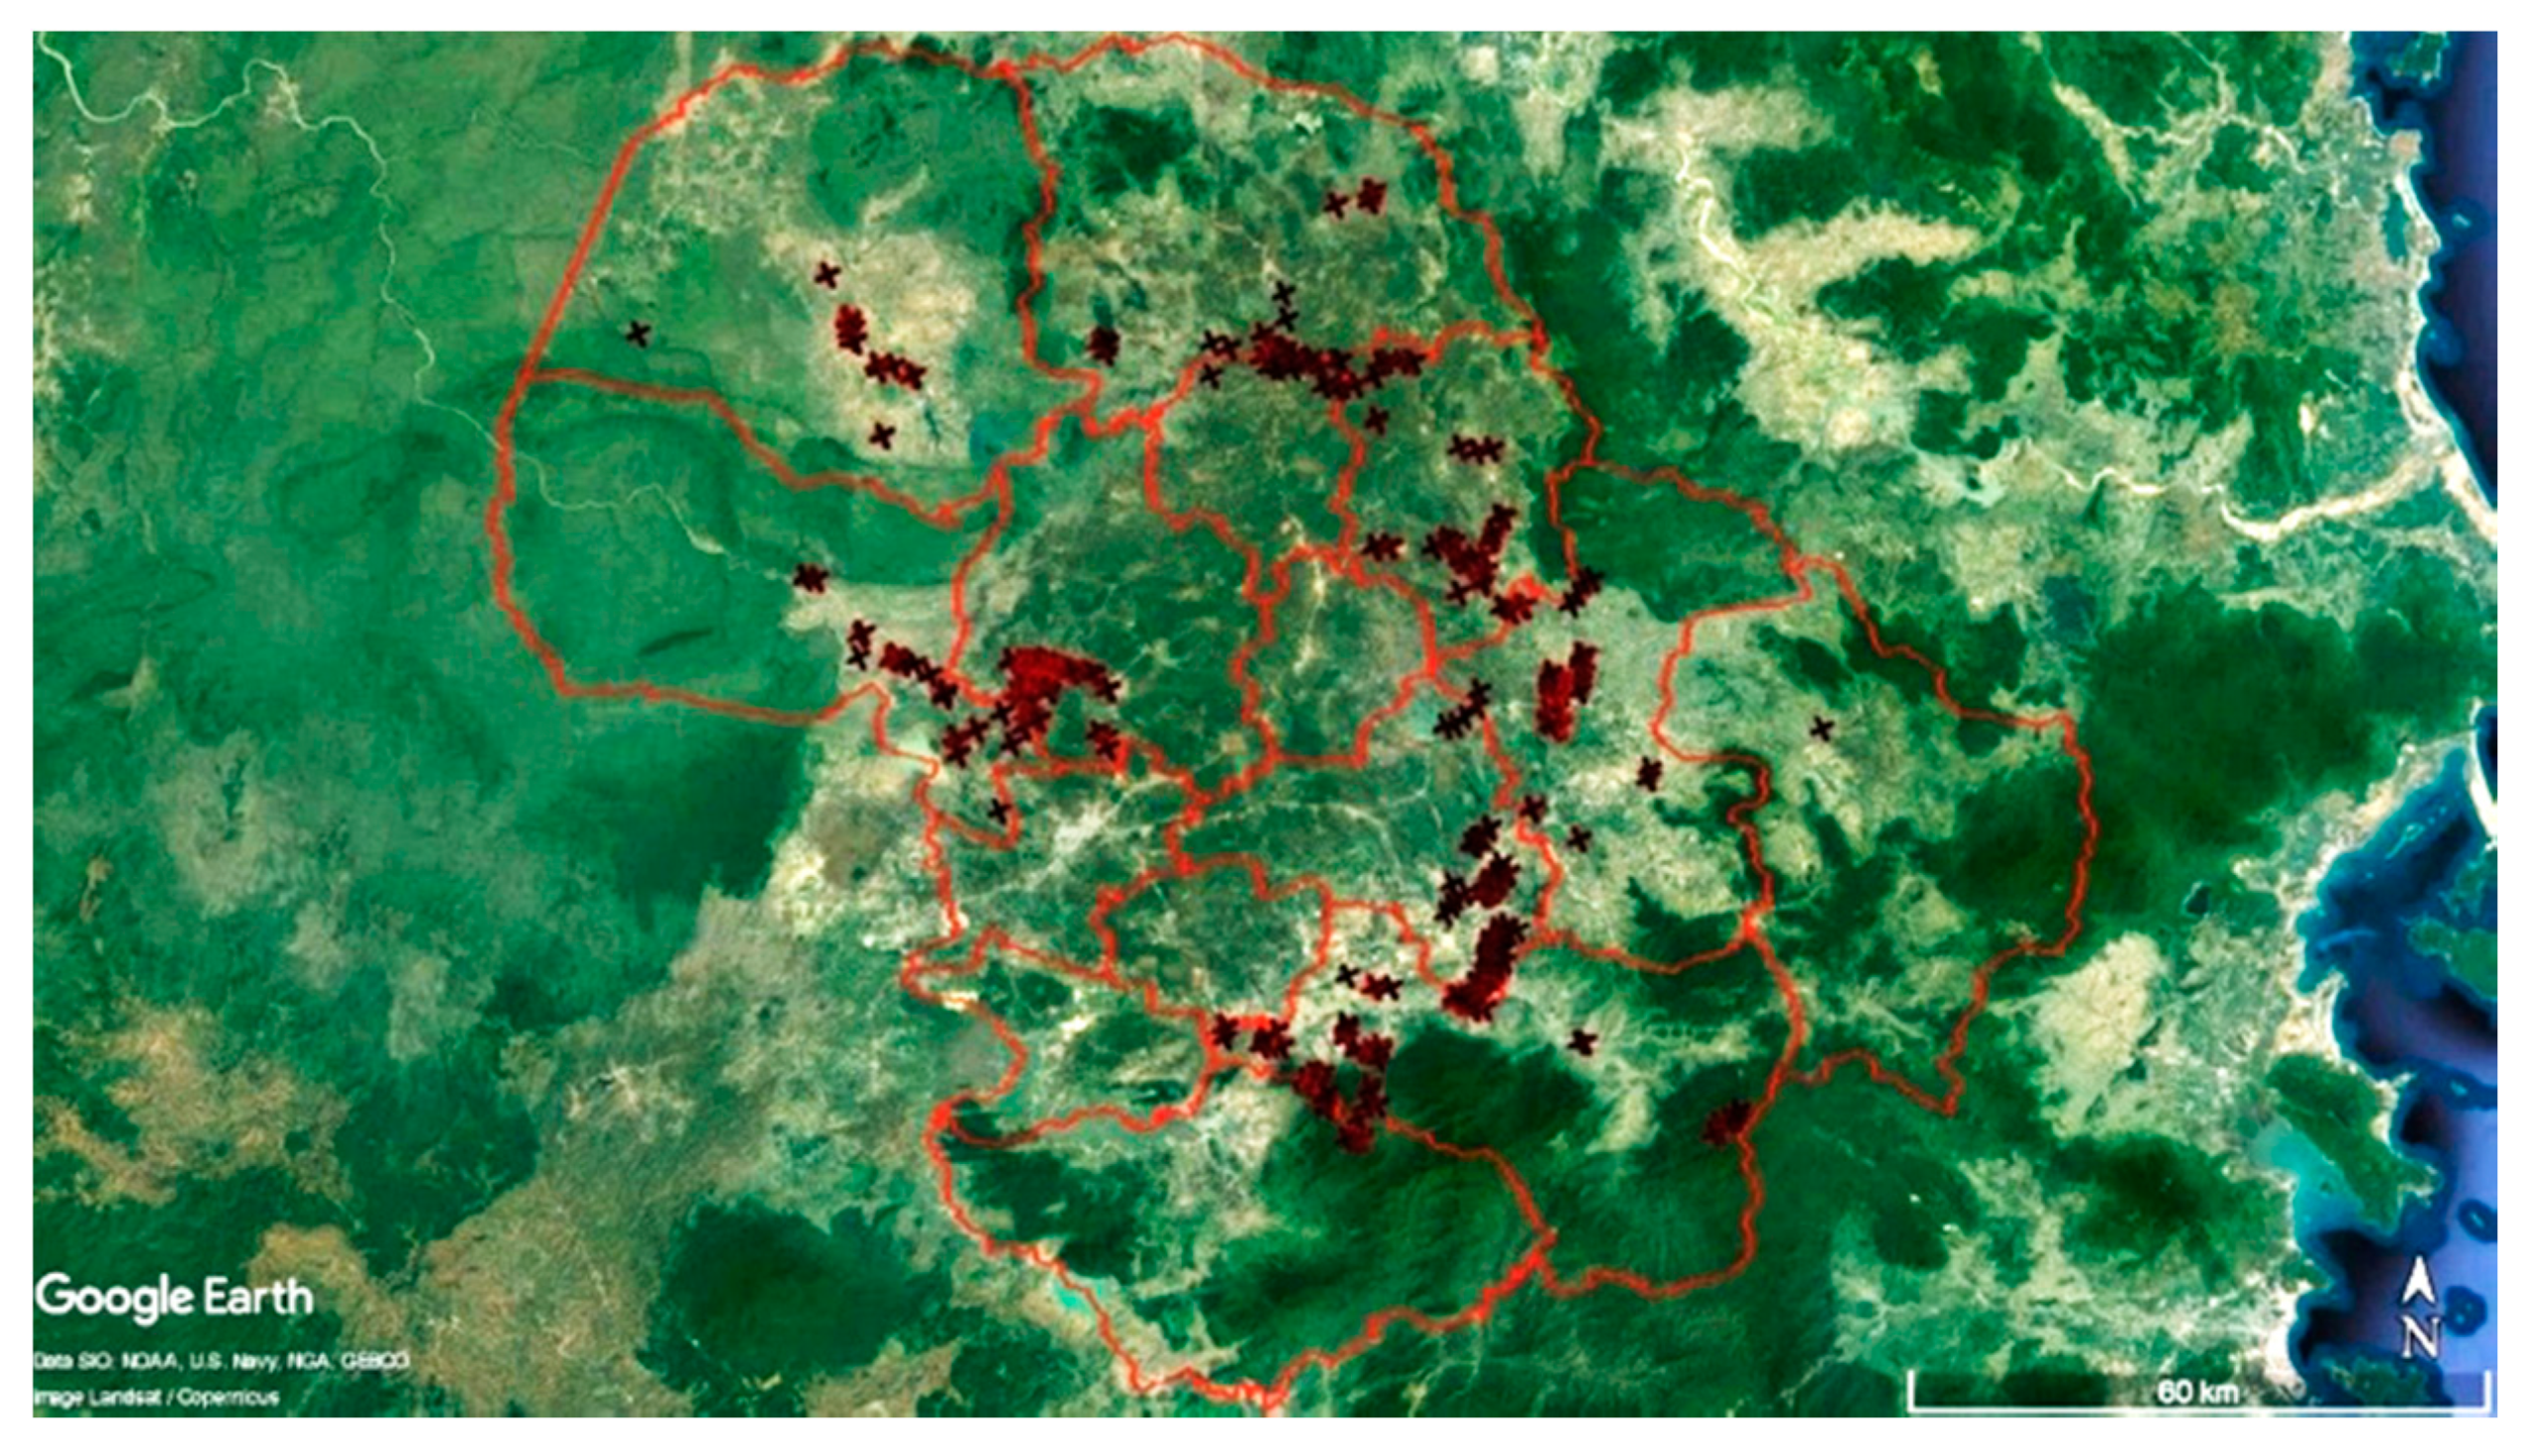
Since the MOD13Q1 spatial resolution is 250 m, only fields larger than 0.6 ha and located in the center of a relatively homogenous single crop cultivated area (304 of the 1544 visited) were chosen to build the maize training samples for the SVM mapping task. Figure 3 shows the spatial distribution of these 304 fields. Their average field size was 0.9 ha. The spectral processing exploitation and analysis resource (SPEAR) tool of the ENVI software provides a linkage to access historical Google Earth Pro high-spatial-resolution images based on the GPS locations of the taken training samples. This helped to visually assess if the training samples were well allocated and representative for the specific areas.

2.3. Method

2.3.1. Savitzky–Golay Algorithm for Vegetation Phenology Detection

Savitzky and Golay [42] developed a simplified least-squares-fit convolution for smoothing and computing derivatives of a set of consecutive spectra. This convolution is a weighed moving-average filter with weighting value given as a polynomial of a certain degree [37]. The polynomial preserves higher moments within the time series and reduces bias. The condition for applying this SG filter is that the data points must be at a fixed and uniform interval along the chosen abscissa, and the curves formed by connecting the points must be continuous and more or less smooth [37]. MODIS EVI data fit these requirements. The SG filter is:
Y j * = i = m i = m C i Y j + 1 N
where Y is the original EVI value at a time point, Y* is the computed EVI value at a point, Ci is the coefficient for the ith EVI value of the filter (i.e., the smoothing moving window), and N is the number of convoluting integers, which is equal to the smoothing window size (2m + 1) points, where m is the half-width of the smoothing window. The Ci can be obtained from Steinier et al. [48].
The SG algorithm was implemented in the IDL language and performed in three steps [49]. The first step was to compute an initial estimated EVI time series based on the temporal profile of the original best EVI values (seasonal growth) between the target pixel and its neighbors. To do this, the neighboring pixels should meet two criteria. The first criterion was a neighboring pixel and the target pixel should share a similar seasonal growth trajectory or similar land cover type. The second criterion was they should have similar responses to the environment conditions, such as drought stress. This first step allowed the interpolation of any continuous gaps in the original EVI time series data and reconstruction of the whole EVI profiles. The second step was to synthesize a new temporal EVI profile by integrating the original or raw EVI time series of the target pixel with its computed EVI time series in the first step. The last step was to fit the new synthesized EVI time series by employing the interactive weighted SG filter to approach the upper envelope of the temporal EVI profile, reducing the negatively biased noise.
In order to integrate information from neighboring pixels when searching for similarity using the SG IDL code, two parameters had to be considered. One parameter was the threshold for the correlation coefficient above which a neighboring pixel can be regarded as a similar pixel. The other parameter was the size of the neighborhood within which searching for similar pixels would be determined and was calculated as a half width of the search window. By evaluating the mean of absolute error (MAE) when testing the SG algorithm, we found that MAE varied less when correlation coefficient values were below 0.93 and the half window exceeded 10 pixels. Considering both a more stable MAE and the running time for the SG IDL code on a personal computer, we decided to take the thresholds of 0.9 for the correlation coefficient and of 10 pixels for the half window.

2.3.2. Support Vector Machine (SVM) Classification

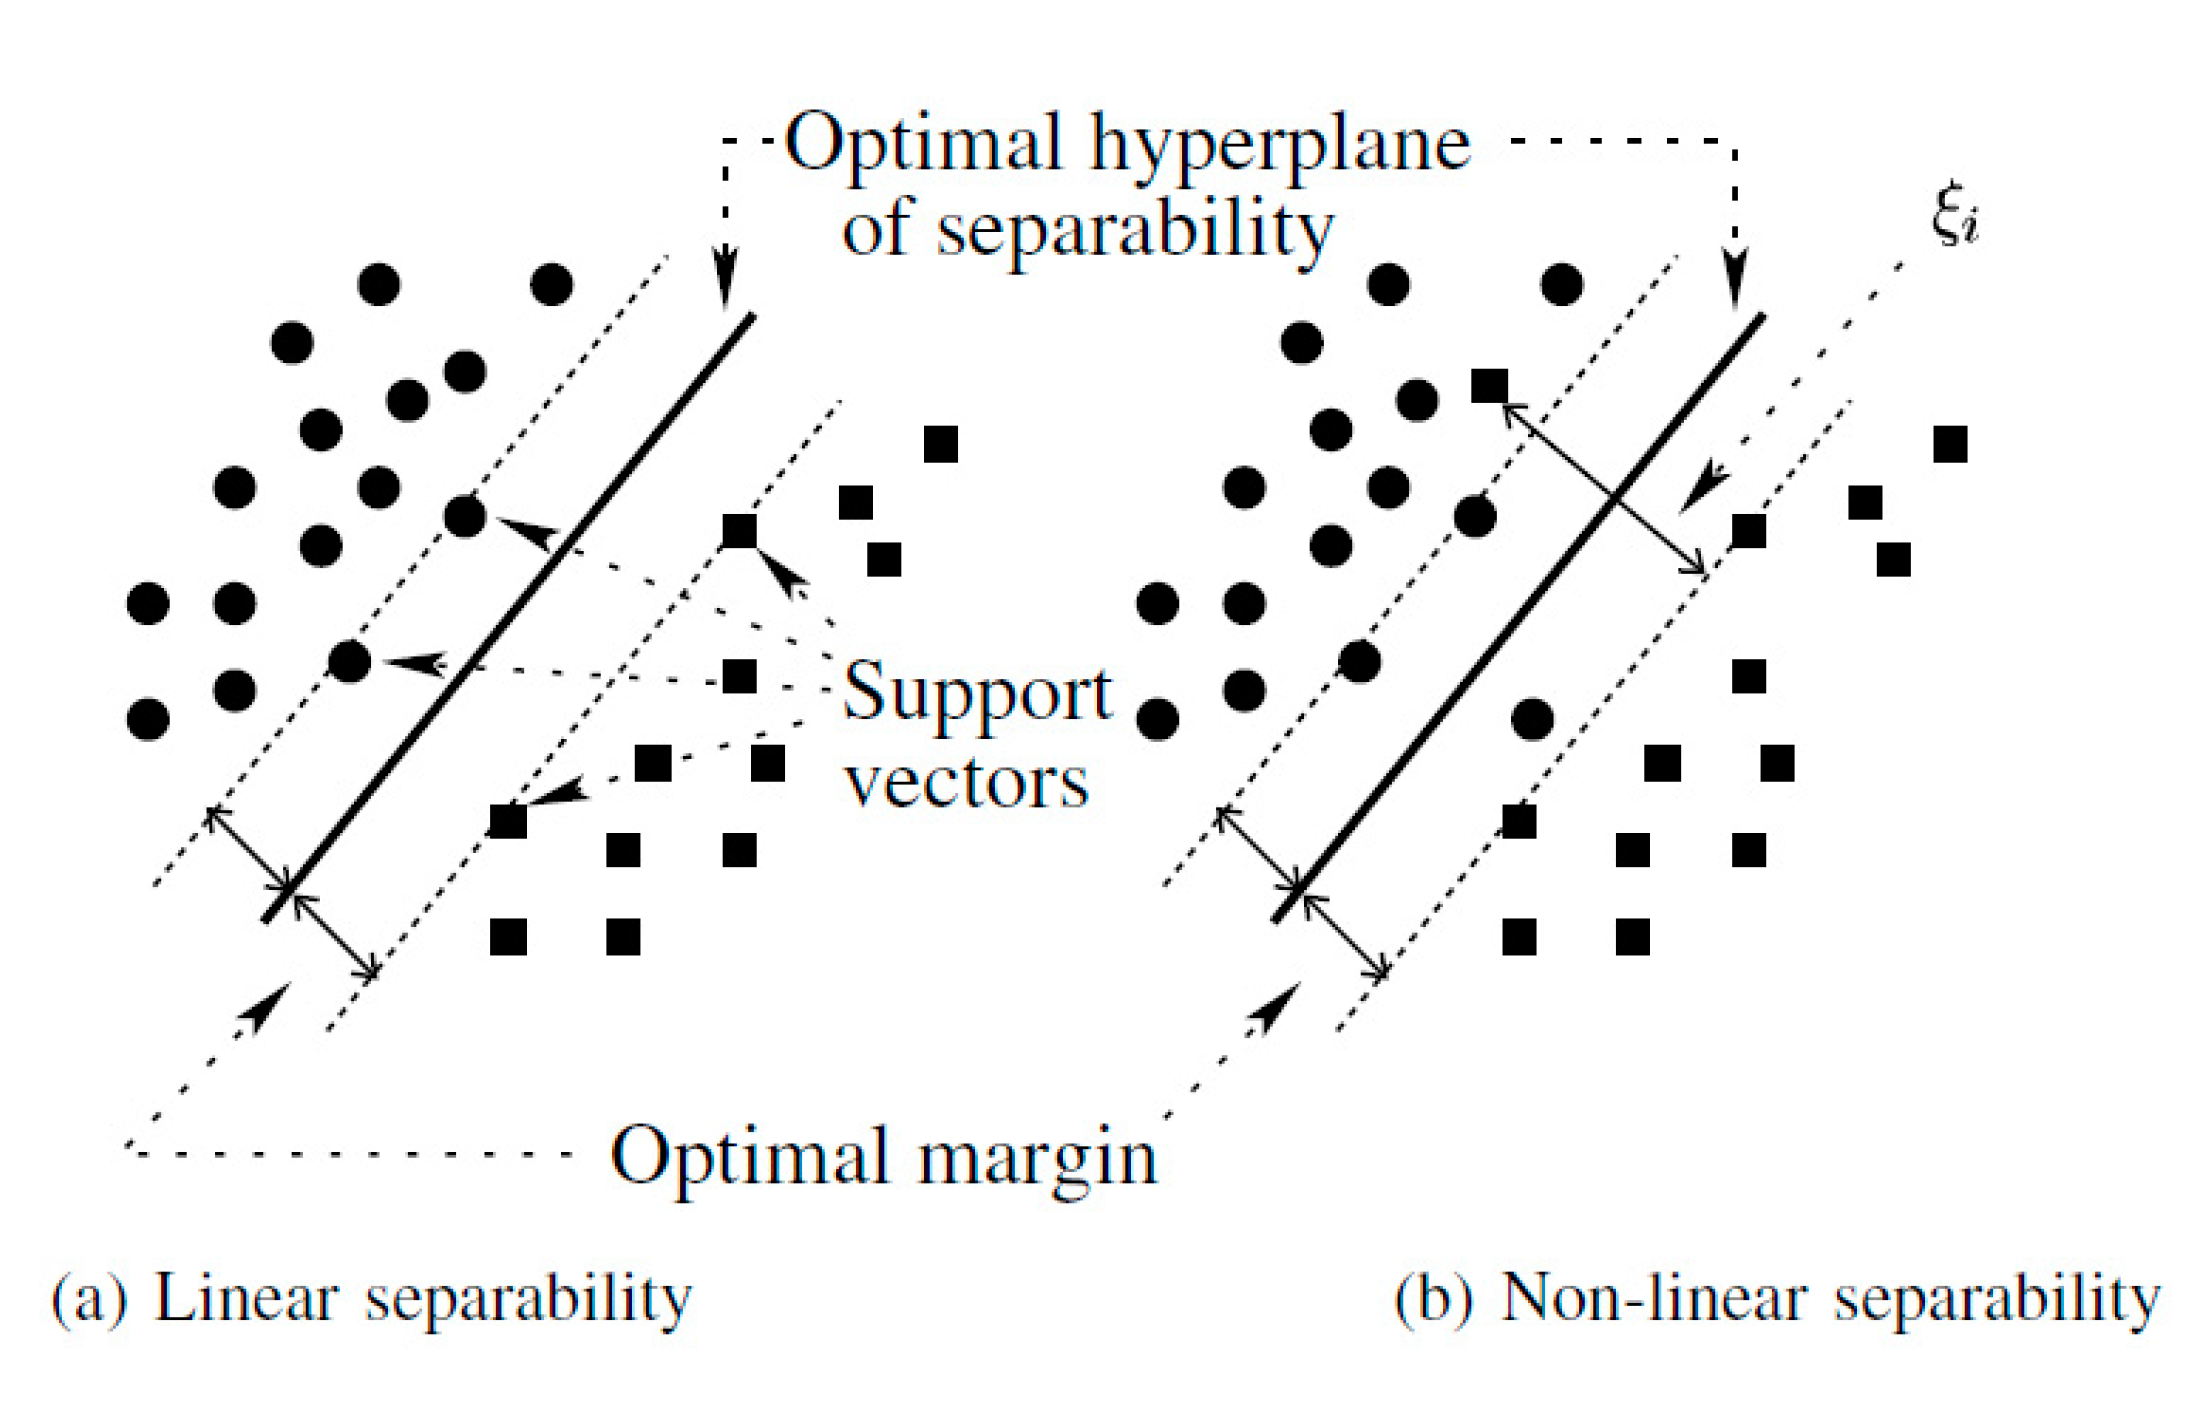
The SVM seeks to find the optimal separating hyperplane between classes by focusing on the training cases lying at the edge of the class distribution, the support vectors, with the other training cases effectively discarded [45,50,51,52]. The best hyperplane for an SVM means the one with the largest margin between the two classes. The margin means the maximal width of the slab parallel to the hyperplane that has no interior data points. The support vectors are the data points that are closest to the separating hyperplane; these points are on the boundary of the slab. Figure 4, which is adopted from Mercier and Lennon [50], shows the principles of SVM classification.
To train the SVM classifier, a set of 112 training samples covering a broad vegetation types were taken. These training samples were in fact a set of polygons that were taken using the information provided from the GPS surveyed fields, in association with the experts’ knowledge and the interpretation of the SG-reconstructed EVI profiles of different vegetation covers, and the historical high-spatial-resolution satellite images available on Google Earth Pro. Of these 112 training samples, 7 were taken for ‘Evergreen forest class’, 10 for ‘Deciduous open forest’, 16 for ‘1-season maize’, 18 for ‘2-season maize’, 15 for ‘Rice’, 30 for ‘Coffee and/or other perennial cash crops’, 7 for ‘Other annual cash crops’ and 9 for ‘Water’. Figure 5 provides an example of how a training sample of 1-season maize class was placed on MOD13Q1 grid cells on top of a Google-Earth-based satellite image taken on 18 February 2019. The SVM classification was carried out using the SVM built-in function under the supervised classification group in ENVI software. The chosen Kernel type was Linear. The parameters set in the SVM classification were 100 for the penalty parameter, 1 for the pyramid level of 1, and 0.95 for the classification probability threshold.
The accuracy assessment of the produced map was evaluated using the other independent GPS surveyed data of 121 locations covering different land cover/land use types through a confusion matrix. The user’s, producer’s and overall accuracy indices, and the Kappa’s statistic, were all examined. In addition, we also used the 2018 official statistics, which were released in December 2019, at district level to compare the total maize cultivated area of each district with the maize areas estimated via the utilization of SVM classifier on SG-reconstructed EVI data. This was done by examining the coefficient of correlation (r) and the root-mean-square deviation (RMSD).

3. Results

3.1. Reconstruction of MOD13Q1 EVI Time Series for Vegetation Phenology Detection Using Savitzky–Golay Filter

Figure 6 shows how differently the profile of the original EVI time series presents the 2-cropping season maize class from that of the SG reconstructing filter. The original data does include negative EVI value due to cloud and/or noisy condition. Moreover, in the original curve, the number of maize crops per year can roughly be identified, but those patterns are not well-defined. There is no clear boundary from one crop to another in the original curve as the result of the noise contamination. In the reconstructed EVI profile the negative value is no longer present, and since the filter was able to identify cropping seasonal changes, a cropping boundary can be set for fitting the whole EVI series based on its annual behavior. The maximum EVI value of 0.68, which was seen at the peak of the maize growing stage, was preserved during the smoothing and upper-envelope process.
Apart from maize, the other dominant vegetation cover types were forest trees and shrubs, coffee trees, rice and some other annual cash crops (i.e., sweet potato, cassava, etc.). Like maize, they all have their distinctive phenological characteristics.
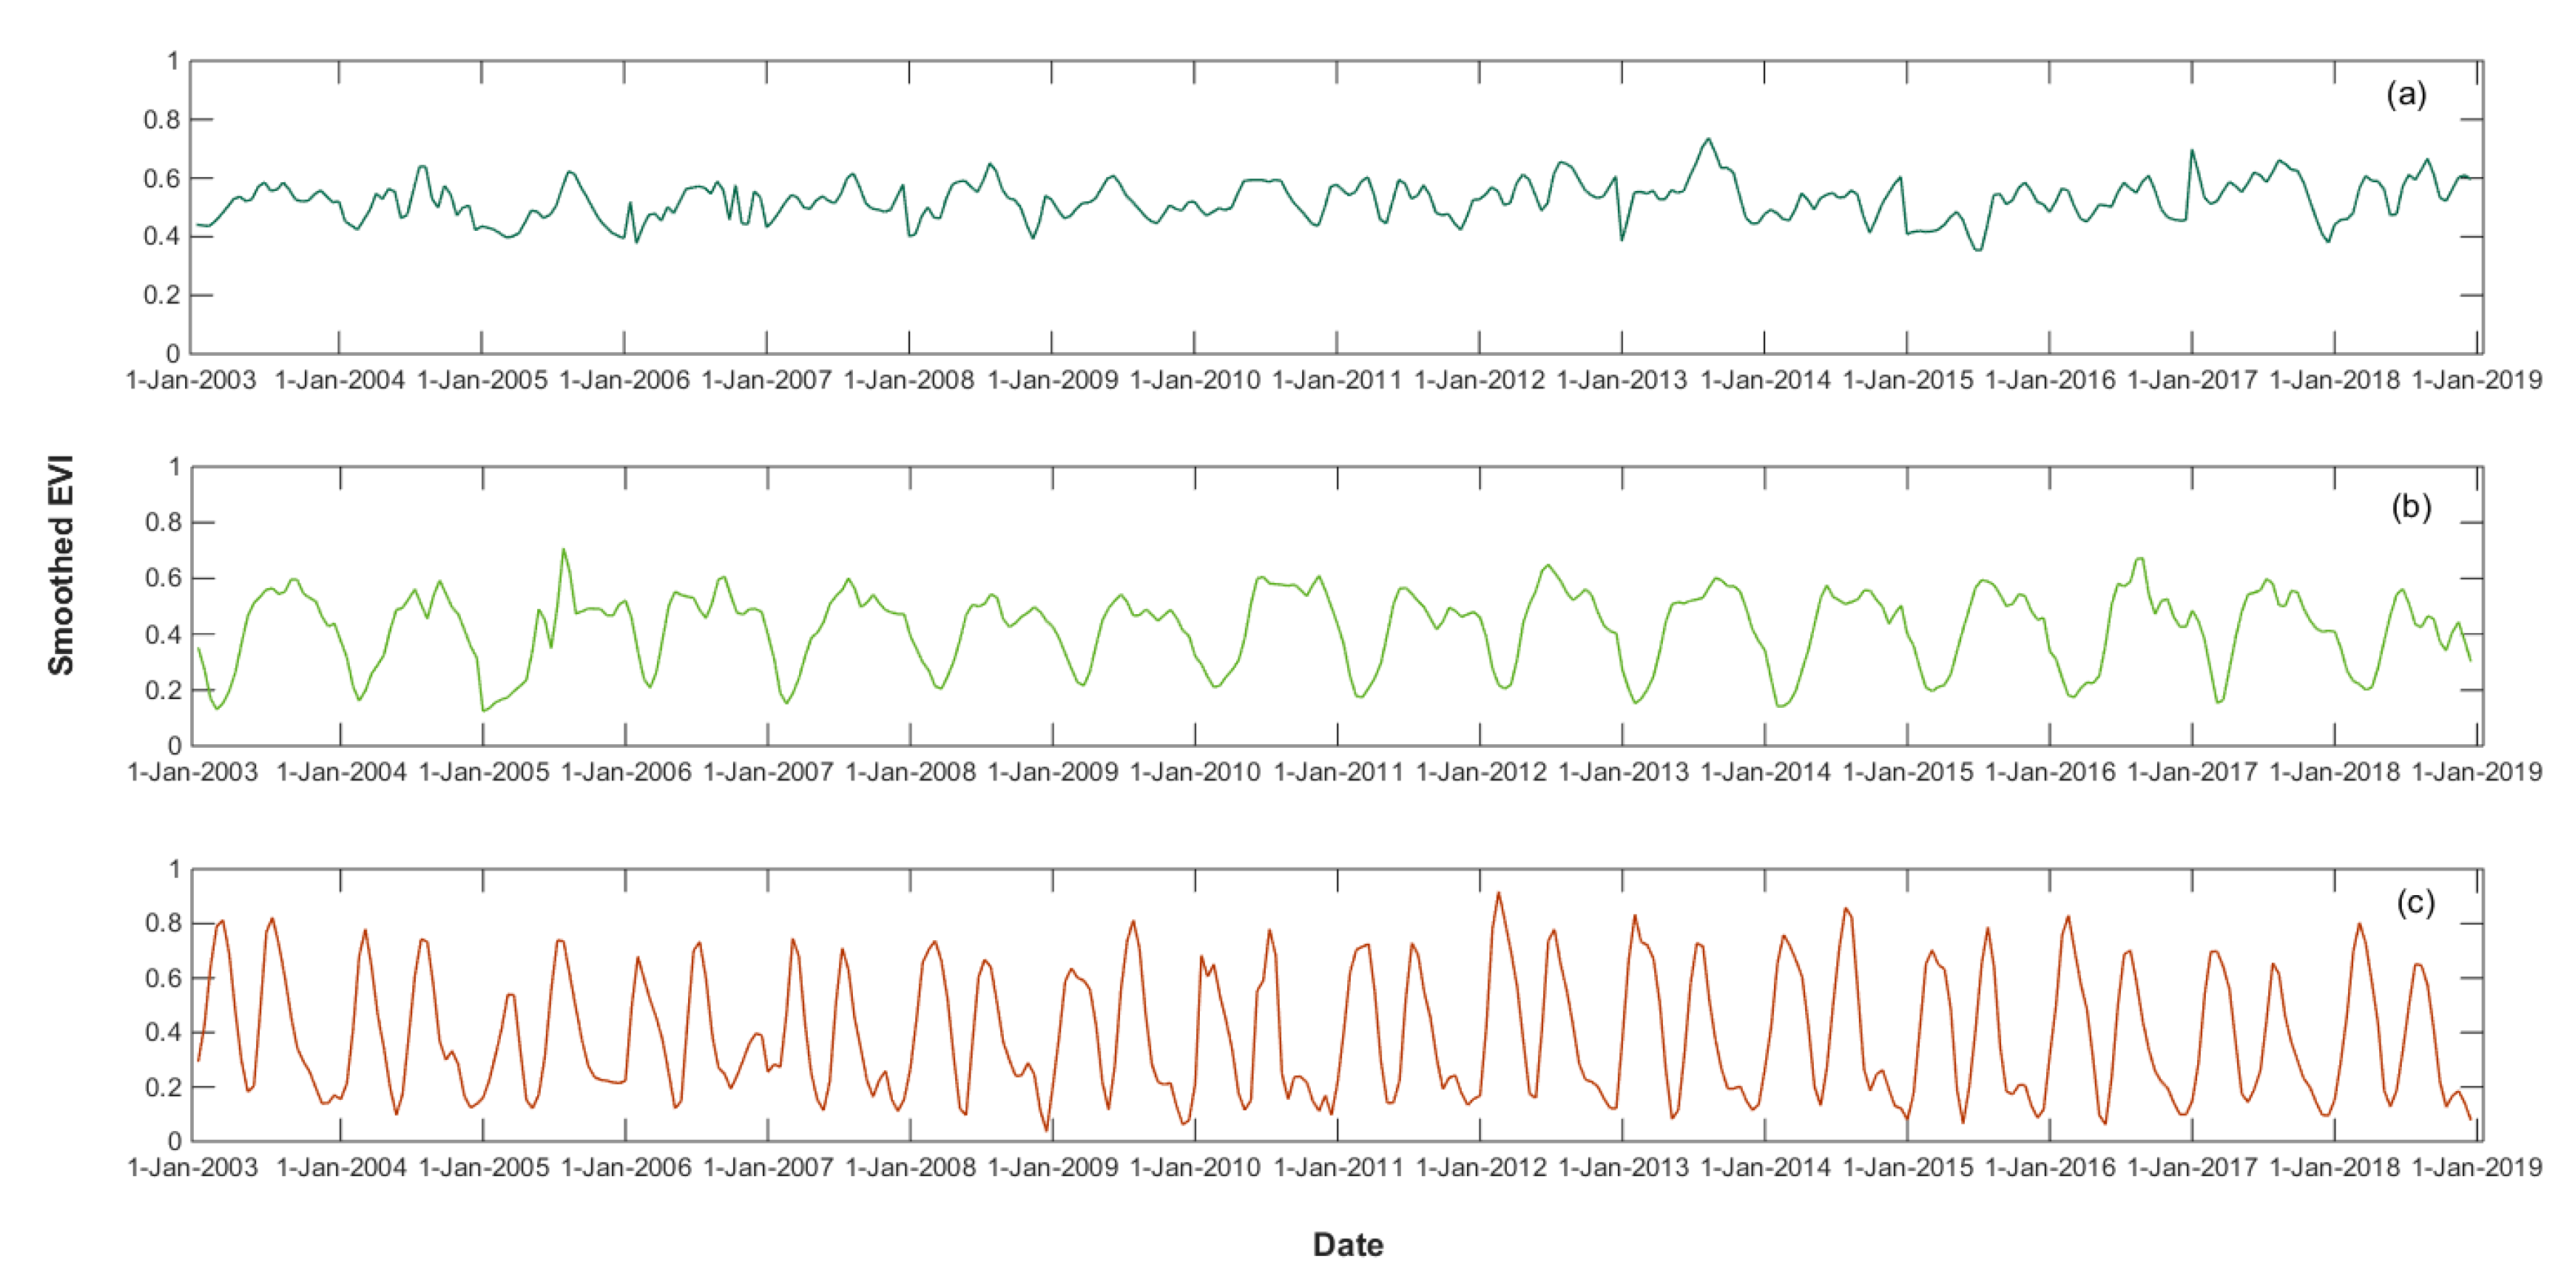
Figure 7a shows that the evergreen forest has a different EVI curve behavior from that of the other cover types. The evergreen forest class EVI value is never lower than 0.4, and its temporal EVI data consistently shows stable values throughout the years. This makes it hard to delineate any seasonality.
Coffee often has two EVI peaks every year, one at the flowering stage and the other at the re-growing vegetative stage, due to the pruning practices. The EVI evolution of coffee classes (Figure 7b) is very different from the others with moderate EVI values of 0.6 and with a wide temporal gap distinguishing all annual growth cycles.
Rice may have one or two EVI peaks depending on the number of its cropping seasons each year. The length of each growing season was around 100–110 days. Rice EVI time series also depict a clear EVI boundary between the first and second crops at an EVI value of 0.1 (Figure 7c). The 2-season rice class has a very steep EVI curve and narrow gap between 2 cropping seasons, and its EVI peak values are found to be the highest at almost 0.9, making it very much distinguishable from maize.
Maize EVI curves (Figure 6) behave somewhat like those of rice (Figure 7c), but with a larger base because of its longer growing season. The first maize cropping season starts, in general, about 2 months later then the first rice cropping season, which is also confirmed by the data collected from the field surveys. The second season often has a lower EVI peak value due to the less preferable growing conditions.

3.2. Maize Cropping Pattern Identification

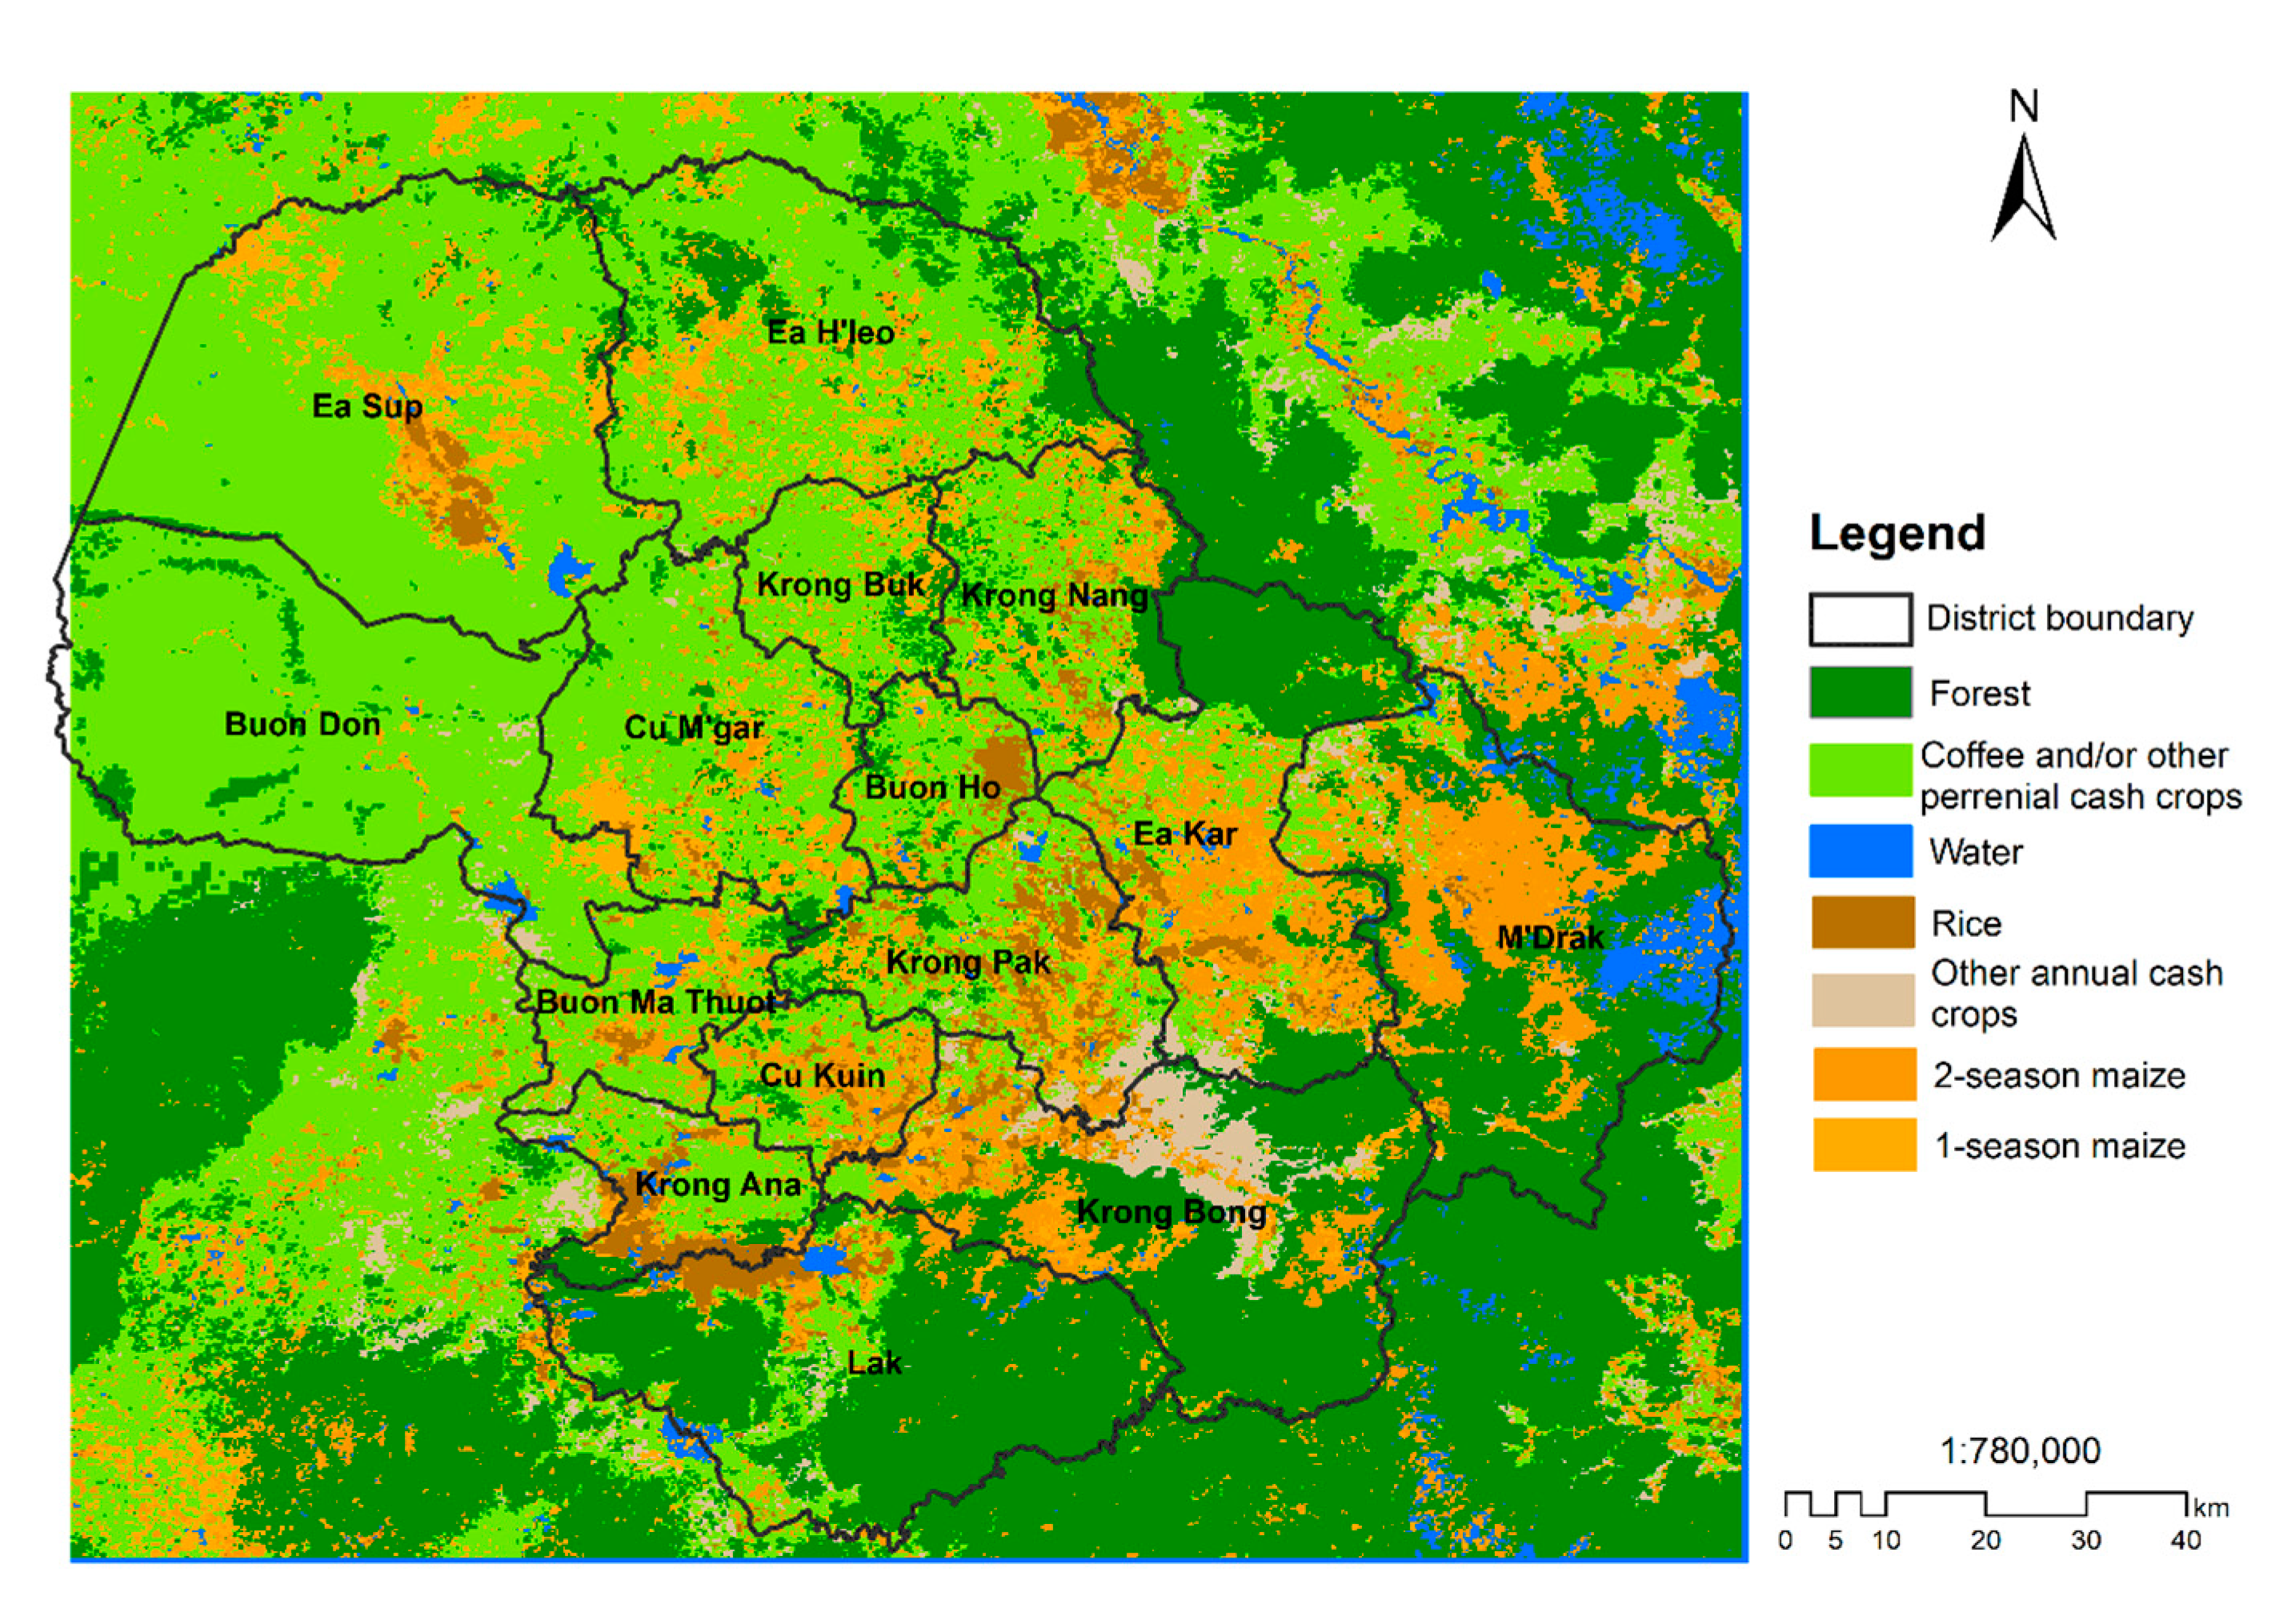
Figure 8 shows that maize cultivated areas were found mostly in four southern central districts and Ea Sup, located in the northwestern part of the province. The dominant perennial crop was coffee and it is more extended toward the central districts. Evergreen forest was the major vegetation coverage present in the southern districts of Lak, Krong Bong and M’ Drak. The map also shows that at district level, the distribution of the 1-season maize was found to be more prominent toward the northern bounder, whereas the 2-season maize was more evident in southern central districts.
The overall accuracy assessment for the SVM-produced map of the maize cropping patterns and other vegetation covers presents a 79% agreement with the GPS validation fields (Table 1). As for maize, the user’s accuracy is 77% while the producer’s accuracy is 74%. The omission error for mapping maize distribution was 26%, which was mostly mis-classified as ‘Other annual cash crops’.
The class ‘Coffee and/or other perennial crops’ and the class ‘Forest’ both generated the highest user’s and producer’s accuracy since they both had distinctive seasonal NDVI-profiles.
To have a better overall picture of how much larger the cultivated maize areas in different districts were in 2018, a comparison was made for the total maize area of each district that was estimated by SVM classifier and that was provided from the 2018 official statistics. According to the SVM-produced map, the total maize cultivated area of Dak Lak was 91,735 ha, which was around 8200 ha less than the 2018 released official number [53]. This difference related to the data from the districts Cu M’gar, Krong Pak and Krong Bong, which saw their SVM underestimated by more than 2000 ha each (Table 2). However, since the official data on maize acreage are often estimated from the amount of sown seed, maize fields that are cropped twice a year can be estimated twice for their areas, and hence may just be overestimated.
The ‘1-season maize’ class was the most challenging to map during the study because of the mix EVI signal when maize was intercropped with the ‘Other annual crops’ class, such as mung bean, cassava and sweet potato. It is hence advised that high spatial resolution available during May–June each year could be an additionally valuable source to MOD13Q1 EVI to tackle this issue.
The small field plots of maize scattered in mosaic landscapes were also a reason to underestimate maize acreage because of MOD13Q1 250-m resolution. While high-spatial-resolution images from Google Earth Pro provide great support, their lack of high temporal characteristics makes it hard to detect any crop and cropping sequences during the periods of unavailable images (i.e., thick cloud coverage or low-frequency revisiting of the satellites).
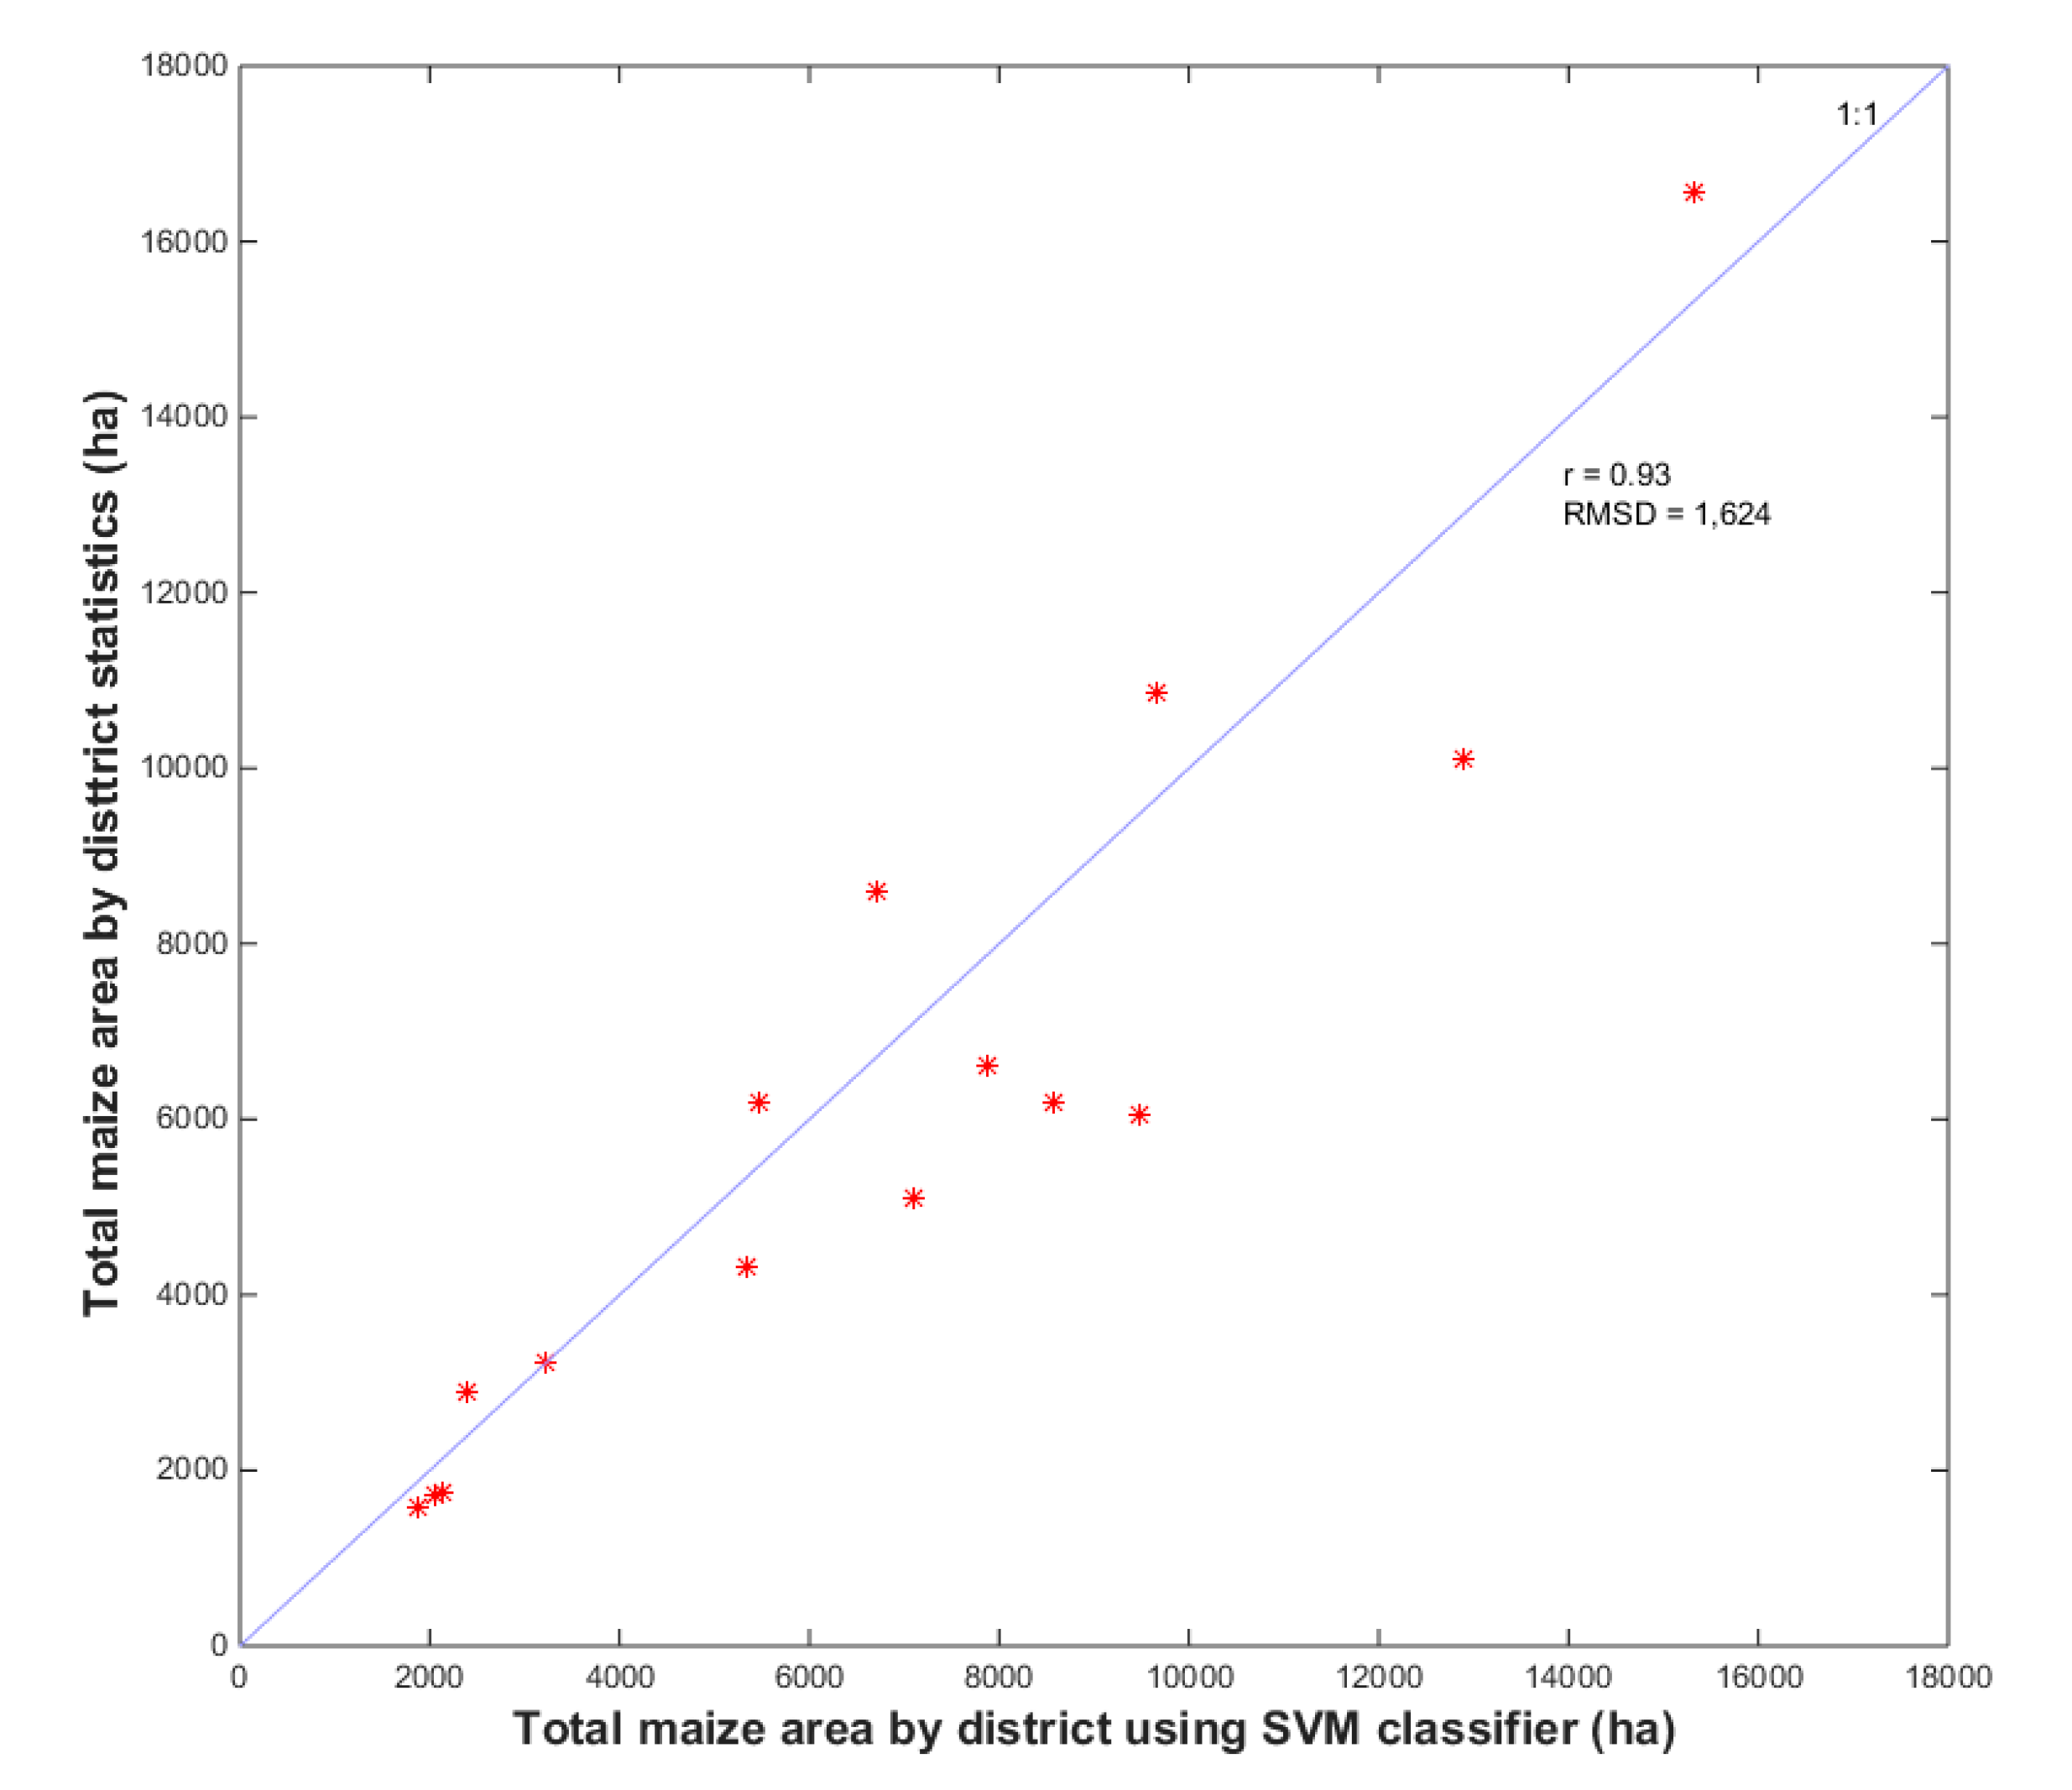
To assess how the SVM classifier performed to detect maize cropping patterns on the SG reconstructed EVI time series at the district level, we evaluated the extracted maize acreage of each district against the official data (Figure 9). The computed r = 0.93 with RMSD = 1624 ha show a very good agreement between the mapped and the statistical acreages, suggesting that by using the time series EVI data with the help of a SG filter, maize cropping patterns can be revealed much earlier, since the yearly official data are only available in July–August of the following year. This information represents an important asset for regional decision makers, policy makers and government to improve their decisions toward sustainable economic management of the region.

4. Discussion

The Savitzky–Golay filtering algorithm proved to have great potential for reconstructing the EVI profiles of seven vegetation cover types in Dak Lak, where cloud coverage is a prominent problem. By interpolating the missing EVI-value pixels and reconstructing the EVI curves based on the temporal behavior of the greenness values from each vegetation types, the Savitzky–Golay algorithm can delineate the maize cropping seasons from the others. This is important due to the extensive farming practices and complex cropping systems in a very dynamic and mosaic landscape of Dak Lak, which make it hard to identify crops and where they are grown, especially for those classified as annual cash crops. This is the reason why the official land use map [54], which is released once every 5 years, cannot provide detailed information on the kind of annual cash crops that are currently cultivated in the province (Figure 2). In fact, this most up-to-date official map is only able to provide rough information on where one would expect to find annual cash crops, including maize, and sometimes no crop would be shown since the land was already left fallow.
The MOD13Q1 EVI does have advantages for monitoring seasonal growth and changes of vegetation covers at large scale, but its 250-m spatial resolution has the disadvantage that is larger than the size of field. This means any maize field smaller than that pixel size will be missed when mapping due to the mixed EVI signal/value with other dominant vegetation cover types. Moreover, the scattered maize fields in this mosaic landscape would also be missed during the SVM classification process due to the nature of the linear SVM algorithm.
The linear kernel SVM classifier was able to map the maize cropping patterns with a producer’s accuracy of 74% but missed almost 26% of the validation GPS fields for the other annual cash crops class and rice class. This could be due to narrow margin hyperplanes separating maize crops from the others, and especially the ‘1-season maize’. Improvement could be made by having a better representation of training samples with the help of more representative GPS maize fields distributed over the landscape, or by comparing with other nonlinear kernel SVM classifiers.

5. Conclusions

This study has demonstrated that MODIS MOD13Q1 EVI time series with 250-m spatial and 16-day temporal resolution can provide adequate data on maize crops in Dak Lak province.
The Savitzky–Golay temporal smoothing and reconstructing filter proves its capability in discriminating vegetation phenology and delineating maize cropping patterns despite the noise and cloud effect on the optical remote sensing data.
The linear kernel SVM classifier in ENVI was able to map the spatial distribution of maize cropping patterns in Dak Lak with an overall accuracy of 78%. The SVM-produced maize cropping pattern map at district level showed a good agreement with the 2018 official statistics with a coefficient of correlation r of 0.93.
To improve the map accuracy, future work should focus on (i) the use of high-spatial-resolution data in fusion with MOD13Q1 EVI to delineate maize fields that have sizes smaller than 250 × 250 m; and (ii) the use of other nonlinear kernel SVMs or even other classification techniques that would allow comparison with the currently used linear SVM classifier in this study.

Author Contributions

Conceptualization, I.A.C. and L.V.N. (Long Viet Nguyen); formal analysis, H.T.T.N., L.V.N. (Loc Van Nguyen), L.N and R.S.; funding acquisition, L.V.N. (Long Viet Nguyen); investigation, L.V.N. (Loc Van Nguyen), D.A.N. and M.V.N.; methodology, H.T.T.N., C.A.J.M.(K.)d.B., I.A.C. and L.V.N. (Long Viet Nguyen); project administration, D.A.N.; software, H.T.T.N. and L.V.N. (Loc Van Nguyen); writing–original draft, H.T.T.N.; writing–review & editing, H.T.T.N., C.A.J.M.(K.)d.B., I.A.C., L.N., R.S. and L.V.N. (Long Viet Nguyen). All authors have read and agree to the published version of the manuscript.

Funding

This research was funded by Ministry of Science and Technology, Vietnam and the World Bank through FIRST project, grant number 38/FIRST/1a/VNUA.

Acknowledgments

We would like to thank D. G. Rossiter for his critical comments and English editing the first version of the draft. We thank Nguyen Thi Thuy at VNUA’s Incubation Center for the administrative work.

Conflicts of Interest

We herewith declare that there is no conflict of interest and the funders had no role in the design of the study; in the collection, analyses, or interpretation of data; in the writing of the manuscript, or in the decision to publish the results.

References

  1. The General Statistics Office of Vietnam. Total maize cultivated areas by regions in 2017. In Statistics of Vietnam; The General Statistics Office of Vietnam: Hanoi, Vietnam, 2019. [Google Scholar]
  2. The General Statistics Office of Vietnam. Total maize cultivated areas by regions in 1997, 2007 and 2017. In Statistics of Vietnam; The General Statistics Office of Vietnam: Hanoi, Vietnam, 2019. [Google Scholar]
  3. Hansen, A. Meat consumption and capitalist development: The meatification of food provision and practice in Vietnam. Geoforum 2018, 93, 57–68. [Google Scholar] [CrossRef]
  4. Salmon, J.M.; Friedl, M.A.; Frolking, S.; Wisser, D.; Douglas, E.M. Global rain-fed, irrigated, and paddy croplands: A new high resolution map derived from remote sensing, crop inventories and climate data. Int. J. Appl. Earth Obs. Geoinf. 2015, 38, 321–334. [Google Scholar] [CrossRef]
  5. Forkuor, G.; Conrad, C.; Thiel, M.; Zoungrana, B.J.-B.; Tondoh, J.E. Multiscale Remote Sensing to Map the Spatial Distribution and Extent of Cropland in the Sudanian Savanna of West Africa. Remote Sens. 2017, 9, 839. [Google Scholar] [CrossRef] [Green Version]
  6. Waldner, F.; Fritz, S.; di Gregorio, A.; Defourny, P. Mapping Priorities to Focus Cropland Mapping Activities: Fitness Assessment of Existing Global, Regional and National Cropland Maps. Remote Sens. 2015, 7, 7959–7986. [Google Scholar] [CrossRef] [Green Version]
  7. Yu, L.; Wang, J.; Gong, P. Improving 30 m global land-cover map FROM-GLC with time series MODIS and auxiliary data sets: A segmentation-based approach. Int. J. Remote Sens. 2013, 34, 5851–5867. [Google Scholar] [CrossRef]
  8. Zhang, X.; Friedl, M.A.; Schaaf, C.B.; Strahler, A.H.; Hodges, J.C.F.; Gao, F.; Reed, B.C.; Huete, A. Monitoring vegetation phenology using MODIS. Remote Sens. Environ. 2003, 84, 471–475. [Google Scholar] [CrossRef]
  9. Löw, F.; Biradar, C.; Dubovyk, O.; Fliemann, E.; Akramkhanov, A.; Vallejo, A.N.; Waldner, F. Regional-scale monitoring of cropland intensity and productivity with multi-source satellite image time series. Giscience Remote Sens. 2018, 55, 539–567. [Google Scholar] [CrossRef]
  10. Hao, P.; Löw, F.; Biradar, C. Annual Cropland Mapping Using Reference Landsat Time Series—A Case Study in Central Asia. Remote Sens. 2018, 10, 2057. [Google Scholar] [CrossRef] [Green Version]
  11. Chance, E.W.; Cobourn, K.M.; Thomas, V.A.; Dawson, B.C.; Flores, A.N. Identifying Irrigated Areas in the Snake River Plain, Idaho: Evaluating Performance across Composting Algorithms, Spectral Indices, and Sensors. Remote Sens. 2017, 9, 546. [Google Scholar] [CrossRef] [Green Version]
  12. Atzberger, C. Advances in Remote Sensing of Agriculture: Context Description, Existing Operational Monitoring Systems and Major Information Needs. Remote Sens. 2013, 5, 949–981. [Google Scholar] [CrossRef] [Green Version]
  13. Wardlow, B.D.; Egbert, S.L.; Kastens, J.H. Analysis of time-series MODIS 250 m vegetation index data for crop classification in the U.S. Central Great Plains. Remote Sens. Environ. 2007, 108, 290–310. [Google Scholar] [CrossRef] [Green Version]
  14. Van Niel, T.G.; McVicar, T.R. Determining temporal windows for crop discrimination with remote sensing: A case study in south-eastern Australia. Comput. Electron. Agric. 2004, 45, 91–108. [Google Scholar] [CrossRef]
  15. Homer, C.G.; Huang, C.; Yang, L.; Wylie, B.K.; Coan, M. Development of a 2001 National Land Cover Database for the United States. Photogramm. Eng. Remote Sens. 2004, 70, 829–840. [Google Scholar] [CrossRef] [Green Version]
  16. Wang, S.; Azzari, G.; Lobell, D.B. Crop type mapping without field-level labels: Random forest transfer and unsupervised clustering techniques. Remote Sens. Environ. 2019, 222, 303–317. [Google Scholar] [CrossRef]
  17. Azzari, G.; Lobell, D.B. Landsat-based classification in the cloud: An opportunity for a paradigm shift in land cover monitoring. Remote Sens. Environ. 2017, 202, 64–74. [Google Scholar] [CrossRef]
  18. Van Niel, T.G.; McVicar, T.R.; Datt, B. On the relationship between training sample size and data dimensionality: Monte Carlo analysis of broadband multi-temporal classification. Remote Sens. Environ. 2005, 98, 468–480. [Google Scholar] [CrossRef]
  19. Defries, R.S.; Townshend, J.R.G. Global land cover characterization from satellite data: From research to operational implementation? Glob. Ecol. Biogeogr. 1999, 8, 367–379. [Google Scholar] [CrossRef]
  20. Qin, Y.; Xiao, X.; Dong, J.; Zhou, Y.; Zhu, Z.; Zhang, G.; Du, G.; Jin, C.; Kou, W.; Wang, J.; et al. Mapping paddy rice planting area in cold temperate climate region through analysis of time series Landsat 8 (OLI), Landsat 7 (ETM+) and MODIS imagery. ISPRS J. Photogramm. Remote Sens. 2015, 105, 220–233. [Google Scholar] [CrossRef] [Green Version]
  21. Xiong, J.; Thenkabail, S.P.; Tilton, C.J.; Gumma, K.M.; Teluguntla, P.; Oliphant, A.; Congalton, G.R.; Yadav, K.; Gorelick, N. Nominal 30-m Cropland Extent Map of Continental Africa by Integrating Pixel-Based and Object-Based Algorithms Using Sentinel-2 and Landsat-8 Data on Google Earth Engine. Remote Sens. 2017, 9, 1065. [Google Scholar] [CrossRef] [Green Version]
  22. Gao, F.; Anderson, M.; Daughtry, C.; Johnson, D. Assessing the Variability of Corn and Soybean Yields in Central Iowa Using High Spatiotemporal Resolution Multi-Satellite Imagery. Remote Sens. 2018, 10, 1489. [Google Scholar] [CrossRef] [Green Version]
  23. Loveland, T.R.; Merchant, J.W.; Ohlen, D.O.; Brown, J.F. Development of a land-cover characteristics database for the conterminous U.S. Photogramm. Eng. Remote Sens. 1991, 57, 1453–1463. [Google Scholar]
  24. Loveland, T.R.; Merchant, J.W.; Brown, J.F.; Ohlen, D.O.; Reed, B.C.; Olson, P.; Hutchinson, J. Seasonal land-cover regions of the United States. Ann. Assoc. Am. Geogr. 1995, 85, 339–355. [Google Scholar] [CrossRef] [Green Version]
  25. Defries, R.S.; Townshend, J.R.G. NDVI-derived land cover classifications at a global scale. Int. J. Remote Sens. 1994, 15, 3567–3586. [Google Scholar] [CrossRef]
  26. De Fries, R.S.; Hansen, M.; Townshend, J.R.G.; Sohlberg, R. Global land cover classifications at 8 km spatial resolution: The use of training data derived from Landsat imagery in decision tree classifiers. Int. J. Remote Sens. 1998, 19, 3141–3168. [Google Scholar] [CrossRef]
  27. Hansen, M.C.; Defries, R.S.; Townshend, J.R.G.; Sohlberg, R. Global land cover classification at 1 km spatial resolution using a classification tree approach. Int. J. Remote Sens. 2000, 21, 1331–1364. [Google Scholar] [CrossRef]
  28. Loveland, T.R.; Reed, B.C.; Brown, J.F.; Ohlen, D.O.; Zhu, Z.; Yang, L.; Merchant, J.W. Development of a global land cover characteristics database and IGBP DISCover from 1 km AVHRR data. Int. J. Remote Sens. 2000, 21, 1303–1330. [Google Scholar] [CrossRef]
  29. Townshend, J.R.G.; Justice, C.O. Selecting the spatial resolution of satellite sensors required for global monitoring of land transformations. Int. J. Remote Sens. 1988, 9, 187–236. [Google Scholar] [CrossRef]
  30. Zhan, X.; Sohlberg, R.A.; Townshend, J.R.G.; DiMiceli, C.; Carroll, M.L.; Eastman, J.C.; Hansen, M.C.; DeFries, R.S. Detection of land cover changes using MODIS 250 m data. Remote Sens. Environ. 2002, 83, 336–350. [Google Scholar] [CrossRef]
  31. Turner Ii, B.L.; Skole, D.; Sanderson, S.; Fischer, G.; Fresco, L.; Leemans, R. Land-Use and Land-Cover Change: Science/Research Plan; IGBP Report: 35; IGBP: Stockholm, Sweden, 1995. [Google Scholar]
  32. Justice, C.; Townshend, J. Special issue on the moderate resolution imaging spectroradiometer (MODIS): A new generation of land surface monitoring. Remote Sens. Environ. 2002, 83, 1–2. [Google Scholar] [CrossRef]
  33. Liu, J.; Zhu, W.; Atzberger, C.; Zhao, A.; Pan, Y.; Huang, X. A Phenology-Based Method to Map Cropping Patterns under a Wheat-Maize Rotation Using Remotely Sensed Time-Series Data. Remote Sens. 2018, 10, 1203. [Google Scholar] [CrossRef] [Green Version]
  34. FAO. Agro-ecological Zoning: Guidelines. In FAO Soils Bulletin 7; Food and Agriculture Organisation of the United Nations: Rome, Italy, 1996. [Google Scholar]
  35. De Souza, C.H.W.; Mercante, E.; Johann, J.A.; Lamparelli, R.A.C.; Uribe-Opazo, M.A. Mapping and discrimination of soya bean and corn crops using spectro-temporal profiles of vegetation indices. Int. J. Remote Sens. 2015, 36, 1809–1824. [Google Scholar] [CrossRef]
  36. Vintrou, E.; Desbrosse, A.; Bégué, A.; Traoré, S.; Baron, C.; Seen, D.L. Crop area mapping in West Africa using landscape stratification of MODIS time series and comparison with existing global land products. Int. J. Appl. Earth Obs. Geoinf. 2012, 14, 83–93. [Google Scholar] [CrossRef]
  37. Chen, J.; Jönsson, P.; Tamura, M.; Gu, Z.; Matsushita, B.; Eklundh, L. A simple method for reconstructing a high-quality NDVI time-series data set based on the Savitzky–Golay filter. Remote Sens. Environ. 2004, 91, 332–344. [Google Scholar] [CrossRef]
  38. Jonsson, P.; Eklundh, L. Seasonality extraction by function fitting to time-series of satellite sensor data. IEEE Trans. Geosci. Remote Sens. 2002, 40, 1824–1832. [Google Scholar] [CrossRef]
  39. Jönsson, P.; Eklundh, L. TIMESAT—A program for analyzing time-series of satellite sensor data. Comput. Geosci. 2004, 30, 833–845. [Google Scholar] [CrossRef] [Green Version]
  40. Mingwei, Z.; Qingbo, Z.; Zhongxin, C.; Jia, L.; Yong, Z.; Chongfa, C. Crop discrimination in Northern China with double cropping systems using Fourier analysis of time-series MODIS data. Int. J. Appl. Earth Obs. Geoinf. 2008, 10, 476–485. [Google Scholar] [CrossRef]
  41. Pan, Z.; Huang, J.; Zhou, Q.; Wang, L.; Cheng, Y.; Zhang, H.; Blackburn, G.A.; Yan, J.; Liu, J. Mapping crop phenology using NDVI time-series derived from HJ-1 A/B data. Int. J. Appl. Earth Obs. Geoinf. 2015, 34, 188–197. [Google Scholar] [CrossRef] [Green Version]
  42. Savitzky, A.; Golay, M.J.E. Smoothing and Differentiation of Data by Simplified Least Squares Procedures. Anal. Chem. 1964, 36, 1627–1639. [Google Scholar] [CrossRef]
  43. Zhou, J.; Jia, L.; Menenti, M.; Gorte, B. On the performance of remote sensing time series reconstruction methods—A spatial comparison. Remote Sens. Environ. 2016, 187, 367–384. [Google Scholar] [CrossRef]
  44. Cortes, C.; Vapnik, V. Support-Vector Networks. Mach. Learn. 1995, 20, 273–297. [Google Scholar] [CrossRef]
  45. Foody, G.M.; Mathur, A. A relative evaluation of multiclass image classification by support vector machines. IEEE Trans. Geosci. Remote Sens. 2004, 42, 1335–1343. [Google Scholar] [CrossRef] [Green Version]
  46. Pal, M.; Mather, P.M. Support vector machines for classification in remote sensing. Int. J. Remote Sens. 2005, 26, 1007–1011. [Google Scholar] [CrossRef]
  47. Didan, K. MOD13Q1 MODIS/Terra Vegetation Indices 16-Day L3 Global 250m SIN Grid V006 [Data set]; NASA EOSDIS Land Processes DAAC. Available online: https://doi.org/10.5067/MODIS/MOD13Q1.006 (accessed on 23 March 2020).
  48. Steinier, J.; Termonia, Y.; Deltour, J. Smoothing and differentiation of data by simplified least square procedure. Anal. Chem. 1972, 44, 1906–1909. [Google Scholar] [CrossRef] [PubMed]
  49. Cao, R.; Chen, Y.; Shen, M.; Chen, J.; Zhou, J.; Wang, C.; Yang, W. A simple method to improve the quality of NDVI time-series data by integrating spatiotemporal information with the Savitzky-Golay filter. Remote Sens. Environ. 2018, 217, 244–257. [Google Scholar] [CrossRef]
  50. Mercier, G.; Lennon, M. Support vector machines for hyperspectral image classification with spectral-based kernels. In Proceedings of the IGARSS 2003, 2003 IEEE International Geoscience and Remote Sensing Symposium, Proceedings (IEEE Cat. No.03CH37477), Toulouse, France, 21–25 July 2003. [Google Scholar]
  51. Belousov, A.I.; Verzakov, S.A.; von Frese, J. A flexible classification approach with optimal generalisation performance: Support vector machines. Chemom. Intell. Lab. Syst. 2002, 64, 15–25. [Google Scholar] [CrossRef]
  52. Brown, M.; Lewis, H.G.; Gunn, S.R. Linear spectral mixture models and support vector machines for remote sensing. IEEE Trans. Geosci. Remote Sens. 2000, 38, 2346–2360. [Google Scholar] [CrossRef] [Green Version]
  53. Dak Lak Department of Statistics. 2018 Provincial Statistics by Districts; Dak Lak Department of Statistics: Buon Ma Thuot, Dak Lak, Vietnam, 2019. [Google Scholar]
  54. General Department of Land Administration. Land Use Map of Dak Lak; Vietnam’s Ministry of Narural Resources and Environment: Hanoi, Vietnam, 2016.
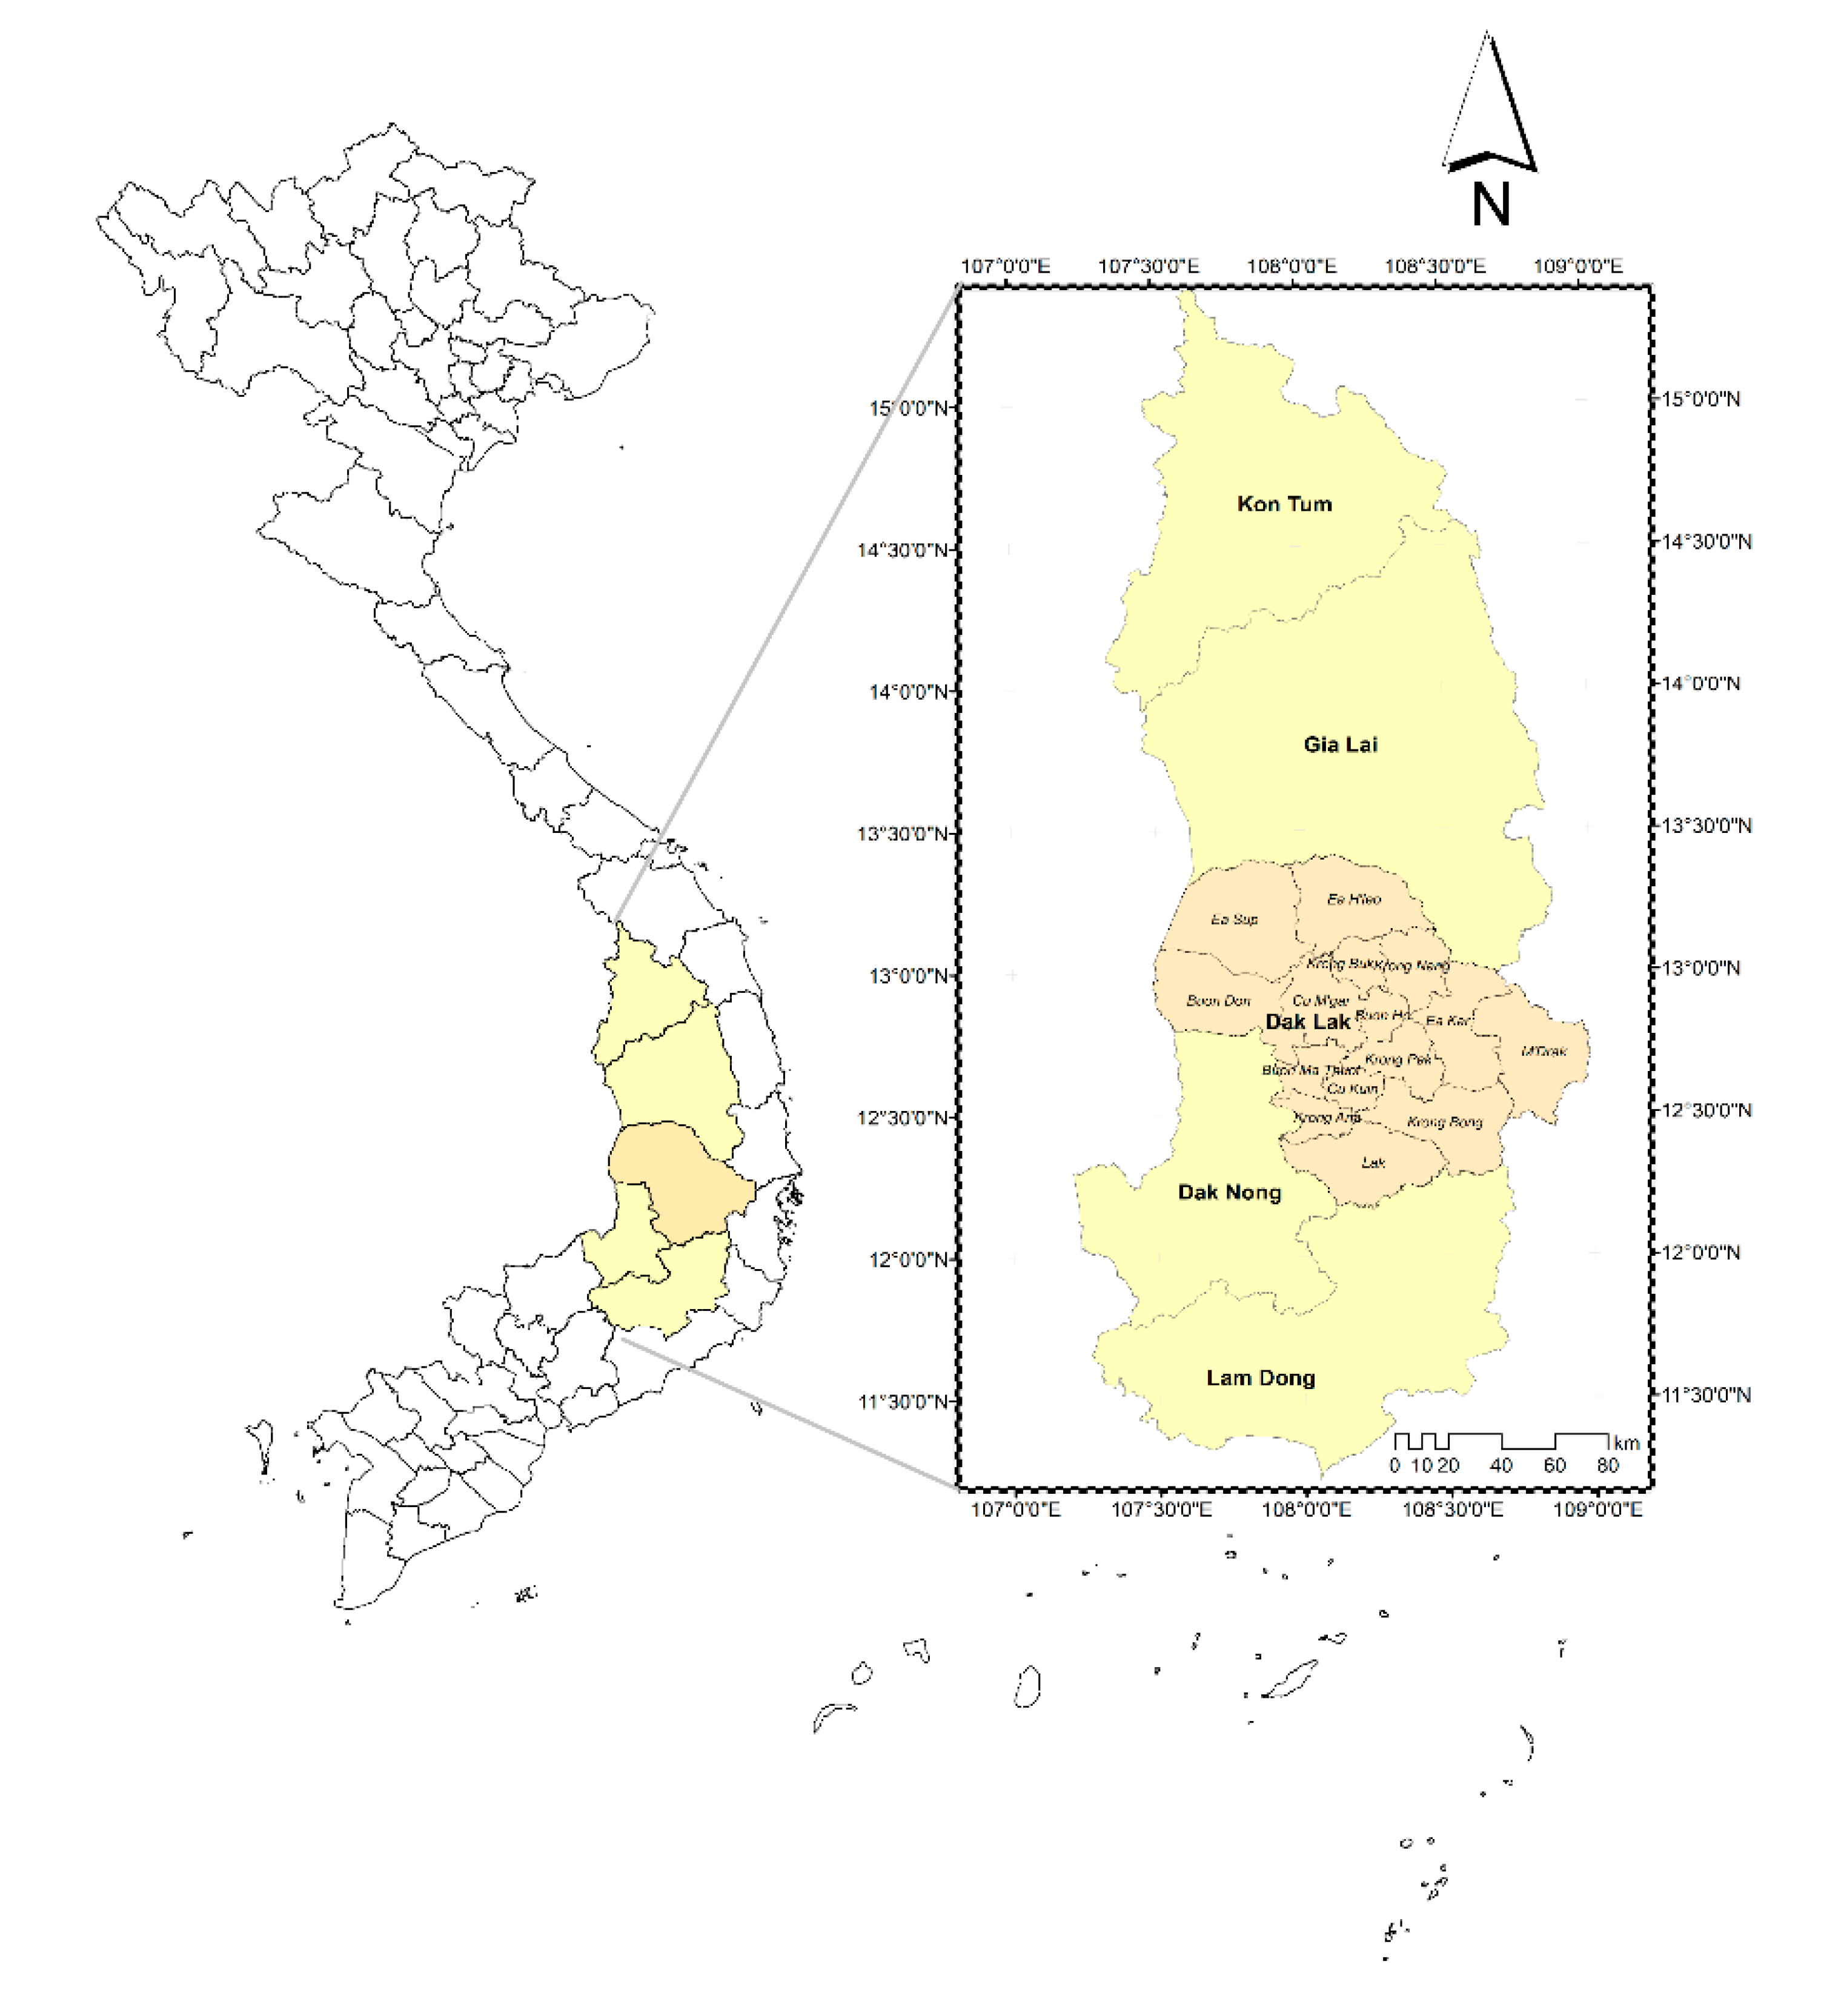
Figure 1. Geographical location of Dak Lak province within the Central Highlands region, Vietnam.
Agronomy 10 00478 g001
Figure 2. The 2015 official land use map.
Agronomy 10 00478 g002
Figure 3. Distribution of visited maize fields within the district boundary of Dak Lak province, Vietnam.
Agronomy 10 00478 g003
Figure 4. Support Vector Machine classifier.
Agronomy 10 00478 g004
Figure 5. A training sample of 1-season maize crop class over a MOD13Q1 grid (in white) and a high spatial resolution image of Google Earth Pro taken on 18 February 2019.
Agronomy 10 00478 g005
Figure 6. The 16-day EVI time series of 2-cropping-season maize before and after Savitzky–Golay filter application.
Agronomy 10 00478 g006
Figure 7. The Savitzky–Golay reconstructed 16-day EVI time series of evergreen forest (a), coffee (b) and rice (c) classes.
Agronomy 10 00478 g007
Figure 8. Distribution of maize cropping patterns and other vegetation cover types using ENVI Support Vector Machine classifier.
Agronomy 10 00478 g008
Figure 9. Comparison of the summarized maize areas estimated by the Support Vector Machine (SVM) classification and the 2018 official statistical data for 15 districts of Dak Lak.
Agronomy 10 00478 g009
Table 1. Accuracy of the 2018-produced map of the maize cropping patterns and other vegetation covers.
Class of Sample Sites According to Location on the MapSamplesUser’s Accuracy
MaizeRiceCoffee and/or Other Perennial CropsOther Annual Cash CropsForest
Class of the sample sites according to the map legendMaize203 3 2677%
Rice217 2 2181%
Coffee and/or other perennial crops1 25133083%
Other annual cash crops41219 2673%
Forest 3 151883%
Samples
Producer’s accuracy
2721302518121
74%81%83%76%83%
Overall Accuracy79%
Kappa0.74
Table 2. Comparison of total cultivated maize acreage by districts from Support Vector Machine (SVM) classifier estimation and the 2018 official statistics (expressed in ha).
DistrictSVMOfficial Statistics (2018)Difference
Buon Ma Thuot32363211+25
Ea H’leo16,56715,320+1247
Ea Sup62005468+732
Krong Nang66117866−1254
Krong Buk15691872−303
Buon Don86016710+1891
Cu M’gar60389472−3434
Ea Kar10,8629647+1215
M’ Dak50947089−1995
Krong Pak10,11812,882−2764
Krong Bong61828579−2397
Krong Ana17382146−408
Lak43075332−1025
Cu Kuin17112050−339
Buon Ho29012387+514
Total91,735100,031−8296