Article

Changes in Leaf Structure and Chemical Compositions Investigated by FTIR Are Correlated with Different Low Potassium Adaptation of Two Cotton Genotypes

1
Microelement Research Center, College of Resources and Environment, Huazhong Agricultural University, Wuhan 430070, China
2
Southern Regional Collaborative Innovation Center for Grain and Oil Crops in China, College of Resources and Environmental Sciences, Hunan Agricultural University, Changsha 410128, China
3
Root Biology Center, College of Natural Resources and Environment, South China Agricultural University, Guangzhou 510642, China
*
Author to whom correspondence should be addressed.
Agronomy 2020, 10(4), 479; https://doi.org/10.3390/agronomy10040479
Submission received: 5 March 2020 / Revised: 25 March 2020 / Accepted: 27 March 2020 / Published: 1 April 2020
(This article belongs to the Section Soil and Plant Nutrition)

Abstract

:
Potassium (K) is an essential macronutrient for plant growth and development. K deficiency seriously affects protein and carbohydrate synthesis in the leaves of plants. The present study was carried out with two cotton genotypes with low K tolerance to investigate the different changes on chemical composition and structure in leaves of K-efficient cotton genotypes under low K stress by using Fourier transform infrared spectroscopy (FTIR) technology. The results showed that K deficiency decreased the leaf photosynthetic pigments in both genotypes, but significant observations were noted in K-efficient genotype 103. FTIR spectra and semiquantitative analysis revealed that the cell membrane permeability, cell wall pectin, protein, and polysaccharides of leaves were greatly influenced by K deficiency, and the changes were more significant in the leaf of genotype 122, indicating a better adaptation to low K in genotype 103. The results of this study revealed that the difference of low K adaptation of these two cotton genotypes might be related to maintaining cell wall integrity and carbohydrate transport in cells. These different compositional and structural changes in the leaves of the two cotton genotypes under K-deficient level gain a new physiological mechanism of K efficiency in cotton.

1. Introduction

Potassium (K) is an essential mineral nutrient for normal growth and development of higher plants [1]. It is widely accepted that K plays a vital role in activating the enzyme system, maintaining photosynthesis, and promoting translocation of photosynthate [2]. A high concentration of K+ is required for optimal protein synthesis and photosynthesis [3]. Although the earth’s crust contains 2.6% K, the majority of K+ in soils is either dehydrated or attached to oxygen atoms and is consequently unavailable for plants. Therefore, K deficiency has become a global issue [4,5]. Chemical fertilizer is mandatory to ensure an adequate supply of available K to crops in intensive agriculture. The K fertilizer demand in the world is projected to further increase from 23.8 million tons (Mt) in 2011 to 27.1 Mt in 2015 due to the targeted increase in global agricultural production [6]. According to the data of the Food and Agriculture Organization of the United Nations (FAO), the global K fertilizer demand has reached 68 (Mt) in 2019. China has a shortage of K resources, and K deficiency has severely limited the development of crop yield and quality. To address K deficiency in agriculture production, China uses approximately 22% of the total global K fertilizer [6]. In a future perspective, K-efficient genotypes in combination with optimized soil fertilization is a perfect nutrient management strategy for stable and sustainable agriculture [7]. Screening genotypes with high K use and uptake efficiency not only provides genetic materials for breeding K-efficient genotypes but also improves the utilization rate of K fertilizer in the soil. Moreover, it is beneficial for exploring the replacement of nonrenewable mineral resources with biological resources and reducing environmental pollution caused by over-K fertilization. Much research has been done on the genotypic differences of K uptake and use efficiency in many crops [8,9,10,11,12,13].
In China, cotton (Gossypium hirsutum L.) is an important economic plant. Potassium deficiency is frequently observed in cotton production and is a major cause for loss of productivity and quality in China. Jiang et al. [14] selected two genotypes (K-efficient genotype 103 and K-inefficient genotype 122) from 86 cotton genotypes with different K efficiency levels. A number of studies have been carried out on these two cotton genotypes to indicate their different responses to low K stress, including absorption, transport, distribution, and utilization of K [15]; the pattern of K absorption and distribution [16]; K efficiency characteristics and root morphology [13]; photosynthesis and photosynthate partitioning in cotton [17]; and K absorption kinetic parameters and patterns [18]. Jiang et al. [15] reported that only lower leaves showed K-deficient symptoms in K-efficient genotype 103 under low K level, while all leaves demonstrated K-deficient symptoms in K-inefficient genotype 122. Hao et al. [19] investigated different effects of low K on leaf photosynthesis and photosynthate transport. However, some information on the compositional and structural differences of leaf components at different K levels and how these changes are related to low K adaptation in these two genotypes is not clear.
Fourier transform infrared spectroscopy (FTIR) is an important analytical technique and has been widely used to study the chemical composition of plant leaf, root, and cell wall structure [20,21,22,23]. Thus, this latest technology is considered a reliable approach and can be used to reflect the chemical composition and structural information of functional groups of leaves in two cotton genotypes at different K levels.
In spite of a lot of information about the contrast of K efficiency of different cotton genotypes, very little is known about how the various leaf components respond to low K and whether the changes in composition and structure are associated with the different K efficiency genotypes. Therefore, the K-efficient genotype 103 and K-inefficient genotype 122 were selected as research materials, and chemical analysis methods combined with FTIR were conducted to examine changes in leaf architecture and components between the two cotton genotypes treated with different K levels and ultimately gain a new physiological mechanism of K efficiency in cotton.

2. Materials and Methods

2.1. Plant Material and Treatments

The seeds of K-efficient genotype 103 and K-inefficient genotype 122 were provided by Cotton Research Institute, Chinese Academy of Agricultural Sciences, and Huazhong Agricultural University, Wuhan, Hubei province, China. Uniform seeds were selected and soaked in 50~60 °C ultrapure water for 6 hours. Then, these seeds were cultured in an incubator at 30 °C and moistened every day with sterile water until germination. Once the radicle had reached at least 1 cm in length, seeds were transferred to absorbent gauze fixed on a box containing distilled water. Some uniform-sized seedlings with expanded cotyledon were transplanted to the 3-liter plastic bucket, of which the outer wall was painted black to block light. Each bucket had three seedlings. All the plastic buckets were immersed in 1 mol L−1 HCl and washed with distilled water prior to the experiment.
The seedlings were cultivated hydroponically in a nutrient solution [24], containing the following macronutrients and micronutrients as shown in Table 1. Meanwhile, K was supplied in the form of KCl at 2 mg L−1 as the low K level (K1) and 20 mg L−1 as the normal K level (K2). The nutrient solution was applied at a quarter of the strength for the first week then to half of the strength for the second week. The culture solution was aerated for 20 min at an interval of 4 hours and renewed every week. The experiment had a completely randomized design with four treatments (2 K levels × 2 varieties), each treatment consisted of five buckets (five replications), and the three seedlings cultured in the same bucket were defined as one replication.

2.2. Determination of SPAD Value and Photosynthetic Pigment Contents

Plant samples were collected and processed at the fourth week of K treatments, and then the SPAD (Soil and plant analyzer develotrnent) value was recorded by chlorophyll meter (SPAD–502 Plus, Konica Minolta Sensing, INC., Tokyo, Japan) to qualitatively reflect photosynthetic pigment level in leaves. Leaf photosynthetic pigment contents were measured according to method of Lichtenthaler and Wellburn [25].

2.3. Composition and Structure Analysis of Functional Leaves by FTIR

Leaf samples were dried to a constant weight (all the water in leaves was removed until the dry weight of leaves would not decrease with additional drying) at 75 °C and then ground to a fine powder. Then, the powder was mixed uniformly with KBr (1:100 m/m) and pressed into tablets for FTIR spectroscopy analysis. Infrared (IR) spectra in the range of 4000–400 cm−1 were recorded by a VERTEX 70 spectrometer with a resolution of 4 cm−1 and 32 scans per sample. The wavelengths between 1800 and 800 cm−1, containing characteristic peaks for polysaccharides, amide, and ester, were selected to monitor the chemical information of leaves. All spectra were normalized and baseline was corrected by OPUS management software.

2.4. Statistical Analysis

Data analysis was performed and graphs were developed by SPSS software (IBM SPSS Statistics 20) and Origin 8.6 (OriginLab Corporation, Northampton, MA, USA). Significant differences (p < 0.05) between different treatments were determined by ANOVA followed by t-test, and significant differences (p < 0.05) within each group were indicated by different lower case letters (a, b, c, and d).

3. Results

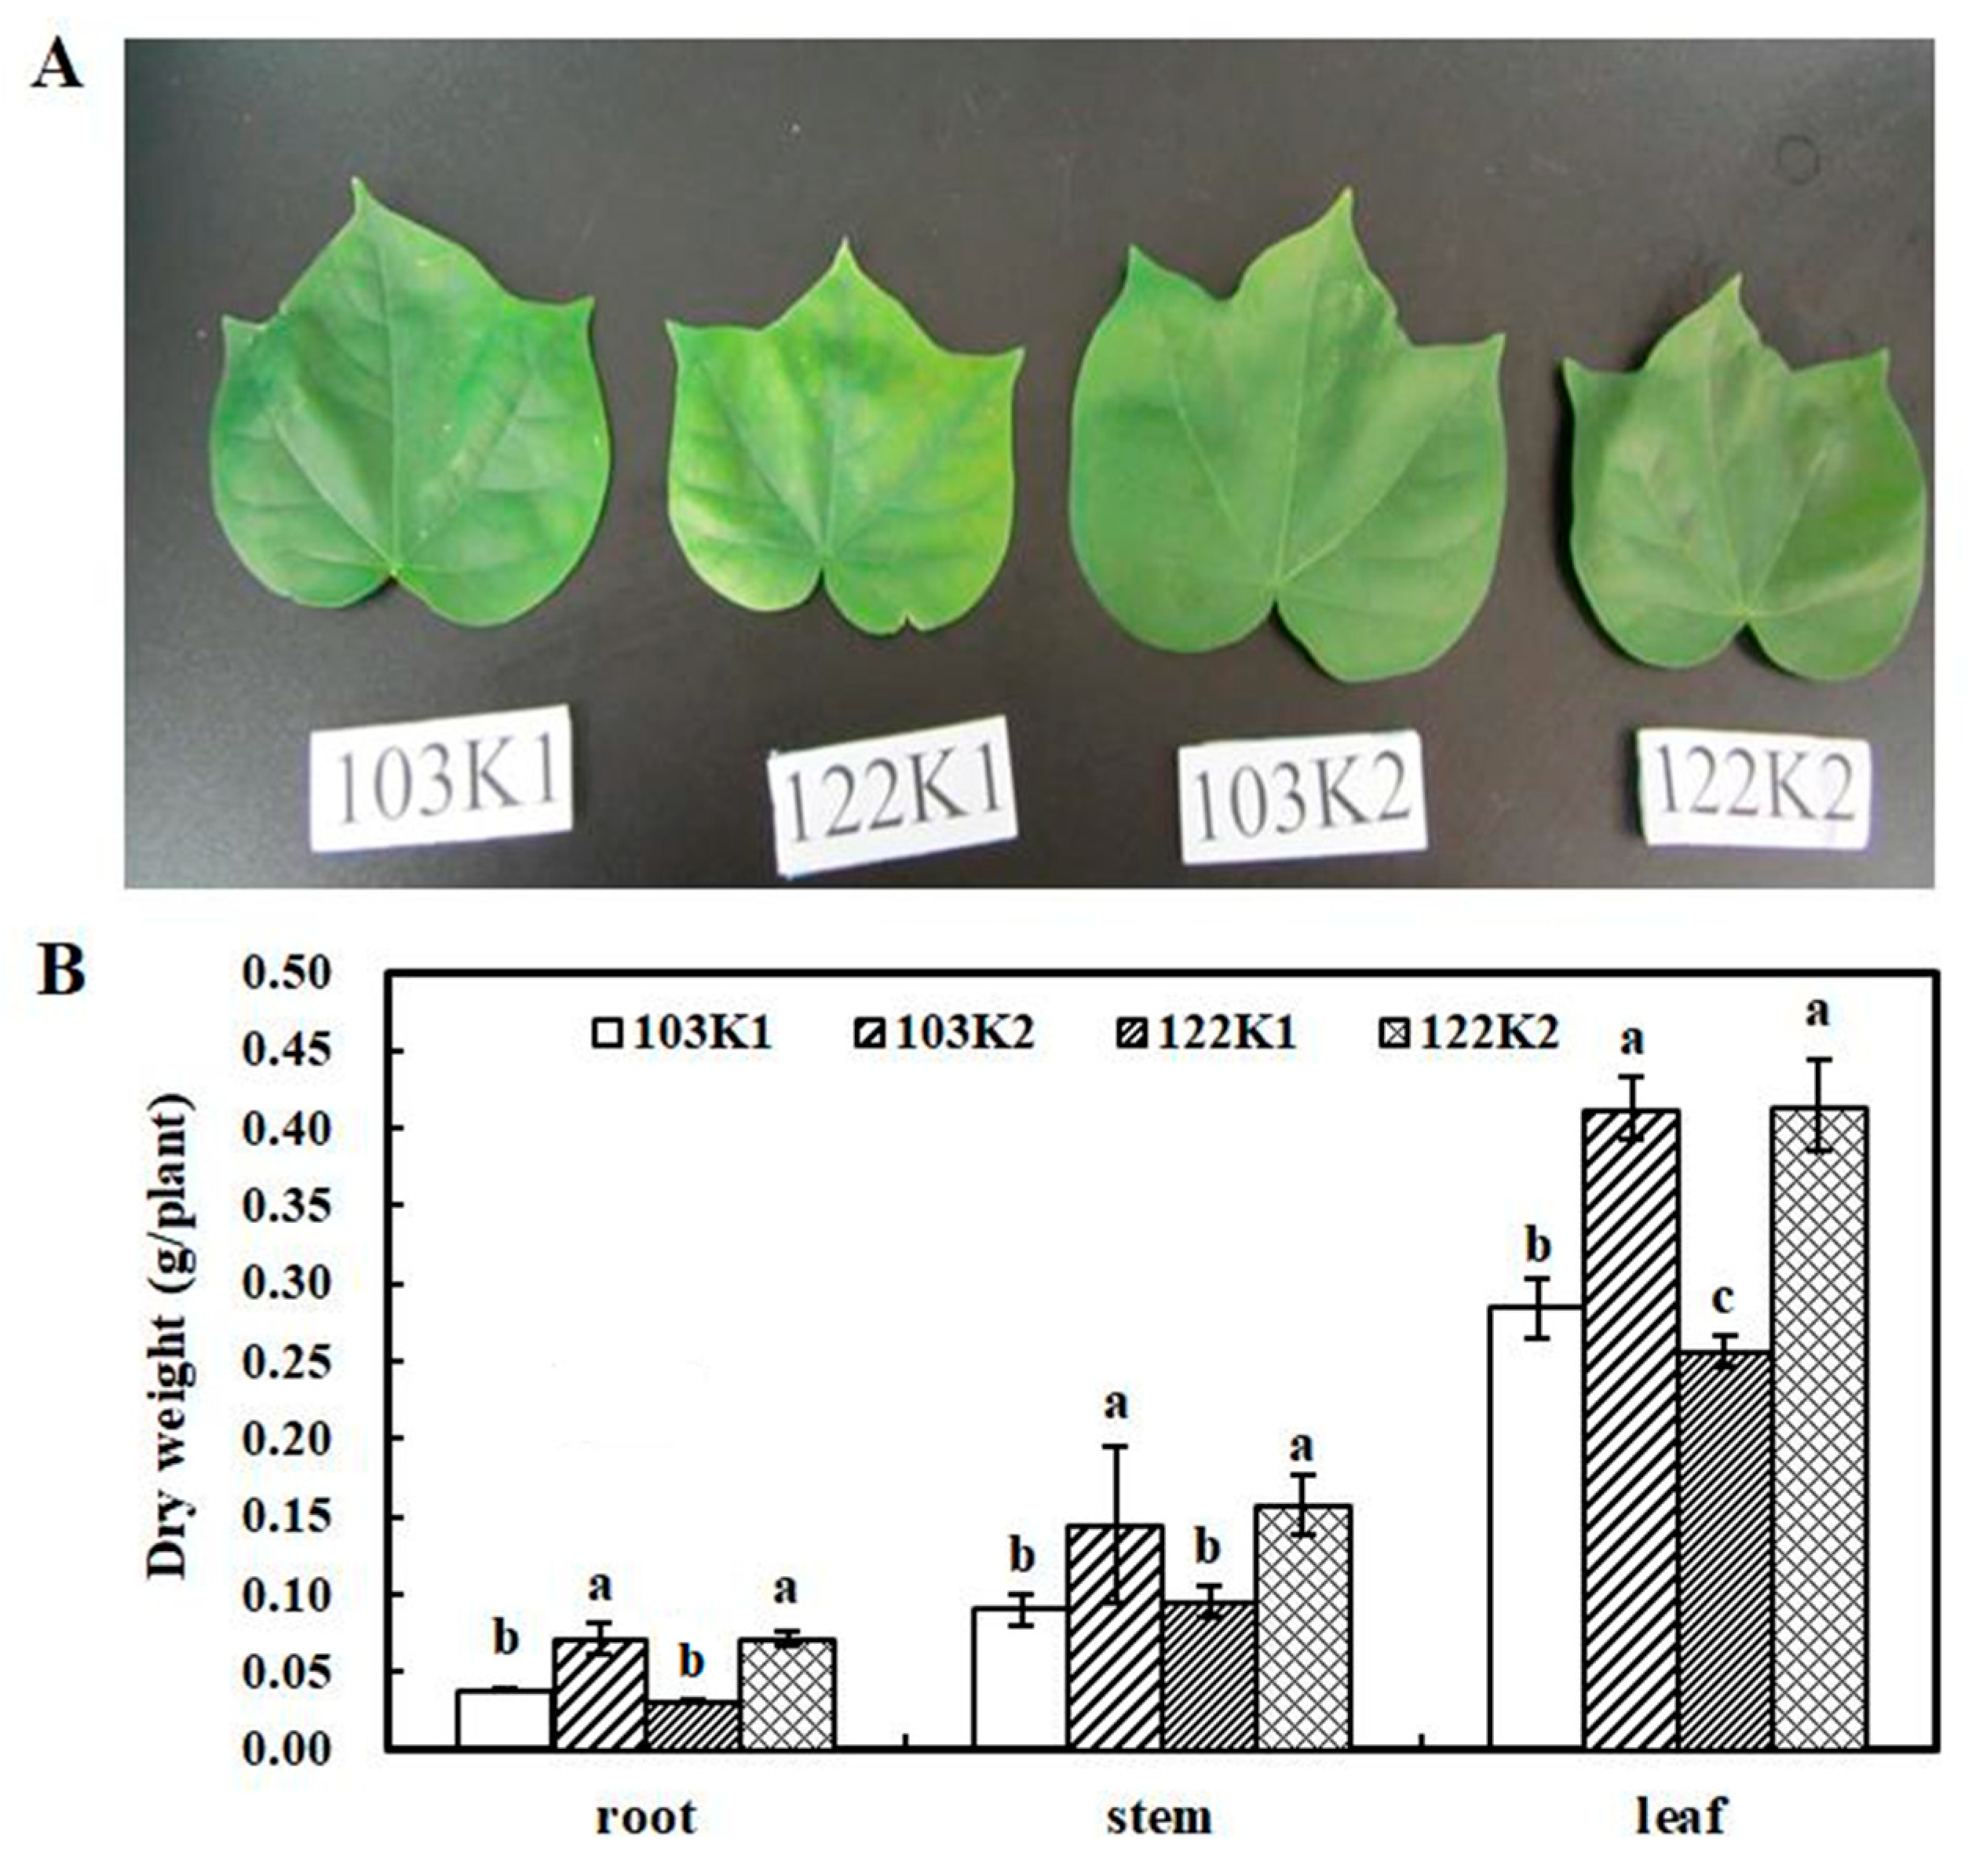
3.1. Plant Growth and Symptoms of Functional Leaves under Different K Treatments

As shown in Figure 1A, functional leaves of the two cotton genotypes were green and healthy under K-normal conditions, while under K-deficient conditions, leaf chlorosis were observed in both cotton genotypes. Moreover, the leaves of K-inefficiency genotype 122 had more severe yellowing symptoms than that of K-efficiency genotype 103. Furthermore, the two cotton genotypes treated with adequate K have similar dry weight of root, stem, and leaf, and although K deficiency impeded dry mass accumulation on different plant parts at a significant level (p < 0.05), the inhibition was more obvious in genotype 122 (Figure 1B). The results indicated that genotype 122 is more sensitive to K deficiency.
The SPAD values of functional leaves were decreased in both genotypes under K deficiency; however, such effects were more obvious in the 122K1 treatment. Furthermore, there was no significant difference in SPAD values of functional leaves in the two genotypes under normal K supply (Figure 2A). Similarly, the photosynthetic pigment contents of functional leaves under different K conditions suggested that low K treatment remarkably decreased the contents of chla, chlb, chl(a+b), and carotenoid in functional leaves, especially in leaves of K-inefficient genotype 122 (Figure 2B). The results of SPAD and photosynthetic pigments are consistent with the pattern of K-deficient symptoms revealed by Figure 1A.

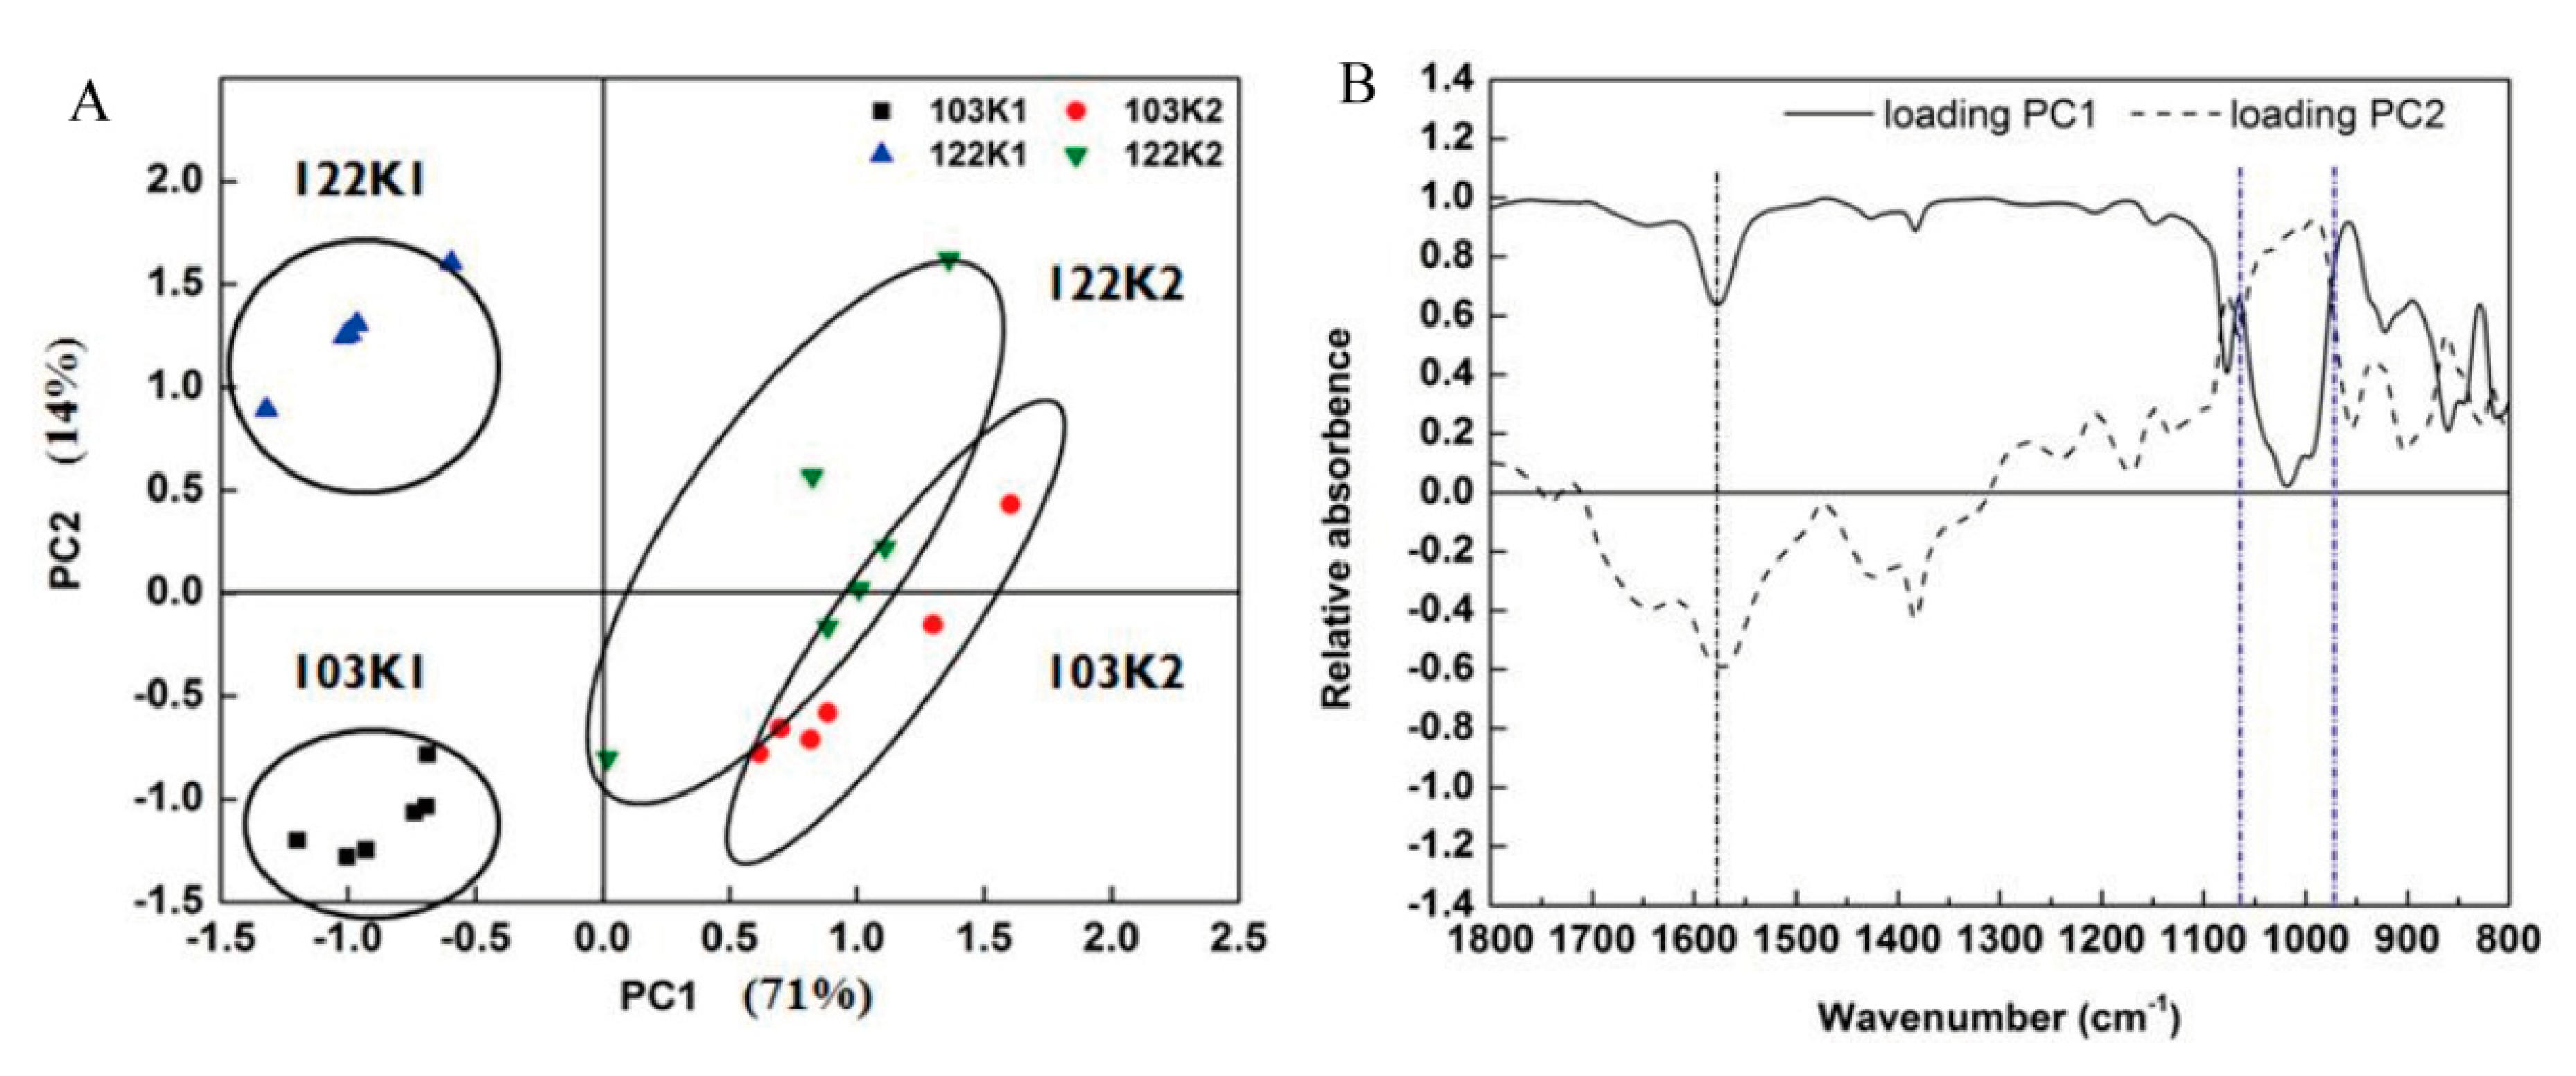
3.2. FTIR Spectral Analysis of the Functional Leaves in the Two Cotton Genotypes

The absorbances of chemical bands vibration in the functional leaves ranged between 4000–400 cm−1, and results showed that most of the relative absorbance was decreased by low K treatment (Figure 3A). However, the significant differences on location and the relative absorbance of vibrations induced by low K were mainly manifested in the region of 1800–800 cm−1 (Figure 3B), indicating differences in the structure and composition of the function of leaves between control and low-K cotton.
As shown in Figure 3B, relative absorbance corresponding to characteristic peaks of the normal functional leaves was much higher than that in K-deficient cotton genotype 103 and 122. Table 2 lists the assignment of absorption bands to their major chemical components. The peak located around 1735 cm−1 corresponds to C=O stretching vibration and is mainly related to alkyl-esters in lipid membrane and cell walls pectin. K deficiency caused lower intensity at 1735 cm−1 in spectra of the two genotypes, which indicated that low-K stress destroyed the cell membrane permeability and decreased the pectin content in functional leaves. The peaks at 1650, 1550, and 1244 cm−1 correspond to amide I, amide II, and amide III, respectively, and vibration located at 1436 cm−1 originates from C−N stretching of protein. The weakened intensity of these peaks showed that K starvation destroyed the protein structure and decreased protein content in functional leaves of genotypes 103 and 122. Additionally, K deficiency resulted in the obvious shift from 1652 to 1641 cm−1, and a missing peak around at 1386 cm−1 was found in the functional leaves of K-inefficient genotype 122. Spectra of low-K leaf had a lower relative absorbance at 1384 cm−1, which is characteristic of the CH3 stretching vibration of cellulose [26]. The changes in absorption bands located at 1100–1000 cm−1 between FTIR spectra of normal K treatment and low K treatment were more significant in K-efficient genotype 103, suggesting a remarkable decrease of carbohydrates, which might be induced by the weakened photosynthesis in leaves of genotype 103. The results indicated that K deficiency has a more significant effect on protein structure and cellulose in the functional leaves, while it does not decrease carbohydrates in K-inefficient genotype 122.
The result of principal components analysis showed that approximately 70% of total sample variability was incorporated in the first and second principal components (PC1 and PC2), accounting for 71% and 14% of the composition variability, respectively. Plots of PC score can reveal clustering in the data set. The plots of the PC1 versus PC2 scores suggested that, regardless of K-efficient genotypes, the leaf compositions and structure of K-deficient and K-normal cotton were generally resolved from each other by PC1 (71%), while an overlap between the two treatments was observed in PC2 (14%). In addition, the two genotypes under low K condition were resolved from each other by PC2 (14%) (Figure 4A). In combination with the loading corresponding to PC1 and PC2 (Figure 4B), differences in PC1 were mainly attributed to changes in proteins, and differences in PC2 were associated with the changes of polysaccharides.

3.3. Semiquantitative Analyses of the Main Absorption Bands in Functional Leaves under Low K

Semiquantitative analysis is a common method in FTIR to eliminate the differences caused by sample quantity and indicate the repeatability of the spectra in one treatment. The semiquantitative analysis also can be calculated to analyze the changes in main absorption bands corresponding to functional group from chemical composition in the functional leaf under low K. The results suggest that the intensity of peaks at 1433, 1407, and 1244 cm−1 and 1076, and 1037 cm−1 attributed to proteins and carbohydrates, respectively were significantly changed by K deprivation in genotype 103 and l22, and the intensity of another peak located at 1101 cm−1 was remarkably increased in genotype 122 under low K treatment (Table 3). In order to further analyze the differences caused by low K treatment between these two genotypes, variations (%) were calculated and the results indicated that differences in vibrations attributed to polysaccharides were more significant in K-inefficient cotton genotype 122.

4. Discussion

Potassium is an essential macronutrient that participates in the activation of various enzymes and protein synthesis in plants and promotes transport of soluble substances in the xylem and phloem [27]. The accumulation of amino acids and amides in plants is one of the typical K-deficient symptoms [28]. A K deficiency has been proposed to limit protein synthesis by hindering the conversion process of amino acids to polypeptide [29]. Helal and Mengel [30] found that K supply enhances nitrogen (N) uptake and N incorporation into proteins. Significant changes were also observed in the protein concentration and leaf structure of K-starved cotton [31]. Our FTIR spectra showed the decreased intensities of vibrations in 1650, 1550, 1436, and 1244 cm−1 were associated with protein and its structure (Table 2), implying that K deficiency stress seriously influenced the protein synthesis and structure of both cotton genotypes. It has been reported that the disordered protein structure might be associated with the secondary structure of proteins from α helix into β fold [32].
In addition, the intensities at 1735 and 1384 cm−1 were also significantly decreased by K deficiency, especially the intensity at 1384 cm−1 in K-inefficient genotype 122 (Table 2). Meanwhile, K deficiency weakened the vibration of the peak at 1384 cm−1 in K-inefficient genotype 122 while it had no obvious effect on the sharpness of this peak in K-efficient genotype 103. The different changes induced by low K fertilization indicated that K deficiency reduced contents of pectin and cellulose in the cell wall [20] of functional leaf of the two cotton genotypes, and the effect on cellulose content was greater in 122. The secondary cell wall mostly composed of cellulose, hemicellulose, and lignin has a special cell organization present between the plasma membrane and primary wall of plants, and the structural integrity of secondary cell wall is closely related to normal cell morphology [33]. The results of the present study suggest that a cell wall of genotype 122 was more seriously damaged than genotype 103 under K deficiency stress, resulting in low K adaptation ability.
A high K+ concentration is also required for photosynthesis [34,35] and appropriate K supply can effectively improve plant productivity, while K deficiency leads to a decrease in chlorophyll content and photosynthetic rate [36]. Our results suggested K deficiency significantly decreased contents of four typical photosynthetic pigments of the functional leaf of genotype 103 and 122, especially of genotype 122 (Figure 2B). Furthermore, the two cotton genotypes showed obvious K-deficiency symptoms of leaf chlorosis under low K conditions, and K-inefficient genotype 122 showed more severe symptoms than K-efficient genotype 103 (Figure 1A). These results confirmed that K-efficient genotype 103 has the better adaptability to low K than genotype 122, as indicated in our previous study [18]. In this study, the two cotton genotypes significantly differed in carbohydrates synthesis and its transport under low-K stress (Table 3). Compared with normal-K treatment, genotype 122 revealed reduced carbohydrates transport than genotype 103. It is widely accepted that K deficiency can increase sucrose concentration in leaves. The translocation of photosynthates from leaf to root and other organs is mainly mediated by the phloem, and adequate K supply is known to play a crucial role in phloem translocation of assimilates [6]. It has been reported that sugar accumulation in leaves contributed to the replacement of osmotic molecules; however, inhibition of photosynthesis products transportation from leaf to root hindered root growth of plants [37]. In this study, the severe assimilation of polysaccharides in leaf and less carbohydrate transportation from leaf of genotype 122 might be related to its poor adaptation ability to low K.

5. Conclusions

The results of the present study indicated that K deficiency hampered the synthesis of photosynthetic pigments, and remarkably changed leaf structure and chemical compositions of the two different cotton genotypes. Potassium deficiency inhibited the synthesis of proteins and resulted in the alteration of protein structure. In addition, the FTIR spectra indicated reduced cellulose in the leaf of K-efficient genotype 103, and changes on polysaccharides were more significant in K-inefficient cotton genotype 122. Moreover, these changes induced by low K were more serious in the leaf of genotype 122 than genotype 103, implying that genotype 103 has a better adaptation to low K than genotype 122. Therefore, the different changes of structure and chemical compositions in leaf under low-K condition could be one of the key reasons for the difference of K efficiency between the two cotton genotypes.

Author Contributions

C.J. and Y.H. designed and supervised the experiment; X.W. replaced nutrition solution in the experiment and drafted the original manuscript; M.R. edited the language of the paper before submission. All authors have read and agree to the published version of the manuscript.

Funding

This research project was financially supported by the Chinese Postdoctoral Science Foundation (2019M652769), the Chinese State Natural Science Foundation (40801112), and Chinese Ministry of Agriculture Special Fund for Agro−scientific Research in the Public Interest (201203013).

Conflicts of Interest

The authors declare no conflicts of interest.

References

  1. Sullivan, W.M.; Jiang, Z.C.; Hull, R.J. Root morphology and its relationship with nitrate uptake in Kentucky bluegrass. Crop Sci. 2000, 40, 765–772. [Google Scholar] [CrossRef]
  2. Marschner, P. Mineral Nutrition of Higher Plants, 3rd ed.; Elsevier: Amsterdam, The Netherlands, 2012; pp. 299–312. [Google Scholar]
  3. Szczerba, M.W.; Britto, D.T.; Kronzucker, H.J. K+ transport in plants: Physiology and molecular biology. J. Plant Physiol. 2009, 166, 447–466. [Google Scholar] [CrossRef] [PubMed]
  4. Alemán, F.; Nieves-Cordones, M.; Martínez, V.; Rubio, F. Root K+ Acquisition in Plants: The Arabidopsis thaliana Model. Plant Cell Physiol. 2011, 52, 1603–1612. [Google Scholar] [CrossRef] [PubMed]
  5. Wang, N.; Hua, H.; Eneji, A.E.; Li, Z.; Duan, L.; Tian, X. Genotypic variations in photosynthetic and physiological adjustment to potassium deficiency in cotton (gossypium hirsutum). J. Photochem. Photobiol. B Biol. 2012, 110, 1–8. [Google Scholar] [CrossRef]
  6. Zörba, C.; Mehmet, S.; Edgar, P. Potassium in agriculture—Status and perspectives. J. Plant Physiol. 2014, 171, 656–669. [Google Scholar] [CrossRef] [PubMed]
  7. Rengel, Z.; Damon, P.M. Crops and genotypes differ in efficiency of potassium uptake and use. Physiol. Plant. 2008, 133, 624–636. [Google Scholar] [CrossRef]
  8. Pettersson, S.; Jensén, P. Variation among species and varieties in uptake and utilization of potassium. Plant Soil 1983, 72, 231–237. [Google Scholar] [CrossRef]
  9. El-Bassam, N. A concept of selection for ‘low input’ wheat varieties. Euphytica 1998, 100, 95–100. [Google Scholar] [CrossRef]
  10. George, M.S.; Lu, G.Q.; Zhou, W.J. Genotypic variation for potassium uptake and utilization efficiency in sweet potato (Ipomoea batatas L.). Field Crop. Res. 2002, 77, 7–15. [Google Scholar] [CrossRef]
  11. Yang, X.E.; Liu, J.X.; Wang, W.M.; Li, H.; Luo, A.C.; Ye, Z.Q.; Yang, Y. Genotypic differences and some associated plant traits in potassium internal use efficiency of lowland rice (oryza sativa L.). Nutr. Cycl. Agroecosyst. 2003, 67, 273–282. [Google Scholar] [CrossRef]
  12. Damon, P.M.; Rengel, Z. Wheat genotypes differ in potassium efficiency under glasshouse and field conditions. Aust. J. Agric. Res. 2007, 58, 816–825. [Google Scholar] [CrossRef]
  13. Hao, Y.S.; Jiang, C.C.; Wang, X.L.; Xia, Y.; Chen, F. Differences of potassium efficiency characteristics and root morphology between two cotton genotypes. Acta Agron. Sin. 2011, 37, 2094–2098. [Google Scholar] [CrossRef]
  14. Jiang, C.C.; Gao, X.Z.; Wang, Y.H.; Lu, J.W.; Xu, F.S.; Shi, L. Potassium efficiency of various cotton genotypes and its nutritional mechanisms. Plant Nutr. Fertil. Sci. 2005, 11, 781–786. [Google Scholar]
  15. Jiang, C.C.; Chen, F.; Gao, X.Z.; Lu, J.W.; Wan, K.N.; Nian, F.Z.; Wang, Y.H. Different responses to potassium stress between potassium high efficiency and potassium low efficiency cotton genotypes efficiency and potassium low efficiency cotton genotypes. Sci. Agric. Sin. 2008, 41, 488–493. [Google Scholar]
  16. Xia, Y.; Jiang, C.C.; Chen, F.; Lu, J.W.; Wang, Y.H. Differences in growth and potassium−use efficiency of two cotton genotypes. Commun. Soil Sci. Plant Anal. 2011, 42, 132–143. [Google Scholar] [CrossRef]
  17. Xia, Y.; Jiang, C.C.; Wang, X.; Chen, F. Effects of low potassium stress on the photosynthesis and photosynthate partitioning of cotton. Chin. J. Appl. Ecol. 2013, 32, 1476–1482. [Google Scholar]
  18. Hao, Y.S.; Lei, J.; Wang, Q.L.; Wu, L.S.; Jiang, C.C. Two typical K−efficiency cotton genotypes differ in potassium absorption kinetic parameters and patterns. Acta Agric. Scand. Sect. B Soil Plant Sci. 2015, 1, 45–53. [Google Scholar] [CrossRef]
  19. Hao, Y.S.; Lei, J.; Wu, X.W.; Wu, L.S.; Jiang, C.C. Photosynthate transport rather than photosynthesis rate is critical for low potassium adaptation of two cotton genotypes. Acta Agric. Scand. Sect. B Soil Plant Sci. 2016, 66, 170–177. [Google Scholar] [CrossRef]
  20. Yang, J.; Yen, H.E. Early salt stress effects on the changes in chemical composition in leaves of ice plant and arabidopsis. A fourier transform infrared spectroscopy study. Plant Physiol. 2002, 130, 1032–1042. [Google Scholar] [CrossRef] [Green Version]
  21. Dokken, K.M.; Davis, L.C.; Marinkovic, N.S. Use of infrared microspectroscopy in plant growth and development. Appl. Spectrosc. Rev. 2005, 40, 301–326. [Google Scholar] [CrossRef]
  22. Liu, G.D.; Dong, X.C.; Liu, L.C.; Wu, L.S.; Peng, S.A.; Jiang, C.C. Boron deficiency is correlated with changes in cell wall structure that lead to growth defects in the leaves of navel orange seedlings. Sci. Hortic. 2014, 176, 54–62. [Google Scholar] [CrossRef]
  23. Wu, X.W.; Muhammad, R.; Yan, L.; Du, C.Q.; Liu, L.Y.; Jiang, C.C. Boron deficiency in trifoliate orange induces changes in pectin composition and architecture of components in root cell walls. Front. Plant Sci. 2017, 8, 1882. [Google Scholar] [CrossRef] [PubMed] [Green Version]
  24. Hoagland, D.R.; Arnon, D.I. The water-culture method for growing plants without soil. Calif. Agric. Exp. Stn. 1950, 347, 357–359. [Google Scholar]
  25. Lichtenthaler, H.K.; Wellburn, A.R. Determinations of total carotenoids and chlorophylls a and b of leaf extraets in different solvents. Biochem. Soc. Trans. 1983, 11, 591–592. [Google Scholar] [CrossRef] [Green Version]
  26. Zhang, X.B.; Liu, P.; Li, D.T.; Xu, G.T.; Jiang, M.J. FTIR characterization of chemical composition changes of plant root cell wall induced by chromium. Spectrosc. Spectr. Anal. 2008, 28, 1067–1070. [Google Scholar]
  27. Kaack, K.; Pedersen, H.L. Effects of potassium, phosphorus and nitrogen fertilization on endogenous ethylene and quality characteristics of apples (Malus Domestica L.). J. Plant Nutr. 2014, 37, 1148–1155. [Google Scholar] [CrossRef]
  28. Evans, H.J.; Sorger, G.J. Role of mineral elements with emphasis on the univalent cations. Annu. Rev. Plant Physiol. 2003, 17, 47–76. [Google Scholar] [CrossRef]
  29. Lubin, M.; Ennis, H.L. On the role of intracellular potassium in protein synthesis. BBA Spec. 1964, 80, 614–631. [Google Scholar] [CrossRef]
  30. Helal, H.M.; Mengel, K. Nitrogen metabolism of young barley plants as affected by NaCl−salinity and potassium. Plant Soil 1979, 51, 457–462. [Google Scholar] [CrossRef]
  31. Wu, X.W.; Hao, Y.S.; Lei, J.; Jiang, C.C. FTIR spectroscopic characterization of material composition in functional leaf of cotton under potassium or/and boron stress. Spectrosc. Spectr. Anal. 2016, 3, 676–680. [Google Scholar]
  32. Xie, M.X.; Liu, Y. Determination of protein secondary structure infrared spectrum band for the amide III. Chem. J. Chin. Univ. 2003, 24, 226–231. [Google Scholar]
  33. Handakumbura, P.P.; Hazen, S.P. Transcriptional regulation of grass secondary cell wall biosynthesis: Playing catch-up with Arabidopsis thaliana. Front. Plant Sci. 2012, 3, 74. [Google Scholar] [CrossRef] [PubMed] [Green Version]
  34. Reddy, K.R.; Zhao, D. Interactive effects of elevated CO2 and potassium deficiency on photosynthesis, growth, and biomass partitioning of cotton. Field Crop. Res. 2005, 94, 201–213. [Google Scholar] [CrossRef]
  35. Chérel, I.; Lefoulon, C.; Boeglin, M.; Sentenac, H. Molecular mechanisms involved in plant adaptation to low K+ availability. J. Exp. Bot. 2014, 65, 833–848. [Google Scholar] [CrossRef]
  36. Xu, Y.W.; Zou, Y.T.; Husaini, A.M.; Zeng, J.W.; Guan, L.L.; Liu, Q.; Wu, W. Optimization of potassium for proper growth and physiological response of Houttuynia cordata Thunb. Environ. Exp. Bot. 2011, 71, 292–297. [Google Scholar] [CrossRef]
  37. Zhao, D.; Oosterhuis, D.M.; Bednarz, C.W. Influence of potassium deficiency on photosynthesis, chlorophyll content, and chloroplast ultrastructure of cotton plants. Photosynthetica 2001, 39, 103–109. [Google Scholar] [CrossRef]
Figure 1. Different phenotype in functional leaves (A) and dry weight in different parts (B) of the two genotypes under K1 and K2 treatment. Bars are means of three replicates ± SD. Different letters in each group indicate significant differences at the 5% probability level.
Agronomy 10 00479 g001
Figure 2. SPAD values (A) and photosynthetic pigment contents (B) of functional leaves of the two cotton genotypes under K1 and K2 treatment. Bars are means of three replicates ± SD. Different letters in each group indicate significant differences at the 5% probability level.
Agronomy 10 00479 g002
Figure 3. Absorption FTIR spectra in the region of 4000–400 cm−1 (A) and 1800–800 cm−1 (B) under different K treatments in two different K-efficiency cotton genotypes.
Agronomy 10 00479 g003
Figure 4. Plot of the first two PC scores obtained by exploratory PCA of individual spectra in 1800–800 cm−1 from each K treatment of the two cotton genotypes (A) and loadings corresponding to PC1 and PC2 based on their scores of individual spectra in 1800–800 cm−1 (B).
Agronomy 10 00479 g004
Table 1. Nutrients and their contents in the nutrient solution.
Nutrient VarietiesContents
MacronutrientsNH4NO30.24 g L−1
Na2HPO40.10 g L−1
NaH2PO40.10 g L−1
CaCl2·2H2O0.36 g L−1
MgSO4·7H2O0.50 g L−1
MicronutrientsEDTA−Fe48.5 mg L−1
H3BO32.86 mg L−1
MnCl2·4H2O1.81 mg L−1
ZnSO4·7H2O,0.22 mg L−1
CuSO4·5H2O0.08 mg L−1
Na2MoO4·4H2O0.09 mg L−1
Table 2. The assignment of absorption bands to major chemical components and physiological functions.
Wavenumber (cm−1)AssignmentsPossible ChemicalsPhysiological Functions
1735C=O stretchingEster compoundCell membrane permeability and cell wall structure
1650C=O stretching in peptide bondsAmide IProtein structure and content
1550N–H bending or C–N stretchingAmide II
1436C–N stretching in peptide bondsProtein
1384CH3 stretchingCelluloseCell wall structure
1244C=O stretching or NH2 deformationAmide IIIProtein structure
1103C–C, C–O stretching, or C–H bendingCarbohydratesPhotosynthesis
1076
1035
Table 3. Semiquantitative analyses to FTIR spectra of functional leaves under different K conditions.
Wavenumber (cm−1)TreatmentVariation (%)
103–K1103–K2122–K1122–K2103122
16490.960.980.870.89−2.3−1.5
14330.951.05 *0.860.93 *−9.5−7.0
14070.951.05 *0.860.93 *−9.5−7.0
12440.560.64 *0.580.63 *−12.6−7.8
11011.201.171.25 *1.102.913.1 *
10761.20 *1.121.30 *1.066.522.3 *
10371.02 *0.951.15 *0.917.427.5 *
Note: data in the table were calculated by the relative absorbance/relative absorbance at 2925 cm−1; * indicates significant difference at p < 0.05 by t-test (n = 6). Variation was calculated by the following formula: X = A L A N A N × 100 % , where AL is relative absorbance of low K condition, and AN is relative absorbance of normal K condition.

