Article

Establishment and Application of Critical Nitrogen Dilution Curve for Rice Based on Leaf Dry Matter

1
College of Agronomy, Shenyang Agricultural University, Shenyang 110866, China
2
Heilongjiang Academy of Agricultural Sciences, Harbin 150086, China
*
Author to whom correspondence should be addressed.
Agronomy 2020, 10(3), 367; https://doi.org/10.3390/agronomy10030367
Submission received: 1 February 2020 / Revised: 27 February 2020 / Accepted: 2 March 2020 / Published: 6 March 2020
(This article belongs to the Special Issue Soil Fertility Management for Better Crop Production)

Abstract

:
In order to investigate the feasibility of using rice leaf critical nitrogen concentration as a nitrogen nutrition diagnosis index, a three-year positioning experiment with large-spike rice cultivar (Wuyoudao4) and multiple-spike rice cultivar (Songjing9) under five nitrogen levels (0, 60, 120, 180, and 240 kg·ha−1) was conducted. A critical nitrogen dilution curve and a nitrogen nutrition index (NNI) of rice leaf dry matter were constructed for Wuyoudao4 (Nc = 1.96LDM−0.56, R2 = 0.87, NNI was between 0.6–1.26, and Normalized Root Mean Square Error (n-RMSE) = 13.07%) and Songjing9 (Nc = 1.99LDM−0.44, R2 = 0.94, NNI was between 0.64–1.29, and n-RMSE = 15.89%). The relationship between dry matter and nitrogen concentration of rice leaves was a negative power function, and the model had good stability over the three years. The developed critical nitrogen concentration dilution curve, based on leaf dry matter, was able to diagnose nitrogen nutrition in rice efficiently. The model established in this study could be used to directly regulate and control the nitrogen nutrition of rice leaves.

1. Introduction

Heilongjiang Province is the main region for japonica rice production and is a significant commercial food base for China. The yields of japonica rice from Heilongjiang can reach up to 281,950,000 tons, ranking first in China. In order to improve people’s lives, we need to improve the yield and quality of rice. Compared to conventional rice, super rice has a high biological yield and strong growth potential, which is appropriate for high yield potential of rice in a high nitrogen environment [1]. The high-quality aromatic japonica rice, Wuyoudao4, is prone to lodging and yield reduction due to improper water and fertilizer management. In order to fully meet the growth needs of rice, excessive nitrogen fertilizer is applied [2]. Although proper nitrogen fertilizer application is necessary to improve rice yield, excessive nitrogen fertilizer application leads to a high cost of production. Other undesirable effects include environmental pollution and decline in the quality of rice, all of which negatively affect sustainable agricultural development [3]. Consequently, to realize rational fertilization of rice scientifically, it is necessary to find the critical point of nitrogen demand that can maximize rice yield with the lowest amount of nitrogen applied.
Nitrogen nutrition diagnosis is a key technology involving precise application of nitrogen fertilizer [4]. Presently, nitrogen nutrition diagnosis mainly involves nitrate rapid diagnosis, SPAD (Soil Plant Analysis Development) meter rapid diagnosis, spectral diagnosis, and remote sensing technology [5,6]. However, the results are unstable during the period when the crop is in luxury absorption [7]. Greenwood et al. established the critical nitrogen concentration dilution curve (Nc = aw-b) for C3 and C4 plants in order to overcome the measurement error caused by excessive nitrogen concentration in plants [8]. Based on plant dry matter and plant nitrogen concentration, the critical nitrogen concentration dilution curve is developed to find out the lowest nitrogen concentration when the aboveground dry matter reaches the maximum growth rate. Presently, this model has been applied to rape, cotton, potato, wheat, and rice crops [9,10,11,12,13]. Specifically for rice, the critical nitrogen model is based on the analysis of the entire plant; the curve changes as a result of the differences in climate, environment, and genetics. Mostly, this occurs when the plant is subjected to stress [13,14,15,16], this changes the distribution of dry matter; thus, affecting the establishment of the curve [17]. Consequently, it is important to study the dilution curve of critical nitrogen concentration in different crop organs.
Nitrogen accumulation is a crucial factor affecting the yield potential of rice. As rice grows, leaves facilitate photosynthesis, and the dry matter of leaves is an important indicator of growth potential, the light energy utilization rate, and the yield of crop [18]. Leaves are sensitive to changes in nitrogen nutrition within the environment. Ordinarily, dry matter and nitrogen concentration in leaves of rice increase along with the increase of nitrogen application. When nitrogen application reaches a certain level, the dry matter of leaves stabilizes, while the nitrogen concentration continues to increase. However, with the extension of the rice growth stage, dry matter accumulation of leaves increases, and nitrogen concentration in the leaves decreases [19]; therefore, the level of nitrogen in leaves is an important indicator that can be used to determine plant growth status and estimate yield. The reason for the drop in nitrogen concentration of the rice leaves is due to the shading phenomenon. In the process of crop growth, the leaves keep growing and the number and area of leaves keep increasing. The number and degree of shading in lower leaves continues to increase, while the upper leaves generally receive more sunlight than that of lower leaves [20]. This leads to nitrogen dilution [21,22], and provides a theoretical basis for establishing a critical nitrogen concentration dilution curve using the dry matter of rice leaves. In the study of rice, researchers across different rice-growing regions and countries have initiated studies to determine critical nitrogen concentrations in varying conditions [17,21]. In the present research, the power function curve equation of the critical nitrogen concentration of rice and dry matter mass was obtained.
In this study, the critical nitrogen concentration curve model was used to analyze different genotypes of high-quality rice leaves and determine the critical nitrogen concentration. The goal was to explore the rice leaf, as well as the applicability of the critical nitrogen concentration dilution curve model and nitrogen nutrition index (NNI) to evaluate the nitrogen nutrition of rice.

2. Materials and Methods

2.1. Experimental Design

Field experiments were carried out with five N rates (0, 60, 120, 180, and 240 kg N ha−1, represented by N0, N60, N120, N180, and N240, respectively) using two japonica rice (Oryza sativa L.) cultivars, Wuyoudao4 and Songjing9, in the Heilongjiang Province of Northeast China, as detailed in Table 1. Data used to develop the Nc dilution curve was drawn from two experiments conducted in 2016 and 2017 that examined five N fertilizer rates, ranging from zero to non-limiting amounts of N. The data used to validate the Nc dilution curve came from an independent experiment conducted in 2018 with five levels of N fertilizer, ranging from N-limiting to non-limiting amounts of N.

2.2. Plant Sampling and Determination of N Content in Tissues

2.2.1. Plant Sampling

Samples were drawn from five separate hills and were used to determine the plot rice growth. Five sampling dates occurred during each experiment year. The sampling process took place from active tillering to heading (before the onset of flowering) at intervals of 10–12 days, starting from 16 and 18 days after transplanting (DAT) in 2016 and in 2017, respectively. The sampling dates are presented in Table 1. Whole plants were manually uprooted and samples were divided into leaf blades (leaves) and culms plus sheaths (stems); fresh plants were separated into different leaves (green leaves and the rest of leaves, other than the green leaves).

2.2.2. Determination of Biomass and N Content in Leaves and Determination of Yields

Shoot biomass (t ha−1) was determined by severing five plants from each plot at ground level on each sampling date. Fresh plants were separated into leaf blades (leaves) and culms plus sheaths (stems). Leaf dry matter (LDM) was determined after each sample was oven-dried at 80 °C for 48 h. After entering the mature stage, the total number of panicles in the field of each community was investigated. At the same time, 30 plants were selected for indoor seed examination. Important indicators, such as grain number per panicles, grain weight per panicles, and 1000-grain weight was observed and recorded. The leaf samples were subsequently grounded to a powder to pass through a 1-mm sieve in a Wiley mill and stored at room temperature until further chemical analysis. Total N concentration in leaf samples was determined by using the micro-Kjeldahl method [23].

2.2.3. Plant N Accumulation

Leaf N accumulation (LNA) was obtained as summed products of the leaf dry matter of different leaves by the N contents in the corresponding leaf on dry matter (DM) basis.
LNA = (LGDMLGN + LRDMLRN)/100
where LGDM is dry matter (t ha−1) of green leaves, and LN is N concentration of corresponding leaf, respectively; LRDM is rest of leaves other than the green leaves.

2.3. Data Analysis

The concept of a Nc dilution curve [24] based on whole-plant N concentration was developed for tall fescue by Lemaire and Salette [25] and is represented by a power equation:
Nc = aW−b
where W is the aerial biomass expressed in t ha−1, Nc is the N concentration in shoots expressed as a percentage of shoot dry matter, and a and b are estimated parameters. N concentration in shoots expressed as a percentage of shoot dry matter, while a and b are estimated parameters. N concentration in the shoot biomass (t ha−1) is represented by the parameter a and the coefficient of dilution describing the relationship between N concentration and shoot biomass is represented by the parameter b. The curve defined by Equation (2) differentiates N status into three categories for plant growth: N limiting (below the curve), non-N limiting (above the curve), and optimal N concentration (on the curve). Notably, during the early stages of growth (when shoot biomass <1 t ha−1), Nc is a constant value due to the small decline of Nc, with increasing shoot biomass and the absence of competition for light in well-spaced plants, resulting in a constant N concentration value [25,26].
The data was analyzed to determine the Nc concentration using a method developed by Justes et al. [24]. Analysis of variance (ANOVA) was applied to compare the amount of leaf dry matter under different N rates and the corresponding N concentrations at each sampling date and year using GLM (Generalized Linear Model) procedures in SPSS-22 software package (SPSS Inc., Chicago. IL, USA). The least significant difference (LSD) test at 95% level of significance was used to assess the difference between treatment means in order to calculate the critical value at the intersection of a vertical line and an oblique line. The regression between leaf dry matter (t ha−1) and N concentration (%LDM) was conducted using Microsoft Excel (Microsoft Cooperation, Redmond, WA, USA).
The Nc dilution curve was determined by identifying the data points where N does not limit growth (N-limiting) or is not in excess (non-N-limiting) using the experimental data from 2016 and 2017. N-limiting growth treatment is defined as a treatment of N, which leads to a significant increase in leaf dry matter, while non-N-limiting growth treatment is defined as a treatment of N, which does not lead to an increase in leaf dry matter, but significantly increases N concentration. If, on the same measurement date, statistical analysis distinguished at least one set of N-limiting and non-N limiting data points, this series of data was used to define the critical N dilution curve (Figure 1). Series of data, which presented only N-limiting or non-N-limiting data points, were used to validate the curve [24]. These data points were used to determine the relationship between N concentration and leaf dry matter using an allometric function. The critical curve is validated firstly by applying data points that have not been retained for establishing the parameters of the allometric function in 2016 and 2017, and then with independent data set from 2018.
The verification of the model adopts the internationally accepted standard error Root Mean Square Error (RMSE) and Normalized Root Mean Square Error (n-RMSE) of regression estimation, as well as a 1:1 histogram between the simulated value and the measured value in order to detect the fitting degree and reliability of the model. The calculation formulas of RMSE and n-RMSE are as follows:
RMSE = i = 1 n ( s i m i ) 2 n n-RMSE = RMSE S × 100 %
where, si: simulation value; mi: measured value; n: data format; S: average value of measured data.
The smaller the RMSE [27] value the better the consistency between simulation value and real value. The smaller deviation is, i.e., the higher the accuracy of the model. n-RMSE [28] has no limitations based on units used and can be utilized to compare the model stability of data with different units. Generally, a model with a n-RMSE value < 10% is considered to be extremely stable, 10% < n-RMSE < 20% is considered stable, 20% < n-RMSE < 30% is considered generally stable, and an n-RMSE > 30% has poor stability [29].
Data points were solely selected from non-N-limiting treatments (N180) for the determination of the upper limit curve (Nmax), while data points from N-limiting treatments for which N application zero (N0 check plots) were used to determine lower limit curve (Nmin). Further, the N nutrition index (NNI) of the crop at each sampling date was determined by dividing the total N concentration of the leaf (Nt) by Nc, according to previous reports on potato and corn, as shown in Equation (4).
NNI = Nt/Nc

3. Results

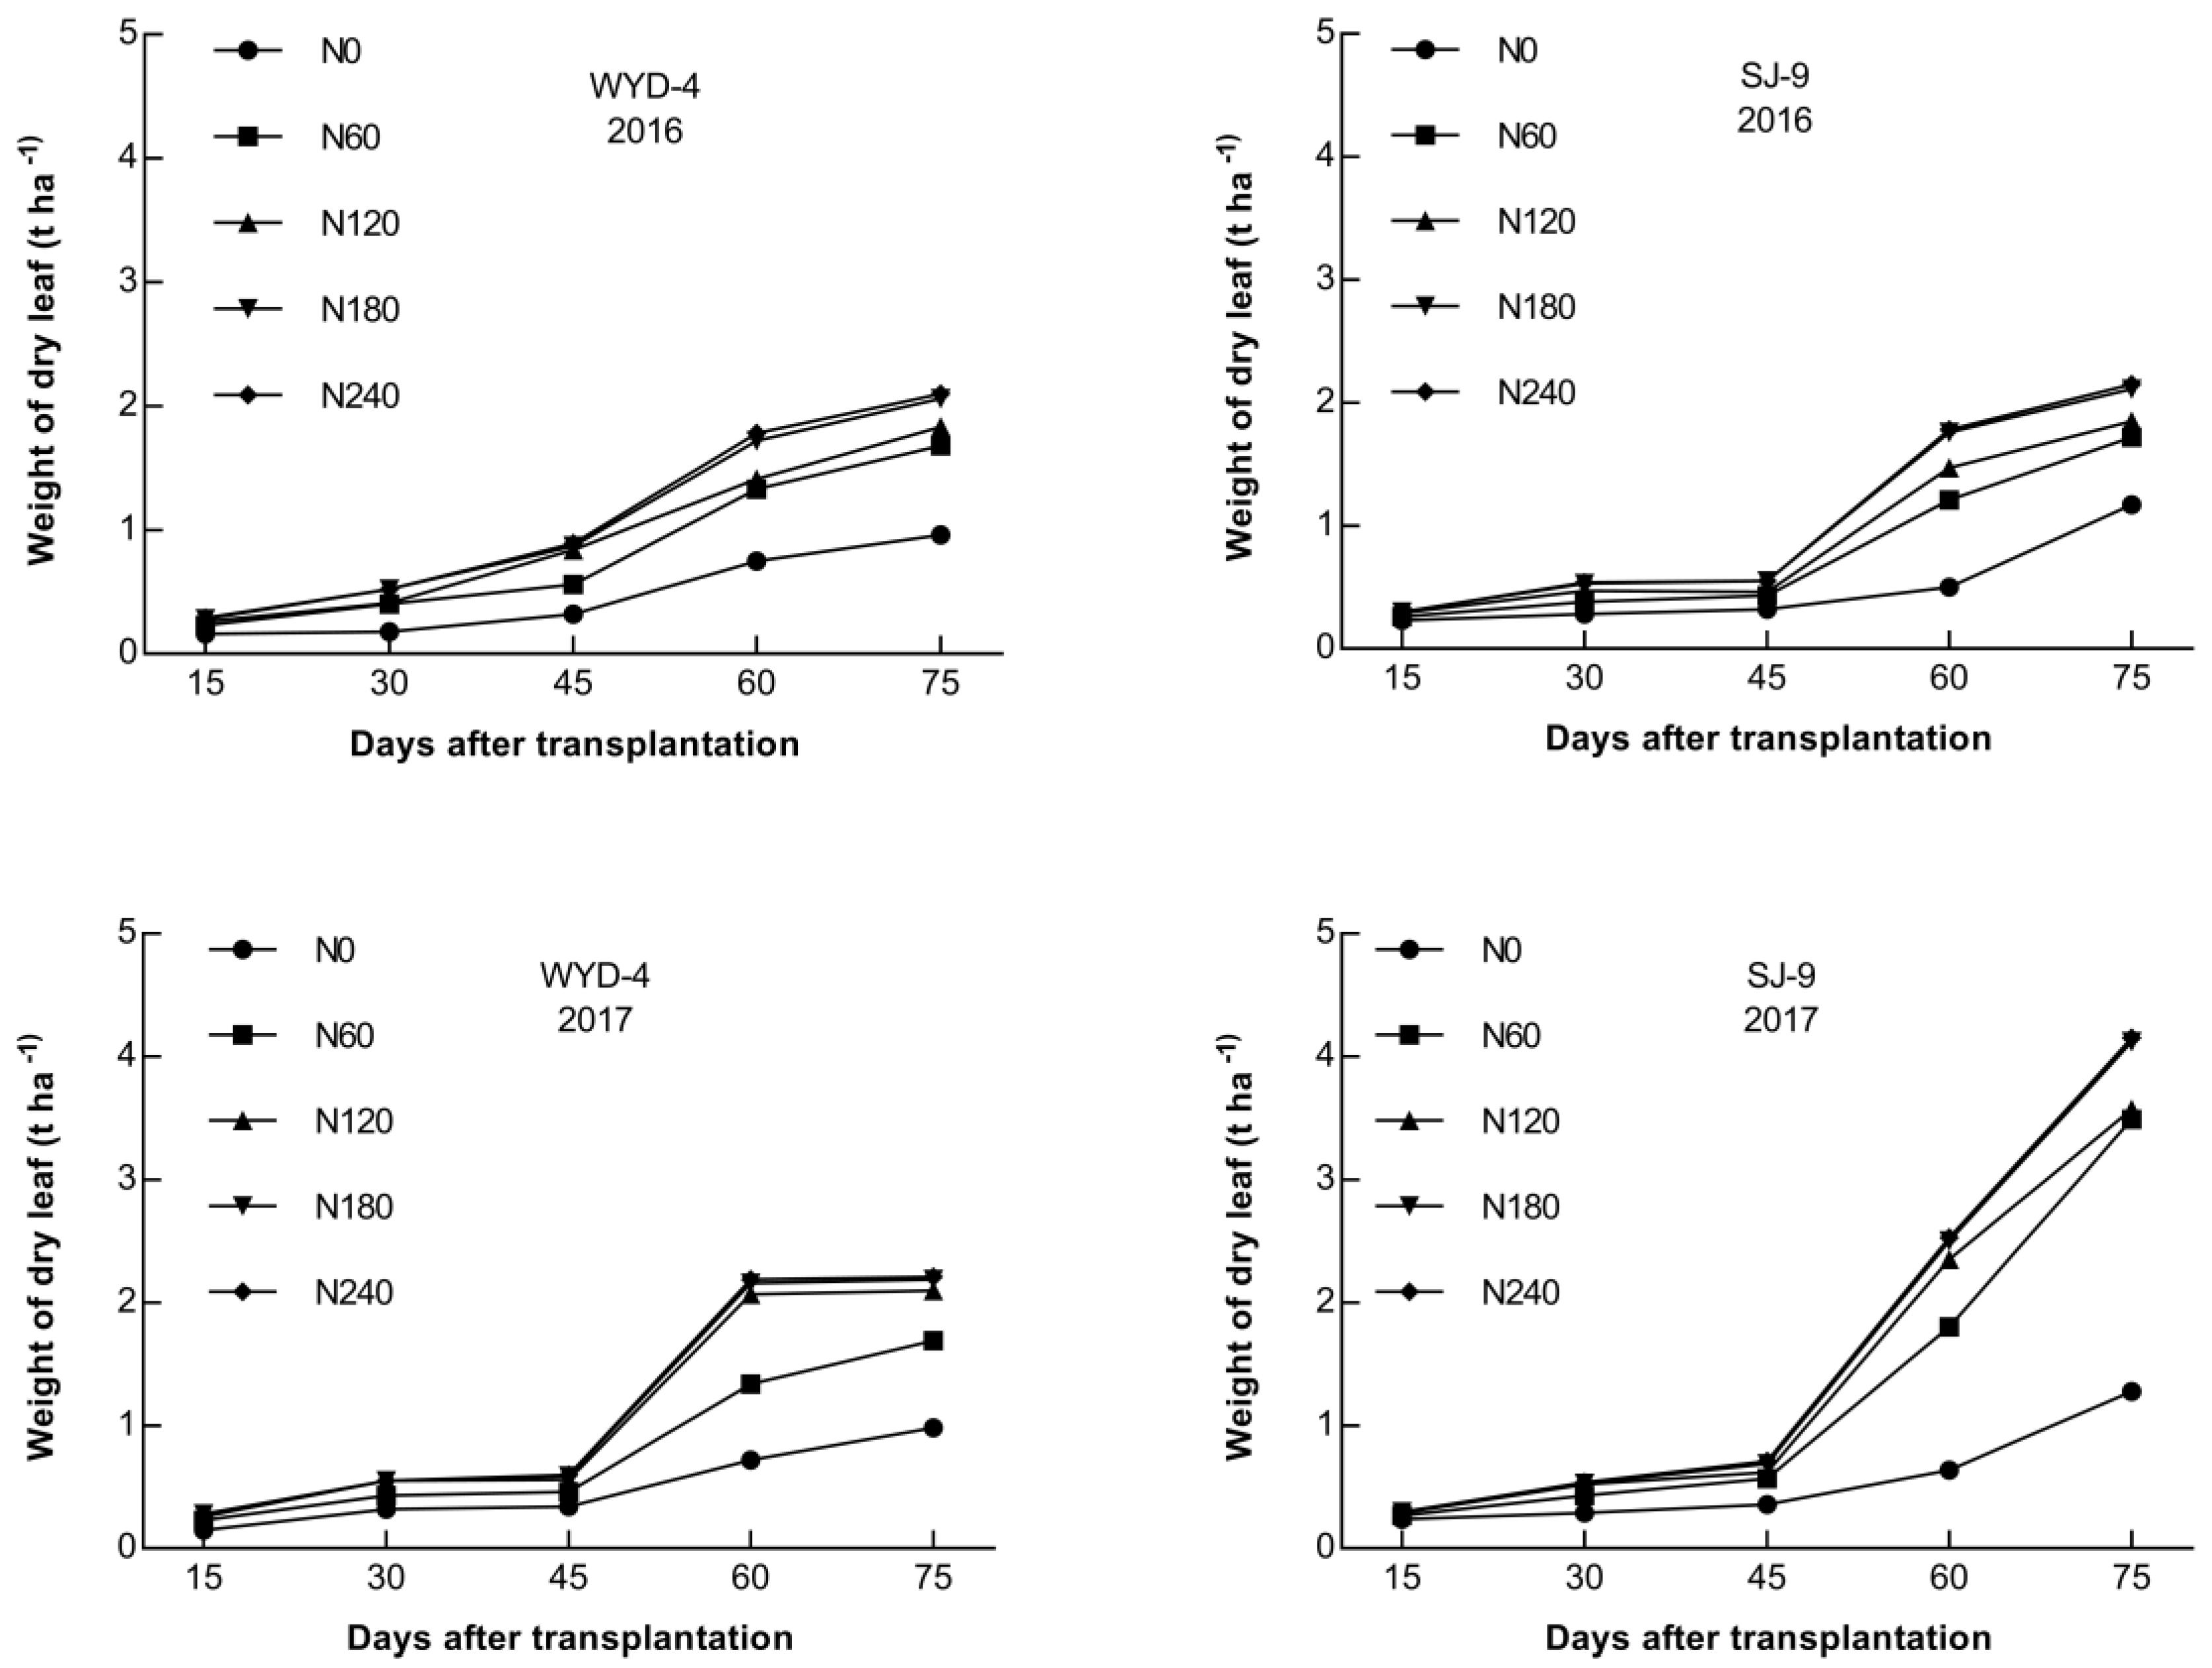
3.1. Leaf Dry Matter and N Concentration

N application rates exhibited a significant effect on leaf dry matter throughout the growth period, ranging from the minimum value of 0.16 t ha−1 (N0) for Wuyoudao4 to a maximum value of 3.15 t ha−1 (N240) for Songjing9, both observed during 2017. Leaf dry matter continuously increased as N application rates increased along the sampling dates for both varieties during each year. Leaf dry matter also increased as N application increased from N0 to N240 for both cultivars; however, there was no statistical difference between N180 to N240 in all cases (Figure 2).
The maximum variation in N concentration of both cultivars was observed on day 15 after transplantation in 2016, while the minimum variation in N concentration was observed on day 75 after transplantation in 2017. N concentration ranged from 0.85% to 4.88% for Wuyoudao4 and 0.85% to 4.16% for Songjing9 (Figure 3).

3.2. Determination of Dilution Curves for Nc Concentration

Data points for each sampling date from the time of tillering to the heading period for both cultivars were used to determine the Nc points by following the computation method of Justes et al. (1994) [24]. Twenty data points between 0.16 t ha−1 and 3.15 t ha−1 of leaf dry matter allowed the calculation of the theoretical Nc points. The Nc points were determined by intercept between the vertical and oblique lines fitted through the data points on each sampling date for Wuyoudao4 and Songjing9. Declining trends of the Nc values were observed in both cultivars as critical leaf dry matter increased, which were fitted as Equations (5) and (6) with determination coefficients of 0.87 and 0.94 for Wuyoudao4 and Songjing9, respectively (Figure 4). The two curves showed no statistical differences when tested based on Hahn’s (1997) methodology.
NC = 1.96LDM−0.56, R2 = 0.87
NC = 1.99LDM−0.44, R2 = 0.94

3.3. Validation of the Nc Dilution Curve

The Nc dilution curve was dually validated for N-limiting and non-N-limiting situations within the range for which it was established. Data points not engaged for establishing the parameters of the allometric function were used for partial validation of Nc dilution curve. The significantly varying (P ≤ 0.01) data points of LDM were selected from each treatment (N-limiting or non-N-limiting) for each sampling date in 2018. Independent data points from an experiment conducted in different pedoclimatic conditions were used for comprehensive validation of the Nc dilution curve. In general, the new Nc dilution curve on LDM basis well discriminated the limiting and non-N-limiting conditions of rice crop grown under varied N rates. All data points from N-limiting treatments were close to or lower than Nc dilution curve, whereas those from non-N-limiting treatments were close to or above the Nc dilution curve (Figure 5).
The verification of the above model showed that the relationship between Nc simulation values and measured values of the two varieties of rice could directly be displayed by a 1:1 histogram. An RMSE of 0.31 and an n-RMSE of 13.07% were calculated for Wuyoudao4, according to the formula. An RMSE of 0.37 and an n-RMSE of 15.89% was calculated for Songjing9, indicating that the model is highly stable; therefore, the critical nitrogen concentration dilution curve of rice leaves can be used for nitrogen nutrition diagnosis of rice leaves (Figure 6).

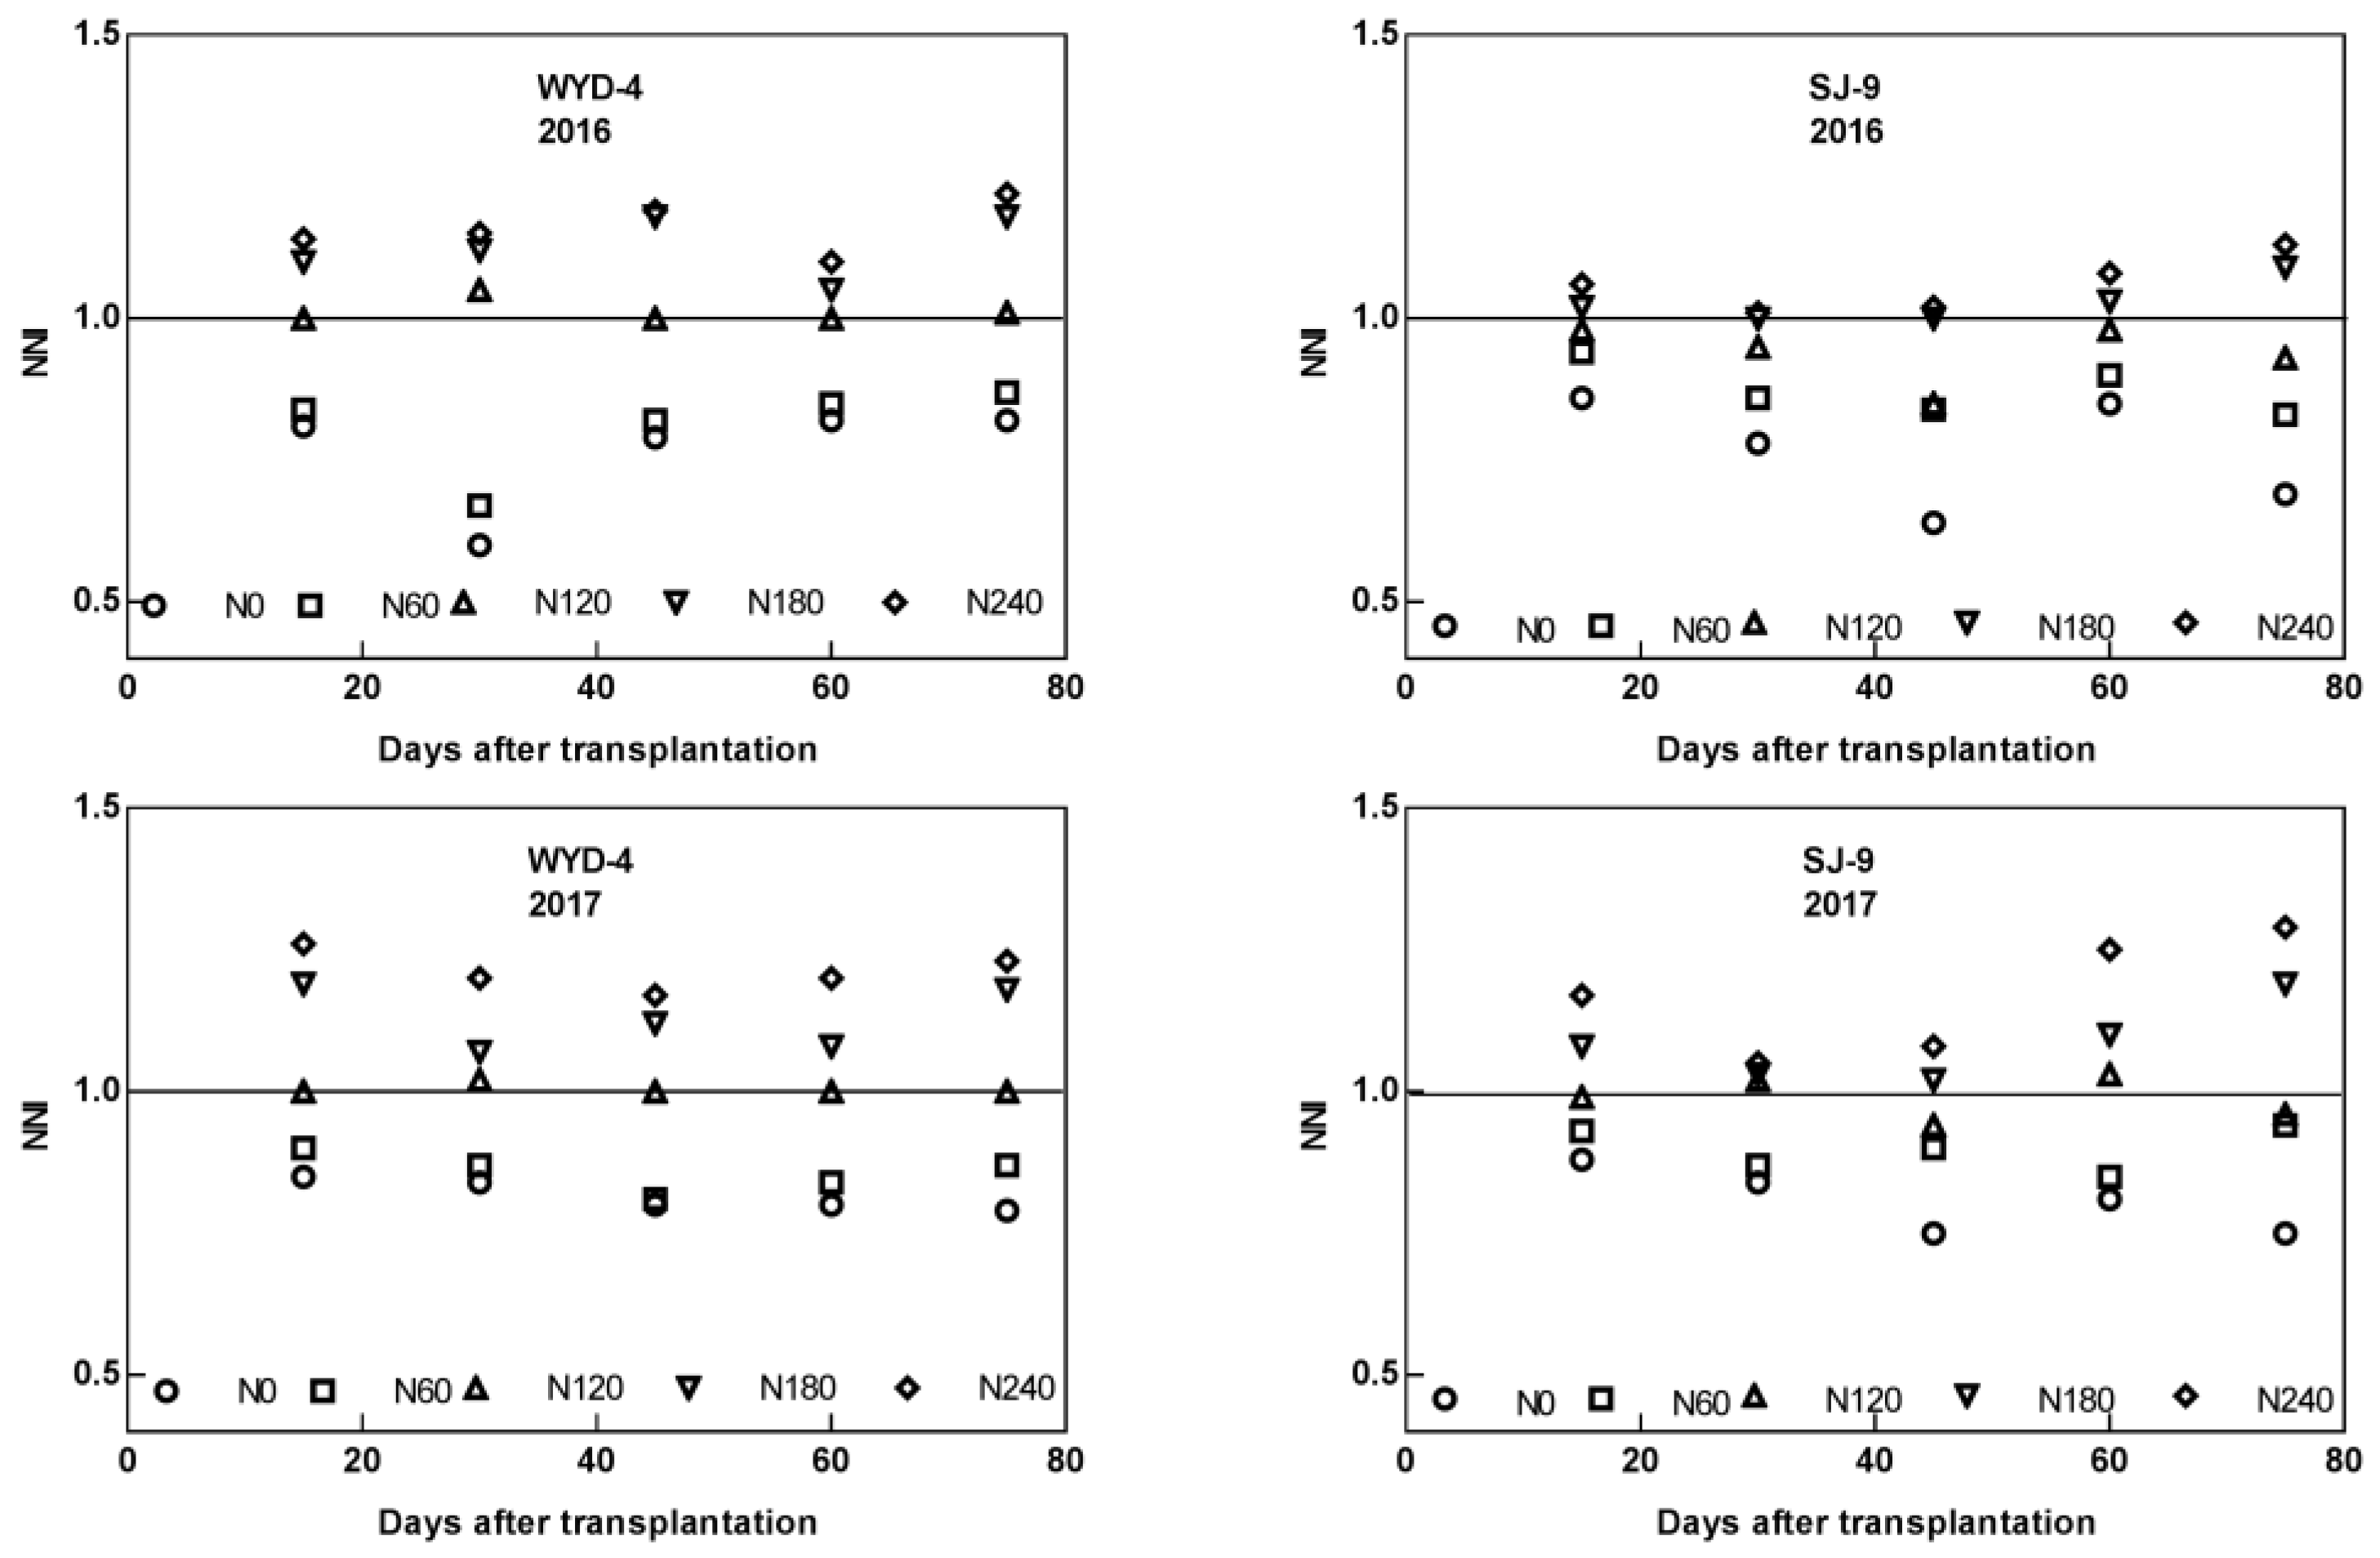
3.4. Effect of Different Nitrogen Application Levels on Nitrogen Nutrition Index (NNI) in Rice Leaves

Based on the evaluation system of nitrogen nutrition index (NNI), the nitrogen nutrition status of leaves was quantified (Figure 7). The NNI is divided according to the size of the value “1”. For the Wuyoudao4 rice variety, a state of nitrogen nutrient deficiency occurred when the NNI < 1 (the N application rate was less than 120 kg ha−1); an NNI of 1 occurred when nitrogen nutrition was moderate (N application rate was 120 kg ha−1), and when the amount of nitrogen applied exceeded 180 kg ha−1, the NNI was greater than 1 and nitrogen was in excess. For the Songjing9 rice variety, the NNI was less than 1 when the amount of N application was less than 180 kg ha−1, the NNI = 1 when nitrogen nutrition was moderate (N application was 180 kg ha−1), and when the amount of N applied exceeded 180kg ha−1, the NNI > 1, which resulted in excess nitrogen nutrition.

4. Discussion

The critical nitrogen concentration dilution curve is an important method for crop nitrogen nutrition diagnosis in most countries. It is used to diagnose crop nitrogen deficiency and to determine the nitrogen requirements of a crop. In order to determine and understand yield composition and the quality of growth formation in crops, chlorometer readings (SPAD values) and nutritional diagnoses of plants were carried out. The SPAD technique is determined by leaf color and was appropriate and easy to use. It is very sensitive to the changes in ammonia and is equally sensitive to nutritional changes.
In this study, the curve equation of critical nitrogen change in rice was established using the relationship between the leaf dry matter and nitrogen concentration of the fractionated rice (Nc = 1.96LDM−0.56 and Nc = 1.99 LDM−0.44 for Wuyoudao4 and Songjing9, respectively).
The determination coefficients of the equation were 0.87 and 0.94 for Wuyoudao4 and Songjing9, respectively. The fitting degree was significant for the species. Compared to the parameters of the curve equation obtained by Sheehy et al. (Table 2).The blade critical nitrogen variation curve equation parameter values a and b varied greatly in this study. It was observed that the curve equation of critical nitrogen concentration change in rice is lower than previous research results; additionally, predecessors’ study results indicated an uptick in japonica rice nitrogen uptake. Table 2 showed that the reference curve on stem dry matter (SDM) basis of japonica rice (2.17) by Ata-Ul-Karim et al. [30] was lower than the reference curve on whole plant dry matter basis of lndica rice in tropics (5.20) by Sheehy et al. [21]. It was also lower than the curves developed with japonica rice on whole plant dry matter basis (3.53) by Ata-Ul-Karim et al. [22], and LDM basis (3.76) by Yao et al. [13]. The parameter a of Nc dilution curve on LDM basis with japonica rice developed in the present study (1.96,1.99) was lower than the reference curve on whole plant dry matter basis of japonica rice in tropics (2.77) by Huang et al. [31]. The analysis suggests that this is mainly related to the asynchronous accumulation of leaf dry matter and plant dry matter. When leaf dry matter reaches 1 t ha−1, plant dry matter is already greater than 1 t ha−1, and nitrogen concentration dilution has occurred. As a result, the “a” value of the dilution curve based on the critical nitrogen concentration of leaf dry matter is low. The relationships between plant dry matter (PDM) based, with leaf area index (LAI), LDM, and SDM based N nutrition index, accumulated N deficit, and N requirement indicated that leaf based approaches could be used as substitutes for PDM approach [32]. Moreover, the real-time, quick, and non-destructive field methods (chlorophyll meter, hyper-spectral meter, remote sensing, and digital photography) generally monitor N concentration at single leaf or on canopy basis, instead of whole-plant basis [14,15]. Besides, the leaf is a major photosynthetic organ, and highly responsive to N fertilization [33,34]. Thus, it appears that the leaf based Nc dilution curve could be more useful for assessing N status in crop plants.
Different analytical parameters may arise from the fact that the equation constructed by Sheehy et al. [21] is a result of integrating rice varieties from different countries. Ata-ul-karim, et al. [22] showed that the curve equation of the change of critical nitrogen concentration constructed in rice planting areas of southern China is sensitive to climate differences and rice varieties. In 2010, Ziadi et al. [39] also reported that the Nc dilution curve of winter wheat developed by Justes et al. [24] was different from their research results and proposed that climatic conditions were possible factors causing the difference. Additionally, the effective cumulative temperature in Heilongjiang is 2000 degrees lower than that in the Yangtze River basin, which affects the growth rate of rice. Therefore, the Nc value in this study is low due to various factors, including those mentioned here.
Different rice genotypes have different sensitivities to nitrogen fertilizer. The results from this research show that Wuyoudao4 has a low nitrogen efficiency, while Songjing9 has a high nitrogen efficiency. This study shows that the optimal amount of nitrogen application for Wuyoudao4 is 120 kg·ha−1, while that of Songjing9 is 180 kg·ha−1.
The critical nitrogen concentration dilution curve model established in this study has clear biological significance and can be used to diagnose the nitrogen nutrition status of rice. This model has certain predictability and accuracy, and the results of this study can be used to accurately diagnose the nitrogen nutrition of rice. This can be helpful for improving accuracy in the management of rice production. Notably, the results of this study are based on field experimental data for only three years; a more extensive study ought to be developed to examine diverse ecological points and further supplement the current data. This would help to achieve an effective unified model to accurately and universally estimate optimal growth. An ideal model could be developed for different types of rice varieties under different environments of nitrogen nutrition for accurate diagnosis and effective crop management.

Author Contributions

Conceptualization, S.W. and L.S.; methodology, L.S.; software, W.Y.; validation, S.W. and L.S.; formal analysis, L.S.; investigation, L.S. and W.Y.; resources, L.S. and W.Y.; data curation, L.S. and W.Y.; writing—original draft preparation, L.S.; writing—review and editing, L.S. and S.W.; visualization, L.S.; supervision, S.W.; project administration, S.W.; funding acquisition, S.W. All authors have read and agreed to the published version of the manuscript.

Funding

This research was funded by the National Key Research and Development Program of China (2016YFD0300104); Heilongjiang Provincial Agro-science and Technology Innovation Program (2014ZD018); Harbin Applied Technology Research and Development Program (2015RQQYJ001); Heilongjiang Academy of Agricultural Sciences (2017ZC01).

Acknowledgments

We fully appreciate the editors and all anonymous reviewers for their constructive comments on this manuscript.

Conflicts of Interest

The authors declare no conflict of interest. Mention of trade names or commercial products in this publication is solely for the purpose of providing specific information and does not imply recommendation or endorsement by the authors.

References

  1. Chen, L.; Yang, J.C. Research progress on the effects of nitrogen fertilizer on the yield of super rice and its biological basis. Crop J. 2012, 6, 19–24. [Google Scholar]
  2. Gong, J.L.; Hu, Y.J.; Ge, M.J.; Long, H.Y.; Chang, Y.; Ma, Q.; Yang, X.; Zhang, H.C.; Dai, Q.G.; Huo, Z.Y. Study on the highest productivity and formation characteristics of the southern rice-type super rice nitrogen fertilizer group. J. Nucl. Agric. 2012, 26, 558–572. [Google Scholar]
  3. Xi, X.H.; Shi, F.Z.; Yan, X.M.; Luo, Y.X.; Ma, T.C.; Luo, Z.X. Effects of nitrogen levels on nitrogen use efficiency, yield and quality of different genotypes of rice. J. Appl. Ecol. 2017, 28, 1219–1226. [Google Scholar]
  4. Ma, J.H.; Liu, Y.; Yang, X.G.; Wang, W.F.; Xue, C.Y.; Zhang, X.Y. Trends in climate resources in the North China Plain under the background of global climate change. Acta Ecol. Sin. 2010, 30, 3818–3827. [Google Scholar]
  5. Grohs, D.S.; Bredemeier, C.; Mundstock, C.M.; Poletto, N. Model for yield potential estimation in wheat and barley using the GreenSeeker sensor. Eng. Agr. 2009, 29, 101–112. [Google Scholar] [CrossRef]
  6. Cai, H.G.; Mi, G.H.; Chen, F.J.; Zhang, X.Z.; Gao, Q. Inter-species variation of SPAD value, total nitrogen and nitrate nitrogen content in maize leaves. Plant Nutr. Fertil. 2010, 16, 866–873. [Google Scholar]
  7. Ghasemi, N.; Sahebi, M.R.; Mohammadzadeh, A. A review on biomass estimation methods using synthetic aperture radar data. Int. J. Geomat. Geosci. 2011, 1, 776–788. [Google Scholar]
  8. Greenwood, D.J.; Lemaire, G.; Gosse, G.; Cruz, P.; Draycott, A.; Neeteson, J.J. Decline in Percentage N of C3 and C4 Crops with Increasing Plant Mass. Ann. Bot. 1990, 66, 425–436. [Google Scholar] [CrossRef] [Green Version]
  9. Colnenne, C.; Meynard, J.M.; Reau, R.; Justes, E.; Merrien, A. Determination of a Critical Nitrogen Dilution Curve for Winter Oilseed Rape. Ann. Bot. 1998, 81, 311–317. [Google Scholar] [CrossRef] [Green Version]
  10. Xue, X.P.; Zhou, Z.G.; Zhang, L.J.; Wang, Y.L.; Guo, W.Q.; Chen, B.L. Development and application of critical nitrogen concentration Dilution Model for cotton after flowering. Acta Ecol. Sin. 2006, 26, 1781–1791. [Google Scholar]
  11. Giletto, C.M.; Echeverría, H.E. Critical Nitrogen Dilution Curve for Processing Potato in Argentinean Humid Pampas. Am. J. Potato Res. 2012, 89, 102–110. [Google Scholar] [CrossRef]
  12. Yue, S.; Meng, Q.; Zhao, R.; Li, F.; Chen, X.; Zhang, F.; Cui, Z. Critical Nitrogen Dilution Curve for Optimizing Nitrogen Management of Winter Wheat Production in the North China Plain. Agron. J. 2012, 104, 523. [Google Scholar] [CrossRef]
  13. Yao, X.; Ata-Ul-Karim, S.T.; Zhu, Y.; Tian, Y.C.; Liu, X.J.; Cao, W.X. Development of critical nitrogen dilution curve in rice based on leaf dry matter. Eur. J. Agro. 2014, 55, 20–28. [Google Scholar] [CrossRef]
  14. Kage, H.; Alt, C.; Stutzel, H. Nitrogen concentration of cauliflower organs as determined by organ size, N supply, and radiation environment. Plant Soil 2002, 246, 201–209. [Google Scholar] [CrossRef]
  15. Vouillot, M.O.; Huet, P.; Boissard, P. Early detection of N deficiency in a wheat crop using physiological and radiometric methods. Agronomie 1998, 18, 117–130. [Google Scholar] [CrossRef] [Green Version]
  16. Ma X., J.; Zhang, X.T.; Huang, Y.F.; Ye, Y.L. Establishment and application of critical nitrogen dilution curve for wheat based on leaf dry matter. Plant Physiol. J. 2017, 53, 1313–1321. [Google Scholar]
  17. Liu, X.J.; Tahir, S.; Ata-Ul-Karim, S.T. Critical nitrogen concentration diluted rice model and nitrogen nutrition diagnosis. China Rice 2013, 4, 149. [Google Scholar]
  18. Xu, R.L.; Dai, Q.G.; Wang, X.Q.; Huang, Y.Z.; Lü, X.T. Effects of nitrogen application rate, application period and operation on nitrogen use efficiency of rice. Js. Agric. Scis. 2005, 2, 19–22. [Google Scholar]
  19. Zhong, Y.M. Rapid Diagnosis of Nitrogen Nutrition in Rice Leaves and Characteristics of Greenhouse Gas Emissions in Paddy Fields. Ph.D. Thesis, Zhejiang University, Hangzhou, China, June 2016. [Google Scholar]
  20. Debruin, J.; Messina, C.D.; Munaro, E.; Thompson, K.; Conlon-Beckner, C.; Fallis, L.; Sevenich, D.M.; Gupta, R.; Dhugga, K.S. N distribution in maize plant as a marker for grain yield and limits on its remobilization after flowering. Plant Breed. 2013, 132, 500–505. [Google Scholar] [CrossRef]
  21. Sheehy, J.E.; Dionora, M.J.A.; Mitchell, P.L.; Peng, S.; Cassman, K.G.; Lemaire, G.; Williams, R.L. Critical nitrogen concentrations: Implications for high-yielding rice ( Oryza sativa L.) cultivars in the tropics. Field Crop. Res. 1998, 59, 31–41. [Google Scholar] [CrossRef]
  22. Ata-Ul-Karim, S.T.; Yao, X.; Liu, X.; Cao, W.; Zhu, Y. Development of critical nitrogen dilution curve of Japonica rice in Yangtze River Reaches. Field Crop. Res. 2013, 149, 149–158. [Google Scholar] [CrossRef]
  23. Lu, Z.Z. Study on critical nitrogen concentration and spectral index model of rice in the lower reaches of the Yangtze River. Ph.D. Thesis, Nanjing Agricultural University, Nanjing, China, June 2015. [Google Scholar]
  24. Justes, E.; Mary, B.; Meynard, J.M.; Machet, J.M.; Thelierhuche, L. Determination of a Critical Nitrogen Dilution Curve for Winter Wheat Crops. Ann. Bot. 1994, 74, 397–407. [Google Scholar] [CrossRef]
  25. Lemaire, G.; Van, O.E.; Sheehy, J.; Jeuffroy, M.H.; Massignam, A.; Rossato, L. Is crop N demand more closely related to dry matter accumulation or leaf area expansion during vegetative growth. Field Crop. Res. 2007, 100, 91–106. [Google Scholar] [CrossRef]
  26. Gastal, F.; Lemaire, G. N uptake and distribution in crops: An agronomical and ecophysiological perspective. J. Exp. Bot. 2002, 53, 789–799. [Google Scholar] [CrossRef] [PubMed] [Green Version]
  27. Willmott, C.J. Some Comments on the Evaluation of Model Performance. B. Am. Meteorol. Soc. 1982, 63, 1309–1369. [Google Scholar] [CrossRef] [Green Version]
  28. Yang, J.; Greenwood, D.J.; Rowell, D.L.; Wadsworth, G.A.; Burns, I.G. Statistical methods for evaluating a crop nitrogen simulation model. Agr. Syst. 2000, 64, 37–53. [Google Scholar] [CrossRef]
  29. Jamieson, P.D.; Porter, J.R.; Wilson, D.R. A test of the computer simulation model ARCWHEAT1 on wheat crops grown in New Zealand. Field Crop. Res. 1991, 27, 337–350. [Google Scholar] [CrossRef]
  30. Ata-Ul-Karim, S.T.; Yao, X.; Liu, X.J.; Cao, W.X.; Zhu, Y. Determination of Critical Nitrogen Dilution Curve Basedon Stem Dry Matter in Rice. Plos One 2014, 9, e104540. [Google Scholar] [CrossRef]
  31. Huang, S.Y.; Miao, Y.X.; Cao, Q.; Yao, Y.K.; Zhao, G.M.; Yu, W.F.; Shen, J.N.; Yu, K.; Georg, B. A new critical nitrogen dilution curve for rice nitrogen status diagnosis in Northeast China. Pedosphere 2018, 28, 814–822. [Google Scholar] [CrossRef]
  32. Ata-Ul-Karim, S.T.; Zhu, Y.; Liu, X.J.; Cao, Q.; Tian, Y.C.; Cao, W.X. Comparison of different critical nitrogen dilution curves for nitrogen diagnosis in rice. Sci. Rep. 2017, 7, 42679. [Google Scholar] [CrossRef] [Green Version]
  33. Novoa, R.; Loomis, R. Nitrogen and plant production. Plant Soil 1981, 58, 177–204. [Google Scholar] [CrossRef]
  34. Evans, J.R. Photosynthesis and nitrogen relationships in leaves of C3 plants. Oecologia 1989, 78, 9–19. [Google Scholar] [CrossRef] [PubMed]
  35. He, Z.Y.; Qiu, X.L.; Ata-Ul-Karim, S.T.; Li, Y.D.; Liu, X.J.; Cao, Q. Development of a critical nitrogen dilution curve of double cropping rice in South China. Front. Plant Sci. 2017, 8, 638. [Google Scholar] [CrossRef] [PubMed] [Green Version]
  36. Wang, Y. Rice nitrogen nutrition diagnosis and recommended fertilization based on visible light image. Ph.D. Thesis, University of Chinese Academy of Sciences, Beijing, China, June 2015. [Google Scholar]
  37. Lv, R.J.; Shang, Q.Y.; Chen, L.; Zeng, Y.J.; Hu, S.X.; Yang, X.H. Plant Study on diagnosis of nitrogen nutrition in rice based on critical nitrogen concentration. Plant Nutr. Fertil. Sci. 2018, 5, 1396–1405. [Google Scholar]
  38. Yang, H.; Yang, J.P.; Lv, Y.M.; He, J.J. SPAD Values and Nitrogen Nutrition Index for the Evaluation of Rice Nitrogen Status. Plant Prod. Sci. 2014, 17, 81–92. [Google Scholar] [CrossRef]
  39. Ziadi, N.; Belanger, G.; Claessens, A.; Lefebvre, L.; Tremblay, N.; Cambouris, A.N.; Nolin, M.C.; Parent, L.E. Plant-based diagnostic tools for evaluating wheat nitrogen status. Crop Sci. 2010, 50, 2580–2590. [Google Scholar] [CrossRef]
Figure 1. Critical nitrogen concentration curve.
Agronomy 10 00367 g001
Figure 2. Changes of rice leaf dry matter (t ha−1) with time (days after transplantation) under different N application rates in experiments conducted during 2016 and 2017. WYD-4 and SJ-9 refer to Wuyoudao4 and Songjing9, respectively, the same as below.
Agronomy 10 00367 g002
Figure 3. Changes of nitrogen (N) concentration (%LDM) with time (days after transplantation) for rice under different N application rates in experiments conducted during 2016 and 2017.
Agronomy 10 00367 g003
Figure 4. Critical nitrogen (Nc) data points and critical N dilution curves obtained by non-linear fitting for two rice cultivars (Wuyoudao4 Nc = 1.96LDM−0.56 and Songjing9, Nc = 1.99LDM−0.44) under different N application rates in experiments conducted in 2016 and 2017.
Agronomy 10 00367 g004
Figure 5. Comprehensive validation of Nc dilution curve using independent data set from experiment conducted in 2018. Data points (☐) represent N limiting growth conditions, while (∆) non-limiting conditions. The solid line in the middle represents the critical N curve (Nc = 1.96LDM−0.56, R2 = 0.87 for Wuyoudao4; Nc = 1.99LDM−0.44, R2 = 0.94 for Songjing9) describing the relationship between the critical N concentration and leaf dry matter of rice.
Agronomy 10 00367 g005
Figure 6. Calibration Nc dilution curve of leaf dry matter of rice (r0.01 = 0.765). The data of N120 and N180 were selected for verfication.
Agronomy 10 00367 g006
Figure 7. Changes of nitrogen nutrition index (NNI) with time (days after transplanting) for rice under different N application rates in experiments conducted during 2016 and 2017.
Agronomy 10 00367 g007
Table 1. Basic information about three experiments.
Experiment No.Transplanting/Harvesting DateLocationCultivarN Rate (kg ha−1)Sampling StageSampling DateSoil Characteristics
Experiment 1
in 2016
20-May/
25-Sep
Wuchang
(44°92′ N,
127°15′ E)
Wuyoudao4
Songjing9
N0(0)
N60(60)
N120(120)
N180(180)
N240(240)
Active tillering
Panicle initiation
Stem elongation
Booting
Heading
13-Jun
27-Jun
8-Jul
23-Jul
13-Aug
Soil type = Brunisolic
Soil pH = 6.59
Total P = 2.15g kg−1
Total K = 17.5g kg−1
Available N = 114ppm
Available P = 37.8ppm
Available K = 156ppm
Experiment 2
in 2017
18-May/
24-Sep
Wuchang
(44°92′ N,
127°15′ E)
Wuyoudao4
Songjing9
N0(0)
N60(60)
N120(120)
N180(180)
N240(240)
Active tillering
Panicle initiation Stem elongation
Booting
Heading
10-Jun
24-Jun
6-Jul
22-Jul
6-Aug
Same as above
Experiment 3
in 2018
22-May/
25-Sep
Wuchang
(44°92′ N,
127°15′ E)
Wuyoudao4
Songjing9
N0(0)
N60(60)
N120(120)
N180(180)
N240(240)
Active tillering
Panicle initiation
Stem elongation
Booting
Heading
15-Jun
28-Jun
9-Jul
21-Jul
8-Aug
Same as above
Table 2. Summary of critical nitrogen concentrations.
RegionCultivarModelResearcher
Torrid zoneCultivars in different regionsNc = 5.2 PDM−0.5Sheehy et al. [21]
South ChinaZhongjiazao17, Tanliangyou83
Tianyouhuazhan, Yueyou9113, Xiangyou186 etc.
Early rice: Nc = 3.37 PDM−0.44
Late rice: Nc = 3.69 PDM−0.34
He et al. [35]
South ChinaNanjing46, Nangan48, Wuyujing24 etc.Nc = 3.33 PDM−0.26Wang et al. [36]
South ChinaYliangyou1, Chaoyouqianhao etc.
Jinnongsimiao, Yuenongsimiao etc.
Hybrid rice: Nc = 3.36 PDM−0.31
Conventional rice: Nc = 2.96 PDM−0.25
Lv et al. [37]
South ChinaXiushui63, Hang43Xiushui63: Nc = 5.31 PDM−0.5
Hang43: Nc = 5.38 PDM−0.49
Yang et al. [38]
South ChinaHang432013-Hang43: Nc = 5.38 PDM−0.49
2015-Hang43: Nc = 4.29 PDM−0.55
Zhong [19]
Northern ChinaKongyu131, Longjing31Nc = 2.77 PDM−0.34Huang et al. [31]
South ChinaLingxiangyou18, Wuxiangjing14 etc.Nc = 3.53 PDM−0.28Ata-Ul-Karim
et al. [22]
South ChinaLingxiangyou18, Wuxiangjing14 etc.Nc = 3.76 LDM−0.22Yao et al. [13]
South ChinaLingxiangyou18, Wuxiangjing14 etc.Nc = 2.17 SDM−0.27Ata-Ul-Karim
et al [30]

