Abstract
Soil degradation due to salinity and sodicity is one of the most important impediments to agricultural production. Coal bio-briquettes (CBB) made from coal, biomass, and desulfurizers have been proposed for use in desulfurization and usage of sustainable energy for coal and biomass in China. CBB ash contains calcium compounds such as calcium sulfate, calcium carbonate, and fly ash. The potential improvement of salt-affected soils using ashes from CBB made from two low-quality coals and/or organic manure (OM) was investigated in northeast China. The CBB ash application rates were 0 kg/m2 (control), 1.16 kg/m2, 2.32 kg/m2, 4.64 kg/m2, and 6.96 kg/m2. Following the application of CBB ash and/or co-application of OM, maize production increased significantly, compared to control plots. Moreover, co-application with OM resulted in higher maize production than application of CBB ash only. Soil pH, sodium adsorption ratio (SAR), exchangeable sodium percentage (ESP), and Na+, HCO3−, and CO32− concentrations decreased, and Ca2+, Mg2+, and SO42− concentrations increased from the start of the experiment to harvesting time. Maize production showed a tendency to increase with increasing CBB ash/OM application rates. The decrease in pH, ESP, and HCO3−, and increase in Ca2+ in the application plots over time was particularly remarkable. Moreover, saturated hydraulic conductivity (Ks) after CBB ash application in the slightly and moderately salt-affected soils increased with increasing application rates. In case of the highest application rate (6.96 kg/m2), using ash from CBB made from lower quality coal, pH and ESP decreased from 9.47 to 7.61, and from 7.0% to 0.98%, respectively, and Ks increased drastically by three orders of magnitude. Therefore, not only soil chemical properties, but also Ks, were improved in salt-affected soils using CBB ash. In addition, the heavy metal content in CBB ashes was below the standard values according to Chinese guidelines. Taken together, these results demonstrate the feasibility of sustainable methods for energy usage and environmental application in China.
1. Introduction
Soil degradation due to salinity and sodicity is one of the most important impediments to agricultural production throughout the world [1,2,3]. The global area of saline-sodic soils is estimated at about 1.0 × 10⁹ ha [4], with saline-alkali soils covering about 34 million ha of China, at the end of 2015 [5]. Soil salinity and sodicity are considered to be two of the most important factors impeding agricultural development in northeast China.
Coal is the predominant source of energy in China, accounting for about 64% of the total primary energy consumption in 2015 [6]. Therefore, the clean utilization of coal with improved efficiency is an important scientific and technological target. Clean coal technologies (CCTs) are methods that facilitate the use of coal in an environmentally friendly and economically sustainable fashion [7]. Briquetting, i.e., compressing coal powder to produce briquettes, has long been considered one basic approach for CCTs [8,9,10]. Moreover, biomass utilization and renewable energy development have been fields of intense research for several decades in China. Biomass resources such as agricultural and forestry residues, firewood, and organic discharge from farms are abundant in China. The annual amount of collectable straw and stalks is about 687 million tons, with 265 million tons of maize stalks, 205 million tons of rice straw, and 150 million tons of wheat straw [11]. Particularly in rural areas, biomass is an important renewable energy resource that is commonly used for heating and cooking. In addition, the proportion of compressed biomass fuels such as biomass pellets is increasing in some areas [12].
About 30 years ago, Japanese researchers developed coal bio-briquettes (CBB) [13], which are produced from coal, biomass, and a desulfurizer such as calcium hydroxide, using a high-pressure briquetting process [14,15,16]. CBB production allows the utilization of poor-quality coal and biomass with the potential for desulfurization. Moreover, we previously emphasized the need for bio-briquette manufacturing devices in households other than FGD equipment of large, medium, and small-scale plants, so as to remain below the stipulated SO2 concentrations for urban residential areas in China [17]. In the present study, we focused on CBB ash containing calcium compounds such as calcium sulfate (gypsum), calcium hydroxide, and calcium carbonate, which can be effectively used to improve salt-affected soils [18]. We have been investigating methods for improving sodic soils in northeast china using flue gas desulfurization gypsum (FGDG) since 1996 [19,20,21]. FGDG contains mainly gypsum, and other calcium compounds and coal fly ash [21]. In addition, CCB ash contains fly ash, which is a reservoir of nutrients that help improve salt-affected soils and can increase soil water retention [22]. Fly ash improves water-holding capacity and plants available water as physical properties of the salt-affected soil [23]. A fly ash and sewage sludge mixture increased the saturated hydraulic conductivity and porosity, and decreased the pH in saline sodic soil [24]. The restoration of sodic soils entails the replacement of exchangeable Na+ by Ca2+, which can be supplied by initially present or added gypsum, soil lime, or both [25]. Restoration can be achieved by leaching after chemical compounds are applied to the soil [26]. For example, as is the case of using biomass only, bagasse ash is effective as a saline soil amendment [27]. Municipal solid waste (MSW) is an organic amendment for restoring soil fertility and contributing to the productivity of salt-affected soils [28]. Organic and inorganic substances such as gypsum, farm manure, and compost were shown to accelerate leaching of soluble salts from the soil profile [29,30]. We examined whether salt-affected soils could be improved using CBB ashes, and whether maize production, soil pH, exchangeable sodium percentage (ESP) would be affected by these treatments [31]. However, no detailed changes in soil chemical properties during maize growth with CBB ash or effects of co-application with organic manure have been reported so far. In addition, our research group previously suggested that CBB ash promotes Na leaching, as observed in a soil column experiment [32], however, changes in saturated hydraulic conductivity (Ks) after applying soil amendments have not yet been confirmed.
In this study, we examined changes in soil chemical properties after applying CBB ashes and/or organic fertilizers, and we assessed maize production after restoration of salt-affected soils in northeast China. In addition, changes in Ks after application of CBB ashes were examined, and the heavy metal content in CBB ashes was quantified.
2. Materials and Methods
2.1. Site Description
The study site was located in a semi-arid area in Dang Lan village in Kangping county (42°70′ N, 123°50′ E), which is about 130 km north of Shenyang city, Liaoning province, in northeast China. The area is characterized by a warm continental climate and a humid continental to cold semi-arid climate, with mean annual maximum and minimum temperatures of 14.3 °C and 2.2 °C, respectively, and an average annual precipitation of about 516 mm. The climate is affected by the Chinese monsoon season, with hot and humid summers and cold and dry winters. Shenyang city experiences four distinct seasons, with substantial variations in temperature ranging from a mean daily maximum and minimum of −7 °C and −17 °C in January to 31 °C and 20 °C in July, respectively. Most rainfall occurs in July and August, and total precipitation in July and August is 123 mm and 111 mm, respectively. The total rainfall for crop growth from May to September is 394 mm, which is about 76% of total annual precipitation. The average temperatures in May, June, July, August, and September were 18.0, 23.0, 25.5, 24.0, and 17.5 °C, respectively. The soil is classified as Kastanozems according to the World Reference Base for Soil Resources (WRB) [33].
2.2. Soil Improvement Experiments Using Coal Bio-Briquette Ashes
Two types of coal bio-briquettes ((CBB); CBB A and CBB B) were produced from low-quality coal (sulfur content = 2.1% (Coal A) and 4.1% (Coal B)), maize stems as biomass, and calcium hydroxide (Ca(OH)2) as a desulfurizer. These CBB had been used as household fuel for heating and cooking in Kangping County, Liaoning Province, in the winter of 2007, and the produced CBB ashes (CBB ash A and CBB ash B) were collected in March 2008. The chemical properties and particle diameters of CBB ash A and B are shown in Table 1.

Table 1.
Chemical properties and particle diameter in coal bio-briquette ashes (CBB ash A and B).
At first, the soil surface was leveled before the experiments, in order to uniform the soil salinity, and set up the soil amelioration test with CBB ash and/or pig manure. Before applying CBB ashes, we measured the soil chemical and physical properties at the experimental field. Consequently, the soil of the experimental plots was categorized as ‘soil 1′, as shown in Table 2. The high salt accumulation area (soil 2) was scattered on small depression areas in the experimental field before levelling the soil surface. Both soil types showed pH values above 8.5, and the ESP in soil 2 was 23.1%, which was higher than that in soil 1.
Table 2.
Soil physical and chemical properties prior to the experiments.
The experimental fields (777.6 m2; 18.0 m × 43.2 m) were divided into 60 plots (5 rows × 12 columns; 3.6 m × 3.6 m, each). The experiment was conducted using four treatments: (1) coal bio-briquette ash A (CBB ash A) and organic manure (F1), (2) coal bio-briquette ash A (CBB ash A) only (F2), (3) coal bio-briquette ash B (CBB ash B) and organic manure (F3), and (4) coal bio-briquette ash B (CBB ash B) only (F4) (Table 3). The CBB ash application rates were 0% (control), 0.5% (1.16 kg/m2), 1.0% (2.32 kg/m2), 2.0% (4.64 kg/m2), and 3.0% (6.96 kg/m2) that was calculated in relation to the soil weight of the layer 0–15 cm, and experiments were conducted in three replicates (Table 3). Ammoniac fertilizer was added to all plot, and pig manure was added as organic fertilizer to two experimental plots (F1 and F3) at 3.0 kg/m2. Therefore, organic manure and ammoniac fertilizer were added to no application plots of CBB ash in F1 and F3. Experimental plots had been leveled using a ground-leveling device from April 23rd to 26th in 2008, and soil amendments were applied to the plow layer (0–15 cm depth) in the first year by scoop-mixing. After the application of soil amendments, maize was sown on May 1st, 2008. Maize was harvested from September 25th to September 30th in 2008. Total maize plant biomass (maize production) was weighed at all experimental plots.
Table 3.
Soil amendments and application rate in the experimental fields.
2.3. Soil (CBB Ash) Physical and Chemical Analyses
Soil samples were collected from topsoil (0–15 cm) on May 1st (before the application of CBB ash), July 12th and September 30th (after harvesting) in 2008. The samples were air-dried and then ground to be passed through a 2-mm sieve and were then stored at room temperature until physicochemical measurements were taken (EC, pH, Na, Ca, Mg, K, SO4, CO3, HCO3, Cl, and Ks). Soil bulk density was measured using separately collected soil cores (100 cm3) using a volumetric ring method.
pH, EC, and solution cations in soil were measured using 1:5 water extracts. A pH meter (TOA Electronics Ltd., Japan) was used for pH measurements, and an electrical conductivity meter (Horiba Ltd., Japan) was used for EC measurements. Cations and anions in the soil solution (1:5 water extraction) were measured using inductively coupled plasma atomic emission spectrometry ([ICP-AES]; SPS3520UV, SII, Japan), atomic absorption spectrometry ([AAS]; 680A, Shimadzu Co., Ltd., Japan), and ion chromatography (LC-6A, Shimadzu Co., Ltd., Japan). Exchangeable bases were extracted using 1M ammonium acetate (at pH 7) and Na, Ca, Mg, and K were measured using ICP-AES. Cation exchange capacity (CEC) was determined using 1N NaOAc at pH 8.2. The ESP was calculated from the sodium adsorption ratio (SAR) of the soil solution [34]. pH, EC and solution cations in CBB ash (CBB ash A and CBB ash B) were measured using 1:10 water (or 1N NaOAc) extracts, and measured by pH meter, electrical conductivity meter, and ICP-AES, respectively. Particle size distributions in soil and CBB ash were measured by the pipette method [35]. Ks was determined using the constant head method [36]. Soil bulk density was determined as 1.53 g/cm3 under the same test field conditions, and a 100-cm3 soil core sampler was used on soils under the same application rates of CBB ash A and B. Ks values were determined using Darcy’s equation [36]. Heavy metals (Ni, Cu, Zn, Cd, and Pb) in CBB ash A and B was extracted using aqua regia and were quantified using ICP-AES [37]. All chemical measurements and metal content analyses in soil samples were performed in three technical replicates.
2.4. Statistical Analyses
A one-way analysis of variance (ANOVA) was carried out to determine statistical differences among treatments for different factors, and means were compared by post-hoc Tukey HSD. SPSS 25.0 (SPSS Inc., Chicago, IL, USA) software was used for the statistical analyses. A paired-sample t-test was used to compare the pH, EC, SAR, ESP, and water-soluble cations and anions collected in three months (May, July, and September in 2008) between all experimental fields (F1, F2, F3, and F4). Results are reported at significance level of p < 0.05.
3. Results and Discussion
3.1. Changes in Maize Production and Soil Chemical Properties after CBB Ash and Organic Manure Application
The soil pH, EC, and ESP at sowing date and maize production in control plots (no soil amendments) of fields F1, F2, F3, and F4 are shown in Table 4. Control plot soil pH, EC, ESP, and maize production in F1 differed significantly from the values observed in F2 and F3, and ESP and maize production differed significantly between F1 and F4 (Table 4). Soil chemical properties and maize production indicated three different alkalization levels in the control plots, and F1 was classified as moderately alkalized, F4 as weakly alkalized, and F2 and F3 as slightly alkalized. The least amount of maize production among twelve control plots in F1, F2, F3, and F4 was observed in one control plot of F1, and the average values of soil pH, EC, and ESP in F0 were 10.0, 0.24 dS/m, and 13.8%, respectively. These high pH and ESP values cause the least amount of maize production. Therefore, it is difficult to examine the difference between F1 and F2. However, the application of only organic manure ameliorated pH, EC, ESP, and maize production slightly in F3 and F4 (Table 4).
Table 4.
Soil pH, EC, ESP, and maize production at the date of sowing in control plots (no soil amendments) of all experimental fields.
Maize production in all experimental plots was significantly affected by the application of CBB ashes (Table 5). Maize production in plots with an application rate of more than 1.0% in F1, 1.0% in F2, 0.5% in F3, and 0.5% in F4 differed significantly from that in the control plot (Table 5). A high difference in maize production between F1 and F2 at 0% application rate was caused by the lowest production (467 kg/ha) in F1 (Table 4 and Table 5). EC and ESP differed significantly between control plots in F1 and F2 (Table 4). CBB ash application at a rate of 1.0% or higher led to statistically significant increases in maize production in F2 and F4, compared to the control (Table 5). Therefore, CBB ash application to salt-affected soils appears to improve maize production.
Table 5.
Average maize production [kg/ha] in fields F1, F2, F3, and F4 at different application rates.
Next, when CBB ash A plus organic manure was applied in F1, it was difficult to assess soil improvement effects. However, in the case of using CBB ash B with organic manure, we observed slightly higher maize production in F3, compared to F4 (Table 5). Organic matter provides essential nutrients [38,39] and enhances plant nutrient use efficiency. As reported previously, incorporation of organic manure such as pig manure into salt-affected soils significantly increased soil alkaline phosphatase activity and soil respiration rate [40]. Maize production in September, in almost the same soil pH, EC, and ESP as in sowing time (May) and at the same application rate in F3 and F4, was compared (Table 6). The maize production in F3 seemed to take a higher value, compared to F4 (Table 6). Therefore, we conclude that the co-application of CBB ashes and organic manure can improve soil properties and increase maize production.
Table 6.
Comparison of maize production and other parameters between experimental plots of similar soil chemical properties in F3 and F4 in May.
Lastly, soil pH, EC, ESP and maize production after harvest were shown in high-production plots (more than 8000 kg/ha) in F1, F2, F3, and F4 (Table 7). Specifically, six plots (0.5%, 1.0%, 2.0% (two plots), 3.0% (two plots)) in F1, four plots (2.0%, 3.0% (three plots)) in F2, eight plots (0.5%, 1.0%, 2.0% (three plots), 3.0% (three plots)) in F3, and seven plots (1.0%, 2.0% (three plots), 3.0% (three plots)) in F4 produced more than 8000 kg/ha maize. The average values of pH, EC, and ESP in these high-production plots in September were compared to those in control plots in May (Table 4 and Table 7). Soil pH and ESP in all test plots decreased substantially, and EC increased in F3 and F4, compared to F1 and F2 (Table 4 and Table 7). The beneficial effects of FGDG in reducing soil pH and ESP have been well studied previously [21,41,42]. The EC values in CBB ash A and B were near equal, however, higher concentrations in exchangeable Ca in CBB ash B may accelerate soil improvement (Table 1). The restoration of sodic soils entails replacing exchangeable Na+ at cation exchange sites of colloids with Ca2+ [43,44]. Applying CCB ashes, which have more CEC than soil (CECsoil = 8.2–10.2 cmol/kg) (Table 1), may increase the uptake of cations, such as Ca2+, Mg2+ and K+ by roots, resulting in a release of H+ to balance the charge in the rhizosphere. Soil pH and ESP typically decrease during the restoration of salt-affected soils using FGDG, leading to higher agricultural production, and soil salinity regarding EC and Na content decrease after restoration using FGDG [21,45]. Therefore, changes in soil chemical properties applied in the present study are comparable with soil improvement using FGDG. We conclude that CBB ash application to salt-affected soils can help alleviate the negative effects of salts and increase soil fertility.
Table 7.
Soil pH, EC, ESP and maize production after harvest in high-production plots (more than 8000 kg/ha) in F1, F2, F3, and F4.
3.2. Correlation of Maize Production and Soil Chemical Properties
Soil chemical properties such as pH, EC, SAR, ESP, and cation and anion concentrations were measured in all soil samples at the time of sowing (May), during maize growth (July), and at the end of the experiment (September). Correlation coefficients between maize production and soil properties such as pH, EC, SAR, ESP, Na+, K+, Ca2+, Mg2+, Cl−, SO42−, CO32−, and HCO3− concentrations are shown in Table 8. Soil pH showed a negative correlation with maize production in all test fields, apart from F3 and F4 in May, and the correlation was strongest in July. SAR, ESP, and Na also produced negative correlations with maize production in all three months in F1, and in September in F2 and F4. The decrease in pH, SAR, ESP, and Na+ showed tendencies of correlation with increasing maize production. In addition, Ca2+, Mg2+, and SO42− concentrations correlated positively with maize production. Compared to the initial soil measurements, the concentrations of pH, SAR, ESP, Na+, HCO3−, CO32− and Cl− decreased in restored soils. However, applying CBB ashes increased the concentrations of Ca2+ and SO42−. Similar tendencies in soils restored using FGDG have been reported previously [5,32,41,46]. Disintegration of CBB ashes due to irrigation and/or rainfall likely contributed to the significant increase in Ca2+ and SO42− concentrations. After applying CBB ashes, chemical and ion exchange reactions occur in soils [44], restocking soluble salts.
Table 8.
Correlation coefficients (r) of soil properties and maize production from May to September in each experimental field.
Correlation coefficients do not indicate causal relationships, however, highly significant correlations (p < 0.01) of maize production with pH were observed in three months, and with SAR, ESP, Na+, Ca2+, SO42−, CO32−, and HCO3− in July and September. In addition, maize production increased with increasing application rates (Figure 1), and the correlation coefficients of maize production with the CBB ash application rate were 0.66, 0.88, 0.90, 0.88, and 0.73 in F1, F2, F3, F4, and all experimental fields, respectively.
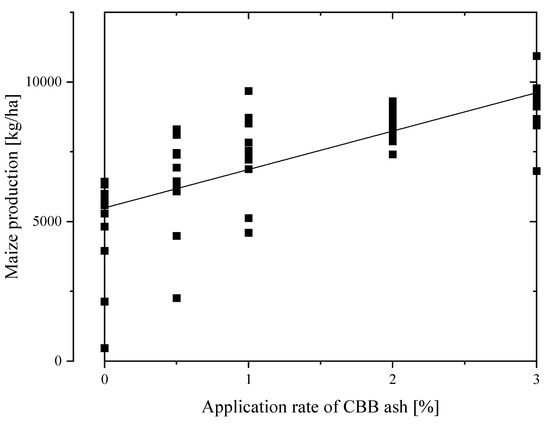
Figure 1.
Change of maize production with CBB ash application rates.
3.3. Changes in Soil pH, ESP, Ca, and HCO3 over Time
As soil pH, ESP, Ca2+ and HCO3− showed several strong correlations with maize production (Table 8), these parameters were analyzed regarding differences between soil amendment application rates. Changes in pH depending on application rate and over time were assessed (Table 9a). In F1, no change in pH was observed in the control plot, and pH values at application plots differed slightly between application rates and over time. In F2, F3, and F4, slight changes in pH were observed in the control plot, and a decrease in pH at harvesting time was observed. In addition, soil pH at harvesting time showed a tendency to decrease with increasing application rates. Increased pH buffering capacities were observed based on increased CECs after CBB application. Subsequently, the effects of application rates and time on ESP were assessed. In F1, ESP decreased over time in all plots including the control plot, and was not affected by application rates (Table 9b). In F2, F3, and F4, ESP showed a tendency to decrease over time in all plots (Table 9b). ESP decreased substantially in plots of more than 2.0% in September. High pH values in salt-affected soils are primarily associated with high ESP, thus a reduction in soil ESP due to CBB ash application may be one of the mechanisms associated with decreasing pH values.
Table 9.
(a). Change in pH at different application rates from May to September in all test fields. (b). Change in ESP at different application rates from May to September in all test fields. (c). Change in Ca concentration at different application rates from May to September in all test fields. (d). Change in HCO3 concentration at different application rates from May to September in all test fields.
The release of cations such as Ca2+ and Mg2+ from CBB was one of the major factors for decreasing pH values. We further assessed the effects of application rates and time on Ca2+ concentrations. CBB ash contained higher concentrations of exchangeable Ca2+ than soil (Table 1 and Table 2). In addition, organic amendments such as compost and manure can be a direct source of Ca2+ and Mg2+ to enhance the removal of Na+ from the soil exchange complex [47,48]. In F1, F2, F3, and F4, Ca2+ concentrations increased over time in all application plots, and also increased with application rates (Table 9c). In F2, F3, and F4, Ca2+ concentration showed a tendency to increase over time in the control plot and in the experimental plots (Table 9c). Particularly in plots with more than 2.0%, Ca2+ concentrations increased substantially in September. This phenomenon was likely caused by the Ca2+ supply, due to CBB application and the dissolution of native calcite (CaCO3), following a decrease in pH after the application of amendments [24,49]. HCO3 in untreated soils accounted for 64.8% and 56.8% of the total anion content of soil 1 and soil 2 (Table 2), respectively, and is the predominant anion in salt-affected soils. The correlation coefficients of HCO3− and maize production in July and September indicated a negative relationship in several experimental fields (Table 8). Changes in HCO3− concentrations with increased application rates and over time were assessed in each experimental field. In F1, F2, F3, and F4, HCO3−, concentrations decreased over time in all application plots, but decreased with increasing application rates (Table 9d). Decreasing CO32− and HCO3− concentrations in soils restored with FGDG has been reported previously [5,41,46].
In summary, the effect of CBB and manure application rates and time on pH, ESP, Ca2+, and HCO3− concentrations were assessed. pH, ESP, and HCO3− values decreased and Ca2+ concentrations increased in control and experimental plots over time.
3.4. Changes in Ks of Salt-Affected Soils at Different Application Rates of CBB Ashes
Salt-affected soils accumulate salt on the surface, and it is difficult for plants to grow in these soils due to low hydraulic conductivity and low permeability [50,51]. High pH of salt-affected soils is mainly due to hydrolysis of exchangeable Na+, NaHCO3, and Na2CO3, therefore removal and leaching of Na salts can decrease the pH of such soils [19,52,53]. Salt leaching was reported in a soil column experiment at an application of 3.0% of CBB ash A and B [32]; however, the effect of application rates on Ks has not been investigated so far.
The effects of CBB ash A and B at 1.53 g/cm3 on Ks in salt-affected soil (soil 1 and soil 2) are shown in Figure 2. The Ks content in soil 1 and soil 2 was 1.42 × 10⁻⁸ m/s and 6.60 × 10⁻¹⁰ m/s, respectively. The initially higher Na and clay content in soil 2 compared to soil 1 suggests that there is lower Ks in soil 2 (Table 2). The increase in Ks of soil 1 after applying 0.5%, 1.0%, 2.0%, and 3.0% of CBB ash A and B is shown in Figure 2. Ks in the CBB ash B treatment was higher than that in the CBB ash A treatment, and Ks in CBB ash A and B was 1.35 × 10⁻⁷ m/s and 8.14 × 10⁻⁷ m/s in 3.0% application, respectively. In soil 2, Ks also increased with increasing application rates. Ks had similar values in both soils from 0% to 1.0%, and values were higher in CBB ash B over 2.0% application rate. Ks in CBB ash A and B was 4.43 × 10⁻⁸ m/s and 4.31 × 10⁻⁷ m/s at an application rate of 3.0%, respectively. Ks at 3.0% in CBB ash B indicated nearly equal values of Ks by gypsum, which is the most common soil amendment (Figure 2) [26,34]. These results show a remarkable restoration of Ks after CBB ash application and explain the increase in maize productivity compared to the control plot. CBB ash B showed a higher improvement capacity regarding Ks compared to CBB ash A (Figure 2) because of higher CEC and EC. The addition of divalent cations to the soil solution can reduce clay dispersion and increase the soil’s Ks [26]. A reduction in bulk and particle densities and an increase in porosity due to CBB ash application improves soil structural quality and soil aggregation. In addition, the difference in the ratio of more than 1.0 mm in diameter between CBB ash A and CBB ash B (39.3% (CBB ash A), 48.8% (CBB ash B); Table 2) is one of the physical causes for higher Ks of CBB ash B. In this experiment, the effect of organic amendments on Ks could not be assessed, however, previous studies suggested that organic amendments help improve the binding of small and large particles in saline-sodic and sodic soils, to form large water-stable aggregates and water-permeable channels [54,55]. In summary, improved plant growth is a direct effect of the release of essential nutrients such as Ca, Mg, and K in salt-affected soils, which help ameliorate the adverse effects of salts and adsorption of Na to the surface of CBB ash or binding of Na in the pores of CBB ashes or indirect effects through improved soil physical and chemical properties including increased water retention and microbial activity. Therefore, CBB ashes and/or organic manure can accelerate salt leaching and decrease the time required for reducing salt concentrations to a level that is suitable for crop cultivation.
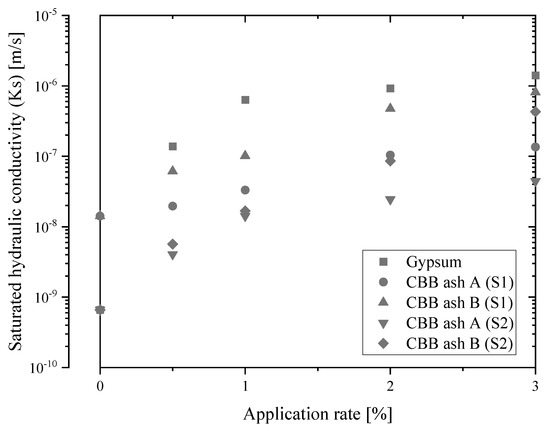
Figure 2.
Changes in saturated hydraulic conductivity of salt-affected soils (soil 1 (S1) and soil 2 (S2)) at different application rates of CBB ash A, CBB ash B, and gypsum.
3.5. Effects of CBB Ashes on Heavy Metal Content
CBB ash can also affect soil physicochemical properties and then influence heavy metal solubility and availability. In order to assess the practical applicability of this method in China, concentrations of heavy metals (Ni, Cu, Zn, Cd, and Pb) in CBB ash A and B were measured (Table 10). Heavy metals such as Cu, Zn, Pb, and Cd are common pollutants in soil and sediment systems [56]. In addition, the soil pH was the most important factor controlling Ni solubility and mobility in soil [57]. For instance, average concentrations of Ni, Zn, Cd, and Pb in FGD gypsum from power plants in Shanxi province of China were reported to be 10.4, 63.5, 0.7, and 4.7, respectively [58]. In addition, Ni, Cu, Cd, and Pb in FGD gypsum levels used as soil amendment in China were reported to be 2.1, 5.41, 0.21, and 4.31, respectively [5]. Compared to the content of these metals in FGDG, Ni, Cu, Cd, and Pb in CBB ash, A and B had slightly higher values and Zn in CBB ashes was low in value. Heavy metal concentrations of CBB ashes were substantially below the control standards for pollutants in fly ash for agricultural use (GB 8173–1987) [59]. Therefore, CBB ashes can be considered safe for use as a soil amendment on salt-affected soils.
Table 10.
Heavy metal concentrations [mg/kg] in CBB ash A and B and agricultural use standard.
4. Conclusions
Maize production using ashes from CBB produced from inferior-quality coal that contains higher sulfur, biomass, and desulfurizer contents showed promising results on salt-affected soils in northeast China. CBB ashes and co-application with organic manure improved soil properties and increased maize growth and yield. A decrease in soil chemical parameters such as pH, ESP, SAR, Na+, Cl−, HCO3- and an increase in Ca2+, Mg2+, and SO42− was observed from sowing to harvesting. Particularly, a decrease in pH, ESP, and HCO3− and an increase in Ca2+ occurred over time in treatment and control plots. In addition, a marked restoration effect regarding soil hydraulic conductivity was observed following the use of CBB ashes, and this effect was correlated with the application rate. These new and important findings in physicochemical properties of salt-affected soil amelioration with CBB ash and organic manure were shown in this paper. Additionally, because heavy metal concentrations in CBB ashes were lower than the Chinese standard values for soil amendments, these results could provide important data for the practical application. Therefore, the improvement in soil properties and the increase in maize production with CBB ash and organic manure could be indicated as new soil amendment and amelioration method using both coal and biomass. Taken together, improvement of salt-affected soils using CBB ash is a promising method for maize production and is a step towards the sustainable use of energy and environmentally friendly agricultural methods.
Author Contributions
Conceptualization, methodology, validation, writing—original draft preparation, writing—review and editing, visualization, supervision, project administration and funding acquisition; Y.S.; formal analysis, Y.S., C.S., H.M., H.S., R.F., T.K. and C.W. All authors have read and agreed to the published version of the manuscript.
Funding
This research was funded by Strategic Research Cooperative Program of JST (Japan Science and Technology Agency).
Acknowledgments
We would like to express our appreciation to Masayoshi Sadakata, Dan Liu and Hong Yan for their assistance in this experiment and investigation.
Conflicts of Interest
The authors declare no conflict of interest.
References
- Mahmoodabadi, M.; Yazdanpanah, N.; Sinobas, L.; Pazira, L.; Neshat, A. Reclamation of calcareous saline sodic soil with different amendments (1); Redistribution of soluble cations within the soil profile. Agric. Water Manag. 2013, 120, 30–38. [Google Scholar] [CrossRef]
- Qadir, M.; Noble, A.D.; Schubert, S.; Thomas, R.J.; Arslan, A. Sodicity induced land degradation and its sustainable management: Problems and prospects. Land Degrad. Dev. 2006, 17, 661–676. [Google Scholar] [CrossRef]
- Suarez, D.L. Sodic soil reclamation: Modelling and field study. Aust. J. Soil Res. 2001, 39, 1225–1246. [Google Scholar] [CrossRef]
- Rengasamy, P. World salinization with emphasis on Australia. J. Exp. Bot. 2006, 57, 1017–1023. [Google Scholar] [CrossRef] [PubMed]
- Zhao, Y.; Wang, S.; Li, Y.; Liu, J.; Zhuo, Y.; Zhang, W.; Wang, J.; Xu, L. Long-term performance of flue gas desulfurization gypsum in a large-scale application in a saline-alkali wasteland in northwest China. Agric. Ecosyst. Environ. 2018, 261, 115–124. [Google Scholar] [CrossRef]
- National Bureau of Statistics. National Economy and Social Development Statistic Bulletin; National Bureau of Statistics of the People’s Republic of China: Beijing, China, 2016. Available online: http://www.stats.gov.cn/tjsj/zxfb/201602/t20160229_1323991.html (accessed on 21 September 2019). (In Chinese)
- International Energy Agency (IEA). Clean Coal Centre. Clean Coal Technologies; IEA Clean Coal Centre: London, UK, 2016; Available online: http://www.iea-coal.org.uk/site/2010/database-section/clean-coal-technologies (accessed on 21 September 2019).
- Chen, Y.; Zhi, G.; Feng, Y.; Tian, C.; Bi, X.; Li, J.; Zhang, G. Increase in polycyclic aromatic hydrocarbon (PAH) emissions due to briquetting: A challenge to the coal briquetting policy. Environ. Pollut. 2015, 204, 58–63. [Google Scholar] [CrossRef] [PubMed]
- Li, H.M.; Zhao, X.F.; Yu, Y.Q.; Wu, T.; Qi, Y. China’s numerical management system for reducing national energy intensity. Energy Pol. 2016, 94, 64–76. [Google Scholar] [CrossRef]
- Zhao, C.; Luo, K. Household consumption of coal and related sulfur, arsenic, fluorine and mercury emissions in China. Energy Pol. 2018, 112, 221–232. [Google Scholar] [CrossRef]
- Ministry of Agriculture of the People’s Republic of China. China Makes Use of Nearly 70% of Its Crop Straws and Stalks. 2010. Available online: http://english.agri.gov.cn/news/201301/t20130115_8815.htm (accessed on 18 September 2019).
- Sun, J.; Zhi, G.; Hitzenberger, R.; Chen, Y.; Tian, C.; Zhang, Y.; Feng, Y.; Cheng, M.; Zhang, Y.; Cai, J.; et al. Emission factors and light absorption properties of brown carbon from household coal combustion in China. Atmos. Chem. Phys. 2017, 17, 4769–4780. [Google Scholar] [CrossRef]
- Maruyama, T.; Mizoguchi, C. Development of coal-biomass briquette (BIOCOAL) and its combustor. Chin. J. Lasers 1992, 4, 32–37. [Google Scholar]
- Lu, G.; Kim, H.; Yuan, J.; Naruse, I.; Ohtake, K.; Kamide, M. Experimental Study on Self-Desulfurization Characteristics of Biobriquette in Combustion. Energ. Fuels 1998, 12, 689–696. [Google Scholar] [CrossRef]
- Lu, G.; Wang, Q.; Sakamoto, K.; Kim, H.; Naruse, I.; Yuan, J.; Maruyama, T.; Kamide, M.; Sadakata, M. Experimental Study on Combustion and Pollutant Control of Biobriquette. Energy Fuels 2000, 14, 1133–1138. [Google Scholar] [CrossRef]
- Isobe, Y.; Yamada, K.; Wang, Q.; Sakamoto, K.; Uchiyama, I.; Mizoguchi, T.; Zhou, Y. Measurement of indoor sulfur dioxide emission from coal-biomass briquettes. Water Air Soil Pollut. 2005, 163, 341–353. [Google Scholar] [CrossRef][Green Version]
- Sakai, Y.; Nakano, S.; Wang, C.; Kito, H. Evaluation of SO2 Emissions and Health Effects Following the Installation of Desulfurization Facilities and Coal Bio-briquette Technology in China. J. Chem. Eng. Jpn. 2015, 48, 491–497. [Google Scholar] [CrossRef]
- Nitta, Y.; Sadakata, M.; Matsumoto, S.; Yoshioka, K. Possible Incentive to Diffuse Desulfurization Equipment in China. J. Jpn. Inst. Energy 2006, 85, 191–196. (In Japanese) [Google Scholar]
- Chun, S.; Nishiyama, M.; Matsumoto, S. Sodic soils reclaimed with by-product from flue gas desulfurization: Corn production and soil quality. Environ. Pollut. 2001, 114, 453–459. [Google Scholar] [CrossRef]
- Sakai, Y.; Matsumoto, S.; Nitta, Y.; Sadakata, M. Alkali soil reclamation in China using gypsum produced in flue gas desulfurization process; A case study. J. Glob. Environ. Eng. 2002, 8, 55–66. [Google Scholar]
- Sakai, Y.; Matsumoto, S.; Sadakata, M. Alkali soil reclamation with flue gas desulfurization gypsum in China and assessment of metal content in corn grains. Soil Sedim. Contam. 2004, 13, 65–80. [Google Scholar] [CrossRef]
- Kumar, D.; Singh, B. The use of coal fly ash in sodic soil reclamation. Land Degrad. Dev. 2003, 14, 285–299. [Google Scholar] [CrossRef]
- Adriano, D.C.; Weber, J.T. Influence of Fly Ash on Soil Physical Properties and Turfgrass Establishment. J. Environ. Qual. 2001, 30, 596–601. [Google Scholar] [CrossRef]
- Ors, S.; Sahin, U.; Khadra, R. Reclamation of Saline Sodic Soils with the Use of Mixed Fly Ash and Sewage Sludge. Arid Land Res. Manag. 2015, 29, 41–54. [Google Scholar] [CrossRef]
- Oster, J.D.; Frenkel, H. The Chemistry of the Reclamation of Sodic Soil with Gypsum and Lime. Soil Sci. Soc. Am. J. 1980, 44, 41–45. [Google Scholar] [CrossRef]
- Keren, R.; Miyamoto, S. Reclamation of saline and, sodic and boron-affected soils. In Agricultural Salinity Assessment and Management; Tanji, K.K., Ed.; ASCE Manuals and Reports on Engineering Practice 71; American Society of Civil Engineers: New York, NY, USA, 1990. [Google Scholar]
- Seleiman, M.F.; Kheir, A.M.S. Saline soil properties, quality and productivity of wheat grown with bagasse ash and thiourea in different climatic zones. Chemosphere 2018, 193, 538–546. [Google Scholar] [CrossRef] [PubMed]
- Meena, M.D.; Yadav, R.K.; Narjary, B.; Yadav, G.; Jat, H.S.; Sheoran, P.; Meena, M.K.; Antil, R.S.; Meena, B.L.; Singh, H.V.; et al. Municipal solid waste (MSW): Strategies to improve salt affected soil sustainability: A review. Waste Manag. 2019, 84, 38–53. [Google Scholar] [CrossRef] [PubMed]
- Ahmad, S.; Ghafoor, A.; Akhtar, M.E.; Khan, M.Z. Implication of Gypsum Rates to Optimize Hydraulic Conductivity for Variable-Texture Saline–Sodic Soils Reclamation. Land Degrad. Dev. 2015, 27, 550–560. [Google Scholar] [CrossRef]
- Diacono, M.; Montemurro, F. Effectiveness of Organic Wastes as Fertilizers and Amendments in Salt-Affected Soils. Agriculture 2015, 5, 221–230. [Google Scholar] [CrossRef]
- Sakai, Y.; Murata, H.; Ebato, C.; Liu, D.; Wang, C.; Nagamoto, H.; Sadakata, M. Salt-affected Soil Amelioration with Low-quality Coal Bio-briquette Ash in Northeastern China. J. Arid Land Stud. 2015, 25, 93–96. [Google Scholar] [CrossRef]
- Sakai, Y.; Seto, H.; Nagamoto, H. Evaluation of Salt Transport in the Amelioration of Salt-Affected Soil in China by Using Low-Quality Coal Bio-Briquette Ash. J. Arid Land Stud. 2014, 24, 81–84. [Google Scholar]
- FAO. World reference base for soil resources 2014 International soil classification system for naming soils and creating legends for soil maps. World Soil Resour. Rep. 2015, 106, 162–163. [Google Scholar]
- US Salinity Laboratory Staff. Diagnosis and Improvement of Saline and Alkali Soils; US Department of Agriculture Handbook 60; US Government Printing Office: Washington, DC, USA, 1954; p. 5.
- Gee, G.W.; Bauder, J.W. Particle-size Analysis. In Methods of Soil Analysis. Part 1; SSSA Book Ser. No.5; SSSA: Madison, WI, USA, 1986; pp. 383–412. [Google Scholar]
- Klute, A.; Dirksen, C. Hydraulic conductivity and diffusivity: Laboratory methods. In Methods of Soil Analysis. Part 1; SSSA Book Ser. No.5; SSSA: Madison, WI, USA, 1986; pp. 687–734. [Google Scholar]
- Soil Quality e Extraction of Trace Elements Soluble in Aqua Regia; ISO 11466; International Organization for Standardization: Geneva, Switzerland, 1995.
- Lax, A.; Diaz, E.; Castillo, V.; Albaladejo, J. Reclamation of physical and chemical properties of a salinized soil by organic amendment. Arid Soil Res. Rehabil. 1994, 8, 9–17. [Google Scholar] [CrossRef]
- Qadir, M.; Ghafoor, A.; Murtaza, G. Use of saline-sodic waters through phytoremediation of calcareous saline-sodic soils. Agric. Water Manag. 2001, 50, 197–210. [Google Scholar] [CrossRef]
- Liang, Y.C.; Yang, Y.F.; Yang, C.G.; Shen, Q.Q.; Zhou, J.M.; Yang, L.Z. Soil enzymatic activity and growth of rice and barley as influenced by organic matter in an anthropogenic soil. Geoderma 2003, 115, 149–160. [Google Scholar] [CrossRef]
- Mao, Y.; Li, X.; Dick, W.A.; Chen, L. Remediation of saline–sodic soil with flue gas desulfurization gypsum in a reclaimed tidal flat of southeast China. J. Environ. Sci. 2016, 45, 224–232. [Google Scholar] [CrossRef] [PubMed]
- Zhao, Y.; Wang, S.; Li, Y.; Zhuo, Y.; Liu, J. Effects of straw layer and flue gas desulfurization gypsum treatments on soil salinity and sodicity in relation to sunflower yield. Geoderma 2019, 352, 13–21. [Google Scholar] [CrossRef]
- Oster, J.D. Gypsum usage in irrigated agriculture: A review. Fertil. Res. 1982, 3, 73–89. [Google Scholar] [CrossRef]
- Frenkel, H.; Gerstl, Z.; Alperovitch, N. Exchange-induced dissolution of gypsum and the reclamation of sodic soils. J. Soil Sci. 1989, 40, 599–611. [Google Scholar] [CrossRef]
- Wang, S.J.; Chen, C.H.; Xu, X.C.; Li, Y.J. Amelioration of alkali soil using flue gas desulfurization byproducts: Productivity and environmental quality. Environ. Pollut. 2008, 151, 200–204. [Google Scholar] [CrossRef]
- Zhao, Y.; Wang, S.; Li, Y.; Liu, J.; Zhuo, Y.; Chen, H.; Wang, J.; Xu, L.; Sun, Z. Extensive reclamation of saline-sodic soils with flue gas desulfurization gypsum on the Songnen Plain, Northeast China. Geoderma 2018, 321, 52–60. [Google Scholar] [CrossRef]
- Walker, D.J.; Bernal, M.P. The effects of olive mill waste compost and poultry manure on the availability and plant uptake of nutrients in a highly saline soil. Bioresour. Technol. 2008, 99, 396–403. [Google Scholar] [CrossRef]
- Jalali, M.; Ranjbar, F. Effects of sodic water on soil sodicity and nutrient leaching in poultry and sheep manure amended soils. Geoderma 2009, 153, 194–204. [Google Scholar] [CrossRef]
- Qadir, M.; Oster, J.D.; Schubert, S.; Noble, A.D.; Sahrawat, K.L. Phytoremediation of sodic and saline-sodic soils. Adv. Agron. 2007, 96, 197–247. [Google Scholar] [CrossRef]
- Sumner, M.E. Gypsum and Acid Soils: The world scene. Adv. Agron. 1993, 51, 1–32. [Google Scholar]
- Suarez, D.L.; Rhoades, J.D.; Lavado, R.; Griee, C.M. Effect of pH on saturated hydraulic conductivity and soil dispersion. Soil Sci. Soc. Am. J. 1984, 48, 50–55. [Google Scholar] [CrossRef]
- Sakai, Y.; Ren, S.; Wang, C.; Sadakata, M. Salt-Affected Soil Amelioration with Flue Gas Desulfurization By-Products and Waste Gypsum Board in Tianjin, China. J. Chem. Eng. Jpn. 2011, 44, 750–756. [Google Scholar] [CrossRef]
- Shaygan, M.; Reading, L.P.; Baumgartl, T. Effect of physical amendments on salt leaching characteristics for reclamation. Geoderma 2017, 292, 96–110. [Google Scholar] [CrossRef]
- Lakhdar, A.; Rabhi, M.; Ghnaya, T.; Montemurro, F.; Jedidi, N.; Abdelly, C. Effectiveness of compost use in salt-affected soil. J. Hazard. Mater. 2009, 171, 29–37. [Google Scholar] [CrossRef]
- Muyen, Z.; Wrigley, R.J. Reclamation of Sodic Soils with Organic Amendments: A Review. Imp. J. Interdiscip. Res. 2016, 2, 317–324. [Google Scholar]
- Akcil, A.; Erust, C.; Ozdemiroglu, S.; Fonti, V.; Beolchini, F. A review of approaches and techniques used in aquatic contaminated sediments: Metal removal and stabilization by chemical and biotechnological processes. J. Clean. Prod. 2015, 86, 24–36. [Google Scholar] [CrossRef]
- Méndez, A.; Paz-Ferreiro, J.; Araujo, F.; Gascó, G. Biochar from pyrolysis of deinking paper sludge and its use in the treatment of a nickel polluted soil. J. Anal. Appl. Pyrolysis 2014, 107, 46–52. [Google Scholar] [CrossRef]
- Hao, Y.; Li, Q.; Pan, Y.; Liu, Z.; Wu, S.; Xu, Y.; Qian, G. Heavy metals distribution characteristics of FGD gypsum samples from Shanxi province 12 coal-fired power plants and its potential environmental impacts. Fuel 2017, 209, 238–245. [Google Scholar] [CrossRef]
- Ministry of Agriculture and Fisheries. Control Standards for Pollutants in Fly Ash for Agricultural Use (GB8173-87); China Standards Press: Beijing, China, 2001. (In Chinese) [Google Scholar]
© 2020 by the authors. Licensee MDPI, Basel, Switzerland. This article is an open access article distributed under the terms and conditions of the Creative Commons Attribution (CC BY) license (http://creativecommons.org/licenses/by/4.0/).