Construction of Soybean Mutant Diversity Pool (MDP) Lines and an Analysis of Their Genetic Relationships and Associations Using TRAP Markers

 , ,
, ,  ,
, 
Abstract
1. Introduction
2. Materials and Methods
2.1. Plant Materials and Phenotypic Evaluation
2.2. DNA Extraction
2.3. TRAP Analysis
2.4. Data Analysis
3. Results
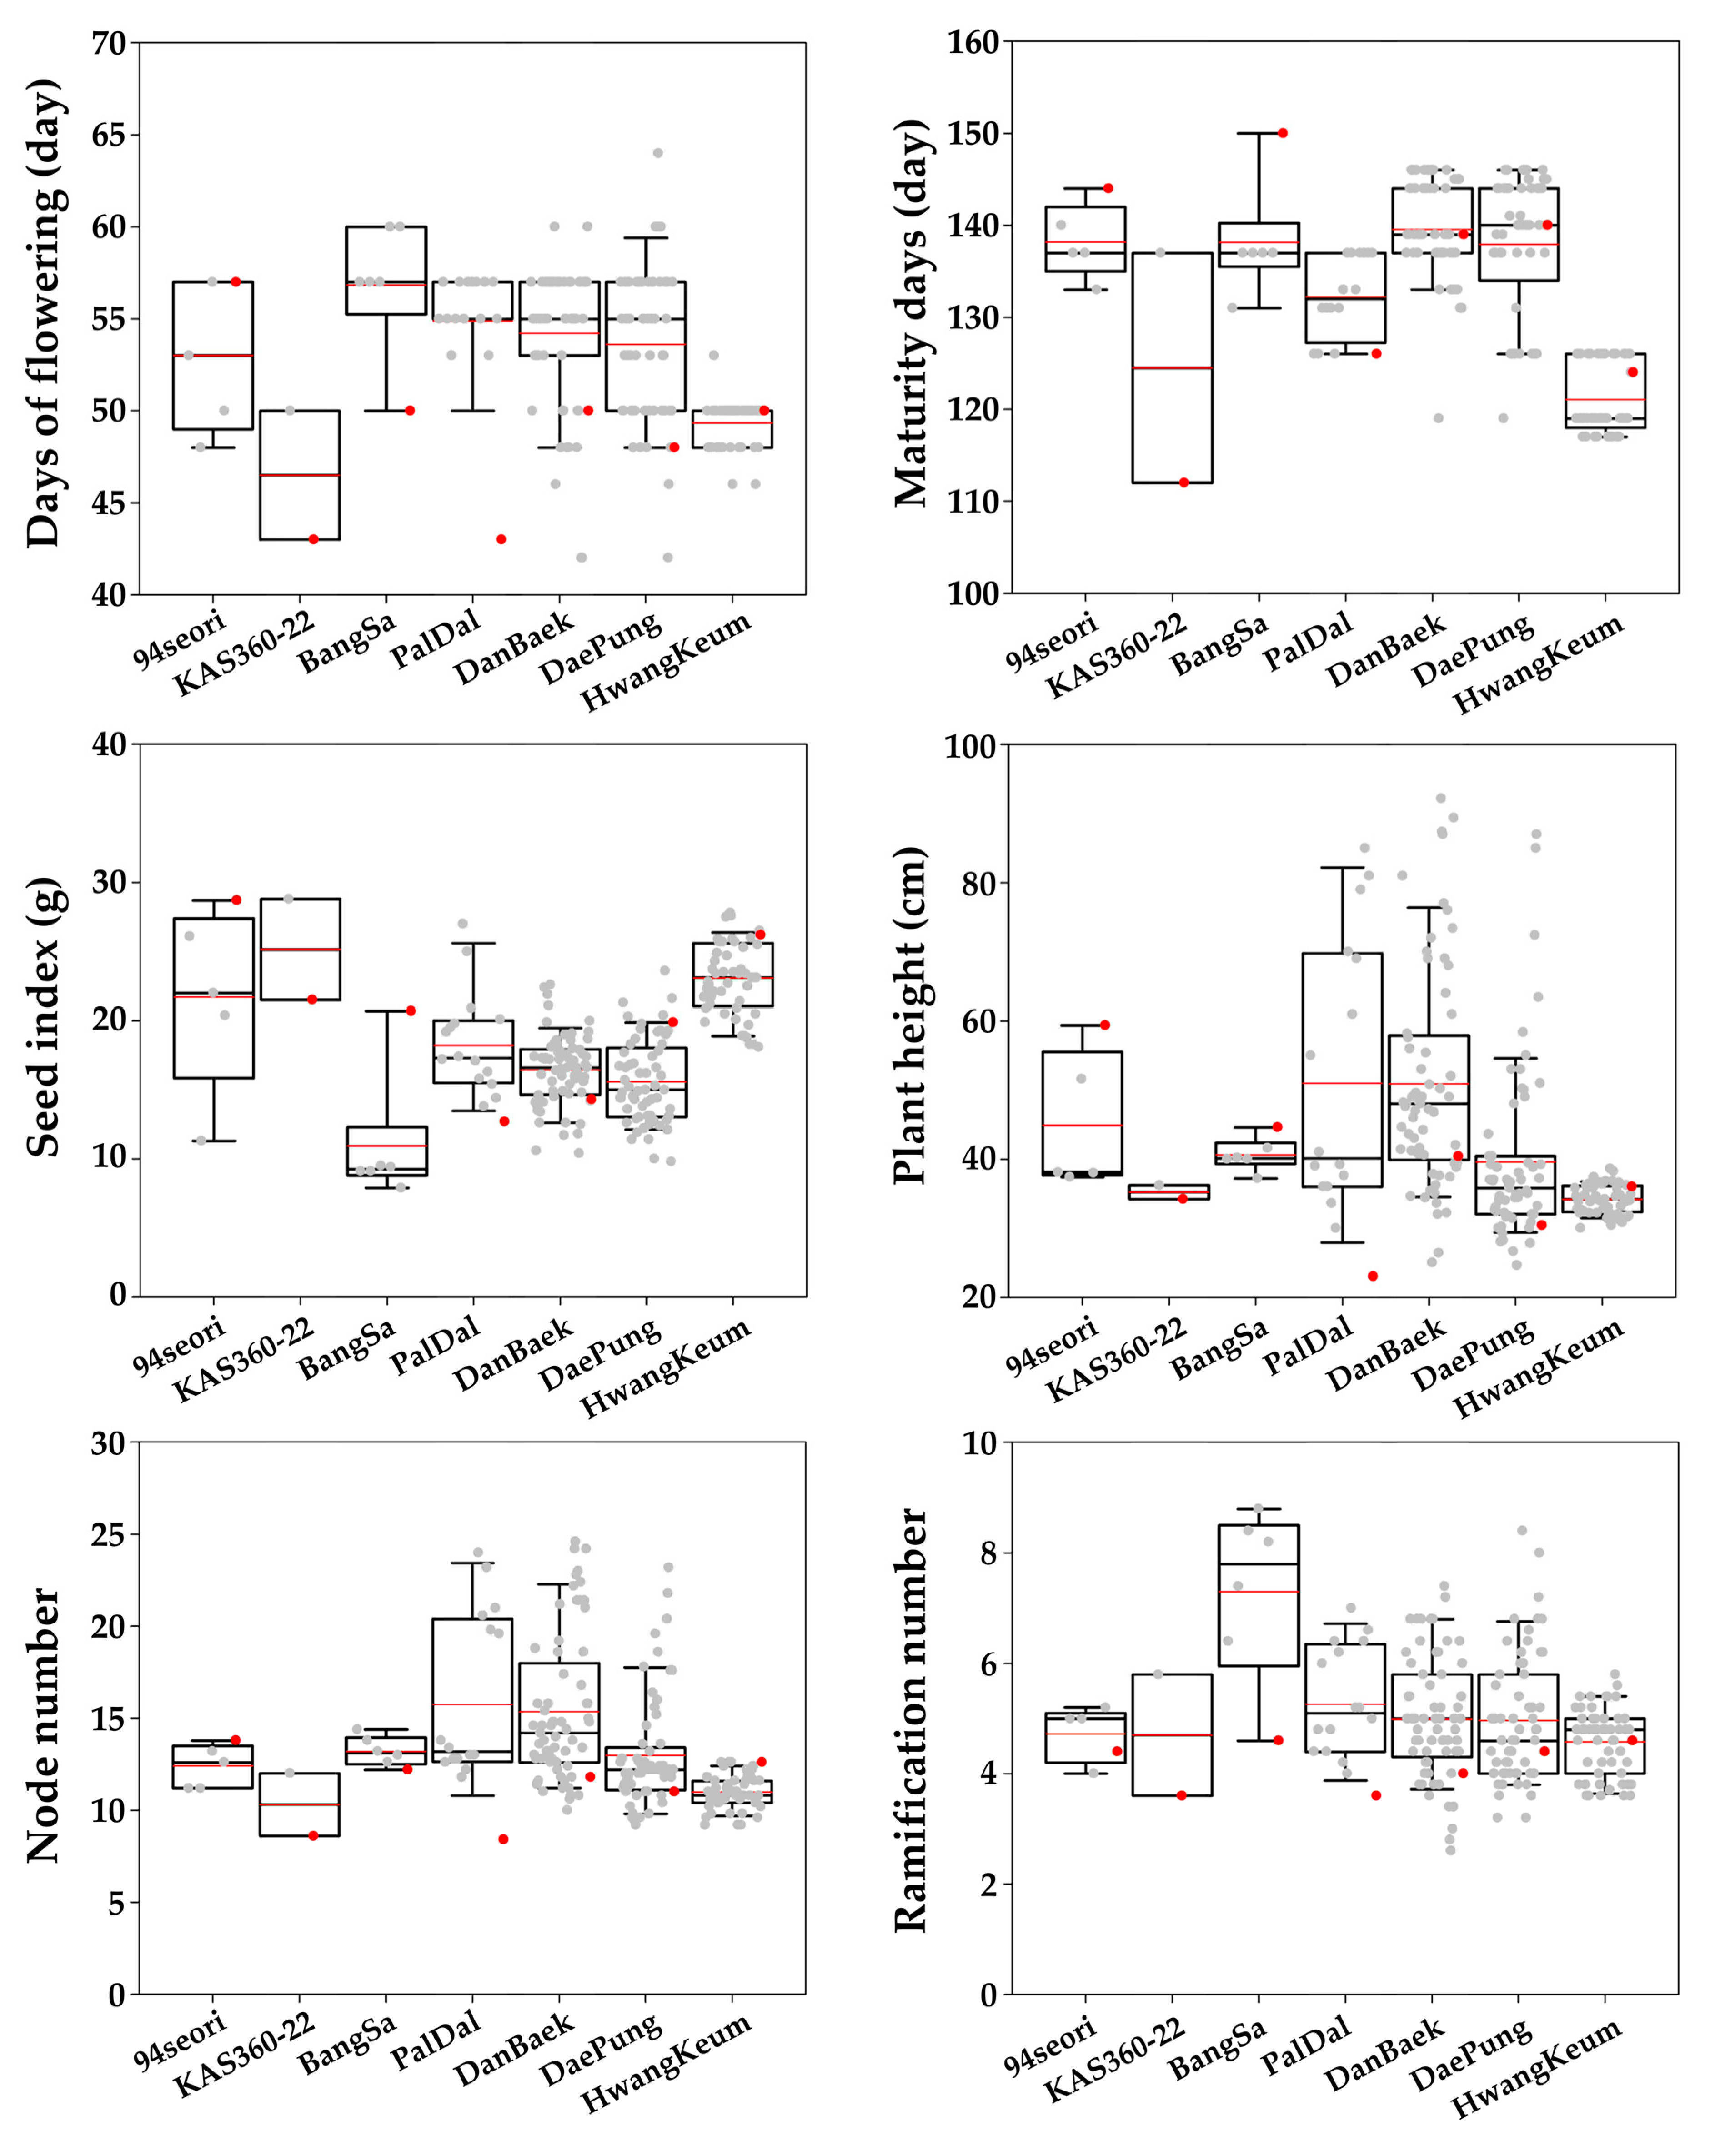
3.1. Phenotypic Analysis and Correlation Analysis
3.2. TRAP Marker Polymorphism
3.3. Genetic Relationships and Population Structure of the 208 MDP Lines
3.4. AMOVA
3.5. Association Analysis
4. Discussion
5. Conclusions
Supplementary Materials
Author Contributions
Funding
Acknowledgments
Conflicts of Interest
References
- Hartman, G.L.; West, E.D.; Herman, T.K. Crops that feed the World 2. Soybean—Worldwide production, use, and constraints caused by pathogens and pests. Food Secur. 2011, 3, 5–17. [Google Scholar] [CrossRef]
- Qiu, L.-J.; Xing, L.-L.; Guo, Y.; Wang, J.; Jackson, S.A.; Chang, R.-Z. A platform for soybean molecular breeding: The utilization of core collections for food security. Plant Mol. Biol. 2013, 83, 41–50. [Google Scholar] [CrossRef] [PubMed]
- Krober, O.A.; Cartter, J.L. Quantitative Interrelations of Protein and Nonprotein Constituents of Soybeans 1. Crop Sci. 1962, 2, 171–172. [Google Scholar] [CrossRef]
- Singh, G. The Soybean: Botany, Production and Uses; CABI: Wallingford, UK, 2010. [Google Scholar]
- Jiang, S.-Y.; Ramachandran, S. Natural and artificial mutants as valuable resources for functional genomics and molecular breeding. Int. J. Biol. Sci. 2010, 6, 228–251. [Google Scholar] [CrossRef] [PubMed]
- Sharma, D.; Rana, D. Response of castor (Ricinus communis) genotypes to low doses of gamma irradiation. Indian J. Agric. Sci. 2007, 77, 467–469. [Google Scholar]
- Ryu, J.; Im, S.; Kim, D.; Ahn, J.; Kim, J.; Kim, S.; Kang, S. Effects of Gamma-ray irradiation on growth characteristics and DNA damage in licorice (Glycyrrhiza uralensis). Radiat. Indust 2014, 8, 89–95. [Google Scholar]
- Wallace, S.S. Biological consequences of free radical-damaged DNA bases. Free Radic. Biol. Med. 2002, 33, 1–14. [Google Scholar] [CrossRef]
- Wu, J.; Morimyo, M.; Hongo, E.; Higashi, T.; Okamoto, M.; Kawano, A.; Ohmachi, Y. Radiation-induced germline mutations detected by a direct comparison of parents and first-generation offspring DNA sequences containing SNPs. Mutat. Res. Fundam. Mol. Mech. Mutagenesis 2006, 596, 1–11. [Google Scholar] [CrossRef]
- Lee, K.J.; Kim, J.-B.; Kim, S.H.; Ha, B.-K.; Lee, B.-M.; Kang, S.-Y.; Kim, D.S. Alteration of seed storage protein composition in soybean [Glycine max (L.) Merrill] mutant lines induced by γ-irradiation mutagenesis. J. Agric. Food Chem. 2011, 59, 12405–12410. [Google Scholar] [CrossRef]
- Ha, B.-K.; Lee, K.J.; Velusamy, V.; Kim, J.-B.; Kim, S.H.; Ahn, J.-W.; Kang, S.-Y.; Kim, D.S. Improvement of soybean through radiation-induced mutation breeding techniques in Korea. Plant Genet. Resour. 2014, 12, S54–S57. [Google Scholar] [CrossRef]
- Powell, W.; Morgante, M.; Andre, C.; Hanafey, M.; Vogel, J.; Tingey, S.; Rafalski, A. The comparison of RFLP, RAPD, AFLP and SSR (microsatellite) markers for germplasm analysis. Mol. Breed. 1996, 2, 225–238. [Google Scholar] [CrossRef]
- Agarwal, M.; Shrivastava, N.; Padh, H. Advances in molecular marker techniques and their applications in plant sciences. Plant Cell Rep. 2008, 27, 617–631. [Google Scholar] [CrossRef] [PubMed]
- Hu, J.; Vick, B.A. Target region amplification polymorphism: A novel marker technique for plant genotyping. Plant Mol. Biol. Report. 2003, 21, 289–294. [Google Scholar] [CrossRef]
- Hu, Z.; Zhang, H.; Kan, G.; Ma, D.; Zhang, D.; Shi, G.; Hong, D.; Zhang, G.; Yu, D. Determination of the genetic architecture of seed size and shape via linkage and association analysis in soybean (Glycine max L. Merr.). Genetica 2013, 141, 247–254. [Google Scholar] [CrossRef]
- Kwon, S.-J.; Hu, J.; Coyne, C.J. Genetic diversity and relationship among faba bean (Vicia faba L.) germplasm entries as revealed by TRAP markers. Plant Genet. Resour. 2010, 8, 204–213. [Google Scholar] [CrossRef]
- Devarumath, R.M.; Kalwade, S.B.; Bundock, P.; Eliott, F.G.; Henry, R. Independent target region amplification polymorphism and single-nucleotide polymorphism marker utility in genetic evaluation of sugarcane genotypes. Plant Breed. 2013, 132, 736–747. [Google Scholar] [CrossRef]
- Chen, S.-S.; Chen, G.-Y.; Chen, H.; Wei, Y.-M.; Li, W.; Liu, Y.-X.; Liu, D.-C.; Lan, X.-J.; Zheng, Y.-L. Mapping stripe rust resistance gene YrSph derived from Tritium sphaerococcum Perc. with SSR, SRAP, and TRAP markers. Euphytica 2012, 185, 19–26. [Google Scholar] [CrossRef]
- Im, S.; Kwon, S.; Ryu, J.; Jeong, S.; Kim, J.; Ahn, J.; Kim, S.; Jo, Y.; Choi, H.; Kang, S. Development of a transposon-based marker system for mutation breeding in sorghum (Sorghum bicolor L.). Genet. Mol. Res. GMR 2016, 15, gmr8713. [Google Scholar] [CrossRef]
- Lee, M.-K.; Lyu, J.I.; Hong, M.J.; Kim, D.-G.; Kim, J.M.; Kim, J.-B.; Eom, S.H.; Ha, B.-K.; Kwon, S.-J. Utility of TRAP markers to determine indel mutation frequencies induced by gamma-ray irradiation of faba bean (Vicia faba L.) seeds. Int. J. Radiat. Biol. 2019, 95, 1160–1171. [Google Scholar] [CrossRef]
- Andersen, J.R.; Lübberstedt, T. Functional markers in plants. Trends Plant Sci. 2003, 8, 554–560. [Google Scholar] [CrossRef]
- Brar, D.S. Molecular marker assisted breeding. In Molecular Techniques in Crop Improvement; Springer: Berlin/Heidelberg, Germany, 2002; pp. 55–83. [Google Scholar]
- Pawar, K.; Yadav, S.; Arman, M.; Singh, A. Assessment of divergence in soybean (Glycine max L. Merrill) germplasm for yield attributing traits. IJSR 2013, 2, 1–2. [Google Scholar] [CrossRef]
- Borba, T.C.D.O.; Brondani, R.P.V.; Breseghello, F.; Coelho, A.S.G.; Mendonça, J.A.; Rangel, P.H.N.; Brondani, C. Association mapping for yield and grain quality traits in rice (Oryza sativa L.). Genet. Mol. Biol. 2010, 33, 515–524. [Google Scholar] [CrossRef] [PubMed][Green Version]
- Xue, Y.; Warburton, M.L.; Sawkins, M.; Zhang, X.; Setter, T.; Xu, Y.; Grudloyma, P.; Gethi, J.; Ribaut, J.-M.; Li, W. Genome-wide association analysis for nine agronomic traits in maize under well-watered and water-stressed conditions. Theor. Appl. Genet. 2013, 126, 2587–2596. [Google Scholar] [CrossRef] [PubMed]
- Hu, Z.; Zhang, D.; Zhang, G.; Kan, G.; Hong, D.; Yu, D. Association mapping of yield-related traits and SSR markers in wild soybean (Glycine soja Sieb. and Zucc.). Breed. Sci. 2014, 63, 441–449. [Google Scholar] [CrossRef] [PubMed]
- Lee, C.; Choi, M.-S.; Kim, H.-T.; Yun, H.-T.; Lee, B.; Chung, Y.-S.; Kim, R.W.; Choi, H.-K. Soybean [Glycine max (L.) Merrill]: Importance as a crop and pedigree reconstruction of Korean varieties. Plant Breed. Biotechnol. 2015, 3, 179–196. [Google Scholar] [CrossRef]
- Maher, C.; Stein, L.; Ware, D. Evolution of Arabidopsis microRNA families through duplication events. Genome Res. 2006, 16, 510–519. [Google Scholar] [CrossRef]
- Hu, J.; Mou, B.; Vick, B.A. Genetic diversity of 38 spinach (Spinacia oleracea L.) germplasm accessions and 10 commercial hybrids assessed by TRAP markers. Genet. Resour. Crop Evol. 2007, 54, 1667–1674. [Google Scholar] [CrossRef]
- Frankel, O. Genetic perspectives of germplasm conservation. In Genetic Manipulation: Impact on Man and Society; Cambridge University Press: Cambridge, UK, 1984; pp. 161–170. [Google Scholar]
- Balfourier, F.; Roussel, V.; Strelchenko, P.; Exbrayat-Vinson, F.; Sourdille, P.; Boutet, G.; Koenig, J.; Ravel, C.; Mitrofanova, O.; Beckert, M. A worldwide bread wheat core collection arrayed in a 384-well plate. Theor. Appl. Genet. 2007, 114, 1265–1275. [Google Scholar] [CrossRef]
- Zhang, H.; Zhang, D.; Wang, M.; Sun, J.; Qi, Y.; Li, J.; Han, L.; Qiu, Z.; Tang, S.; Li, Z. A core collection and mini core collection of Oryza sativa L. in China. Theor. Appl. Genet. 2011, 122, 49–61. [Google Scholar] [CrossRef]
- Hong, M.J.; Jang, Y.E.; Kim, D.G.; Kim, J.M.; Lee, M.K.; Kim, J.B.; Eom, S.H.; Ha, B.K.; Lyu, J.I.; Kwon, S.J. Selection of mutants with high linolenic acid contents and characterization of fatty acid desaturase 2 and 3 genes during seed development in soybean (Glycine max). J. Sci. Food Agric. 2019, 99, 5384–5391. [Google Scholar] [CrossRef]
- Hu, J.; Ochoa, O.E.; Truco, M.J.; Vick, B.A. Application of the TRAP technique to lettuce (Lactuca sativa L.) genotyping. Euphytica 2005, 144, 225–235. [Google Scholar] [CrossRef]
- Alwala, S.; Kimbeng, C.A.; Veremis, J.C.; Gravois, K.A. Linkage mapping and genome analysis in a Saccharum interspecific cross using AFLP, SRAP and TRAP markers. Euphytica 2008, 164, 37–51. [Google Scholar] [CrossRef]
- Palumbo, R.; Hong, W.-F.; Wang, G.-L.; Hu, J.; Craig, R.; Locke, J.; Krause, C.; Tay, D. Target region amplification polymorphism (TRAP) as a tool for detecting genetic variation in the genus Pelargonium. HortScience 2007, 42, 1118–1123. [Google Scholar] [CrossRef]
- Yue, B.; Cai, X.; Vick, B.A.; Hu, J. Genetic diversity and relationships among 177 public sunflower inbred lines assessed by TRAP markers. Crop Sci. 2009, 49, 1242–1249. [Google Scholar] [CrossRef]
- Atak, Ç.; Alikamanoğlu, S.; Açık, L.; Canbolat, Y. Induced of plastid mutations in soybean plant (Glycine max L. Merrill) with gamma radiation and determination with RAPD. Mutat. Res. Fundam. Mol. Mech. Mutagenesis 2004, 556, 35–44. [Google Scholar] [CrossRef]
- Jain, R.K.; Joshi, A.; Jain, D. Molecular Marker Based Genetic Diversity Analysis in Soybean Glycine max (L.) Merrill Genotypes. Int. J. Curr. Microbiol. Appl. Sci 2017, 6, 1034–1044. [Google Scholar] [CrossRef][Green Version]
- Maughan, P.; Maroof, M.S.; Buss, G.; Huestis, G. Amplified fragment length polymorphism (AFLP) in soybean: Species diversity, inheritance, and near-isogenic line analysis. Theor. Appl. Genet. 1996, 93, 392–401. [Google Scholar] [CrossRef]
- Zargar, M.; Romanova, E.; Shmelkova, E.; Trifonova, A.; Kezimana, P. AFLP-analysis of genetic diversity in soybean [Glycine max (l.) Merr.] cultivars Russian and foreign selection. Agron. Res. 2017, 15, 2217–2225. [Google Scholar]
- Kim, S.-H.; Jung, J.-W.; Moon, J.-K.; Woo, S.-H.; Cho, Y.-G.; Jong, S.-K.; Kim, H.-S. Genetic diversity and relationship by SSR markers of Korean soybean cultivars. Korean J. Crop Sci. 2006, 51, 248–258. [Google Scholar]
- Khan, I.A.; Bibi, S.; Yasmin, S.; Khatri, A.; Seema, N.; Afghan, S. Genetic variability in mutated population of sugarcane clone NIA-98 through molecular markers (RAPD and TRAP). Pak. J. Bot. 2010, 42, 605–614. [Google Scholar]
- Qiao, L.; Liu, H.; Sun, J.; Zhao, F.; Guo, B.; Weng, M.; Liu, T.; Dai, J.; Wang, B. Application of target region amplification polymorphism (TRAP) technique to Porphyra (Bangiales, Rhodophyta) fingerprinting. Phycologia 2007, 46, 450–455. [Google Scholar] [CrossRef]
- Neumann, K.; Kobiljski, B.; Denčić, S.; Varshney, R.; Börner, A. Genome-wide association mapping: A case study in bread wheat (Triticum aestivum L.). Mol. Breed. 2011, 27, 37–58. [Google Scholar] [CrossRef]
- Kwon, S.; Simko, I.; Hellier, B.; Mou, B.; Hu, J. Genome-wide association of 10 horticultural traits with expressed sequence tag-derived SNP markers in a collection of lettuce lines. Crop J. 2013, 1, 25–33. [Google Scholar] [CrossRef]
- Kwon, S.-J.; Brown, A.F.; Hu, J.; McGee, R.; Watt, C.; Kisha, T.; Timmerman-Vaughan, G.; Grusak, M.; McPhee, K.E.; Coyne, C.J. Genetic diversity, population structure and genome-wide marker-trait association analysis emphasizing seed nutrients of the USDA pea (Pisum sativum L.) core collection. Genes Genom. 2012, 34, 305–320. [Google Scholar] [CrossRef]


| Primer name | Sequence (5’–3´) |
|---|---|
| Fixed primers | |
| B14G14B | AAT CTC AAG GAC AAA AGG |
| MIR 156A | GAT CTC TTT GGC CTG TC |
| MIR 157B | GAT CAT TGT CCA GAT TC |
| MIR 159A | GAT CCT TGG TTC TTT GG |
| Arbitrary primers | |
| Sa4 | TTA CCT TGG TCA TAC AAC ATT |
| Sa12 | TTC TAG GTA ATC CAA CAA CA |
| Ga3 | TCA TCT CAA ACC ATC TAC AC |
| Ga5 | GGA ACC AAA CAC ATG AAG A |
| Values | Agronomic Traits | Morphological Traits | ||||
|---|---|---|---|---|---|---|
| Days of Flowering | Maturity Days | Seed Index (g) | Node Number (ea) | Plant Height (cm) | Ramification Number (ea) | |
| Min | 42 | 112 | 7.9 | 8.4 | 23.0 | 2.6 |
| Mean | 52.83 | 133.58 | 18.06 | 13.40 | 42.73 | 4.96 |
| Max | 64 | 150 | 28.8 | 24.6 | 92.2 | 8.8 |
| Line No. | ||||||
| Min | S87, S88, S149 | S6 | S13 | S14 | S14 | S81 |
| Max | S138 | S8 | S7 | S78 | S76 | S12 |
| DF | MD | GT | FC | SCC | SHC | SI | SA | PH | NN | RN | |
|---|---|---|---|---|---|---|---|---|---|---|---|
| DF (days of flowering) | ─ | 0.419 * | 0.266 * | 0.436 * | 0.038 | 0.060 | −0.327 * | 0.435 * | 0.272 * | 0.323 * | 0.248 * |
| MD (Maturity days) | ─ | 0.269 * | 0.369 * | 0.042 | 0.034 | −0.512 * | 0.491 * | 0.407 * | 0.381 * | 0.224 * | |
| GT (Growth type) | ─ | 0.031 | 0.129 * | 0.237 * | 0.308 * | 0.117 | 0.749 * | 0.824 * | 0.101 | ||
| FC (Flower color) | ─ | 0.301 * | 0.280 * | 0.369 * | 0.685 * | 0.058 | 0.003 | 0.099 | |||
| SCC (Seed coat color) | ─ | 0.354 * | 0.071 | 0.243 * | 0.166 * | 0.134 * | 0.068 | ||||
| SHC (Seed hilum color) | ─ | 0.005 | 0.197 * | 0.241 * | 0.260 * | 0.124 * | |||||
| SI (Seed index) | ─ | 0.554 * | −0.295 * | −0.357 * | −0.211 * | ||||||
| SA (Stem anthocyanin) | ─ | 0.027 | 0.103 | 0.009 | |||||||
| PH (Plant height) | ─ | 0.912 * | 0.177 * | ||||||||
| NN (Node number) | ─ | 0.202 * | |||||||||
| RN (Ramification number) | ─ |
| Primer Combination | Total Number of Fragments | Polymorphic Fragments | Polymorphism (%) | PIC |
|---|---|---|---|---|
| B14G14B + Sa4 | 38 | 23 | 60.53 | 0.15 |
| B14G14B + Sa12 | 38 | 17 | 44.74 | 0.07 |
| B14G14B + Ga3 | 34 | 11 | 32.35 | 0.08 |
| B14G14B + Ga5 | 45 | 29 | 64.44 | 0.16 |
| MIR156A + Sa4 | 39 | 31 | 79.49 | 0.16 |
| MIR156A + Sa12 | 37 | 22 | 59.46 | 0.16 |
| MIR156A + Ga3 | 35 | 17 | 48.57 | 0.12 |
| MIR156A + Ga5 | 35 | 25 | 71.43 | 0.20 |
| MIR157B + Sa4 | 31 | 23 | 60.53 | 0.23 |
| MIR157B + Sa12 | 31 | 19 | 61.29 | 0.16 |
| MIR157B + Ga3 | 30 | 17 | 56.67 | 0.14 |
| MIR157B + Ga5 | 25 | 21 | 84.00 | 0.21 |
| MIR159A + Sa4 | 36 | 22 | 58.33 | 0.18 |
| MIR159A + Sa12 | 37 | 18 | 48.65 | 0.10 |
| MIR159A + Ga3 | 29 | 15 | 51.72 | 0.16 |
| MIR159A + Ga5 | 31 | 20 | 64.52 | 0.16 |
| Total | 551 | 329 | ─ | ─ |
| Average | 34.44 | 20.56 | 59.71 | 0.15 |
| Source | Est. Var. | Percentage of variation (%) | ||||||||||||
|---|---|---|---|---|---|---|---|---|---|---|---|---|---|---|
| Inter-mutant pops | 11.320 | 20.6 | ||||||||||||
| Intra 94Seori pops | 0.820 | 1.5 | ||||||||||||
| Intra KAS360-22 pops | 0.231 | 0.4 | ||||||||||||
| Intra BangSa pops | 0.866 | 1.6 | ||||||||||||
| Intra PalDal pops | 2.765 | 5.0 | ||||||||||||
| Intra DanBaek pops | 14.324 | 26.1 | ||||||||||||
| Intra DaePung pops | 14.252 | 26.0 | ||||||||||||
| Intra HwangKeum pops | 10.342 | 18.8 | ||||||||||||
| Control | 94Seori | KAS360-22 | BangSa | PalDal | DanBaek | DaePung | HwangKeum | |||||||
| 94Seori | ─ | |||||||||||||
| KAS360-22 | 0.065 | ─ | ||||||||||||
| BangSa | 0.273 | 0.243 | ─ | |||||||||||
| PalDal | 0.312 | 0.270 | 0.285 | ─ | ||||||||||
| DanBaek | 0.239 | 0.229 | 0.222 | 0.268 | ─ | |||||||||
| DaePung | 0.276 | 0.245 | 0.258 | 0.226 | 0.129 | ─ | ||||||||
| HwangKeum | 0.351 | 0.343 | 0.322 | 0.270 | 0.254 | 0.126 | ─ | |||||||
| Trait | Marker | SFA a | R2 | Q GLM b | R2 | Q + K MLM c | R2 | Average p-value |
|---|---|---|---|---|---|---|---|---|
| Maturity days | B14 + Ga5_28 | ** | 0.073 | ** | 0.044 | * | 0.044 | * |
| Growth type | 156A + Ga5_16 | ** | 0.116 | ** | 0.101 | ** | 0.111 | ** |
| 157B + Sa4_4 | ** | 0.125 | ** | 0.102 | ** | 0.102 | ** | |
| Flower color | 157B + Sa12_6 | ** | 0.216 | ** | 0.074 | ** | 0.072 | ** |
| 156A + Sa12_17 | ** | 0.159 | * | 0.057 | * | 0.057 | * | |
| 157B + Ga5_9 | ** | 0.125 | * | 0.046 | * | 0.046 | * | |
| Seed coat color | 157B + Sa12_20 | ** | 0.083 | ** | 0.083 | ** | 0.086 | ** |
| Seed hilum color | 159A + Sa12_28 | * | 0.055 | * | 0.058 | * | 0.063 | * |
| 159A + Sa4_33 | ** | 0.111 | * | 0.058 | * | 0.057 | * | |
| 157B + Sa12_20 | * | 0.066 | * | 0.053 | * | 0.056 | * | |
| Seed index | 156A + Ga3_7 | ** | 0.082 | ** | 0.054 | * | 0.054 | ** |
| 159A + Sa4_32 | ** | 0.096 | * | 0.050 | * | 0.050 | * | |
| 156A + Ga3_1 | * | 0.065 | * | 0.046 | * | 0.046 | * | |
| 159A + Ga5_2 | ** | 0.139 | * | 0.044 | * | 0.044 | * | |
| Stem anthocyanin | 157B + Sa4_7 | ** | 0.079 | ** | 0.047 | * | 0.044 | ** |
| Plant height | B14 + Sa4_18 | ** | 0.152 | ** | 0.119 | ** | 0.107 | ** |
| B14 + Ga5_30 | ** | 0.173 | ** | 0.069 | * | 0.059 | ** | |
| 157B + Ga3_10 | ** | 0.135 | ** | 0.062 | * | 0.052 | * | |
| 157B + Sa4_4 | ** | 0.072 | * | 0.053 | * | 0.051 | * | |
| 156A + Sa4_6 | * | 0.056 | * | 0.048 | * | 0.049 | * | |
| 156A + Ga5_13 | ** | 0.100 | ** | 0.063 | * | 0.049 | * | |
| Node number | B14 + Sa4_18 | ** | 0.121 | ** | 0.097 | ** | 0.087 | ** |
| B14 + Ga5_30 | ** | 0.162 | ** | 0.078 | * | 0.066 | ** | |
| 157B + Sa4_4 | ** | 0.083 | * | 0.062 | * | 0.055 | * | |
| 156A + Ga5_16 | ** | 0.074 | * | 0.046 | * | 0.054 | * | |
| Ramification number | 159A + Ga3_24 | * | 0.058 | * | 0.054 | * | 0.061 | * |
| 159A + Sa4_32 | ** | 0.080 | ** | 0.072 | * | 0.058 | * |
© 2020 by the authors. Licensee MDPI, Basel, Switzerland. This article is an open access article distributed under the terms and conditions of the Creative Commons Attribution (CC BY) license (http://creativecommons.org/licenses/by/4.0/).
Share and Cite
Kim, D.-G.; Lyu, J.I.; Lee, M.-K.; Kim, J.M.; Hung, N.N.; Hong, M.J.; Kim, J.-B.; Bae, C.-H.; Kwon, S.-J. Construction of Soybean Mutant Diversity Pool (MDP) Lines and an Analysis of Their Genetic Relationships and Associations Using TRAP Markers. Agronomy 2020, 10, 253. https://doi.org/10.3390/agronomy10020253
Kim D-G, Lyu JI, Lee M-K, Kim JM, Hung NN, Hong MJ, Kim J-B, Bae C-H, Kwon S-J. Construction of Soybean Mutant Diversity Pool (MDP) Lines and an Analysis of Their Genetic Relationships and Associations Using TRAP Markers. Agronomy. 2020; 10(2):253. https://doi.org/10.3390/agronomy10020253
Chicago/Turabian StyleKim, Dong-Gun, Jae Il Lyu, Min-Kyu Lee, Jung Min Kim, Nguyen Ngoc Hung, Min Jeong Hong, Jin-Baek Kim, Chang-Hyu Bae, and Soon-Jae Kwon. 2020. "Construction of Soybean Mutant Diversity Pool (MDP) Lines and an Analysis of Their Genetic Relationships and Associations Using TRAP Markers" Agronomy 10, no. 2: 253. https://doi.org/10.3390/agronomy10020253
APA StyleKim, D.-G., Lyu, J. I., Lee, M.-K., Kim, J. M., Hung, N. N., Hong, M. J., Kim, J.-B., Bae, C.-H., & Kwon, S.-J. (2020). Construction of Soybean Mutant Diversity Pool (MDP) Lines and an Analysis of Their Genetic Relationships and Associations Using TRAP Markers. Agronomy, 10(2), 253. https://doi.org/10.3390/agronomy10020253