Short- and Long-Term Effects of Lime and Gypsum Applications on Acid Soils in a Water-Limited Environment: 2. Soil Chemical Properties

 ,
,  ,
, 
Abstract
1. Introduction
2. Materials and Methods
2.1. Field Experimental Sites
2.2. Soil Measurements
2.3. Lime and Gypsum Recovery
2.4. Statistical Analysis
3. Results
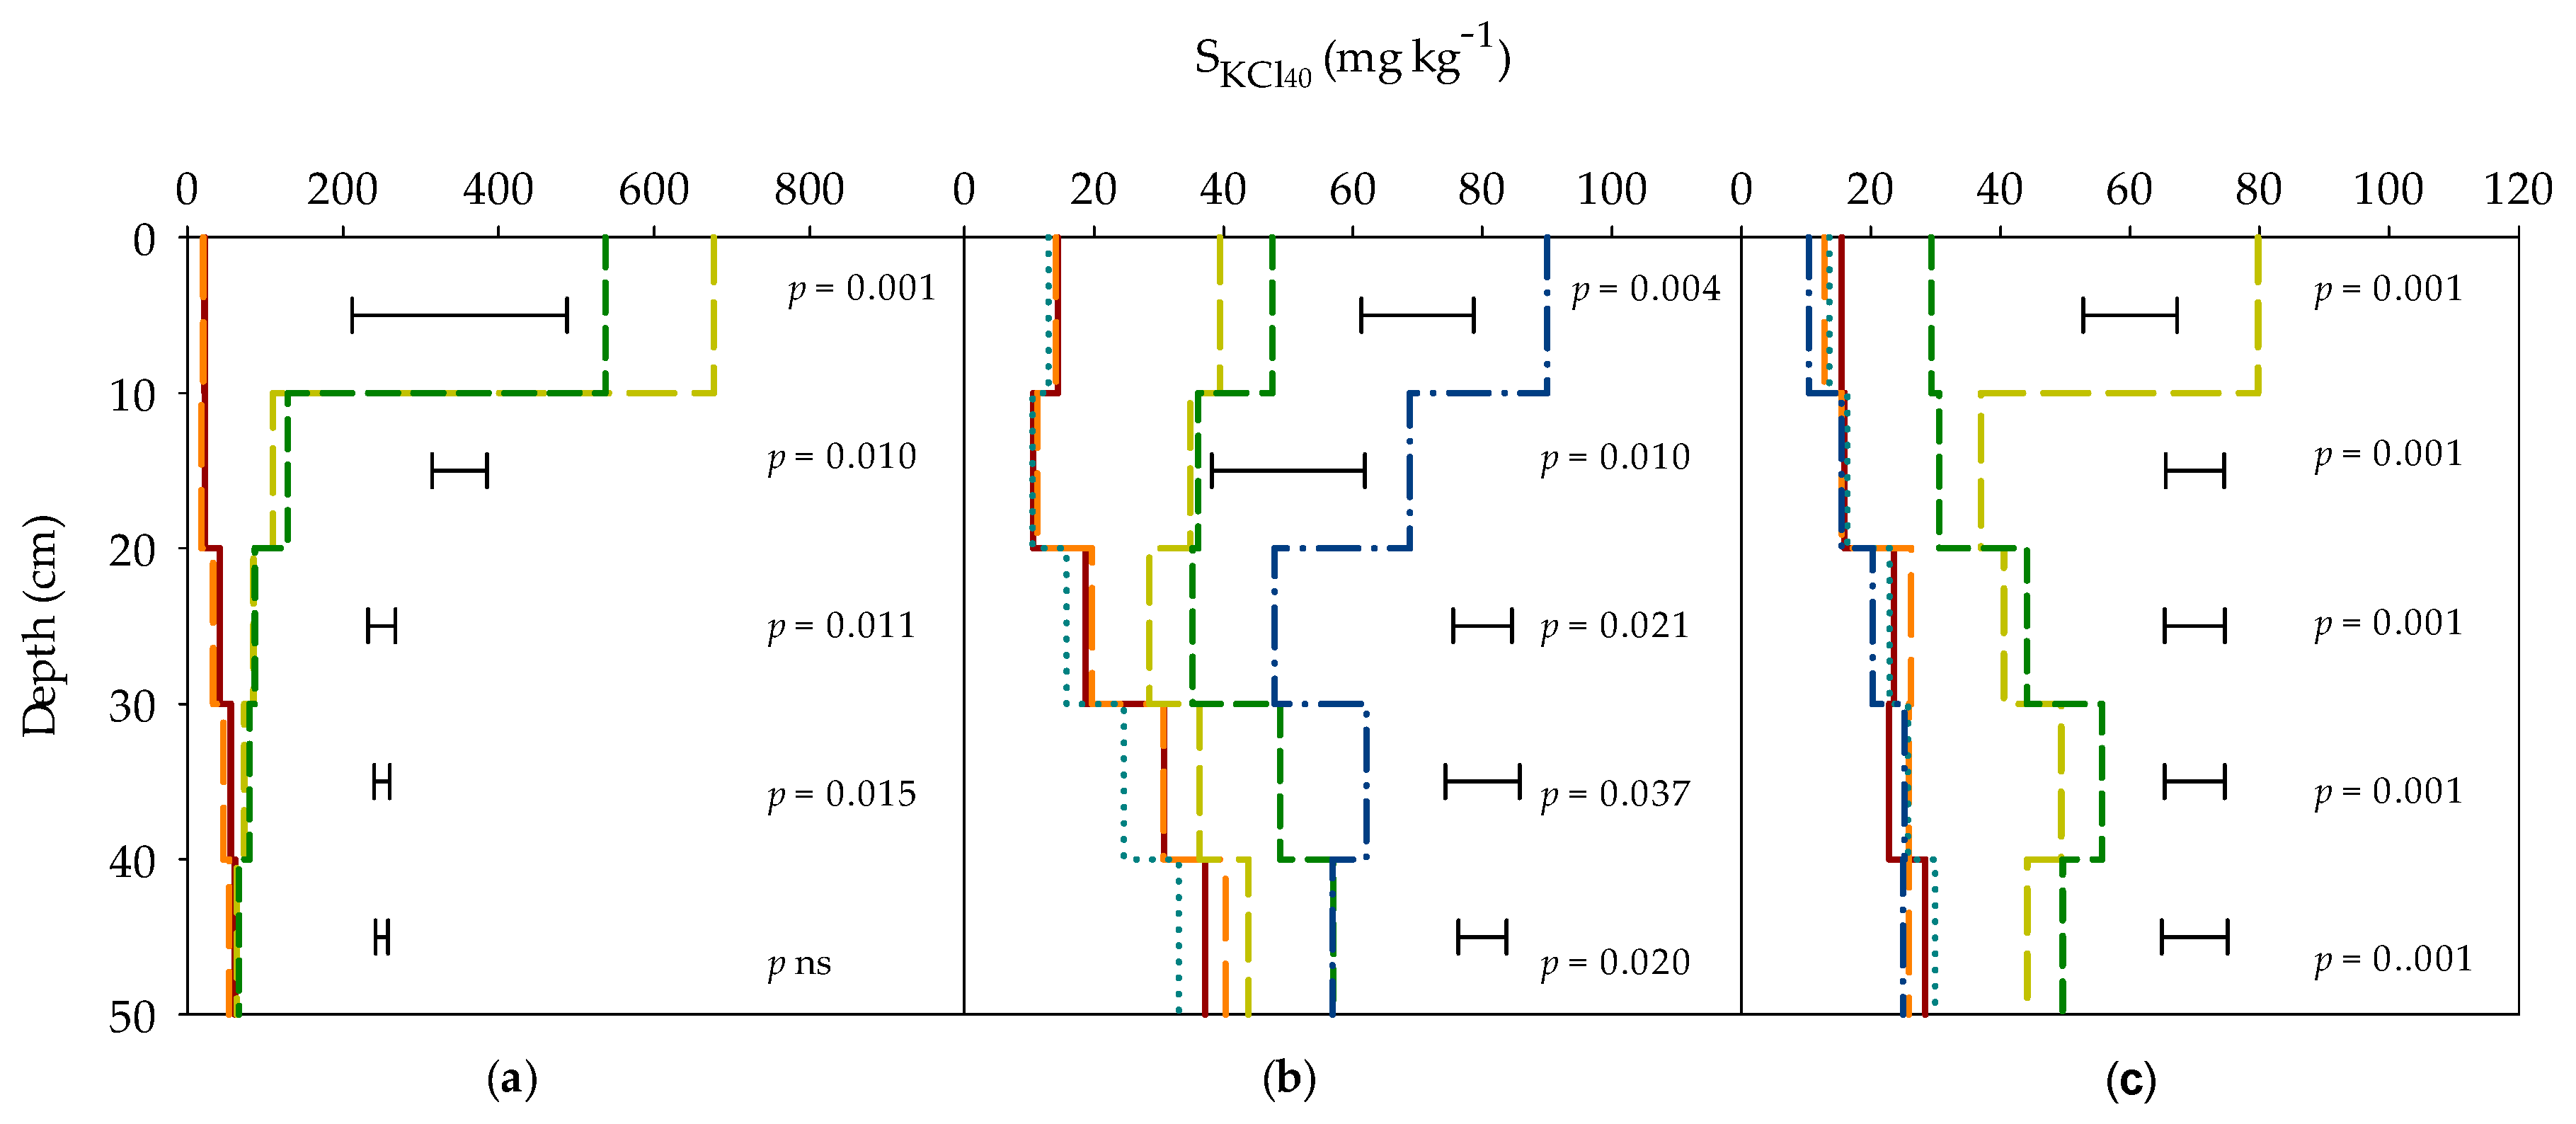
3.1. Sulphur
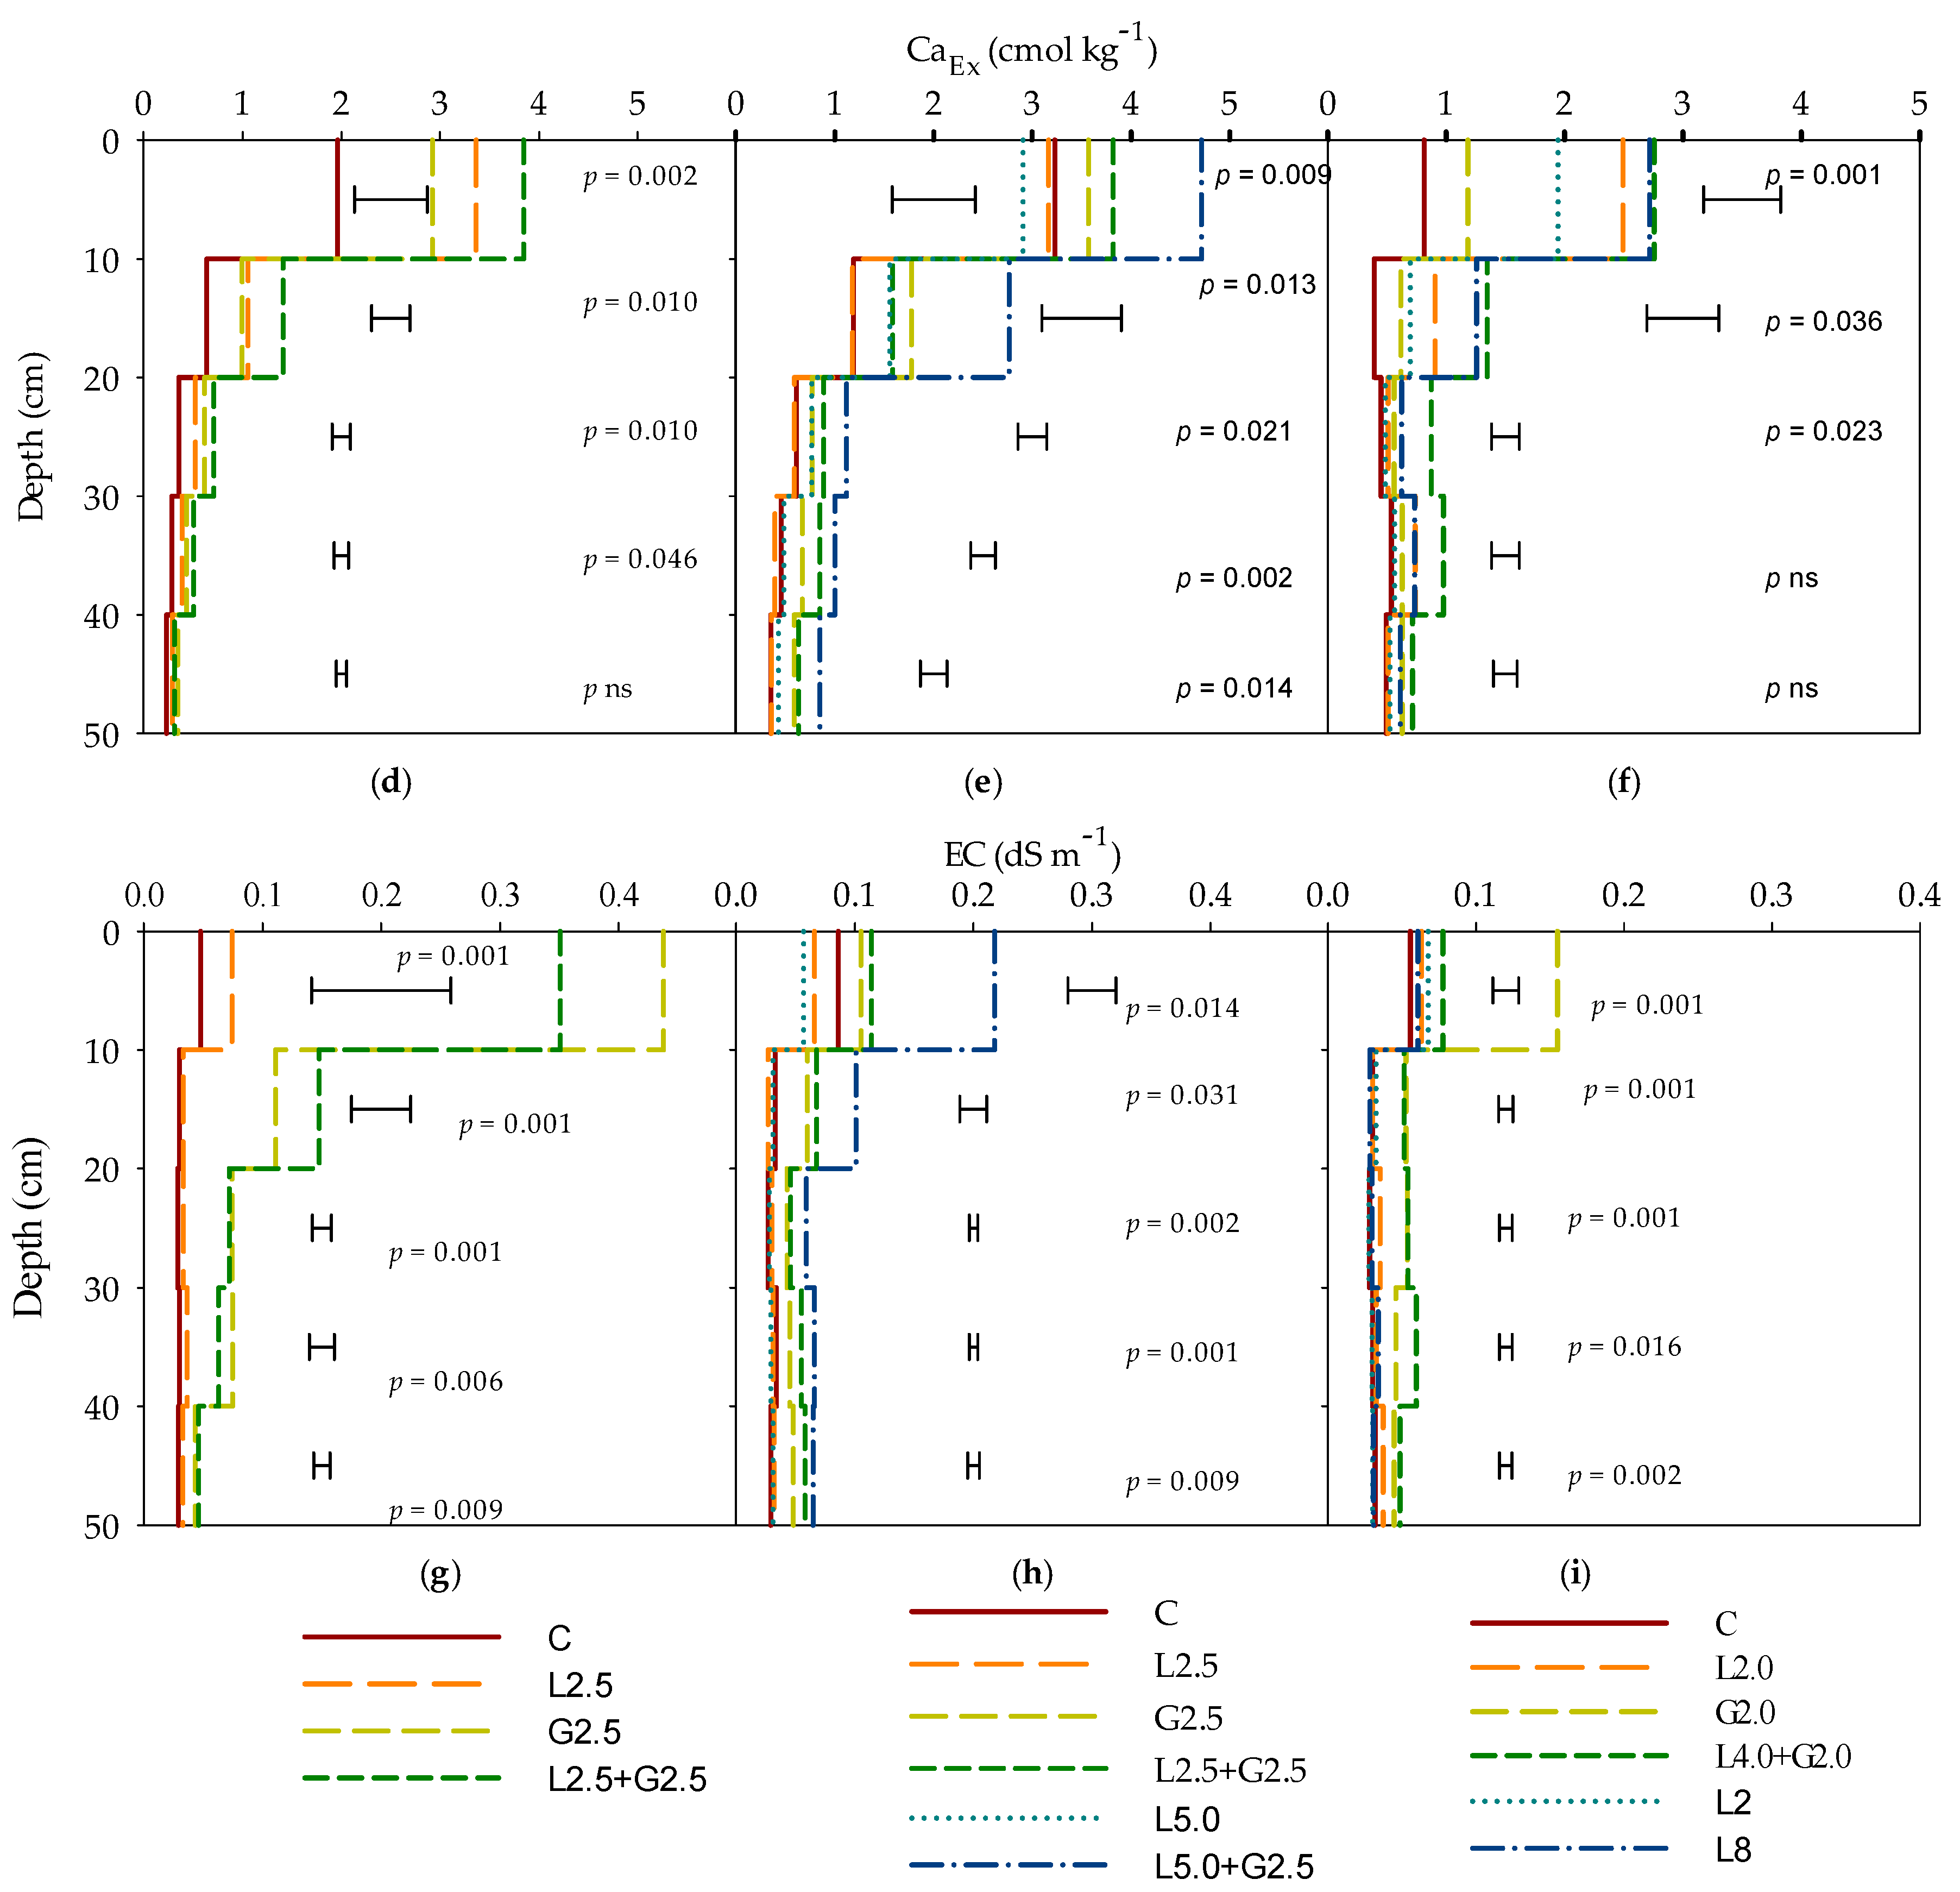
3.2. Calcium
3.3. Electrical Conductivity
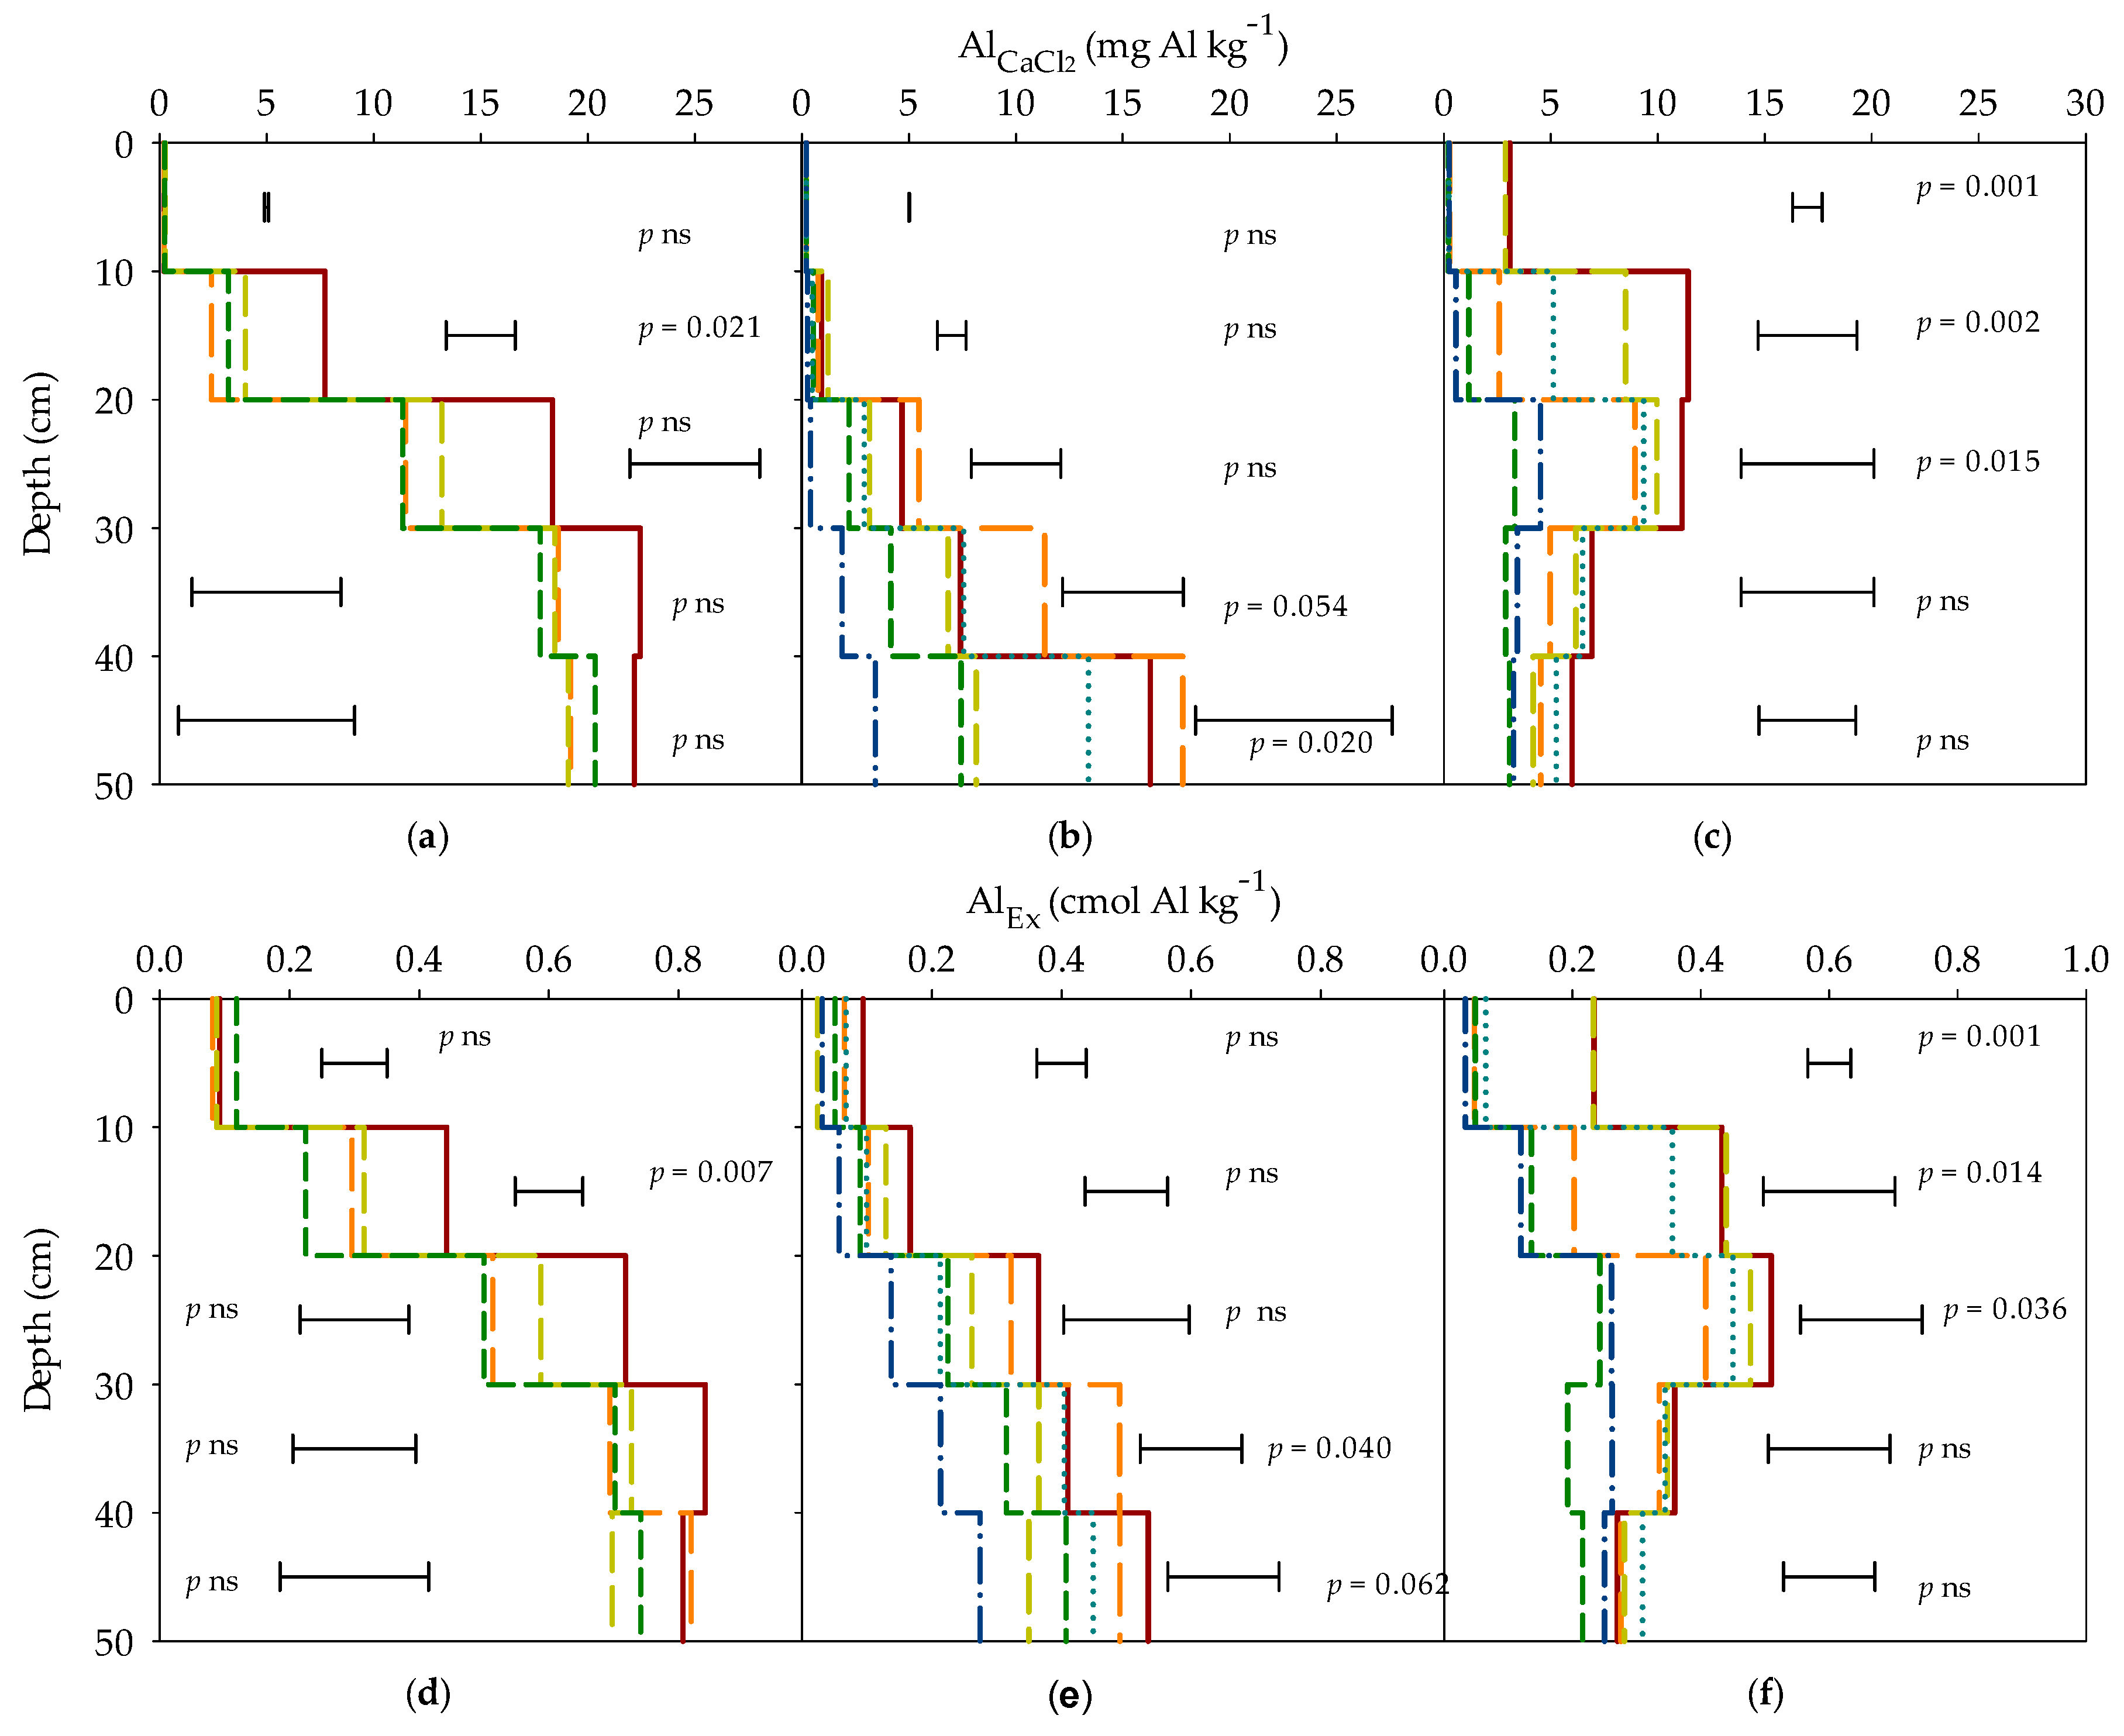
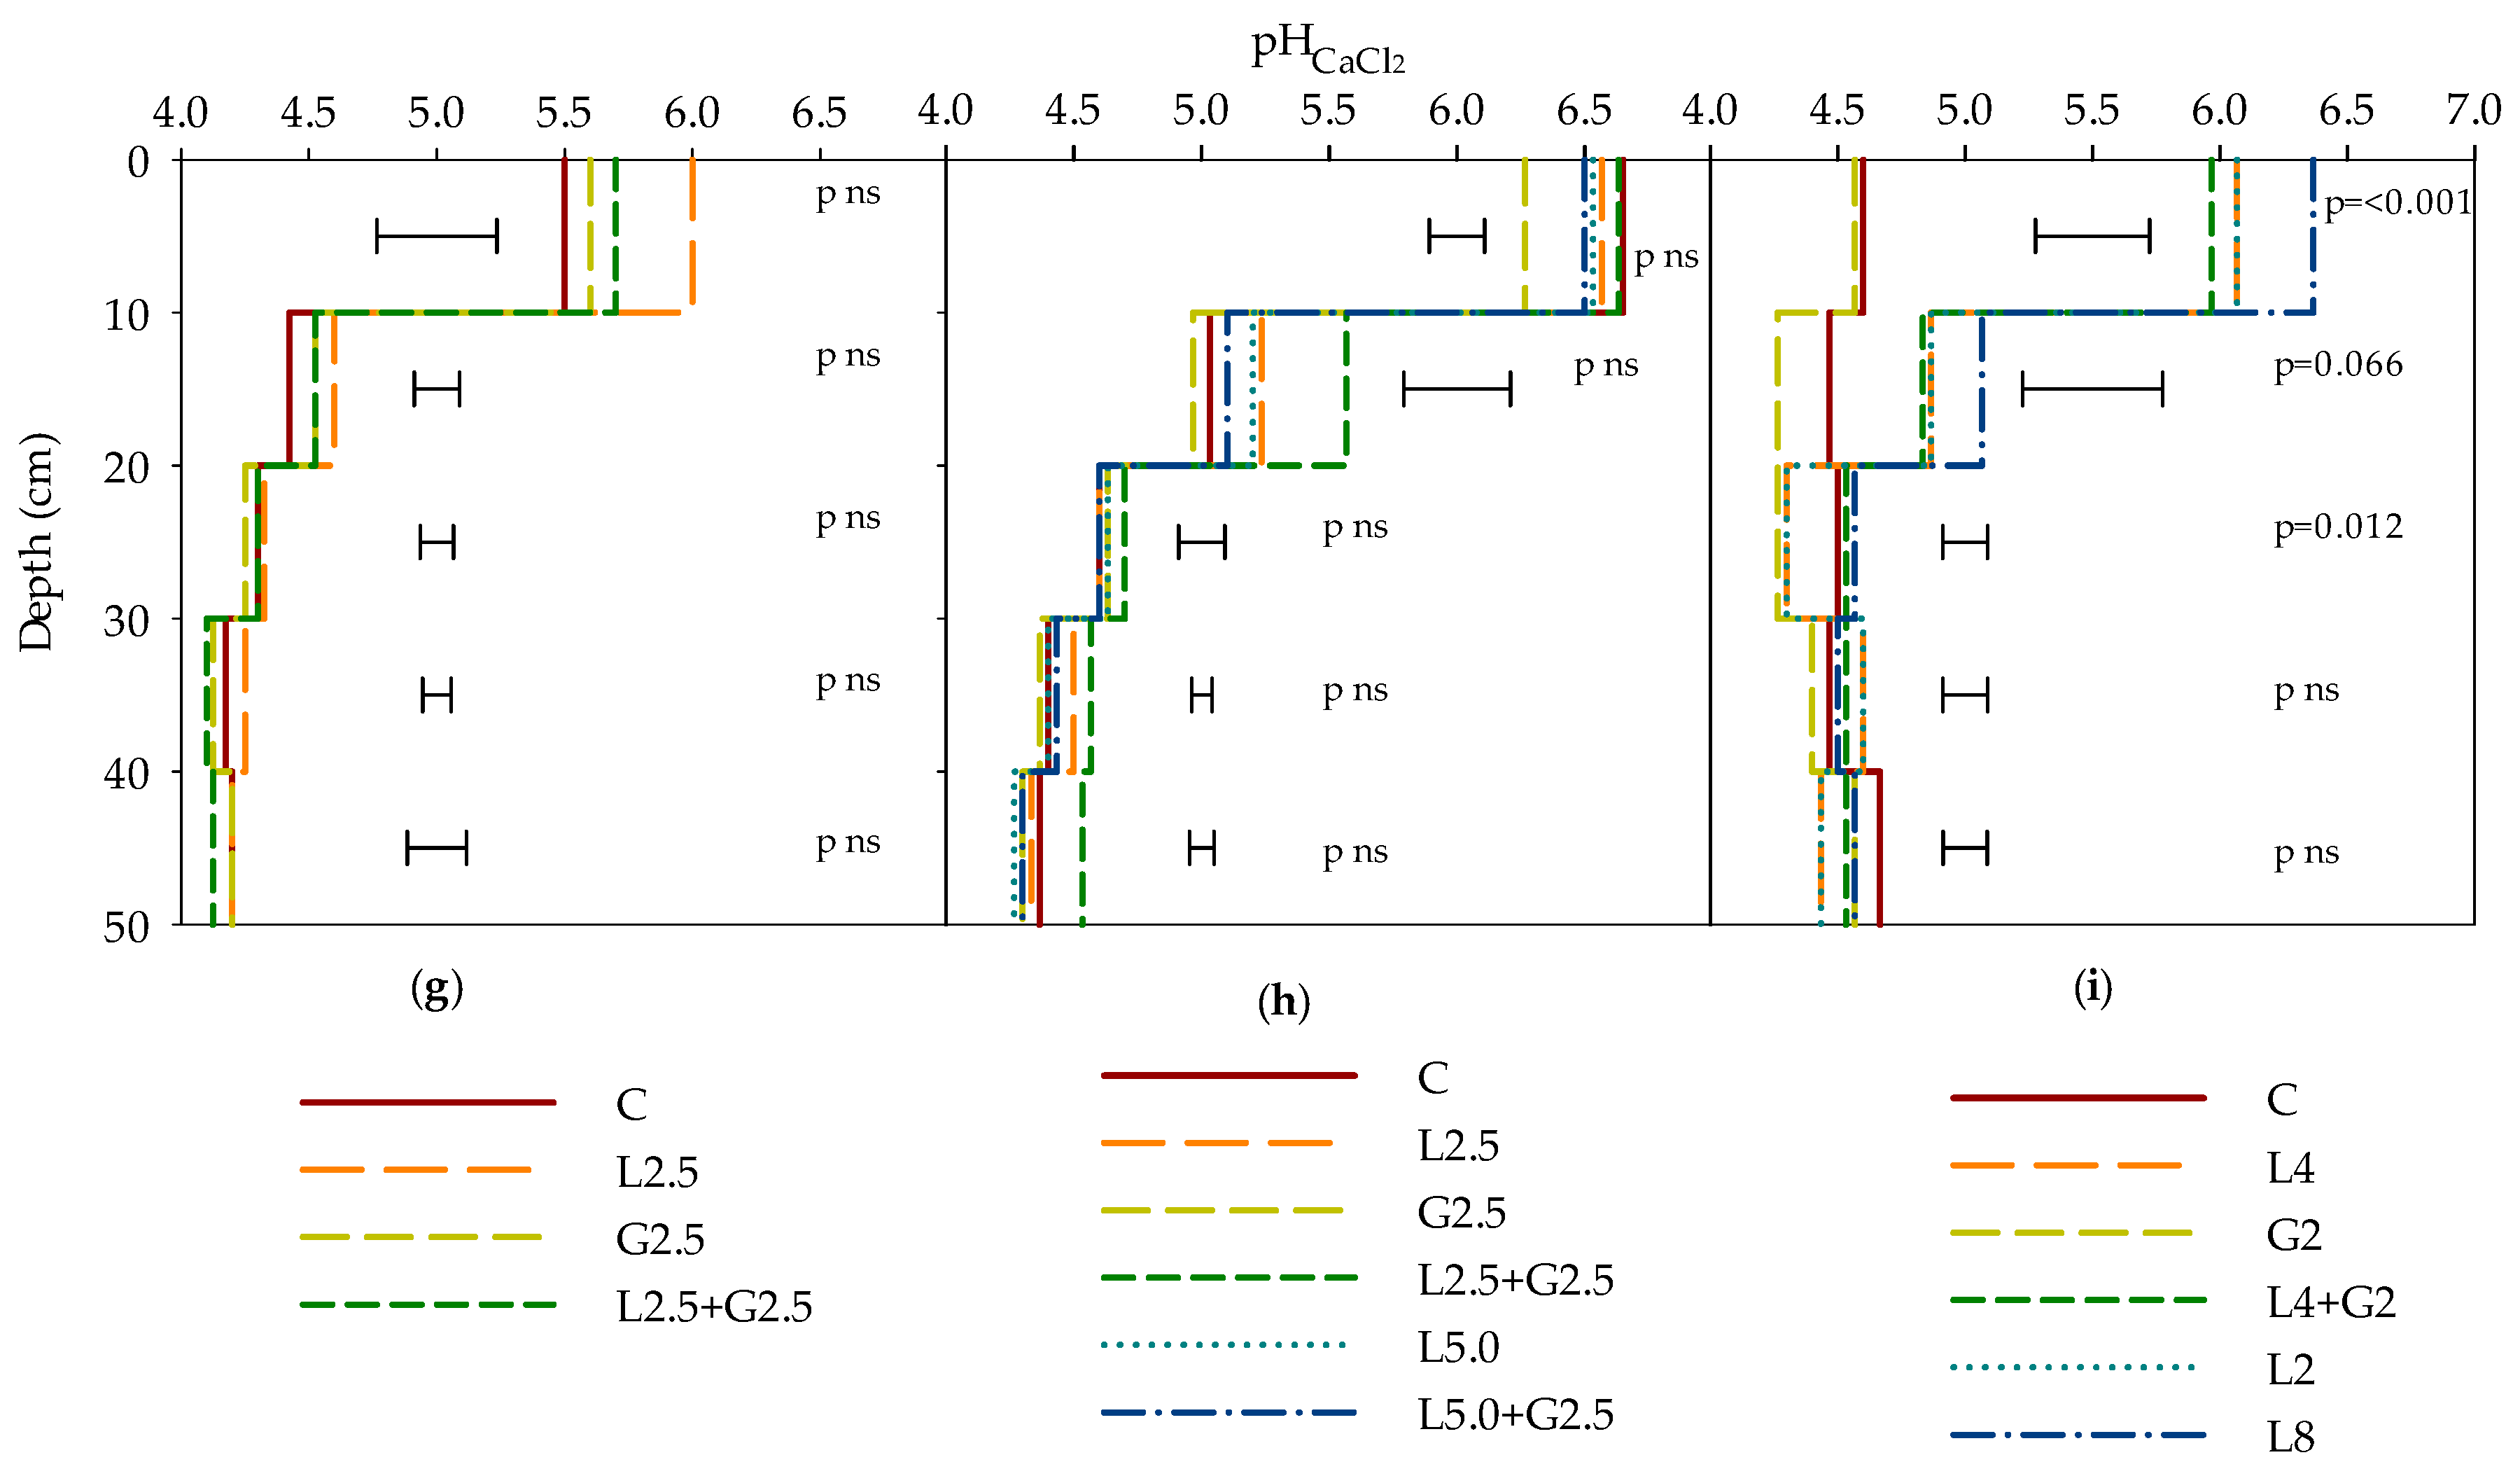
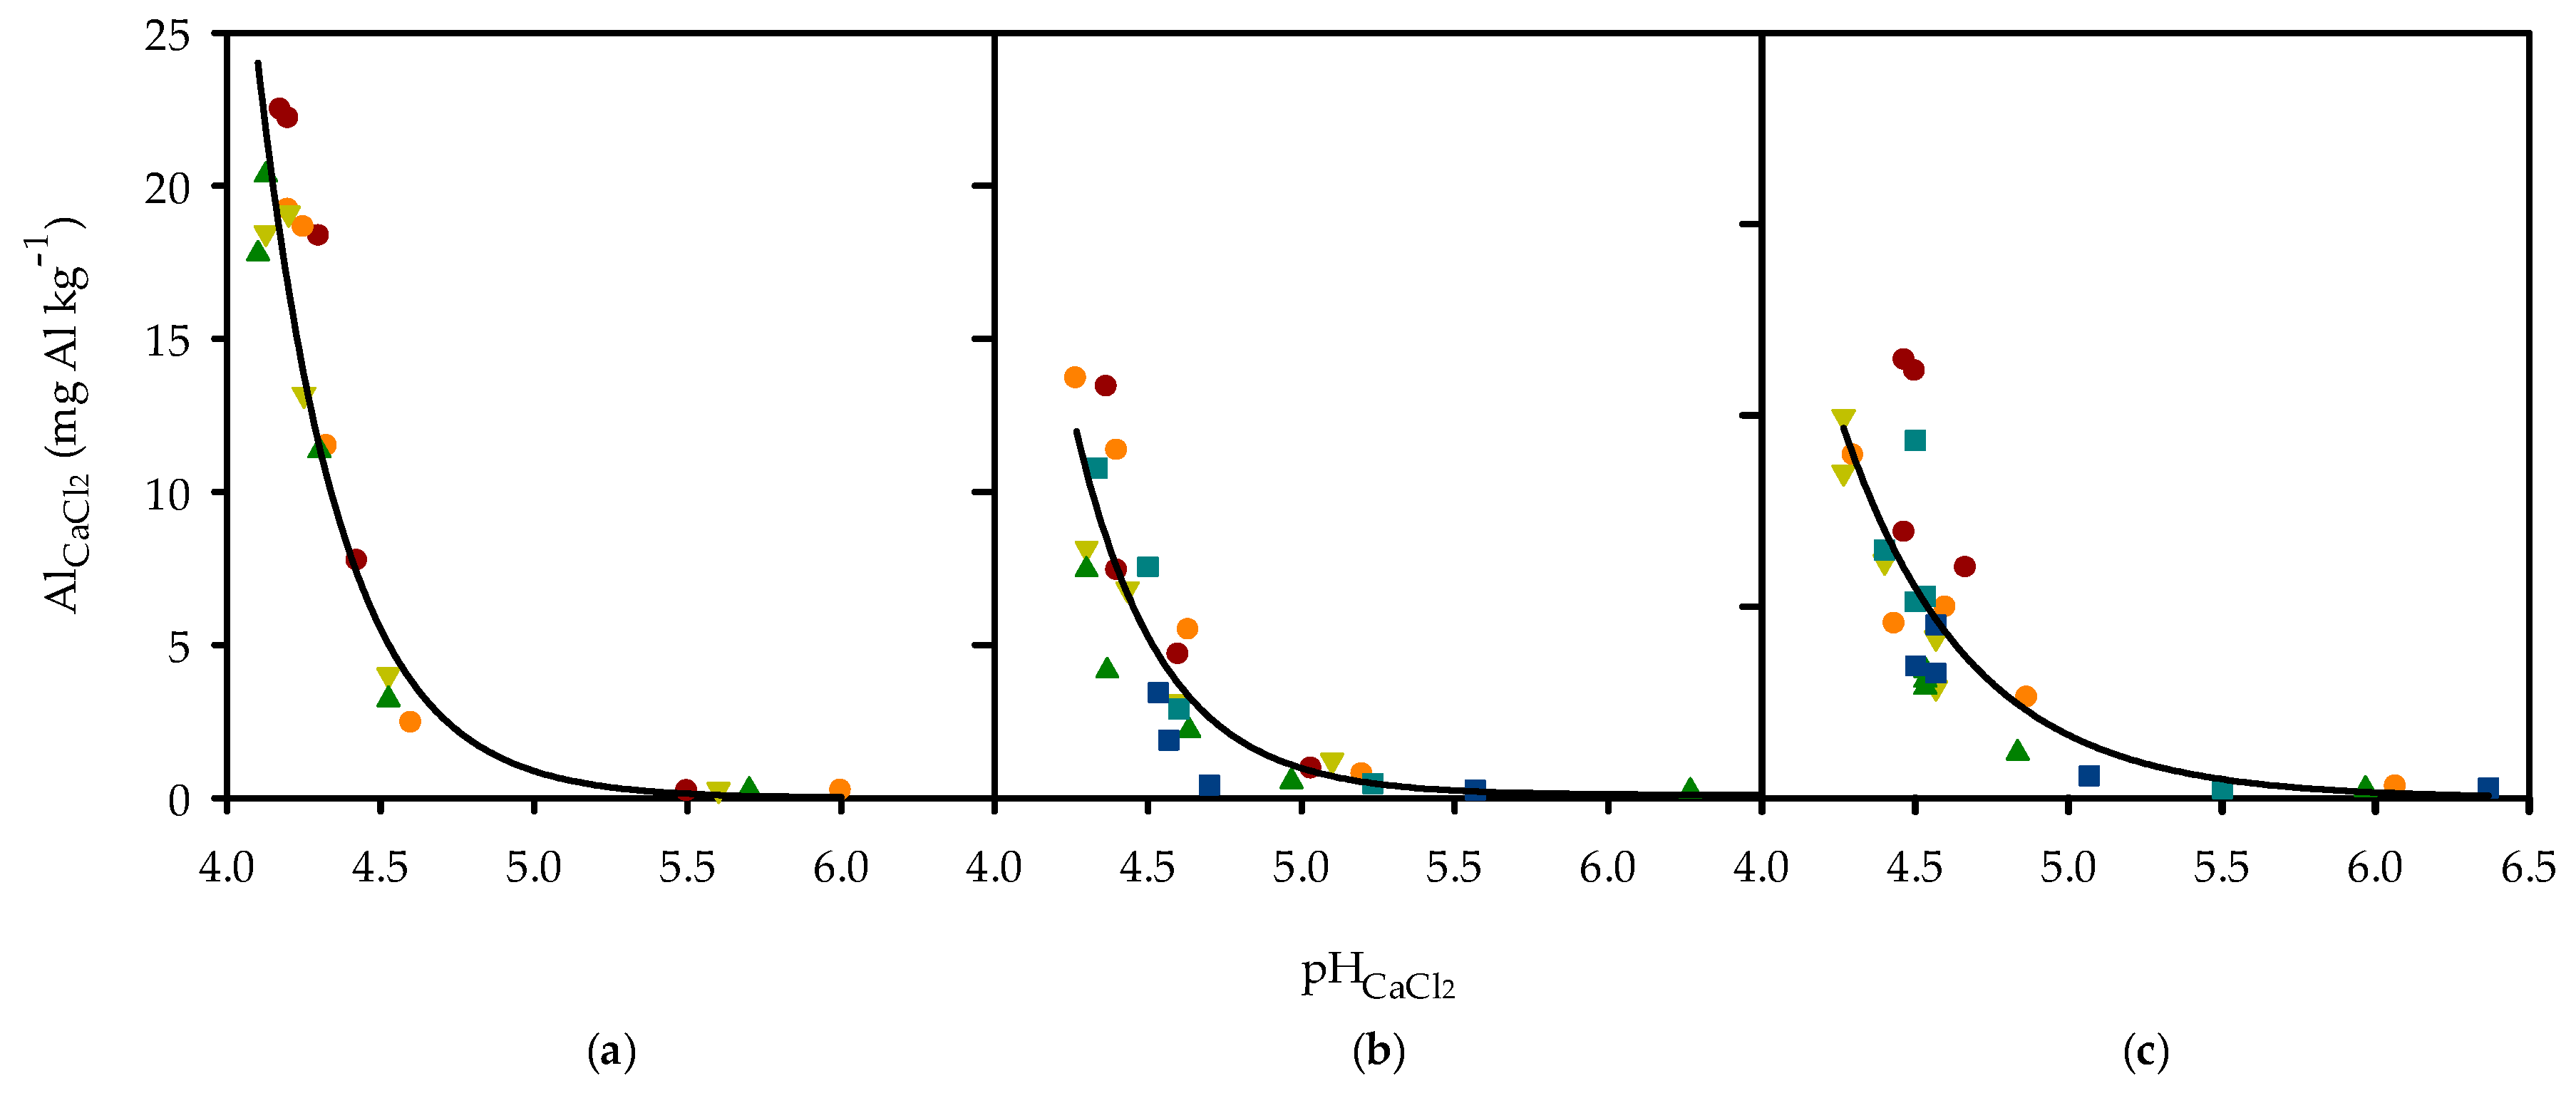
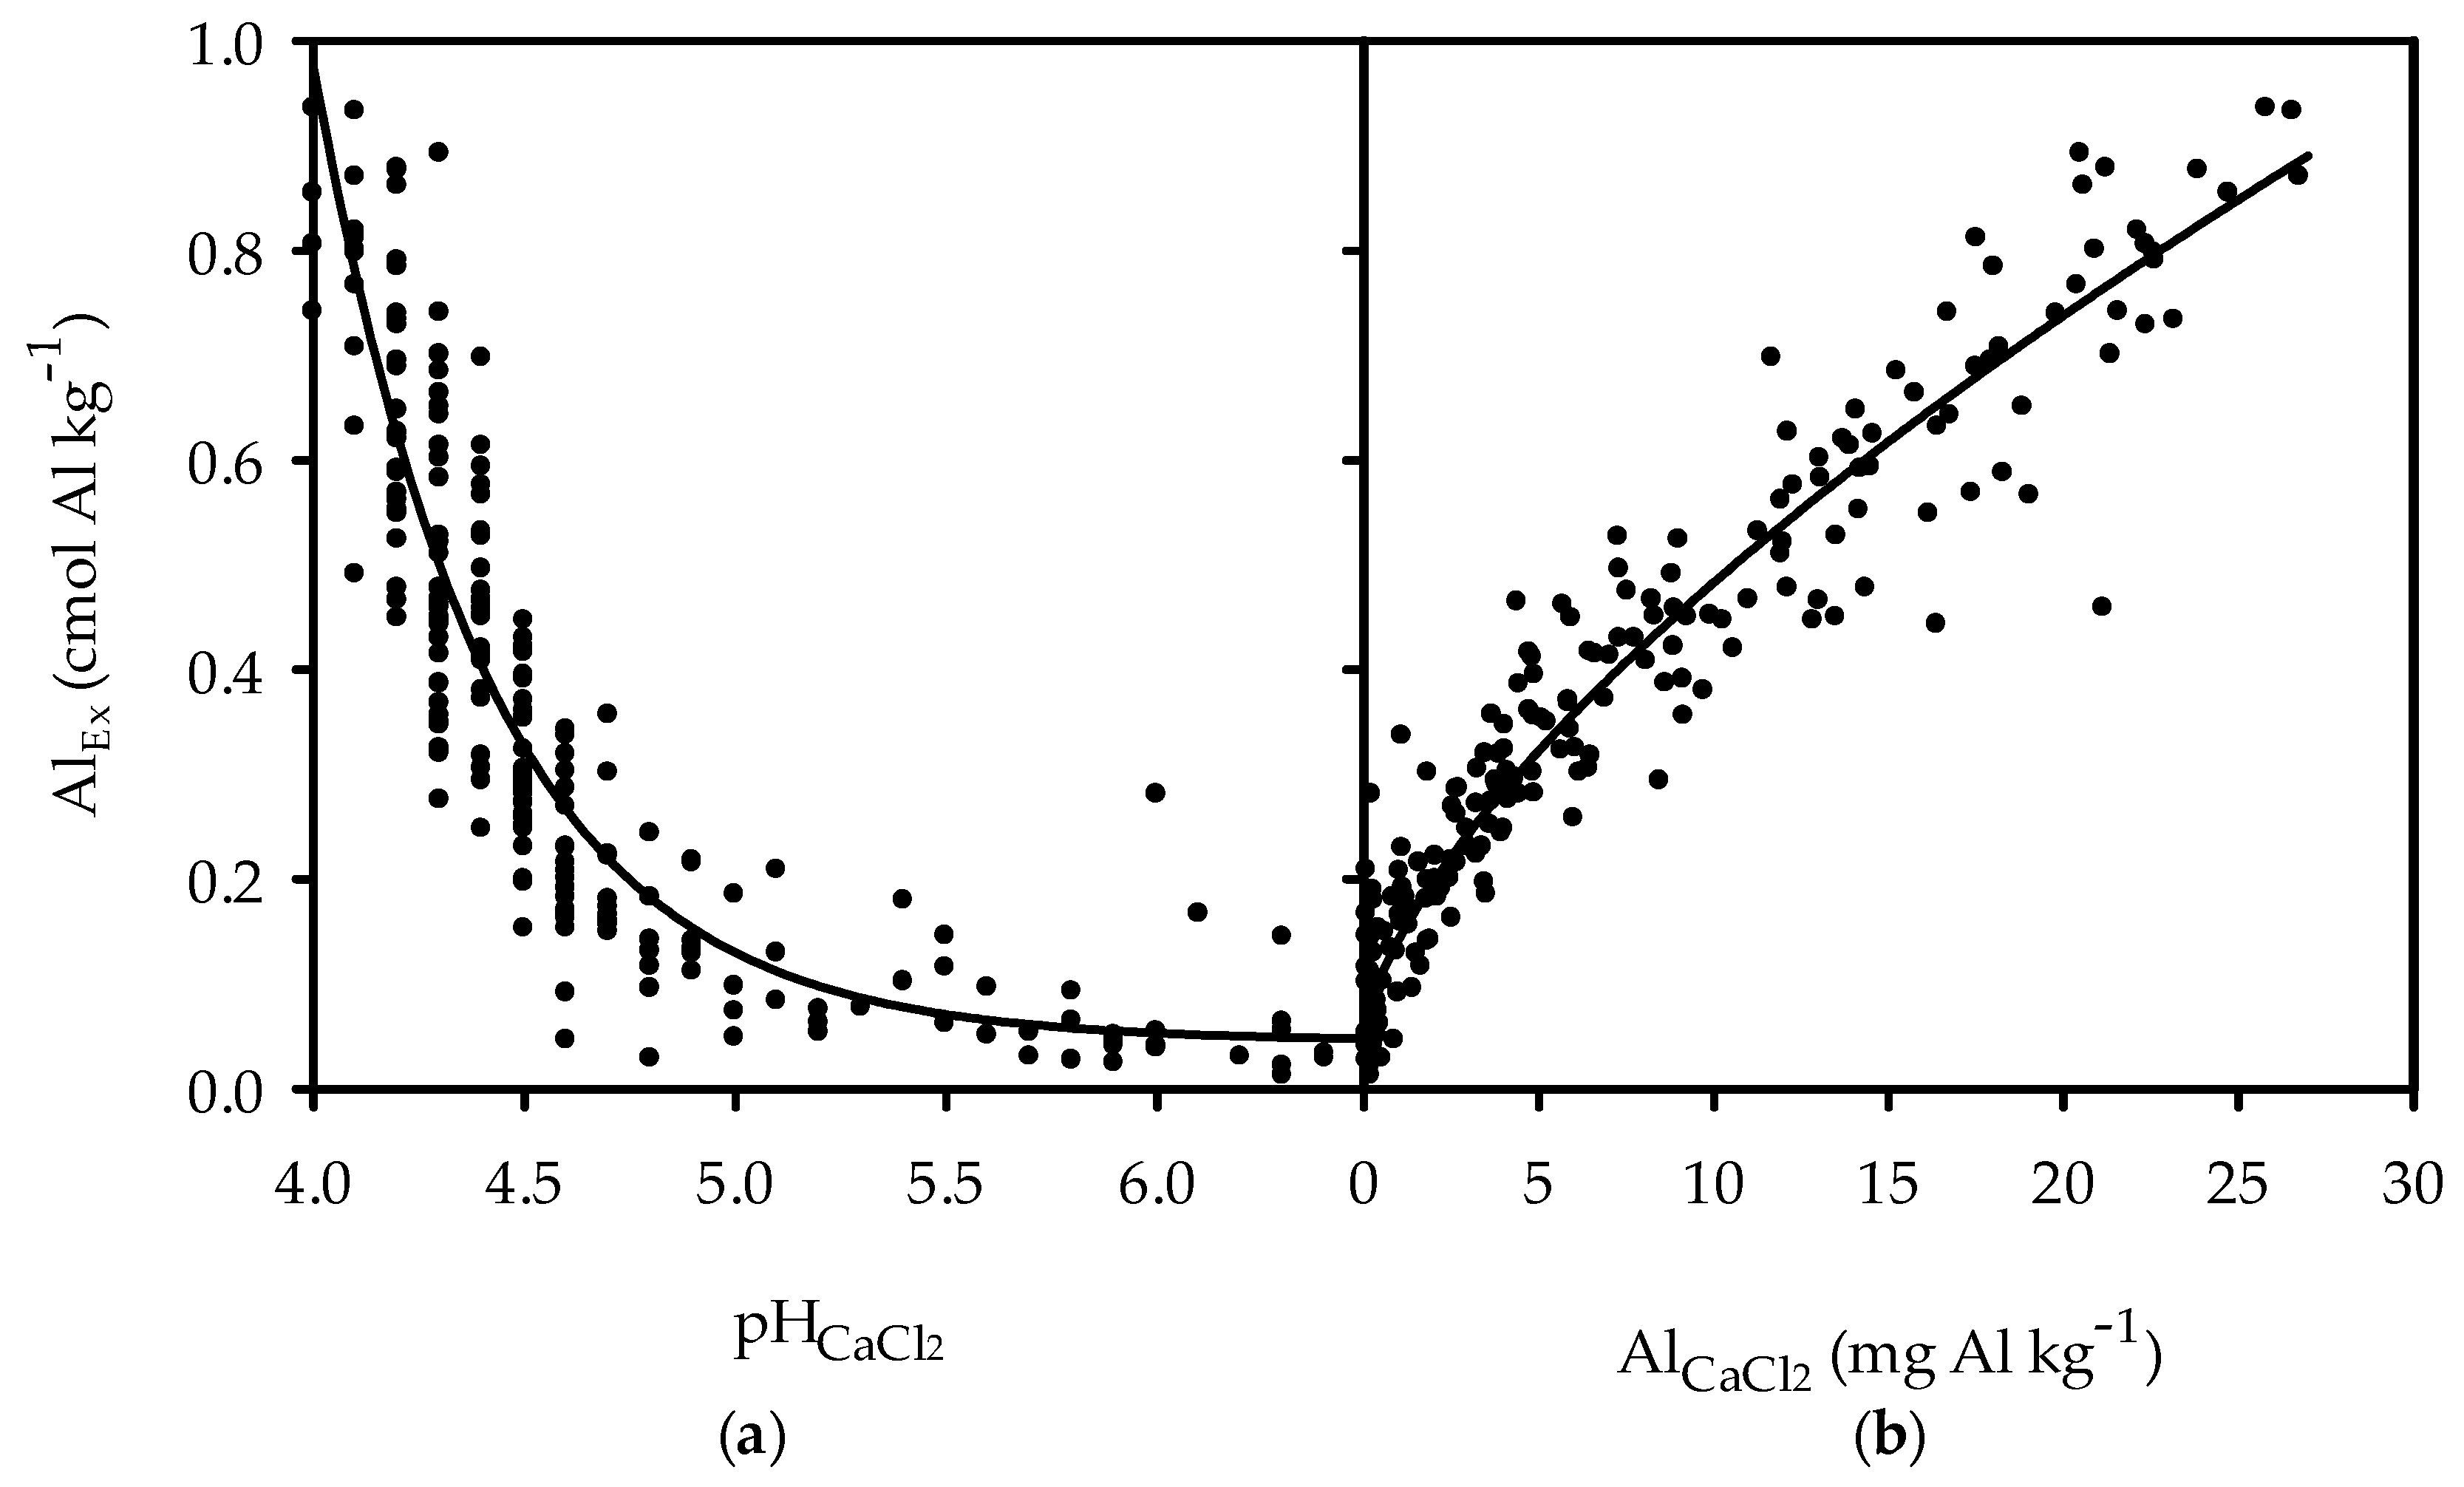
3.4. Aluminum and pH
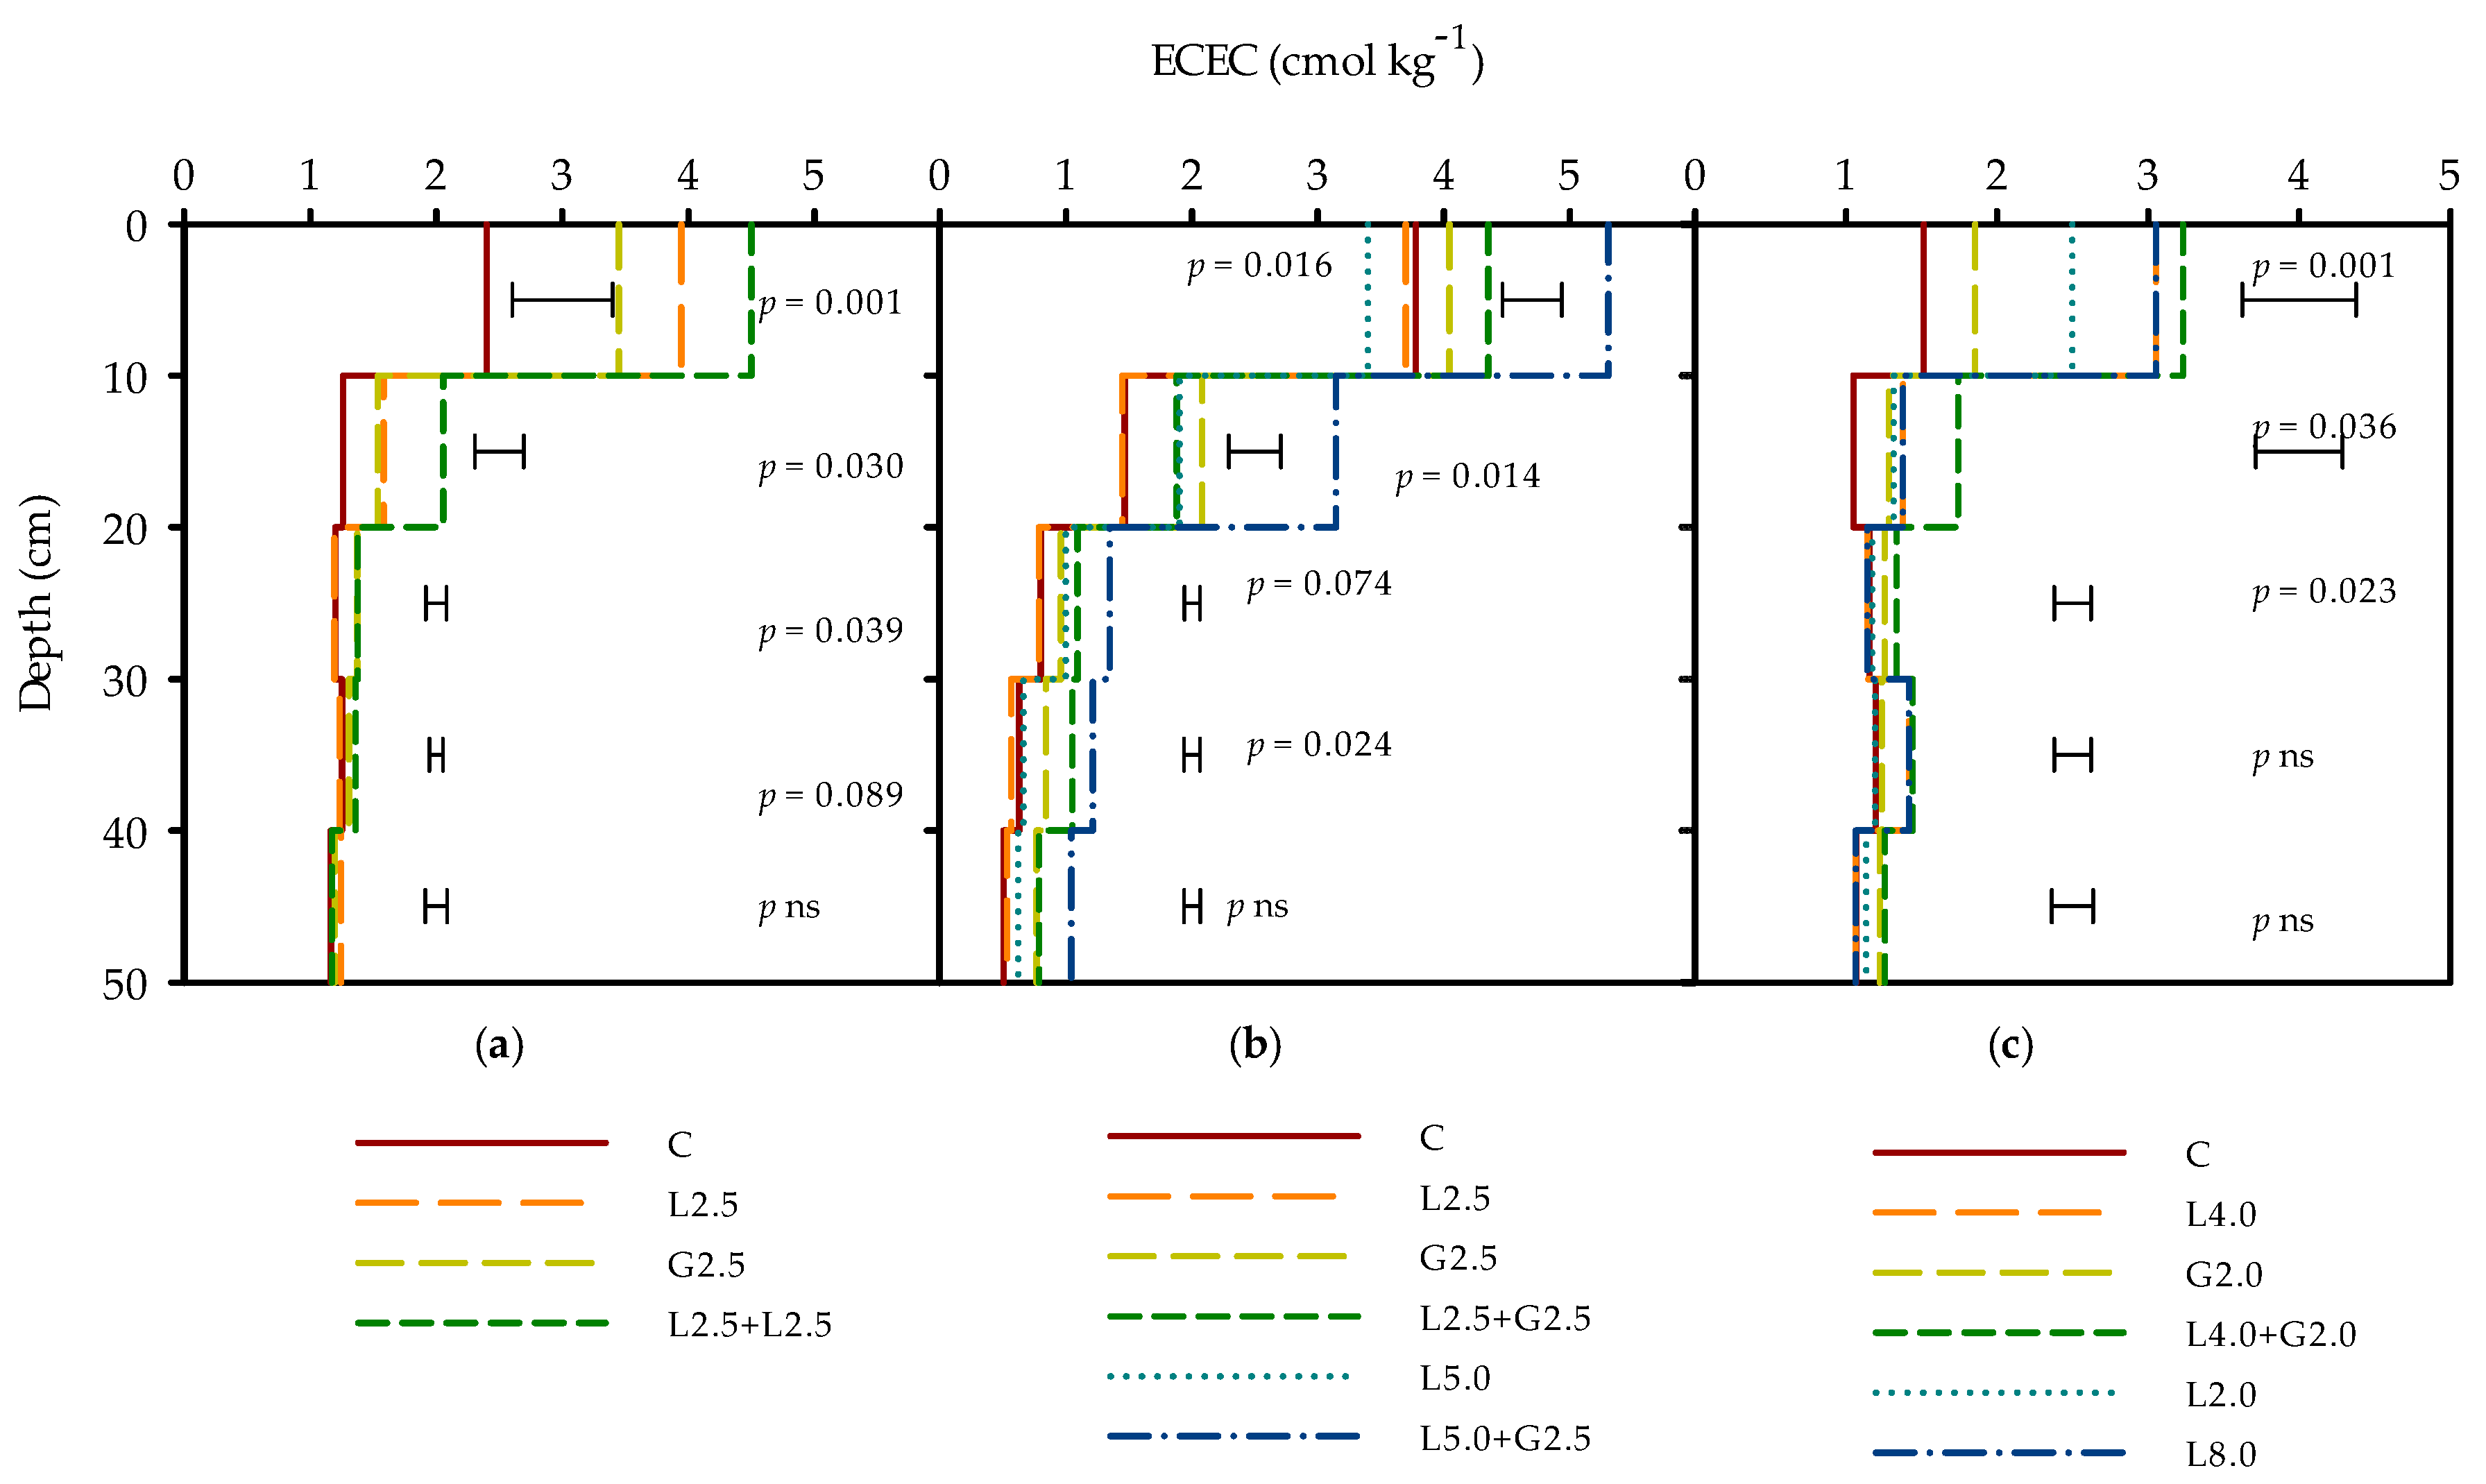
3.5. Effective Cation Exchange Capacity
4. Discussion
4.1. Sulfate
4.2. Calcium
4.3. Electrical Conductivity
4.4. Aluminum and pH
5. Conclusions
Author Contributions
Funding
Acknowledgments
Conflicts of Interest
References
- Ritchie, G.S.P. Soluble aluminium in acidic soils: Principles and practicalities. In Plant Soil Interactions at Low pH; Date, R.A., Grundon, N.J., Rayment, G.E., Probert, M.E., Eds.; Kluwer Academic Publishers: Dordrecht, The Netherlands, 1995; pp. 23–33. [Google Scholar]
- Anderson, G.C.; Bell, R.W. Wheat grain-yield response to lime application: Relationships with soil pH and aluminium in Western Australia. Crop. Pasture Sci. 2019, 70, 295–305. [Google Scholar] [CrossRef]
- Anderson, G.C.; Pathan, S.; Hall, D.J.M.; Sharma, R.; Easton, J. Short and long term effects of lime and gypsum application on acid soils in a water-limited environment 1. Grain yield response and nutrient concentration. Agronomy 2020, 10, 1213. [Google Scholar] [CrossRef]
- Lebedev, A.; Kosorukov, V.L. Gypsum solubility in water at 25 °C. Geochem. Int. 2017, 55, 205–210. [Google Scholar] [CrossRef]
- Aylward, G.H.; Findlay, T.J.V. SI Chemical Data Book, 6th ed.; John Wiley and Sons: Chichester, UK, 2008; ISBN 978-0-730-30246-9. [Google Scholar]
- McLay, C.D.A.; Ritchie, G.S.P.; Porter, W.M.; Cruse, A. Amelioration of subsurface acidity in sandy soils in low rainfall regions. 2. Changes to soil solution composition following the surface application of gypsum and lime. Aust. J. Soil Res. 1994, 32, 847–865. [Google Scholar] [CrossRef]
- Zoca, S.M.; Penn, C. An important tool with no instruction manual: A review of gypsum use in agriculture. Adv. Agron. 2017, 144, 1–44. [Google Scholar] [CrossRef]
- Sumner, M.E. Gypsum as an Ameliorant for the Subsoil Acidity Syndrome; Publication No 01-024-090; Florida Institute of Phosphate Research: Bartow, FL, USA, 1990. [Google Scholar]
- Smith, C.J.; Peop1es, M.B.; Keerthisinghe, T.R.; James, T.R.; Garden, D.L.; Tuomi, S.S. Effect of surface applications of lime, gypsum and phosphogypsum on the alleviating of surface and subsurface acidity in a soil under pasture. Aust. J. Soil Res. 1994, 32, 995–1008. [Google Scholar] [CrossRef]
- Alva, A.K.; Sumner, E.M.; Noble, A.D. Alleviation of aluminium toxicity by phospho-gypsum. Commun. Soil Sci. Plant Anal. 1988, 19, 385–403. [Google Scholar] [CrossRef]
- Curtin, D.; Syers, J.K. Mechanism of sulphate adsorption by two tropical Soils. J. Soil Sci. 1990, 41, 295–304. [Google Scholar] [CrossRef]
- Blum, S.C.; Caires, E.F.; Alleoni, L.R.F. Lime and phosphogypsum application and sulfate retention in subtropical soils under no-till system. J. Soil Sci. Plant Nutr. 2013, 13, 279–300. [Google Scholar] [CrossRef]
- Anderson, G.C. Sulfate sorption as measured by a buffering index over a range of soil properties from south Western Australia. Soil Res. 2020, 58, 651–661. [Google Scholar] [CrossRef]
- Tiecher, T.; Pias, O.H.C.; Bayer, C.; Martins, A.P.; Denardin, L.G.O.; Anghinoni, I. Crop response to gypsum application to subtropical soils under no-till in Brazil: A systematic review. Rev. Bras. Cienc. Solo. 2018, 42, e0170025. [Google Scholar] [CrossRef]
- Anderson, G.C.; Fillery, I.R.P.; Ripper, F.H.; Leach, B.J. Sulfur mineralization in a coarse-textured soil after different sulfate fertilization histories and yield responses of wheat and lupin. Aust. J. Soil Res. 2006, 44, 165–174. [Google Scholar] [CrossRef]
- Wong, M.T.F.; Wittwer, K. Positive charge discovered across Western Australian wheatbelt soils challenges key soil and nitrogen management assumptions. Aust. J. Soil Res. 2009, 47, 127–135. [Google Scholar] [CrossRef]
- Caires, E.F.; Joris, H.A.W.; Churka, S. Long-term effects of lime and gypsum additions on no-till corn and soybean yield and soil chemical properties in southern Brazil. Soil Use Manag. 2011, 27, 45–53. [Google Scholar] [CrossRef]
- Zambrosi, F.C.B.; Alleoni, L.R.F.; Caires, E.F. Nutrient concentration in soil water extracts and soybean nutrition in response to lime and gypsum applications to an acid Oxisol under no-till system. Nutr. Cycl. Agroecosyst. 2007, 79, 169–179. [Google Scholar] [CrossRef]
- Isbell, R.F.; National Committee on Soil and Terrain. The Australian Soil Classification, 2nd ed.; CSIRO Publishing: Collingwood, VIC, Australia, 2016. [Google Scholar]
- Rayment, G.E.; Lyons, D.J. Soil Chemical Methods-Australasia; Aust. Soil and Land Survey Handbooks Series; CSIRO Publishing: Melbourne, Australia, 2010; ISBN 9780643101364. [Google Scholar]
- Blair, G.J.; Chinoim, N.; Lefroy, R.D.B.; Anderson, G.C.; Crocker, G.J. A soil sulfur test for pasture and crops. Aust. J. Soil Res. 1991, 29, 619–629. [Google Scholar] [CrossRef]
- VSN International Genstat for Windows, 18th ed.; VSN International: Hemel Hempstead, UK, 2015; Available online: genstat.co.uk (accessed on 1 December 2020).
- SYSTAT Sigmaplot 12.5; SYSTAT: San Jose, CA, USA, 2013; Available online: systatsoftware.com (accessed on 16 December 2020).
- Anderson, G.C.; Pathan, S.; Hall, D.J.M.; Sharma, R.; Easton, J. Short and long term effects of lime and gypsum application on acid soils in a water-limited environment 3. Soil solution properties. 2020; unpublished; manuscript in preparation. [Google Scholar]
- Johnson, D.W.; Mitchell, M.J. Responses of forest ecosystems to changing sulfur inputs. In Sulfur in the Environment; Maynard, D.G., Ed.; Marcel Dekker: New York, NY, USA, 1998; pp. 219–262. [Google Scholar]
- Khanna, P.K.; Prenzel, J.; Meiwes, K.J.; Ulrich, B.; Matzner, E. Dynamics of sulfate retention by acid forest soils in an acidic deposition environment. Soil Sci. Soc. Am. J. 1987, 51, 446–452. [Google Scholar] [CrossRef]
- Bolan, N.S.; Adriano, D.C.; Curtin, D. Soil acidification and liming interactions with nutrient and heavy metal transformation and bioavailability. Adv. Agron. 2003, 78, 215–272. [Google Scholar]
- Aitken, R.L.; Dickson, T.; Moody, P.W. Field amelioration of acidic soils in south-east Queensland. II. Effect of amendments on the yield and leaf nutrient composition of maize. Aust. J. Agric. Res. 1998, 49, 639–647. [Google Scholar] [CrossRef]
- Dolling, P.J.; Ritchie, G.S.P. Estimates of soil solution ionic strength and the determination of pH in West Australian soils. Aust. J. Soil Res. 1985, 23, 309–314. [Google Scholar] [CrossRef]
- McLay, C.D.A.; Ritchie, G.S.P.; Porter, W.M.; Cruse, A. Amelioration of subsurface acidity in sandy soils in low rainfall regions. 1. Responses of wheat and lupins to surface-applied gypsum and lime. Aust. J. Soil Res. 1994, 32, 835–846. [Google Scholar] [CrossRef]
- Upjohn, B.; Fenton, G.; Conyers, M. Soil Acidity and Liming. Agfact AC. 19, 3rd ed.; NSW Department of Primary Industries: Orange, NSW, Australia, 2005. [Google Scholar]
- Li, G.D.; Conyers, M.K.; Helyar, K.R.; Lisle, C.J.; Poile, G.J.; Cullis, B.R. Long-term surface application of lime ameliorates subsurface soil acidity in the mixed farming zone of south-eastern Australia. Geoderma 2019, 338, 236–246. [Google Scholar] [CrossRef]
- Stumm, W.; Morgan, J.J. Aquatic Chemistry: Chemical Equilibria and Rates in Natural Waters; John Wiley and Sons: New York, NY, USA, 1996; ISBN 978-0-471-51185-4. [Google Scholar]
- Nye, P.H.; Ameloko, A.Y. Predicting the rate of dissolution of lime in soils. J. Soil Sci. 1987, 38, 641–644. [Google Scholar] [CrossRef]
- Whitten, M.G.; Wong, M.T.F.; Rate, A.W. Amelioration of subsurface acidity in the south-west of Western Australia: Downward movement and mass balance of surface-incorporated lime after 2–15 years. Aust. J. Soil Res. 2000, 38, 711–728. [Google Scholar] [CrossRef]
- Azam, G.; Gazey, C. Slow movement of alkali from surface-applied lime warrants the introduction of strategic tillage for rapid amelioration of subsurface acidity in south-western Australia. Soil Res. 2020. [Google Scholar] [CrossRef]
- Menzies, N.W.; Bell, L.C.; Edwards, D.G. Exchange and solution phase chemistry of acid, highly weathered soils. I. Characteristics of soils and the effects of lime and gypsum amendments. Aust. J. Soil Res. 1994, 32, 251–267. [Google Scholar] [CrossRef]
- Scanlan, C.A.; Brennan, R.F.; D’Antuono, M.F.; Sarre, G.A. The interaction between soil pH and phosphorus for wheat yield and the impact of lime-induced changes to soil aluminium and potassium. Soil Res. 2017, 55, 341–353. [Google Scholar] [CrossRef]
- De Vargas, J.P.R.; Santos, D.R.; Bastos, M.C.; Schaefer, G.; Parisi, P.B. Application forms and types of soil acidity corrective: Changes in depth chemical attributes in long term period experiment. Soil Tillage Res. 2019, 185, 47–60. [Google Scholar] [CrossRef]
- Costa, C.H.M.; Carmeis Filho, A.C.A.; Crusciol, C.A.C.; Soratto, R.P.; Guimarães, T.M. Intensive annual crop production and root development in a tropical acid soil under long-term no-till and soil-amendment management. Crop Pasture Sci. 2018, 69, 488–505. [Google Scholar] [CrossRef]
- Caires, E.F.; Alleoni, L.R.F.; Cambri, M.A.; Barth, G. Surface application of lime for crop grain production under a no-till system. Agron. J. 2005, 97, 791–798. [Google Scholar] [CrossRef]
- Costa, C.H.M.; Crusciol, C.A.C. Long-term effects of lime and phosphogypsum application on tropical no-till soybean-oat-sorghum rotation and soil chemical properties. Eur. J. Agron. 2016, 74, 119–132. [Google Scholar] [CrossRef]
- Crusciol, C.A.C.; Artigiani, A.C.C.A.; Arf, O.; Carmeis Filho, A.C.A.; Soratto, R.P.; Nascente, A.S.; Alvarez, R.C.F. Soil fertility, plant nutrition, and grain yield of upland rice affected by surface application of lime, silicate, and phosphogypsum in a tropical no-till system. Catena 2016, 137, 87–99. [Google Scholar] [CrossRef]
- Fontoura, S.M.V.; de Castro Pias, O.H.; Tiecher, T.; Cherubin, M.R.; de Moraes, R.P.; Bayer, C. Effect of gypsum rates and lime with different reactivity on soil acidity and crop grain yields in a subtropical Oxisol under no-tillage. Soil Tillage Res. 2019, 193, 27–41. [Google Scholar] [CrossRef]


| ST | MT | LT | |||||
|---|---|---|---|---|---|---|---|
| Depth (cm) | G2.5 | L2.5 + G2.5 | G2.5 | L2.5 + G2.5 | L5.0 + G2.5 | G2.0 | L4 + G2 |
| 0–10 | NA | NA | 10 | 13 | 29 | 30 | 6 |
| 10–20 | 34 | 41 | 9 | 10 | 23 | 9 | 6 |
| 20–30 | 17 | 18 | 4 | 6 | 11 | 7 | 8 |
| 30–40 | 7 | 9 | 2 | 7 | 12 | 6 | 7 |
| 40–50 | 1 | 2 | 3 | 8 | 8 | 3 | 5 |
| Total | NA | NA | 28 | 31 | 54 | 26 | 27 |
| ST | MT | LT | |||||||||||
|---|---|---|---|---|---|---|---|---|---|---|---|---|---|
| Depth (cm) | L2.5 | G2.5 | L2.5 + G2.5 | L2.5 | L5 | G2.5 | L2.5 + G2.5 | L5.0 + G2.5 | L2 | L4 | L8 | G2.0 | L4 + G2 |
| 0–10 | 19 | 43 | 19 | −1 | −2 | 15 | 6 | 9 | 20 | 15 | 9 | 20 | 15 |
| 10–10 | 7 | 20 | 10 | 0 | 3 | 33 | 5 | 11 | 6 | 5 | 5 | 14 | 9 |
| 20–10 | 3 | 15 | 5 | 0 | 1 | 9 | 4 | 4 | 1 | 1 | 1 | 6 | 4 |
| 30–10 | 2 | 8 | 3 | −1 | 0 | 12 | 5 | 4 | 0 | 1 | 1 | 3 | 2 |
| 40–10 | 1 | 6 | 1 | 1 | 1 | 13 | 4 | 4 | 0 | 0 | 0 | 4 | 1 |
| Total | 31 | 92 | 37 | −2 | 3 | 82 | 23 | 31 | 28 | 22 | 15 | 48 | 30 |
Publisher’s Note: MDPI stays neutral with regard to jurisdictional claims in published maps and institutional affiliations. |
© 2020 by the authors. Licensee MDPI, Basel, Switzerland. This article is an open access article distributed under the terms and conditions of the Creative Commons Attribution (CC BY) license (http://creativecommons.org/licenses/by/4.0/).
Share and Cite
Anderson, G.C.; Pathan, S.; Easton, J.; Hall, D.J.M.; Sharma, R. Short- and Long-Term Effects of Lime and Gypsum Applications on Acid Soils in a Water-Limited Environment: 2. Soil Chemical Properties. Agronomy 2020, 10, 1987. https://doi.org/10.3390/agronomy10121987
Anderson GC, Pathan S, Easton J, Hall DJM, Sharma R. Short- and Long-Term Effects of Lime and Gypsum Applications on Acid Soils in a Water-Limited Environment: 2. Soil Chemical Properties. Agronomy. 2020; 10(12):1987. https://doi.org/10.3390/agronomy10121987
Chicago/Turabian StyleAnderson, Geoffrey C., Shahab Pathan, James Easton, David J. M. Hall, and Rajesh Sharma. 2020. "Short- and Long-Term Effects of Lime and Gypsum Applications on Acid Soils in a Water-Limited Environment: 2. Soil Chemical Properties" Agronomy 10, no. 12: 1987. https://doi.org/10.3390/agronomy10121987
APA StyleAnderson, G. C., Pathan, S., Easton, J., Hall, D. J. M., & Sharma, R. (2020). Short- and Long-Term Effects of Lime and Gypsum Applications on Acid Soils in a Water-Limited Environment: 2. Soil Chemical Properties. Agronomy, 10(12), 1987. https://doi.org/10.3390/agronomy10121987