Article

Soil Management Systems to Overcome Multiple Constraints for Dryland Crops on Deep Sands in a Water Limited Environment on the South Coast of Western Australia

1
Department of Primary Industries and Regional Development, PMB 50, Melijinup Rd, Esperance 6450, Australia
2
Department of Primary Industries and Regional Development, 20 Gregory Street, Geraldton 6530, Australia
3
Agriculture Discipline, College of Science Health Engineering and Education, Murdoch University, South St, Murdoch 6150, Australia
*
Author to whom correspondence should be addressed.
Agronomy 2020, 10(12), 1881; https://doi.org/10.3390/agronomy10121881
Submission received: 20 October 2020 / Revised: 17 November 2020 / Accepted: 23 November 2020 / Published: 27 November 2020

Abstract

:
Deep sands on the south coast sandplain of Western Australia (WA) have multiple soil constraints including water repellence, high soil strength, low nutrient levels and subsoil acidity. The aim of the study was to test contrasting methods of managing water repellence and to assess their impacts on one or more soil constraints to crop production. These methods included seeding tyne design (knife point, winged points, paired row), soil wetting agent addition, strategic inversion tillage (rotary spading, mouldboard ploughing to 0.35 m) and clay-rich subsoil addition (170 t ha−1 with incorporation by spading to 0.20 or 0.35 m). Limesand (2 t ha−1) was applied as a split plot treatment prior to tillage. Cumulative crop yields were increased by 2.1–2.6 t ha−1 over five years by the strategic deep tillage and clay application treatments compared to the control. Water repellence was reduced by the inversion ploughing and subsoil clay addition treatments only. The effect of water repellence on crop establishment was expressed only in low rainfall years (Decile < 4) and mitigated by the paired row, wetting agent, spader and clay-amended treatments. In all years, plant numbers were adequate to achieve yield potential regardless of treatment. Soil K and plant tissue K and B were increased where clay had been applied. Inversion tillage reduced soil pH, organic carbon (OC) and macro nutrients in the 0–0.1 m layer although in most years there was no significant decline in plant tissue macro nutrient levels. Soil strength was reduced as a result of the inversion tillage to a depth of 0.35 m. However, the alleviation of soil strength and the crop yield responses diminished with time due to re-compaction. No crop response to the applied lime was found over five years at this site since the soil pHCaCl2 exceeded 4.7 within the root zone. In terms of soil constraints, we conclude that compaction was the dominant constraint at this site followed by water repellence and K deficiency.

1. Introduction

Approximately 900,000 km2 or 5% of soils used for crop production globally have a deep sand profile [1]. The proportion of cropping soils with sand subsoil is greatest in Africa and Australia-Oceania. A characteristic of deep sands is that they present multiple constraints to crop production, mostly related to their limited capacity to store and supply water and nutrients to roots. The Deep sands (>0.3 m) cover approximately 40% (7 Million ha) of the Western Australia (WA) wheatbelt and are predominately used for dryland crop and volunteer pasture production. These soils are subject to a number of constraints to crop production [2] which relate to their parent material, texture and soil forming processes. The south coast sandplain soils are derived from Precambrian granites which have undergone marine incursions during the Eocene and the deposition of aeolian sand sheets during the Quaternary epoch [3]. The multiple constraints on these sands include acidity (pHCaCl2 < 5.5), low cation exchange (<4 cmol (+) kg−1), low pH buffering capacity and inherently low levels of macro and micro nutrients [4]. Given their aeolian genesis, the sandplain soils contain a sufficiently wide particle size distribution within the sand fractions to allow dense packing [5,6]. The ability to pack densely is exacerbated through natural and induced compactive forces including wetting and drying cycles [7] and trafficking by machinery [8,9]. Water repellence is common in sandplain soils of WA due to the topsoils having a low proportion of clay (<5%) combined with naturally occurring organic waxes and polymers [10]. Consequently, the sandplain soils on the south coast of WA are prone to multiple soil constraints for dryland crop production including compaction, water repellence, nutrient deficiencies and subsoil acidity [2,11,12].
Where there are multiple limitations, the process of soil amelioration often seeks to sequentially overcome constraints starting with the most yield-limiting one. Pale deep sands ([13], Albic Arenosols) and sandy earths ([13], Ferralic Cambisols) in WA are considered to be highly responsive soils to deep tillage [14]. Mean increases in cereal crop yields of 15–89% have been achieved as a result of deep ripping (subsoiling) sandplain soils in WA [15,16,17] which is consistent with the magnitude of cereal crop responses to deep ripping measured on similar soil types in overseas studies [18,19]. Similarly average yield increases, in the order of 16–50%, have been found where water repellence has been alleviated through the addition of subsoil clays [17], furrow sowing [20], sowing back onto or near previous seeding lines [10,21], dilution and burial of water repellent topsoils through strategic inversion tillage [22,23,24] and the addition of soil wetting agents [20,25].
However, where there are multiple limiting factors of a similar yield-limiting magnitude the gains from ameliorating one factor will be small relative to the gains where multiple constraints are ameliorated together [26]. For instance, ameliorating water repellence alone through the addition of clay, while increasing grain yields by more than 30% still resulted in crops yielding substantially below their calculated water-limited yield potential [27]. Strategic inversion and deep mixing of water repellent topsoils through mouldboard or one-way disc ploughing and rotary spading have been shown to be highly effective in reducing water repellence in Western and South Australian soils [23,28]. This process, which is termed strategic tillage [24,29,30,31], is a single or occasional use of tillage within what is otherwise a conservation agriculture farming system encompassing minimum tillage seeding and stubble retention. Strategic tillage potentially removes multiple soil, pest and weed limitations in a single operation with improvements in crop yields persisting for several years [23,30,32]. Strategic tillage can take the form of shallow or deep cultivation [23,32,33] depending on the soil type and nature of the constraints being addressed. Strategic deep soil mixing or inversion will de-compact the soil and incorporate soil amendments such as lime to working depth of the implement [24]. The aim of this paper is to assess combinations of treatments including claying, liming and strategic deep tillage that alleviate multiple and single soil constraints including water repellence, subsoil compaction, acidity, and nutrient deficiencies on a common sandplain soil on the south coast of WA and to evaluate their effects on crop productivity over 5 successive cropping seasons.

2. Materials and Methods

2.1. Experimental Sites

A field experiment was established at the Department of Primary Industries and Regional Development Esperance Downs Research Station (S33.608°, E121.785°) in June 2012 on a pale, deep non-gravelly sand overlying a sodic kaolin-dominant horizon at a depth of 0.8 m. The climate is defined by temperate wet winters (June–August) and dry hot summers (December–February). Mean monthly temperatures range from 10–22 °C with an average annual rainfall of 492 mm of which 73% falls from April through to October. The site had been in volunteer pasture for the previous 15 years and had previously been deemed unsuitable for agronomic research due to the severity of the soil constraints. The soil is classified as an Albic Arenosol [13], and yellow mesonatric Sodosol [34] within the World Reference Base and Australian classification system, respectively. Soil chemical and physical properties (Table 1) show that the soil limitations to crop production include root limiting soil strength (cone index (CI) > 1500 kPa), severe water repellence (molarity of ethanol droplet test (MED) > 3) and low levels of extractable potassium (KCol < 40 mg kg−1), organic carbon (OC) and cation exchange capacity (CEC). Soil pH was marginal for acidity limitation (pHCaCl2 ≥ 4.8) through the 0.1–0.4 m depth (Table 1).
Eighteen treatments were imposed at the experimental site and replicated four times to give 72 plots. The experiment had nine main treatments and two lime sub treatments in a split plot design with four randomised blocks (Table 2).
The plots were 4.5 m wide and 20 m long. A sub-treatment of lime sand with a neutralising value of 70% was surface spread at a rate of 2 t ha−1. The lime was spread prior to the tillage and clay treatments as an 18 m wide strip splitting all 36 main treatment plots within the experiment. The lime treatment was not randomised within the blocks or treatments. Subsoil clay (Table 1) excavated from a nearby farm was applied at a rate of 170 t ha−1 in two of the treatments. The rate applied was consistent with increasing the clay content of the 0.1 m topsoil layer to 5% which is required to ameliorate water repellence in soils with less than 2% organic carbon [17,35,36]. The applied subsoil comprised 70% clay (<2 µm) fraction and was predominately kaolinite with traces of illite and glauconite. Evenly spaced bucket loads of subsoil were deposited and then spread uniformly across the plot with the skid loader bucket used as a grader blade. The weight of subsoil applied was measured by the load (approximately 300 kg load−1) and checked periodically using a weigh bridge. The spading and mouldboard ploughing treatments were applied with a Farmax Rapide® Rotary Spader (Denekamp, The Netherlands) and a John Deere 995® (Moline, IL, USA) on-land reversible mouldboard square plough, respectively. The Spader was used to incorporate the clay treatments to depths of 0.2 or 0.35 m. The working depth for the mouldboard plough was 0.35 m. The lime, clay and tillage treatments were applied once only for the duration of the experiment whereas the wetting agent and seeding boot treatments were applied annually at seeding.
The experiment was sown with a 1.5 m wide cone plot seeder requiring three passes per plot. Four types of seeding points were fitted to the cone seeder tynes at seeding. The seeding points ranged from least to most soil disturbance in the order: Disc seeder (Great Plains, Salina, KA, USA, treatment 5) < Knife points (Primary Sales, Perth, Australia, treatments 1, 2, 6–9) < Winged point super seeder (Primary Sales, Perth, Australia, treatment 4) < Paired row (Stiletto®, Geraldton, Australia, treatment 3). Precision Wetter® (Chemsol Australia Pty. Ltd., Perth, Western Australia), a non-ionic soil wetting agent was applied by boomspray at seeding at a rate of 8 litres ha−1 in 100 L of water ha−1 as a blanket application. Nitrogen, P and K fertilizers were drilled at seeding while S was broadcast as gypsum prior to seeding. Nitrogen was also applied at tillering as liquid urea-ammonium nitrate (CSBP Flexi-N®, Perth, Australia) or as Urea. Potassium, a limiting nutrient in these soils, was applied only in the years when canola was grown. The rationale for this was to test the effects of the clay-rich subsoil on K nutrition in cereals. Pesticides, including herbicides, fungicides and insecticides were applied uniformly across the experiment to optimise crop yields in each season. The canola and cereal crops were mechanically harvested with a small plot harvester in mid-November and late-November through to early December, respectively. Details of the cropping rotation, agronomic management, annual rainfall, rainfall deciles and calculated yield potential [37] are given in Table 3. Rainfall deciles rank annual rainfall from the lowest 10% (Decile 1) to the highest 10% (Decile 10) of prior annual (1952–2016) rainfall records. Rainfall limited yield potential were calculated for wheat and barley using rainfall use efficiency terms of 20 kg mm−1 ha−1 [37] and 15 kg mm−1 ha−1 for canola [38].

2.2. Soil Chemical and Physical Properties

Topsoil water repellence was measured using the Molarity of Ethanol Droplet (MED) test [39] on soils collected to a depth of 0.1 m that had been oven dried (<70 °C) for 48 h and allowed to cool prior to measuring. The rating categories for the MED test are; low 0–1.0, moderate 1.2–2.0, severe 2.4–3.0 and very severe >3.2 [39]. Only the control, spaded (±clay) and mouldboard ploughed treatments were measured in 2014 whereas all treatments were measured for water repellence in 2015 and 2016. Soil strength was measured annually in mid-winter when the soils were at field capacity using a RIMIK® (CP40-II, Toowoomba, Australia) digital recording cone (130 mm2 ASAE standard S313.3) penetrometer. Triplicate penetration resistance readings were measured to 0.6 m depth in three locations within each plot, with strength recorded every 0.01 m. Soil water measurements were collected to a depth of 0.12 m with a Campbell HydroSense II® (Logan, UT, USA) handheld soil moisture sensor in five locations within each plot when crops were emerging.
Soil chemical properties were measured on samples that were collected in June 2017 from the control, mouldboard ploughed and spaded (±clay) treatments with and without lime. Samples were collected at 0.1 m depth increments to 0.4 m at ten sites within each plot using a 0.05 m OD auger. Samples for each depth within each plot were bulked together and split in half. The methods for; electrical conductivity (EC), soil pH (pHCaCl2) and Aluminium (AlCaCl2) measured in 0.01 M CaCl2 with a soil to solution ratio of 1:5, Walkley-Black organic carbon (C), exchangeable cations (Al, Ca, Mg, K, Na) extracted in 0.1 M NH4Cl, Colwell bicarbonate phosphorus (PCol) and K (KCol) and 1 M KCl-extractable nitrate and ammonium are described by [40]. Cation exchange capacity (CEC) was calculated as the sum of exchangeable cations. Sulfur (SKCl40) was extracted in 0.25 M KCl using the method of [41]. Copper (Cu), zinc (Zn) and manganese (Mn) was extracted using DTPA solution [40]. Particle size analysis was done using the pipette method of [42].

2.3. Plant Measurements

Plant numbers were counted post seeding along adjacent 1 metre rows in five locations within each plot. Normalised difference vegetation index (NDVI) measurements were recorded prior to ear emergence (cereals) or flowering (canola) using a Trimble Greenseeker® (Sunnyvale, CA, USA). Biomass samples were collected annually in each plot at growth stages near anthesis for the cereals or prior to pod filling for canola (early September). Plant samples were harvested from three 0.5 m2 sites within each plot and bulked together. Dry weights and tiller numbers were measured on plant samples that had been dried at 70 °C for 3 to 4 days in a fan forced oven. Grain yield (t ha−1) was measured in November or December using plot harvesters.
Weed numbers were counted within 3 by 0.5 m2 quadrats per plot in late August 2012 and late June 2013. The weed species present were not counted separately but were dominated by rye grass (Lolium rigidum G.), brome grass (Bromus diandrus R.) and Erodium (Erodium cicutarium L.) with minor numbers of wild radish (Raphanus raphanistrum L.) and volunteer clovers (Trifolium subterraneum L.).
Youngest fully expanded leaf (2012) and whole top (2013–2016) biomass subsamples were analysed by ICP for macro and micro nutrients [43] at the CSBP laboratory (Perth, Australia). Plant tissue analysis was performed only on the control, mouldboard ploughed and spaded (±clay) treatments with and without lime. Grain yield was measured by mechanically harvesting two 20 m by 1.8 m wide strips within each plot. Grain samples were collected from each plot and analysed for seed size and weight. An InfratechTM (Hillerød, Germany) grain analyser was used to measure colour, moisture, oil content and protein. Grain yields reported were not adjusted for moisture.
A partial nutrient balance for N, P, K and S were calculated over the five years of the experiment. The partial nutrient balance consisted of inputs (fertilizer) minus outputs (N, P, K and S within the grain removed) [44]. The inputs were the same for each treatment. The outputs were calculated by multiplying grain yields by published nutrient levels [45] of wheat, canola and barley.

2.4. Economics

A discounted cash flow approach was used to assess the profitability of each treatment. Gross margins (Grain yield t ha−1 × grain price AUD t−1 − variable costs AUD ha−1) were recorded for each year. The variable costs for seed, fertilizer and pesticides amounted to AUD 220 ha−1. The cost of the Wetter treatment (AUD 40 ha−1) was added to the variable costs each year. Costs for the Paired row (AUD 10 ha−1), mouldboard ploughing (AUD 110 ha−1), spading to 0.35 m (AUD 150 ha−1), clay addition with spading to 0.2 m (Clay_Sp20, AUD 775 ha−1) and clay addition with spading to 0.35 m (Clay_Sp35, AUD 850/ha) were added to the variable costs in the initial year only. The strategic tillage costs are based on those reported by [46,47]. A 5% discount rate was used to determine the Net Present Value (NPV) for each treatment. Return on Investment (ROI) was calculated as the (NPV Profit—NPV treatment cost/NPV treatment cost).

2.5. Statistics

Statistical differences among treatments were assessed using the ANOVA function within Genstat [48]. The nine main treatments were analysed individually whereas the lime sub-treatment was analysed as a non-randomised split plot within the main treatments. Data for the limed treatments are presented only where there was a significant interaction between the tillage main treatments and the limed sub-treatments. Penetrometer and soil chemical measurements were statistically compared between the treatments at individual depths. Linear correlations and variation accounted for (r2) between variables were made using the trend function in Excel 2010 (Microsoft Corp, Redmond, WA, USA).

3. Results

3.1. Water Repellence

Topsoil water repellence at the site was rated as severe to very severe with MED values for the control treatment ranging from 2.8–3.6 (Figure 1) in all years. Spading, mouldboard ploughing and the clayed treatments reduced topsoil water repellence (p ≤ 0.05) when compared to the control. Spading alone was rated as having a moderate level of repellence which was higher than the mouldboard ploughed and clayed treatments which were rated as having low levels of repellence. The wetting agent and the seeding point treatments did not change topsoil water repellence when compared to the control at the times the measurements were made. Lime application had no effect on water repellence.

3.2. Soil Chemistry

Soil pHCaCl2 ranged from 5.9 in the 0–0.1 m layer to 4.8 within the subsoil (0.1–0.35 m) (Figure 2A). When averaged across the main treatments, the addition of lime had a negligible effect on soil pHCaCl2 to a depth of 0.2 m but did increase pH by 0.1 units within the 0.2–0.4 m layer (Figure 2A,B).
The Control treatment had higher pHCaCl2, OC%, S and mineral nitrogen (NO3- + NH4+) in the 0–0.1 m layer than the Mbd35 and Sp35 treatments (Figure 2A,B,D,F,G). At lower depths in the soil profile, the Control had lower pHCaCl2, OC% and NO3+ NH4+ than the Mbd35 treatment and similar values to the Sp35 (Figure 2D,G). Clay content and K were increased to more than 5.2% and 44 mg kg−1 to a depth of 0.1 m respectively within the Clay_Sp20 and Clay_Sp35 treatments compared to less than 3.5% and 20 mg K kg−1 for the Control and Mbd35 treatments (Figure 2C,E). Below 0.1 m depth there were no significant differences in clay content between the treatments (Figure 2C). At depths greater than 0.2 m there were no differences in K among treatments. The Colwell-extractable P was not affected by the tillage and clay treatments at any depth measured (Figure 2H).

3.3. Soil Strength

Soil penetration resistance increased with depth achieving maximum strength at a depth of 0.3 m (Figure 3). In each year, soil strength in the Control treatment exceeded 2500 kPa at 0.19 m depth and 3000 kPa at 0.22 m depth. Soil strength was significantly reduced as a result of the Spading (±Clay) and Mbd35 ploughed treatments when compared to the Control (Figure 3A). The reductions in soil strength occurred within the 0.05–0.32 m zone in the initial year and in later years between the depths of 0.1 and 0.32 m (Figure 3B–D). In 2013 and 2014, soil strength was reduced in the order; Control > Clay_Sp20 > Mbd35 > Clay_Sp35 = Sp35 (Figure 3A,B). However, by 2016 the order in which the treatments reduced soil strength had changed to Control = Clay_Sp20 > Mbd35 = Sp35 = Clay_Sp35 (Figure 3D). There were no differences between the limed and unlimed treatments and no consistent differences among the Control, Wetter, WingedP and PairedR sowing treatments.
The differences in soil strength between the control and the spaded and mouldboard ploughed treatments diminished with time (Figure 4). Initially the Control had soil strength values up to 1800 kPa higher than the Sp35 treatment in 2013 at a depth of 0.2 m. However, by 2016 the corresponding difference was 860 kPa (Figure 4A). The reduction in soil strength for the Mbd35 treatment when compared to the Control (Figure 4B), was maintained over time more so than the Sp35 treatment (Figure 4A). Both the Mbd35 and Sp35 had minor (p > 0.2) but consistent increases in soil strength compared to the Control immediately below the plough layer.

3.4. Plant Emergence

Plant numbers exceeded 115 and 35 plants m−2, the minimum thresholds to reach yield potential for cereals and canola, respectively, in each year irrespective of treatment. The PairedR, and Wetter treatments had inconsistent effects on crop emergence with increased and reduced plant numbers in 2014 and 2016, respectively, when compared to the control (Table 4). The WingedP treatment increased plant numbers in 2012, 2014, 2015 but reduced them in 2016 when compared to the control. The Mbd35 treatments reduced canola plant numbers in 2013 while the Sp35 treatment increased plant numbers at establishment in 2014 and 2015 when compared to the control.
The clay treatments (Clay_Sp20 and Clay_Sp35) increased barley and canola emergence in 2014 and 2015, respectively, when compared to the control (Table 3). Volumetric soil water contents in the clayed treatments (5.5 to 6.5%) within the 0–0.12 m layer were significantly higher (p ≤ 0.05) than the Control (4.4%) in 2015 (data not presented). Seven of the eight significant treatment increases in plant emergence when compared to the Control occurred in years where rainfall was less than Decile 5. There were no significant interactions between the tillage and lime treatments with the means for the lime treated and untreated plots varying by less than four plants per square metre in each year. Water repellence, as measured by the MED test, accounted for 42% of the variation in emergence of canola in 2015. In all other years, MED accounted for between 1 and 22% of the variation in plant emergence. Similarly, plant density at emergence accounted for less than 26% (range 1–26%) of the variation in grain yield in any year.
Weed populations ranged from 5–26 plants m−2 in 2012. Weed populations were reduced (p < 0.05) in the order; Clay_Sp20 > Control = Clay_Sp35 > Disc = Mbd35. In June 2013 weed populations ranged from 5–12 plants m−2 across all treatments with the Mbd35 and Sp35 being the only treatments to have lower (p < 0.05) weed numbers (5 plants m−2) than the control (10 plants m−2). Lime had no effect on weed numbers.

3.5. Crop Development and Grain Yields

Wheat yields in 2012 were increased as a result of the mouldboard ploughing and spading (±clay) treatments when compared to the control (Table 5). The remaining treatments did not differ significantly to the control. The deep incorporation of clay (Clay_Sp35) gave no yield benefit over the deep incorporation without clay (Sp35). A significant interaction between the main treatments and the lime sub treatment occurred resulting in the limed sub treatments consistently yielding 0.2–0.6 t ha−1 more than the unlimed treatments. Overall, the grain yields for 2012 were lower than the calculated potential (3.9 t ha−1) due to late sowing in early July and the presence of Take All root disease (G. graminis) affecting 20–40 % of the grain heads sampled.
Early season NDVI measurements in 2013 showed canola vigour declined in the order of: Control (0.26) > remaining treatments (0.23–0.2) > Sp35 (0.17) = Mbd35 (0.15). Despite this, canola yields in 2013 were increased by both the clayed and spaded treatments (Clay_Sp20 and Clay_Sp35) when compared to the Control (Table 5). All other treatments had grain yields which were similar to the control. The highest treatment yield (Clay_Sp20) attained 78% of the calculated rainfall-limited yield potential. Annual rainfall for the year was exceptionally high (Decile 10) with approximately a third of this occurring prior to seeding.
Barley grain yield in 2014 was increased by the spading, mouldboard ploughing and the clayed treatments when compared to the control (Table 5). The increase in grain yield associated with these treatments ranged from 0.5 to 1.0 t ha−1. All other treatments yielded similarly to the control. The deep spading with clay (Clay_Sp35) gave no additional yield benefit compared to the Sp20 treatment. The grain yield from the Sp35 treatment achieved 90% of the calculated rainfall limited potential yield whereas the Control achieved only 60%.
Canola NDVI values measured in late July 2015 were increased (p < 0.01) only by the Clay_Sp20 and Clay_Sp35 treatments when compared to the Control. However, by the end of the season no significant differences in canola yield were found between the control and all other treatments in 2015 (Table 5). The WingedP and Wetter treatments had lowest yields and were significantly lower than the spaded, mouldboard ploughed and clayed treatments. Yields for the mouldboard ploughed treatment were almost 90% of the rainfall limited yield potential.
Wheat NDVI was increased by the Clay_Sp20 and Clay_Sp35 treatment in early August 2016 when compared to the control. Wheat yields in 2016 averaged 4.3 t ha−1 across the experimental site. The Clay_Sp35 treatment increased (p < 0.001) wheat grain yields by 0.59 t ha−1 when compared to the control in 2016. No other treatment differed significantly to the control (Table 5). There were no differences in grain yield between the spaded (±clay) and mouldboard ploughed treatments.
Overall, the spading with clay treatments (Clay_Sp20 and Clay_Sp35) had significantly higher grain yields than the control in four of the five years. The Sp35 and Mbd35 treatments resulted in yield increases over the control in 3 and 2 of the five years, respectively. The grain yields in all of the other treatments (Disc, PairedR, Wetter, WingedP) did not differ significantly to the control in any year. Total production over the five years was increased significantly by the spading (±clay) and mouldboard ploughing treatments by 2.1–2.6 t ha−1 when compared to the control. When averaged across all years, the highest yielding treatments achieved 85% of the estimated potential yield compared to 65% for the Control. Grain yields for the Sp35 and Clay_Sp35 treatments were statistically similar in each year. There was no significant interaction between the seeding and tillage main treatments and lime in any year.
The percentage increase in crop yields associated with the spaded (Sp35, Clay_Sp20, Clay_Sp35) and mouldboard ploughed treatments appears to have diminished with time when compared to the Control. Initial yield increases exceeded 70% for the Sp35 and Mbd35 treatments in 2012 whereas by 2016 the yield increases had declined to no more than 9% higher than the Control. Small yield increases were also found between the Control and the Clay_Sp20, Clay_Sp35, Sp35 and Mbd35 treatments in 2013 which was an exceptionally wet (Decile 10) year.

3.6. Crop Nutrition

The Clay_Sp20 and Clay_Sp35 treatments increased shoot K concentrations in all years except 2012 when compared to the Control (Table 6). The control treatment had shoot K concentrations below or near the critical value (2% K) for cereal crops [49]. Soil K within the 0–0.1 m layer for the control treatment was less than 30 mg kg−1 compared to greater than 45 mg kg−1 where clay had been applied (Figure 2E). Based on regression analysis, shoot K explained on average 20% (range <0.01 to 0.34, n = 40) of the variation in cereal and canola yields. Increased shoot K concentrations were also found in three of the five crops (2014, 2015, 2016) for the Sp35 treatment when compared to the Control.
Both clay treatments had higher shoot B levels than the control in all but one year. The shoot B values for cereal crops in the control treatment were less than 5 mg kg−1 in two years which is rated as marginal to deficient [49]. However, shoot B explained on average only 5% (range <0.01 to 0.15, n = 40) of the variation in cereal and canola yields.
Significant differences in shoot N, P and S concentrations were found among the treatments, however, they were not consistent. For instance, the Mbd35 treatment had reduced plant N, P, K and S shoot concentrations in 2012 and increased N, P, K, Ca, S and B in some but not all subsequent years when compared to the Control (Table 6). Similarly, there were no consistent differences in shoot nutrient concentrations associated with the Sp35 treatment. The Sp35 treatment had reduced N, P and S shoot concentrations in 2012; however, in the remaining years, there was no difference except for increases in S concentration in some, but not all, subsequent years when compared to the Control. The concentrations of N%, P% and S% within whole shoots were generally low but on average above the critical thresholds [49] for cereals (2%N, 0.2%P, 0.15%S) and canola (2.2%N, 0.28%P, 0.3%S).
The Clay_Sp20 and Clay_Sp35 treatments had lower Ca levels than the Control in three of the six years (Table 6). Despite this, the values of Ca were above the critical deficiency (0.25%) levels [49] in all treatments.
Zn concentrations in the shoots were reduced as a result of spading (+clay) in canola in 2013 and spading (±clay) in 2015 when compared to the Control. Shoot Zn concentrations were borderline adequate [49] in most years being greater than 0.3 mg kg−1 and 0.15 mg kg−1 for canola and cereals, respectively (Table 6). Soil Zn levels were reduced in the 0–0.1 m layer in the spaded, inversion ploughed and clayed treatments when compared to the control.

3.7. Partial Nutrient Balance

The cumulative partial nutrient balances for N, P, K and S were calculated as the difference between nutrient inputs (fertilizer) and outputs (nutrients removed in grain) then summed for each year (Figure 5). Given that fertilizer rates did not differ among the treatments it is not surprising that the highest yielding treatments had the lowest positive P, K and S balance. By the end of the experimental period, the differences in the nutrient balances between the highest (Mbd35) and lowest (Wetter) yielding treatment were 125 kg N, 17 kg P, 26 kg K and 21 kg S (Figure 5). Phosphorus was the only nutrient to have inputs matching or exceeding outputs in most years (Figure 5B). Nitrogen balances were negative in most years (Figure 5A) while K and S balances were negative in three of the five years (Figure 5C,D). The cumulative nutrient balances for all nutrients decreased in the order: (Wetter, Control, WingedP, PairedR) ≥ Clay_Sp20 = (Clay_Sp35, Sp35, Mbd35).

3.8. Economics

Net present values (NPV) calculated over the five years of the experiment indicate that the most profitable treatments were the Mbd35, Sp35 and PairedR treatments which resulted in an increase in profit of AUD 653 ha−1, AUD 457 ha−1 and AUD 153 ha−1, respectively, when compared to the Control. The Clay_Sp35, Clay_Sp20, Wetter and WingedP treatments were not as profitable as the Control (Table 7) in the short term. In terms of return on investment (ROI) the PairedR treatment gave the highest return (0.66). The equivalent ROI values for the Mbd35 and Sp35 treatments were 0.39 and 0.24, respectively.

4. Discussions

The treatments selected were chosen primarily to alleviate water repellence which is prevalent on sandplain soils on the southern coast of WA. However, the expression of water repellence was mostly limited to 2014 and 2015 when there was lower than average annual rainfall (Decile 2 and 4), while the largest crop yield responses were to treatments that alleviated other limiting factors, compaction and K deficiency. On soils with multiple limitations, treatments which are able to alleviate all or part of each constraint will achieve the greatest productivity increase. However, when such treatments (e.g., clay addition), are expensive, they may not achieve a profitable response even within 5 years.
Water repellence develops on sandplain soils within the organically stained topsoil, but the degree of water repellence declines with depth to the extent that the subsoils are not water repellent. Diluting and burying the water repellent layer by mixing the top and subsoils using a spading machine or inverting the water repellent topsoils through mouldboard ploughing were effective in ameliorating water repellence as has been reported on a range of other sandy soils in WA [23,28]. The results presented here suggest that mouldboard ploughing, spading and the addition of clay rich subsoil had the largest effects on reducing water repellence when compared to the wetting agent and to seeding tynes with minimal to substantial soil disturbance. In this experiment, water repellence was not affected by the addition of lime. Elsewhere the addition of lime at rates of 5, 10 and 15 t ha−1 to water repellent sandplain soils with a lower topsoil pHCaCl2 of 4.9 has resulted in a significant reduction in MED values and a tenfold increase in the populations of wax degrading organisms [50].
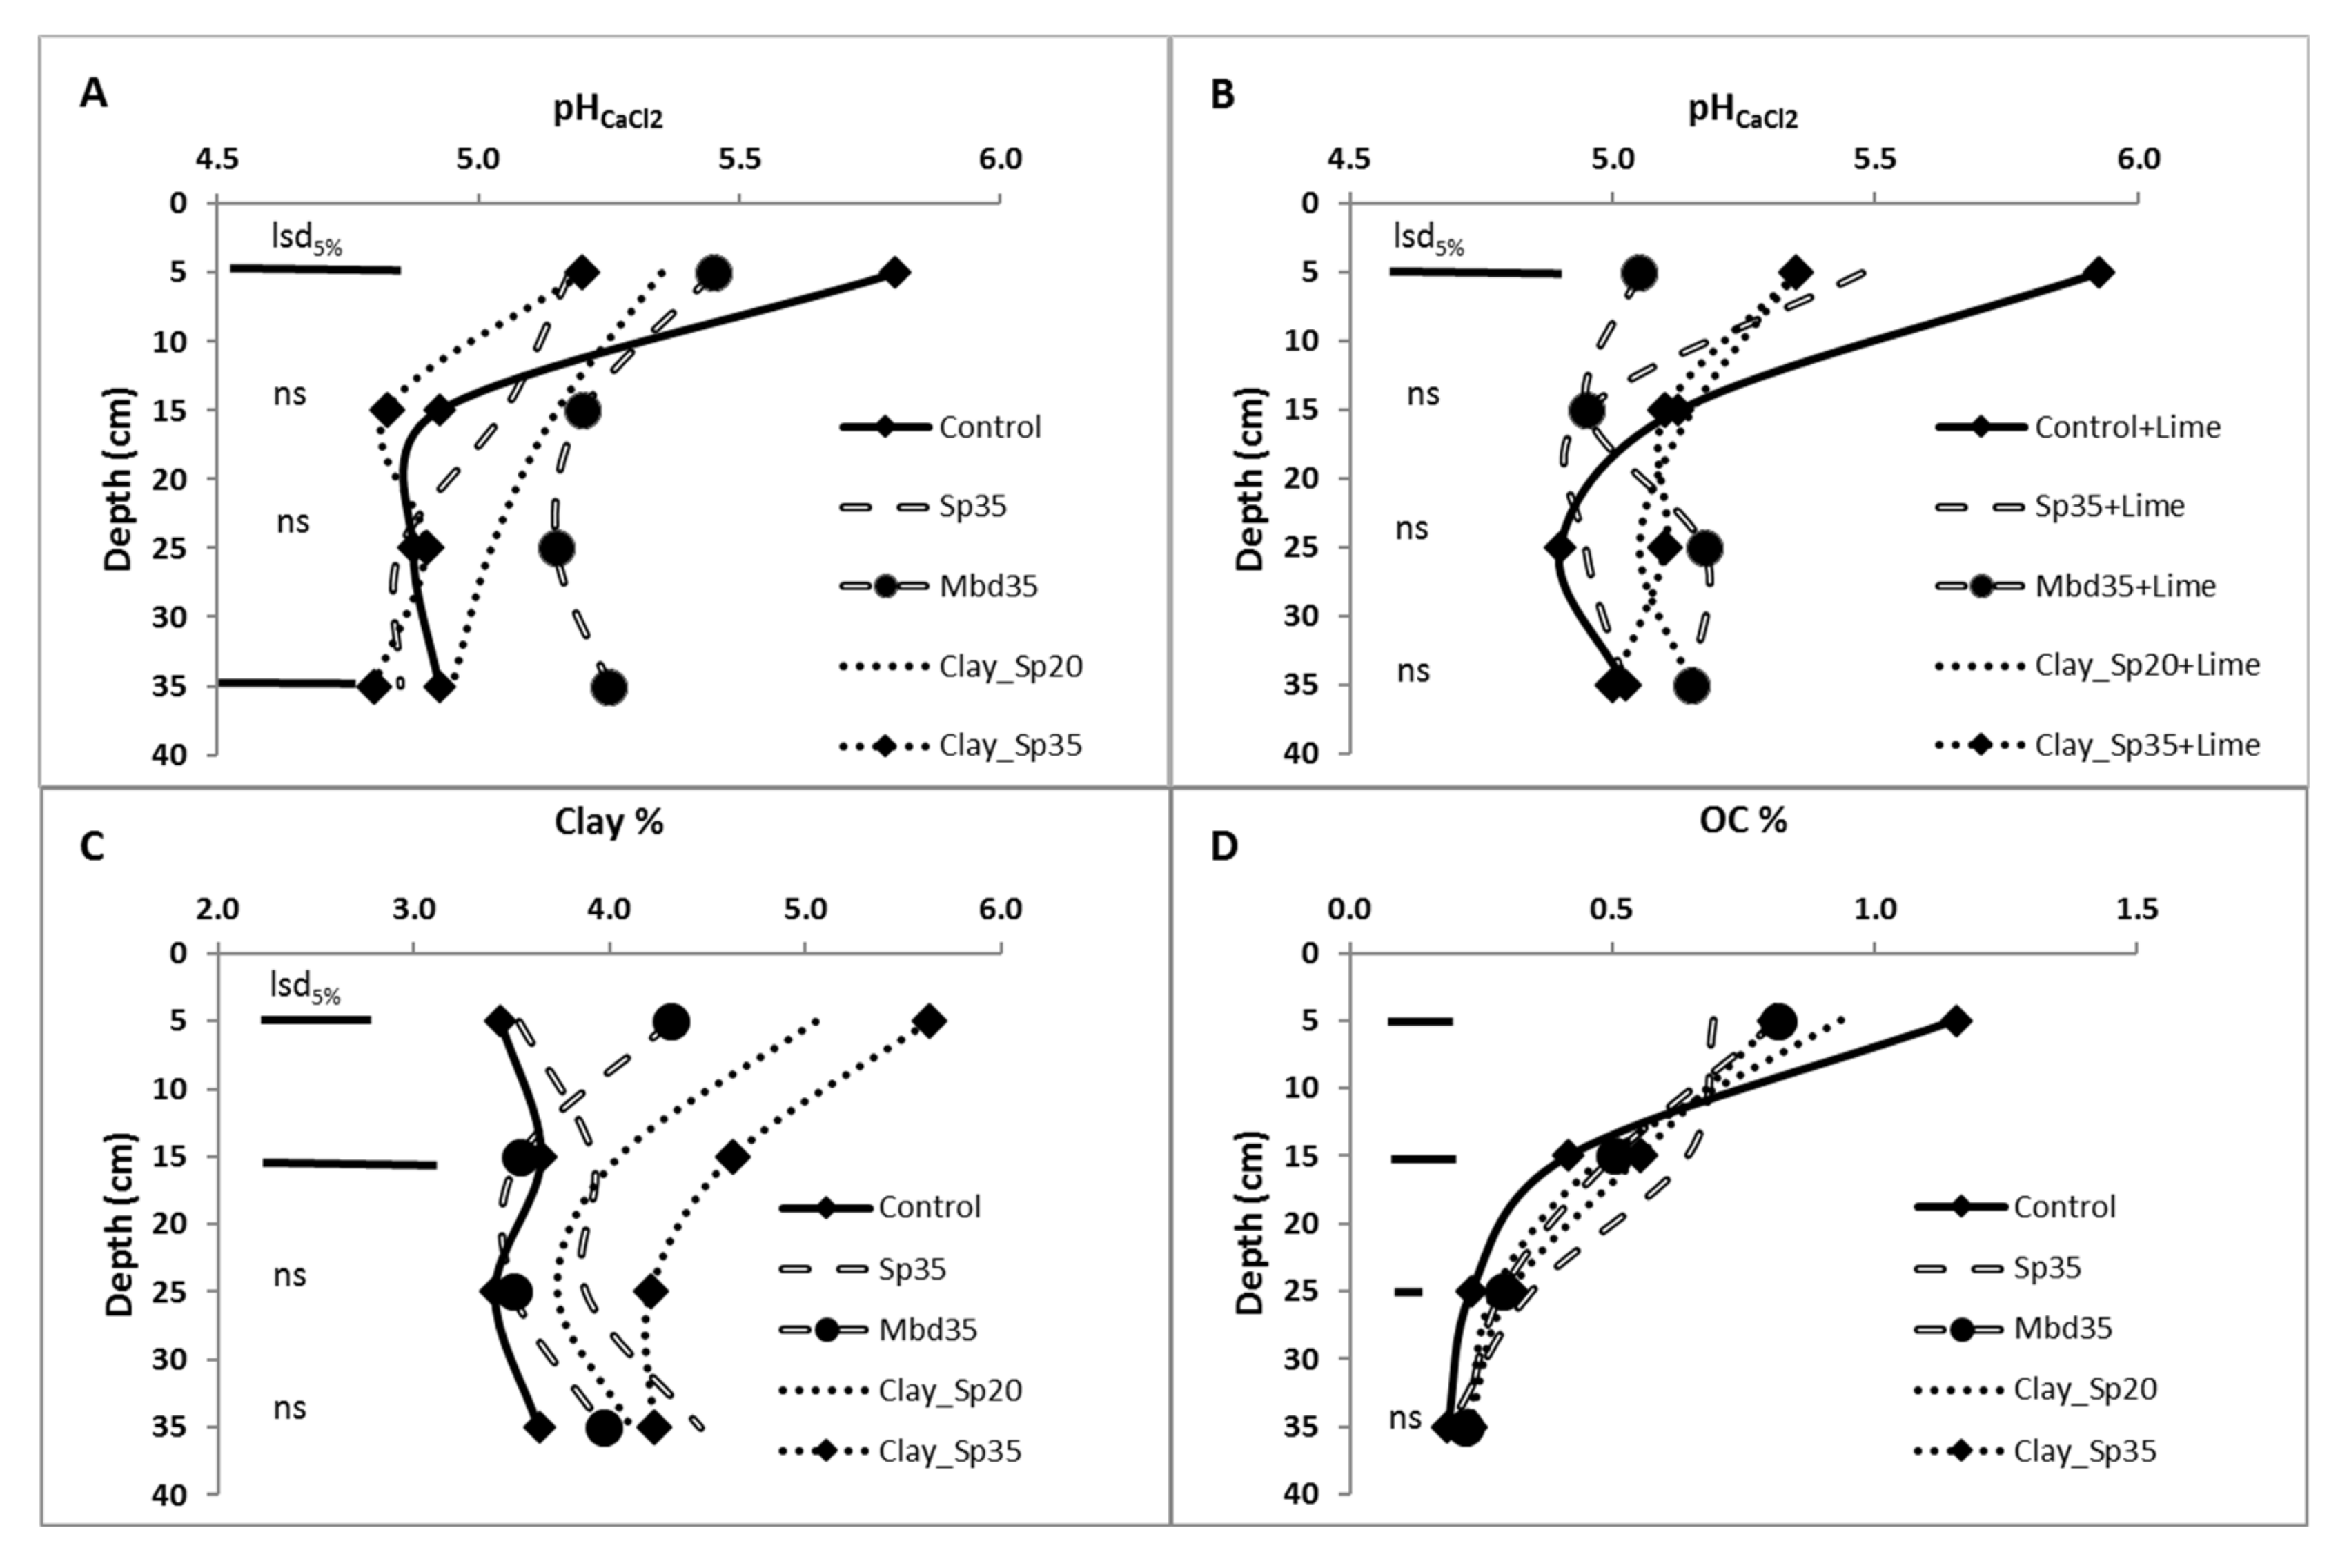
Despite ploughing to 0.35 m, most of the changes in soil chemical properties occurred at depths less than 0.25 m. The distribution of clay in the profile was not affected by the different depths of spading with no changes in clay content below 0.15 m regardless of whether the soil was spaded to 0.20 or 0.35 m. This result is supported by [24] who found that the majority of the topsoil remained within the 0–0.15 m layer following spading to a depth of 0.25 m. The mouldboard ploughed treatment resulted in less mixing and greater burial of the topsoil given the lower organic carbon levels at the surface and higher organic carbon levels at 0.25 m than the spaded soils. This suggests that mouldboard ploughing is likely to be more effective in incorporating ameliorants to depth but is less likely to evenly distribute ameliorants when compared to spading. In soils with lower subsoil pH than the present site, the more effective incorporation of lime at 0–0.3 m depth should have significant benefits [51].
The addition and incorporation of clay-rich subsoils into sands has been shown to increase organic carbon, K and pH after 10 years in a field experiment on a similar sandplain soil to the present study [17] and reduced nitrate leaching in a pot experiment on sandy soil [52]. The increases in organic carbon are attributed to reduced microbial activity associated with clay addition [53] and increased biomass production [54]. However, no significant increases in organic carbon, mineral nitrogen or soil pH were found in this experiment after 5 years. Enhanced soil mixing associated with spading and the slow rates of carbon accumulation [55] in sands may explain this.
In each year of the experiment, cereal and canola plant establishment were adequate to achieve rainfall limited yield potential. Relationships between canola establishment and final yield have shown that 30–40 plants m−2 (mean 32) is near the optimum to reach yield potential across a range of environments within WA [56]. The optimum plant density for wheat and barley can vary between 100 and 200 plants m−2 [57]. However, in WA, where the growing season rainfall is greater than 161 mm the optimal wheat density was 124 plants m−2 [58]. Overall crop establishment across all treatments was sufficient to achieve more than 85% of yield potential. The adequacy of plant establishment given the high MED values is attributed to two factors: favorable rainfall at seeding in most years and; seeds sown into the same rows for all crops in all years using ±0.02 m real time kinetic (RTK) guidance. On-row seeding has been shown to improve crop establishment in water repellent sands [10,59]. The poor relationships found between plant density at emergence and grain yield are further evidence of the adequacy of the established plant populations. Significant increases in plant densities were found in the majority of treatments only in the years (2014 and 2015) with below average rainfall. Canola emergence was found to be negatively affected by mouldboard ploughing in 2013. The reduction in canola emergence within the first few years of mouldboard ploughing has also been observed in commercial canola crops. The reason for the poor emergence is currently being investigated with some evidence of increased herbicide activity that damages the crop in mouldboard ploughed soils associated with reduced topsoil organic matter [22,60,61]. In this experiment there was no consistent evidence to show that the knife point seeding boots were any less effective than the winged point or paired row seeding systems. Previous research has shown that knife point seeding tynes can exacerbate water repellence where the topsoil falls in behind the seeding tyne resulting in the seed being sown into a seam of water repellent soil [10,46].
The wetting agent and seeding tynes (WingedP, PairedR) did not significantly increase grain yields compared to the control in any year or in total. [25] summarized experimental data comparing grain responses to winged points, paired rows and wetting agents using data from experimental sites from the northern to southern wheatbelt. They found that the average grain yield increases attributed to winged points, paired rows and banded wetting agents were 6% (range −2 to 14%, n = 7), 19% (range 3 to 76%, n = 5) and 10% (range −32 to 32%, n = 19), respectively. The high degree of variability in grain yield response to banded soil wetting agents was further examined in a more recent review of changes in crop yield following implementation of strategies to manage soil water repellence [47]. This demonstrated that crop yield responses to banded wetting agents occurred when the crop was sown into dry repellent soils with negligible responses when the soil was wet. Cereal grain yield response to wetting agents was also related to soil type with an average 21% (n = 8, range 3–38%) yield increase with dry sowing on loamy gravel ([13], Ferralic Retisol) and duplex sandy gravel soils ([13], Abruptic Plinthosol), and 88% of comparisons showing statistically positive yield response. By comparison on deep sands ([13], Arenosols), the grain yield response to banded soil wetters on dry sown cereals averaged 12% (n = 6, range −13–32%) with only one-third of these comparisons having a statistically positive response [47]. In this experiment, the lack of response to soil wetting agents could largely be explained by the wet conditions at seeding in most seasons and a soil type that is typically less responsive to soil wetting agents.
Crop yields were increased as a result of the spaded, mouldboarded and clayed treatments by 19 to 23% when averaged over all years. Grain yield increases associated with spading and mouldboard ploughing have been consistently reported across a range of environments in Western and South Australia following many years of no-till crop establishment [23,62,63,64]. On average crop grain yields were found to increase by 51% (range −2 to 150%, n = 19) and 39% (range 0 to 100%, n = 11) for the mouldboarded and spaded treatments, respectively, in WA [65]. Results from a smaller number of South Australian studies [64] suggest even higher yields from spading with average grain yield increases of 111% (range 63 to 200%, n = 3). While spading was introduced to incorporate clay rich subsoils more effectively to remediate water repellence [28], the crop yield responses suggest that in the short term spading alone is as effective as spading clay-rich subsoil. Crop yield results from other experiments support this with no significant differences in grain yields found at three South Australian sites [64] and three sites in WA [65,66]. We therefore conclude that diluting the water repellent topsoil with the wettable subsoil is as effective as claying in the short term and in the absence of nutrient deficiencies. This is particularly evident in sands where there is a gradational increase in clay content with depth and where inversion tillage results in an increase in topsoil clay content.
The application of lime had no appreciable effect on crop emergence, grain yields or soil strength at this site. Apart from 2012, there were also no interactions between the lime and tillage treatments at this site. Soil pH exceeded pHCaCl2 4.8 throughout the soil profile, a value that is used as a threshold beyond which aluminium is unlikely to be present in its toxic form [67]. Hence there would be merit in follow-up studies on more acid soils with the lime treatment together with strategic deep tillage [51] and claying treatments.
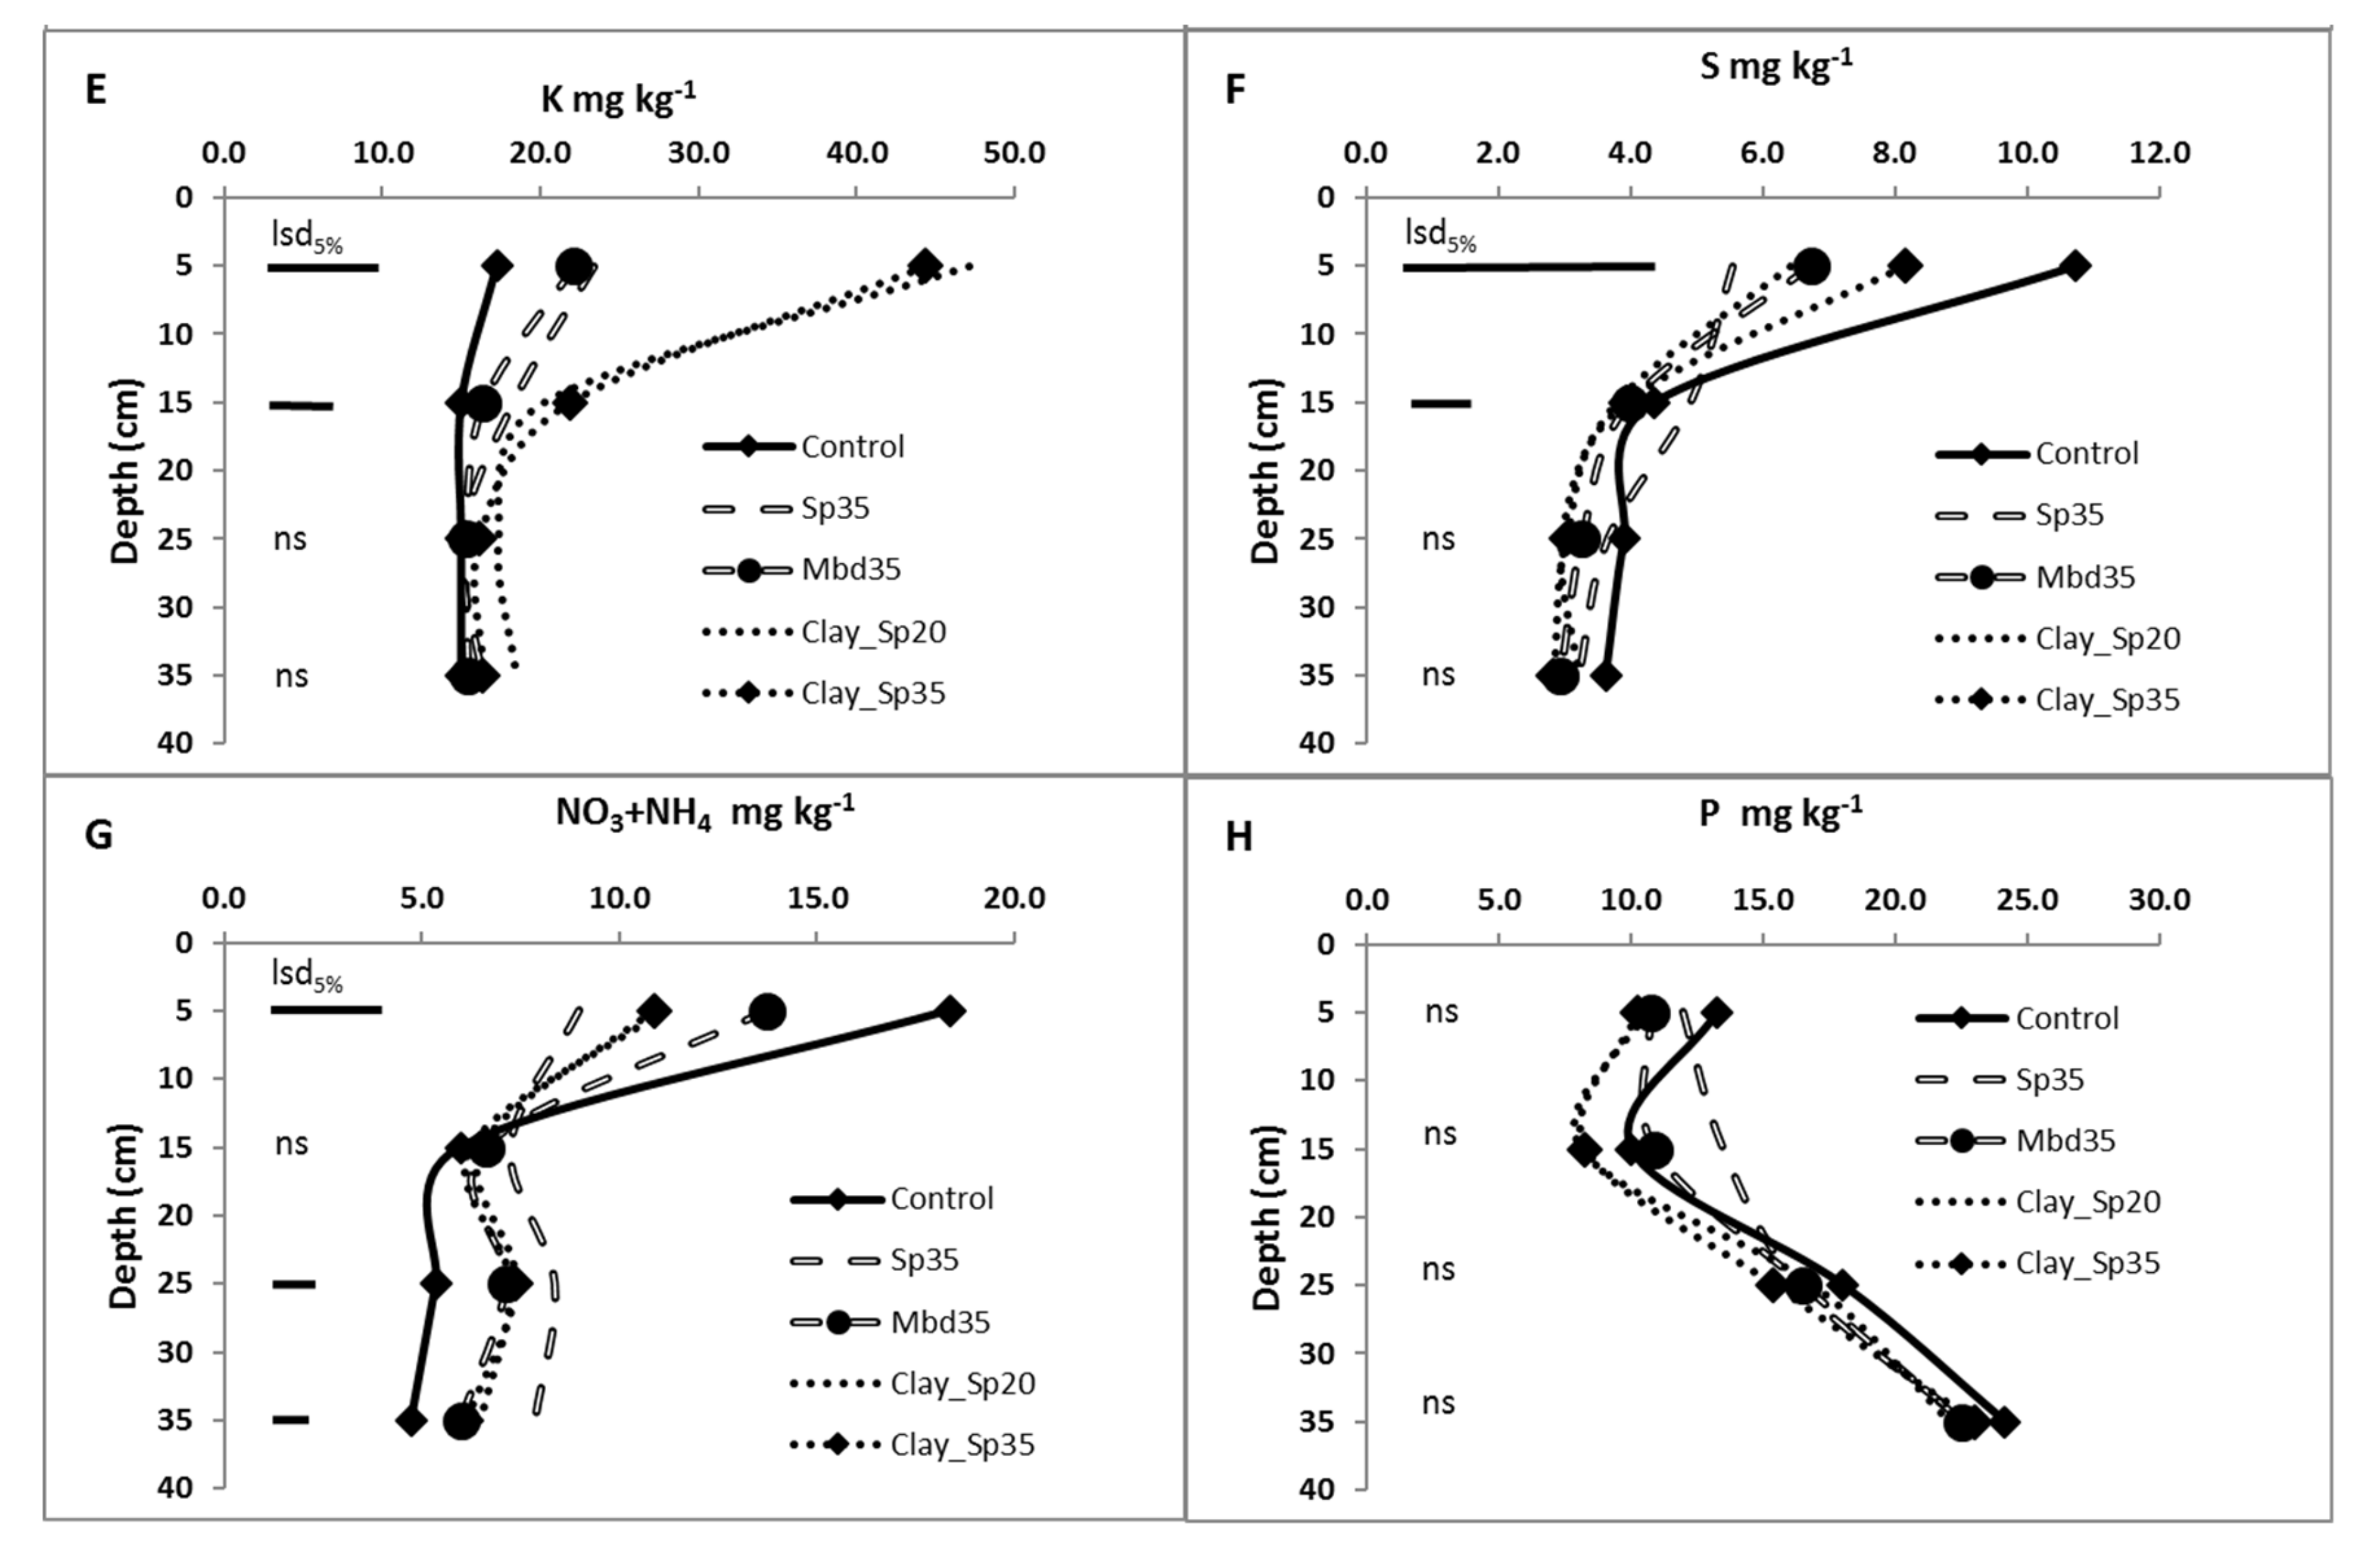
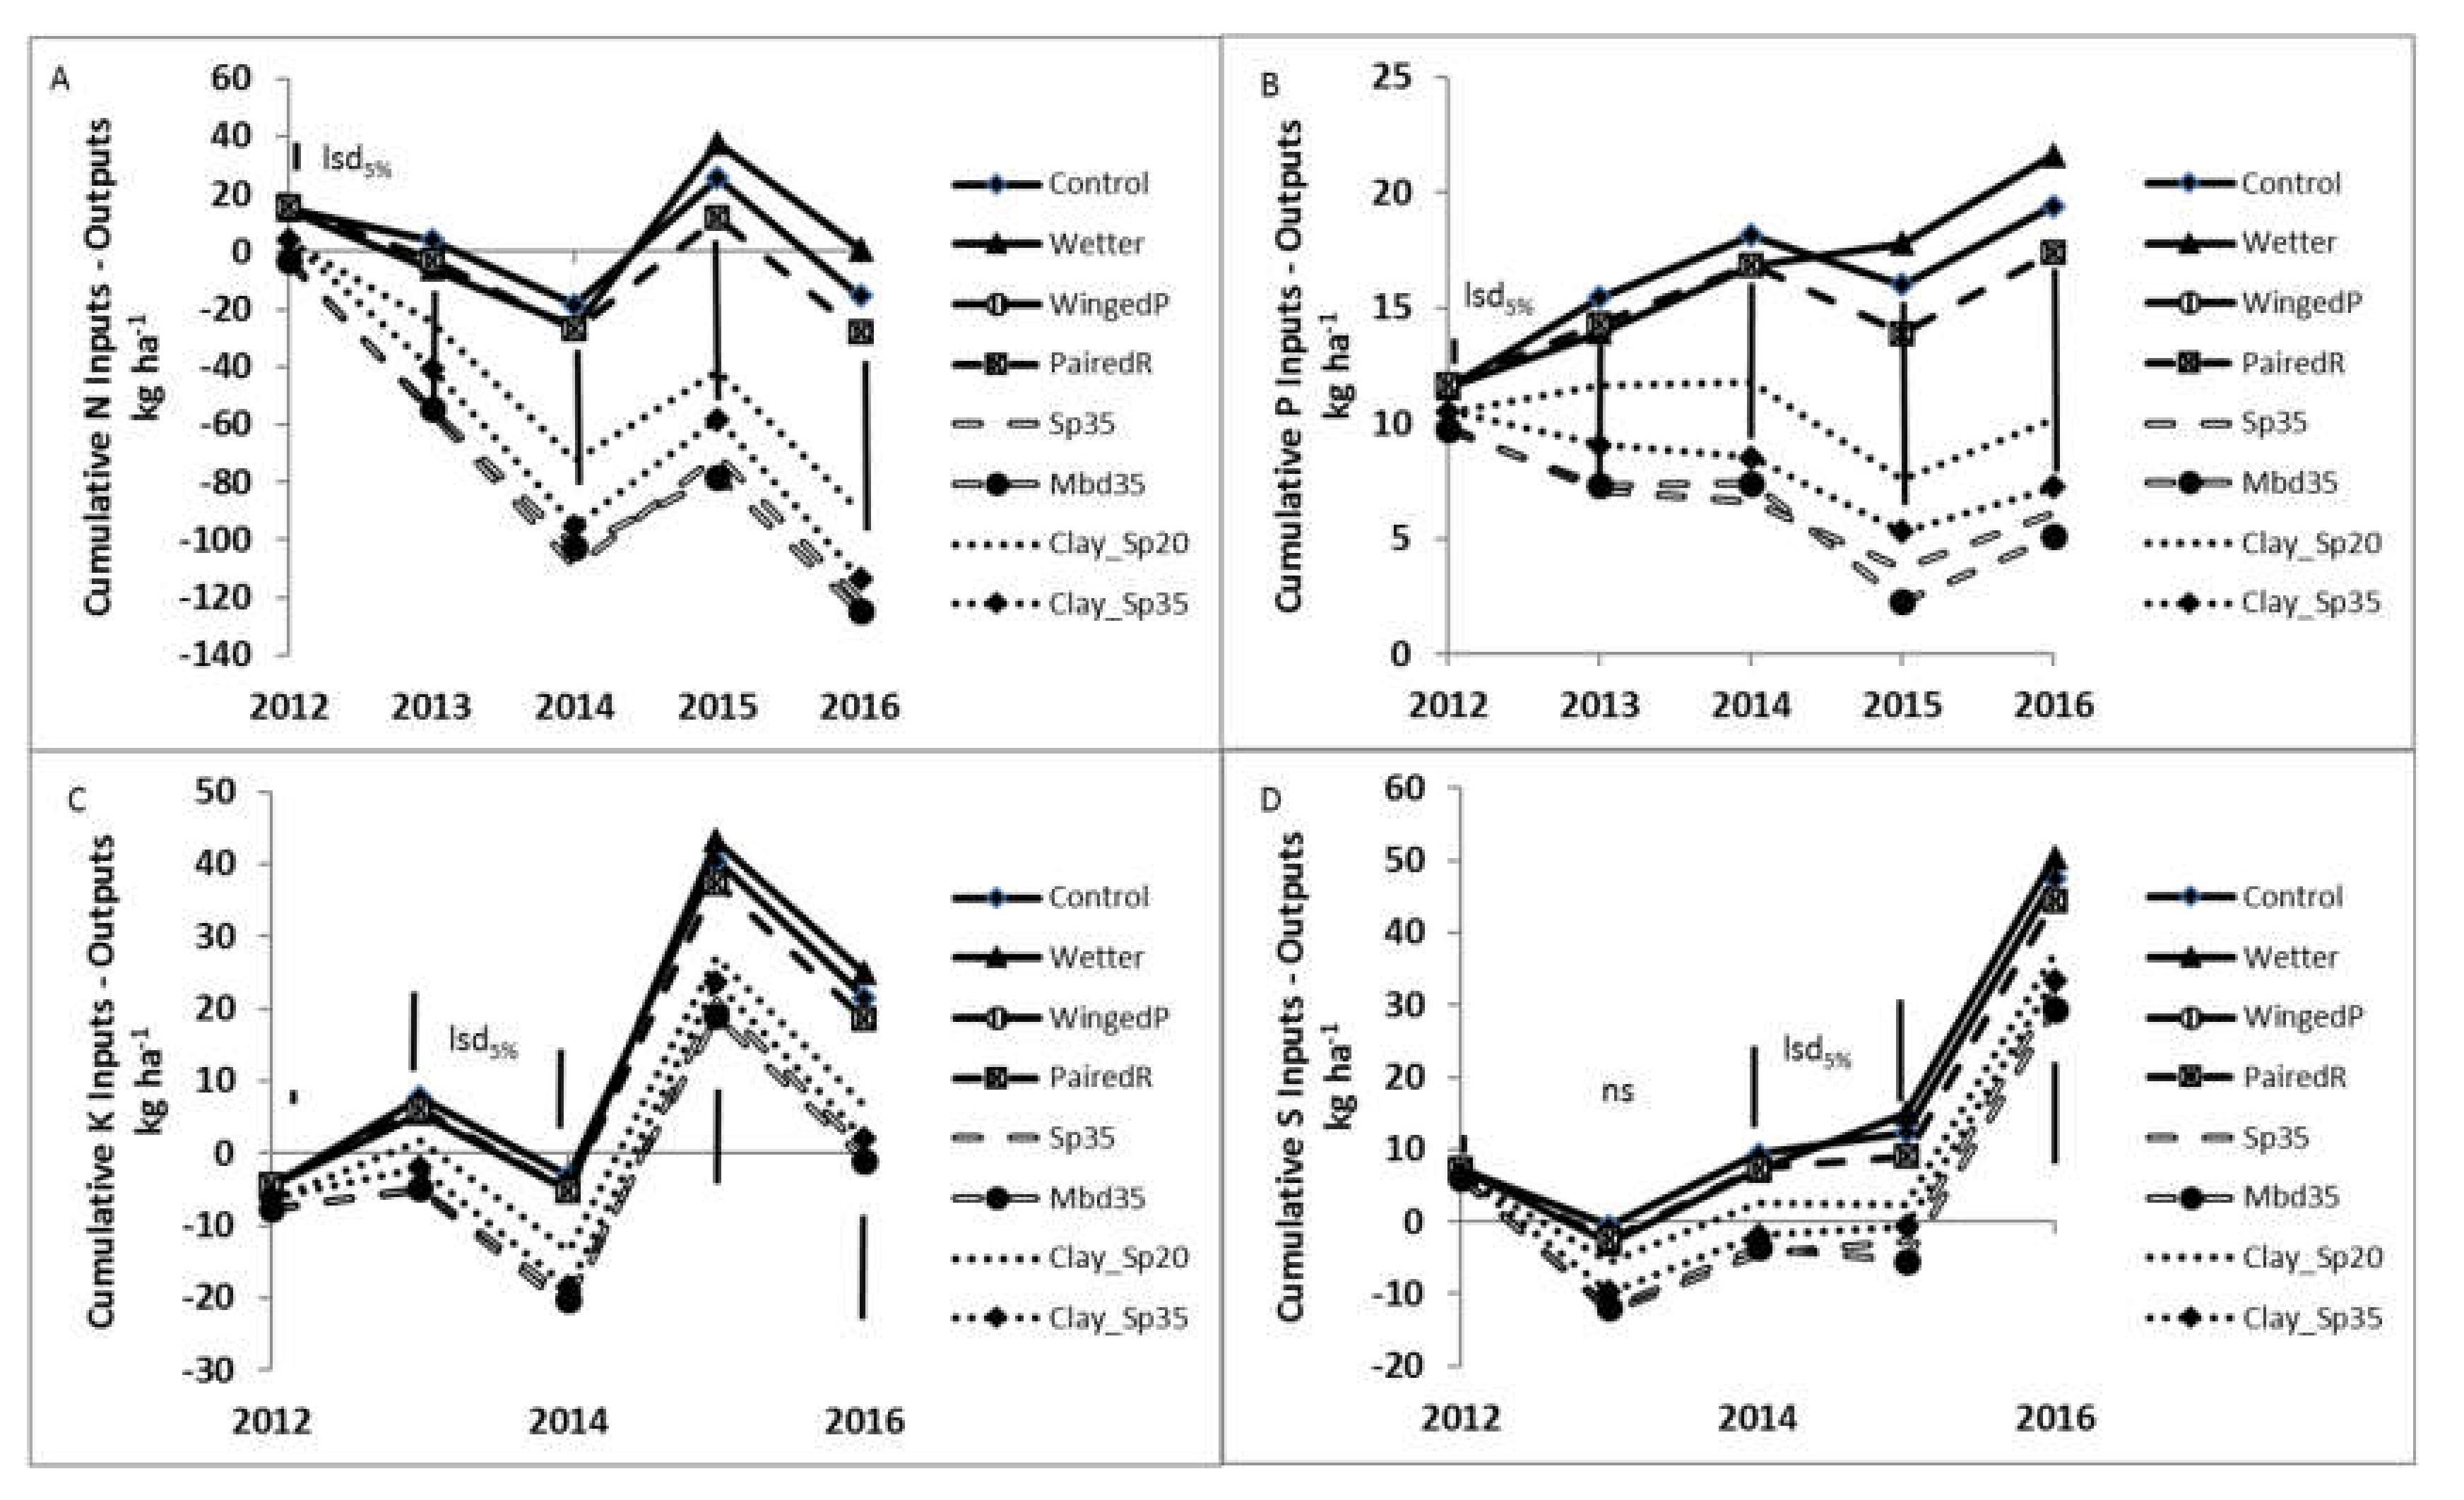
The increases in yield occurred independently of crop emergence in all years. This suggests that the limitations imposed by water repellence on seedling emergence are secondary to other soil constraints at this site. Nutrient concentrations in plant tissue for N, P, K, S, and B were marginal in most years (Table 6). Mouldboard ploughing and spading (−clay), although creating greater uniformity of nutrients within the soil profile, did not have an appreciable effect on nutrient levels in plant shoots. The clayed treatments increased K and B and reduced Ca in plant shoots. Elevated K levels in clayed soils have previously been proposed as a mechanism for increased yields in sandplain soils [17]. The increase in shoot K explained on average 19% (range 1–36%) of the variation in cereal and canola yields while effects from other nutrients were negligible. Elevated soil K levels can reduce Ca uptake [68] which would explain the reduced Ca levels found in the clayed treatments in three of the five years. Nutrient balances indicate that N, P, K and S decreased and were at times negative for the higher yielding treatments. Nitrogen balances were mainly negative for all treatments apart from the Control. The partial N balance, however, does not take into account N mineralised from organic carbon, or losses due to leaching. Despite this, the balances do show the importance of matching nutrition to higher production levels in modified soils. Based on the plant shoot and nutrient balance data, the contribution of nutrition to increased crop yields as a result of spading, mouldboard ploughing and claying is not conclusive given that N, P and S plant shoot concentrations did not differ between the Control and the highest yielding treatments in most years. Furthermore, the treatments with the highest shoot K concentrations (Clay_Sp20, Clay_Sp35) did not yield significantly higher than the Mbd35 and Sp35 treatments in four of the five years.
Although the experiment was managed to suppress weeds in all years, mouldboard ploughing had less than half the weed populations in 2012 and 2013 compared to the control whereas the results for spading (±clay) were more variable. Reductions in weed populations of up to 95% have been found as a result of mouldboard ploughing on sandy soils in Western Australia [69]. Spading is likely to be less effective at weed suppression given that the spading operation is not as effective at burying topsoil below 0.1m compared to mouldboard ploughing [24].
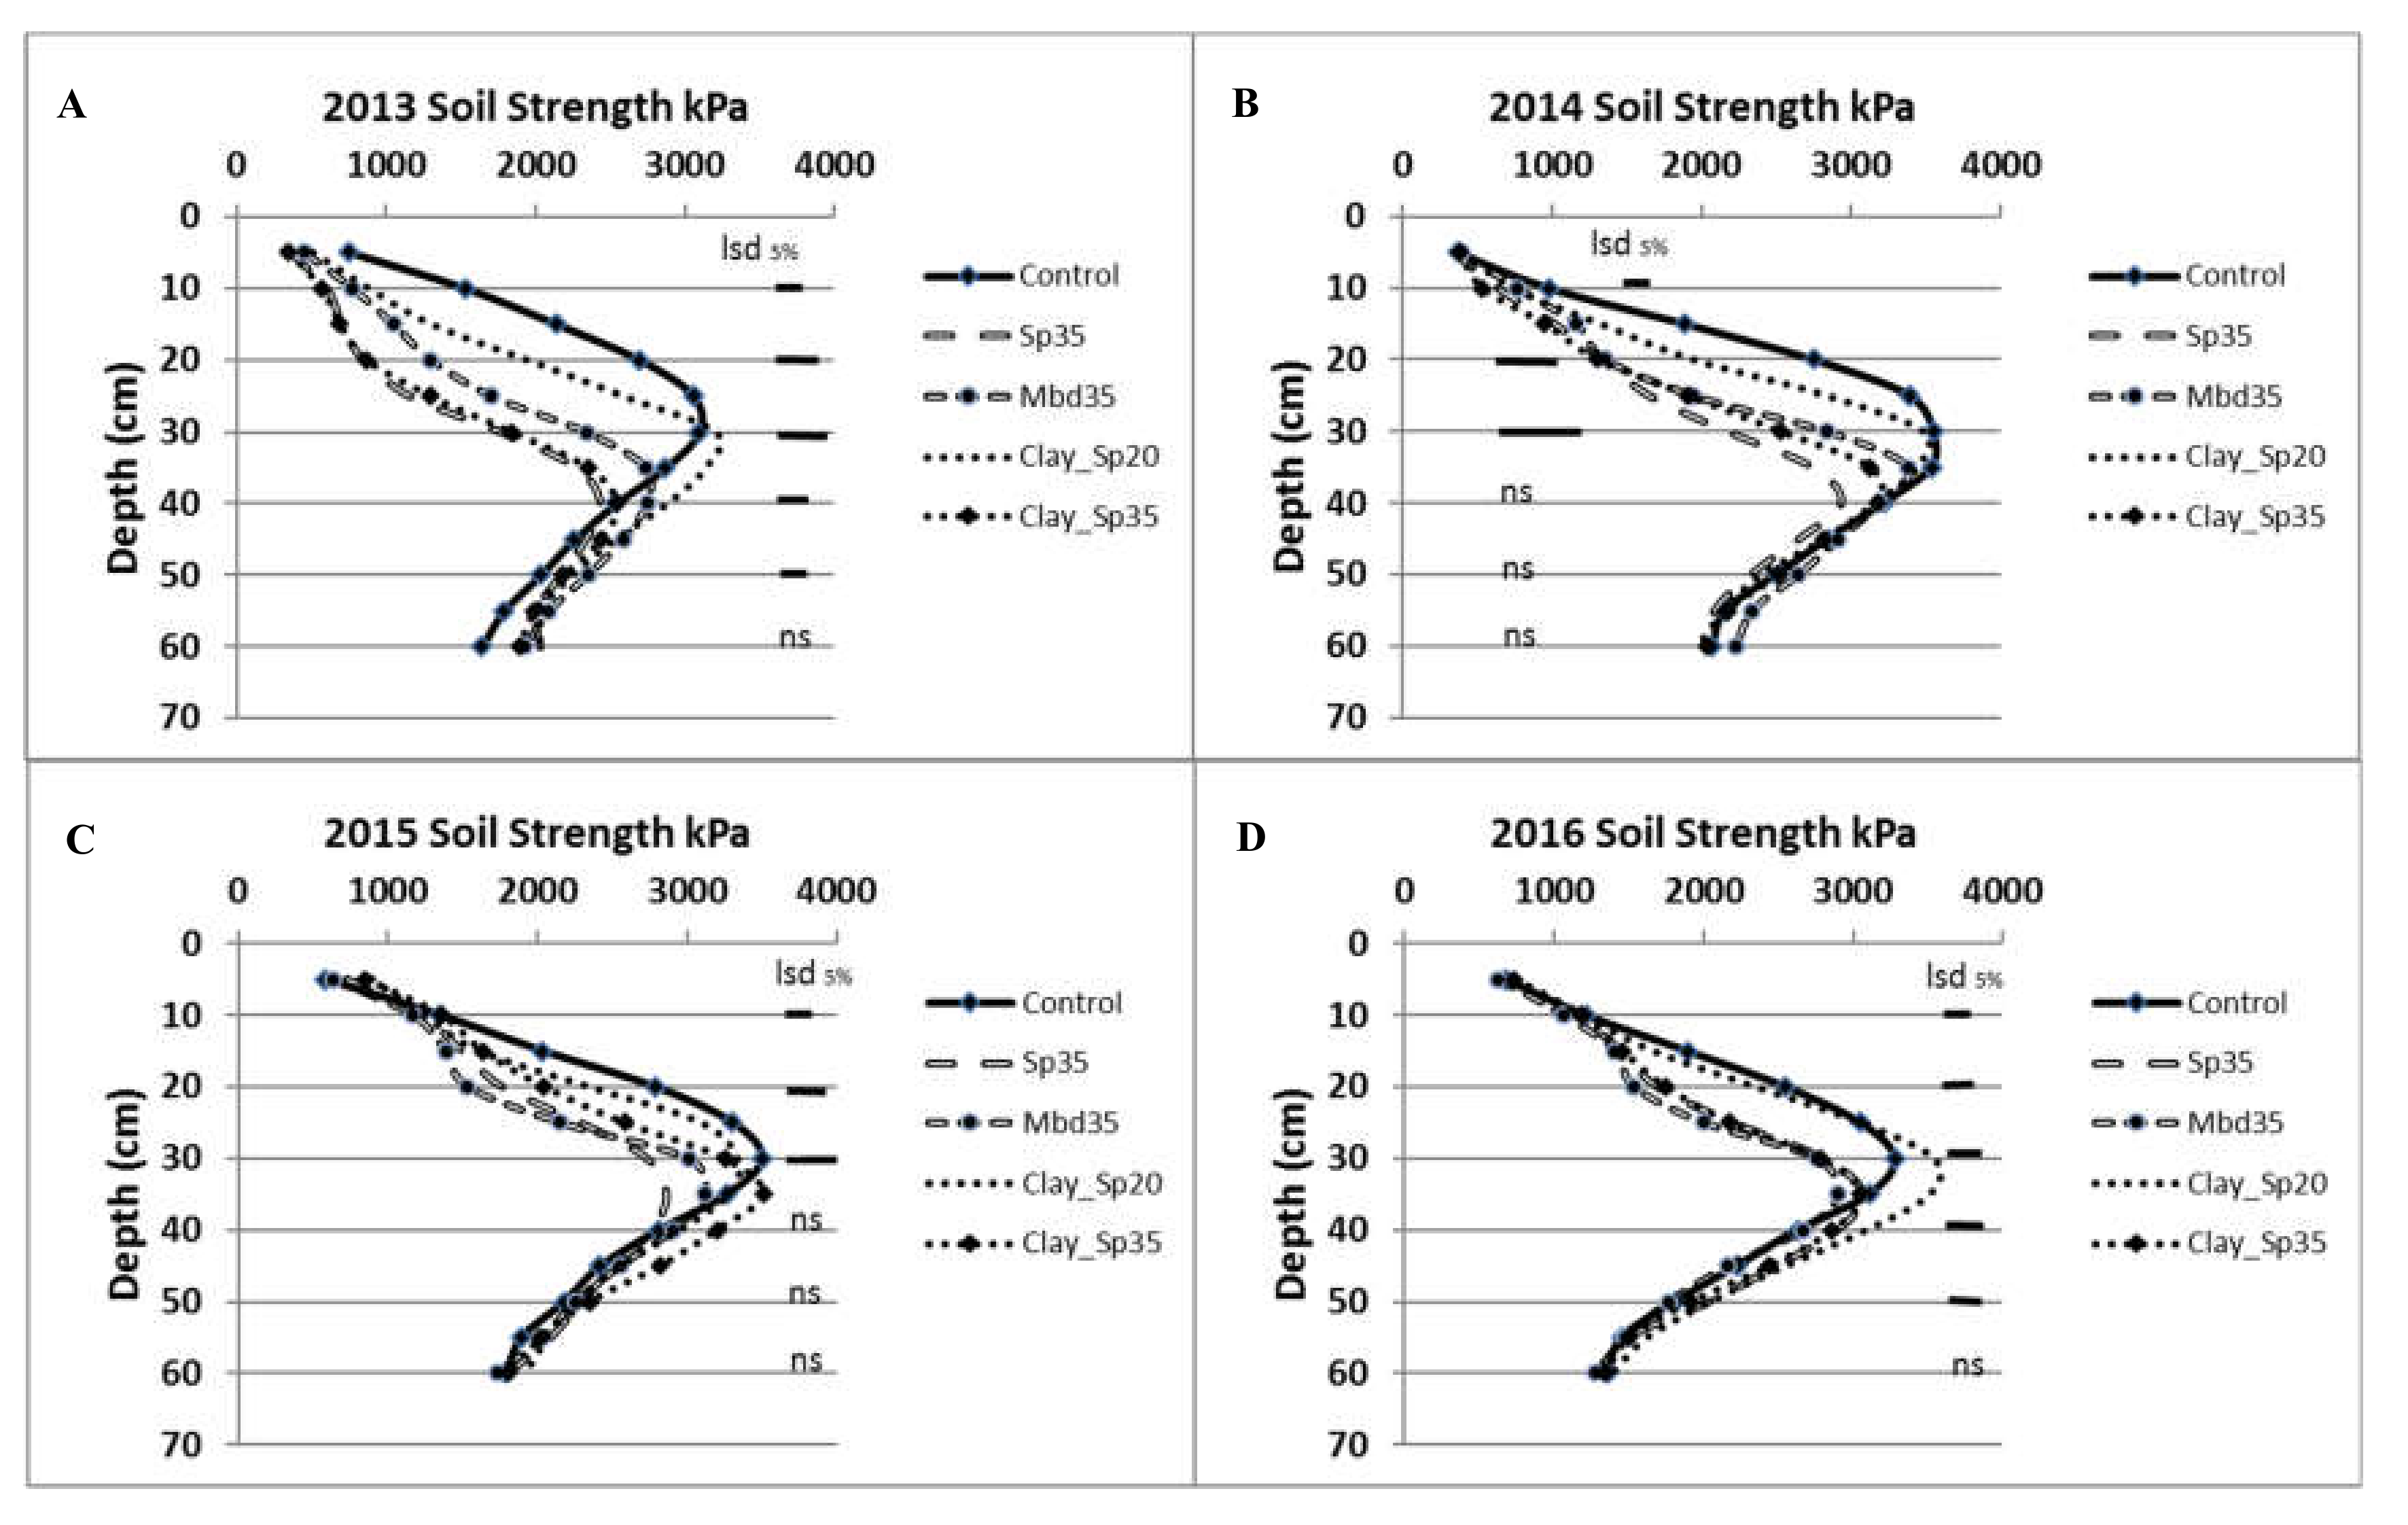
Soil strength exceeded 3000 kPa at a depth of 0.3 m in the Control treatment in all years measured. Values greater than 1500 kPa are likely to limit root growth while values greater than 3000 kPa are likely to stop root growth [70]. Few roots were observed below 40 cm in any treatment when sampled in 2017 [71]. Soil strength was reduced by the mouldboard ploughing and spaded treatments when compared to the Control in all years measured. Re-compaction of the mouldboard ploughed and spaded treatments resulted in diminishing differences in soil strength between these treatments and the Control with time. The absolute causes of the re-compaction are not known but are most likely due to machinery trafficking and natural soil wetting and drying cycles. Small plot spraying, seeding and harvesting equipment with axle loads less than 2.2 t followed the same tracks along the plots throughout the experiment. Such equipment, and the controlled traffic arrangement on plots would not be expected to re-compact soils beyond 0.25 m depth [72]. Natural forces, including cumulative rainfall [73], overburden pressure, and contraction of the soil matrix as water menisci evaporate during drying cycles [7], may also contribute to the re-compaction process in sands. That the largest yield increases in this experiment tended to have the lowest strength and that the differences in yield between the deep tilled treatments and the control have diminished over time, as has difference in soil strength, is unlikely to be a coincidence. In a review of deep tillage impacts on crop yield, [74] found that positive yield responses were associated with root-restricting layers, mostly compaction, in the soil profile and responses were greater in seasons with dry periods in the growing season. Hence, the present findings suggest that controlled traffic alone may not be sufficient to avoid re-compaction of soils such as those on the sandplains of southwest Australia, as suggested by [75] in their recently commentary.
The economic analysis has shown that the PairedR, Mbd35 and Sp35 treatments were the most profitable treatments over the 5-year period. In other studies, inversion ploughing with paired row seeding has given a AUD 33 ha−1 increases in profitability in the first year after ploughing [62]. In a 3-year experiment, inversion ploughing increased the cumulative net financial return by AUD 777 ha−1 and spading treatments by AUD 624–730 ha−1 over the untreated control on a water repellent duplex sandy gravel ([13], Abruptic Plinthosol) [62]. The clayed treatments were not as profitable as the control after five years. This is consistent with other studies that have shown claying to take up to seven years to break-even on sandplain soils [17].

5. Conclusions

Multiple constraints were ameliorated primarily by using strategic deep tillage and clay addition on sandplain soils in southern WA. Topsoil water repellence was reduced from being very severe-to-low as a result of the strategic deep tillage and applied clay treatments. There was no evidence at the end of five years to show that the water repellence was redeveloping following strategic deep tillage either with or without clay addition. Despite the reduction in water repellence, plant emergence was improved in only two of the five years. Both of these years (2014, 2015) had growing season rainfall at or below rainfall Decile 4 and affected barley and canola crops, respectively. Soil C, N and S were reduced in the 0.1 m layer while C and N were increased at lower depths as a result of the deep tillage treatments. Soil K was increased by the addition of clay and in most seasons the clayed treatment had higher shoot K concentrations than the control. Soil strength was reduced by the strategic deep tillage treatments and achieved penetration resistance values less than 2500 kPa to a depth of 0.3 m in the first year of the experiment. The finding that cumulative grain yield for the Sp35 treatment was identical to the Clay_Sp35 treatment suggests that K nutrition, inclusive of K applied in fertilizer at seeding, and topsoil water repellence were lesser soil constraints than compaction at this site. In successive years, the difference in penetration resistance between the deep tillage treatments and the control diminished to the extent that few roots were found below 0.4 m in any treatment [70]. This is mainly attributed to natural consolidation as opposed to machinery induced compaction. It is likely that the re-compaction process also resulted in reduced yield differences between the deep tillage treatments and the control over time. Given that high penetration resistance was found below 0.35 m, further increases in yield may occur with deeper soil loosening at this site. The strategic deep tillage and clay addition treatments increased cumulative crop yields by 2.1–2.6 t ha−1 compared to the control over the five years of the experiment. Only the paired row, Sp35 and Mbd35 treatments were more profitable than the control. Indeed, the Mbd35 treatment increased the NPV by AUD 653 relative to the Control.

Author Contributions

D.J.M.H., S.L.D. and R.W.B. conceived the concepts of the manuscript; D.J.M.H. and T.J.E. performed the data collection; analysed the data and literature and wrote the manuscript. D.J.M.H., S.L.D. and R.W.B. obtained the funding. All authors have read and agreed to the published version of the manuscript.

Funding

We would like to thank Grains Research and Development Corporation and the Department of Primary industries and Regional Development for investing in this research through the projects DAW00244, DAW00242 and UMU00041.

Acknowledgments

The experiment was established with the help of local farmers, Nils Blumann, Greg Harris and Peter Luberda and the machinery dealership PH Kerr and Son. Invaluable technical support was provided by Chris Matthews and David Dodge.

Conflicts of Interest

The authors declare no conflict of interest.

References

  1. Scanlan, C.A.; Holmes, K.W.; Bell, R.W. Chapter 8: Sand and gravel subsoils. In Subsoil Constraints for Crop Production; Oliveira, T.S., Bell, R.W., Eds.; Springer: Berlin/Heidelberg, Germany, 2021. [Google Scholar]
  2. Van Gool, D. Identifying Soil Constraints that Limit Wheat Yield in the South-West of Western Australia; Report RMTR 399; Department of Agriculture and Food: Perth, Australia, 2016. [Google Scholar]
  3. Morgan, K.H.; Peers, R. Esperance-Mondrain Island, Western Australia. 1:250,000 Geological Series—Explanatory Notes; Geological Survey of Western Australia: Perth, Australia, 1973. [Google Scholar]
  4. McArthur, W.M. Reference Soils of South-Western Australia; Reprinted; Department of Agriculture and Food: Perth, Australia, 2004. [Google Scholar]
  5. Bodman, G.; Constantin, G. Influence of particle size distribution in soil compaction. Hilgardia 1965, 36, 567–591. [Google Scholar] [CrossRef]
  6. Needham, P.; Moore, G.; Scholz, G. Subsurface compaction. In SoilGuide: A Handbook for Understanding and Managing Agricultural Soils; Bulletin 4343; Department of Agriculture: Perth, Australia, 2004. [Google Scholar]
  7. Mullins, C.E.; Panayiotopoulos, K.P. Compaction and shrinkage of sands and sand-kaolin mixtures. Soil Tillage Res. 1984, 4, 191–198. [Google Scholar] [CrossRef]
  8. Alakukku, L.; Weisskopf, P.; Chamen, W.C.T.; Tijink, F.G.J.; Van Der Linden, J.P.; Pires, S.; Sommer, C.; Spoor, G. Prevention strategies for field traffic-induced subsoil compaction: A review: Part 1. Machine/soil interactions. Soil Tillage Res. 2003, 73, 145–160. [Google Scholar] [CrossRef]
  9. Hamza, M.A.; Anderson, W.K. Soil compaction in cropping systems: A review of the nature, causes and possible solutions. Soil Tillage Res. 2005, 82, 121–145. [Google Scholar] [CrossRef]
  10. Roper, M.M.; Davies, S.L.; Blackwell, P.S.; Hall, D.J.M.; Bakker, D.M.; Jongepier, R.; Ward, P.R. Management options for water-repellent soils in Australian dryland agriculture. Soil Res. 2015, 53, 786–806. [Google Scholar] [CrossRef]
  11. Hall, D. Water repellence. In Managing South Coast Sandplain Soils to Yield Potential; Bulletin 4773; Department of Agriculture and Food: Perth, Australia, 2009. [Google Scholar]
  12. Hall, D.J.M.; Bell, R.W. Biochar and compost increase crop yields but the effect is short term on sandplain soils of Western Australia. Pedosphere 2015, 25, 720–728. [Google Scholar] [CrossRef] [Green Version]
  13. IUSS Working Group WRB. World Reference Base for Soil Resources 2014; Schad, P., van Huyssteen, C., Micheli, E., Eds.; World Soil Resources Reports No. 106; FAO: Rome, Italy, 2014; ISBN 978-92-5-108369-7. [Google Scholar]
  14. Henderson, C.; Levett, A.; Lisle, D. The effects of soil water content and bulk density on the compactibility and soil penetration resistance of some Western Australian sandy soils. Soil Res. 1988, 26, 391–400. [Google Scholar] [CrossRef]
  15. Crabtree, W.L. Cereal grain yield responses to deep ripping on duplex soils. Anim. Prod. Sci. 1989, 29, 691–694. [Google Scholar] [CrossRef]
  16. Henderson, C.W.L. Sensitivity of eight cereal and legume species to the compaction status of deep, sandy soils. Anim. Prod. Sci. 1991, 31, 347–355. [Google Scholar] [CrossRef]
  17. Hall, D.J.M.; Jones, H.R.; Crabtree, W.L.; Daniels, T.L. Claying and deep ripping can increase crop yields and profits on water repellent sands with marginal fertility in southern Western Australia. Soil Res. 2010, 48, 178–187. [Google Scholar] [CrossRef]
  18. Martínez, I.G.; Prat, C.; Ovalle, C.; del Pozo, A.; Stolpe, N.; Zagal, E. Subsoiling improves conservation tillage in cereal production of severely degraded Alfisols under Mediterranean climate. Geoderma 2012, 189–190, 10–17. [Google Scholar] [CrossRef]
  19. Singh, K.; Choudhary, O.P.; Singh, H.P.; Singh, A.; Mishra, S.K. Sub-soiling improves productivity and economic returns of cotton-wheat cropping system. Soil Tillage Res. 2019, 189, 131–139. [Google Scholar] [CrossRef]
  20. Crabtree, W.L.; Henderson, C.W.L. Furrows, press wheels and wetting agents improve crop emergence and yield on water repellent soils. Plant Soil 1999, 214, 1–8. [Google Scholar] [CrossRef]
  21. Ward, P.R.; Roper, M.M.; Jongepier, R.; Micin, S.F. Impact of crop residue retention and tillage on water infiltration into a water-repellent soil. Biologia 2015, 70, 1480–1484. [Google Scholar] [CrossRef]
  22. Bakker, D.; Poulish, G.; Davies, S. Water repellence and productivity of lateritic gravelly podosols in South West Australia. Geoderma Reg. 2019, 17, e00223. [Google Scholar] [CrossRef]
  23. Davies, S.L.; Armstrong, R.; Macdonald, L.; Condon, J.; Petersen, E. Soil Constraints: A Role for Strategic Deep Tillage. In Australian Agriculture in 2020: From Conservation to Automation; Pratley, J., Kirkegaard, J., Eds.; Agronomy Australia and Charles Sturt University: Wagga Wagga, Australia, 2019; pp. 117–135. ISBN 978–0-6485819-0-1. [Google Scholar]
  24. Scanlan, C.A.; Davies, S.L. Soil mixing and redistribution by strategic deep tillage in a sandy soil. Soil Tillage Res. 2019, 185, 139–145. [Google Scholar] [CrossRef]
  25. Blackwell, P.; Hagan, J.; Davies, S.; Bakker, D.; Hall, D.; Roper, M.; Ward, P.R.; Matthews, A. Smart no-till furrow sowing to optimise whole-farm profit on non-wetting soil. Agribus. Crop Updates 2014, 24–25. [Google Scholar]
  26. Van der Ploeg, R.R.; Bohm, W.; Kirkham, M.B. On the Origin of the Theory of Mineral Nutrition of Plants and the Law of the Minimum. Soil Sci. Soc. Am. J. 1999, 63, 1055–1062. [Google Scholar] [CrossRef] [Green Version]
  27. Hall, D.; Bell, R.; Sochacki, S.; Davies, S. Long Term Effects of Claying on Non-Wetting and Plant Nutrition; Agribusiness Crop Updates: Perth, Australia, 2015. [Google Scholar]
  28. Davenport, D.; Hughes, B.; Davies, S.; Hall, D. Spread, Delve, Spade, Invert: A Best Practice Guide to the Addition of Clay to Sandy Soils; Rural Solution SA, Agricultural Bureau of South Australia, Caring for our Country; Grains Research Development Corporation: Kingston, Australia, 2011; ISBN 978-1-921779-27-5. [Google Scholar]
  29. Çelik, İ.; Günal, H.; Acar, M.; Acir, N.; Barut, Z.B.; Budak, M. Strategic tillage may sustain the benefits of long-term no-till in a Vertisol under Mediterranean climate. Soil Tillage Res. 2019, 185, 17–28. [Google Scholar] [CrossRef]
  30. Dang, Y.; Moody, P.; Bell, M.; Seymour, N.; Dalal, R.; Freebairn, D.; Walker, S. Strategic tillage in no-till farming systems in Australia’s northern grains-growing regions. II. Implications for agronomy, soil and environment. Soil Tillage Res. 2016, 152, 115–123. [Google Scholar] [CrossRef]
  31. Quincke, J.A.; Wortmann, C.S.; Mamo, M.; Franti, M.T.; Drijber, R.A. Occasional tillage of no-till systems: Carbon dioxide flux and changes in total and labile soil organic carbon. Agron. J. 2007, 99, 1158–1168. [Google Scholar] [CrossRef]
  32. Conyers, M.; van der Rijt, V.; Oates, A.; Poile, G.; Kirkegaard, J.; Kirkby, C. The strategic use of minimum tillage within conservation agriculture in southern New South Wales, Australia. Soil Tillage Res. 2019, 193, 17–26. [Google Scholar] [CrossRef]
  33. Liu, H.; Carvalhais, L.C.; Rincon-Florez, V.; Crawford, M.; Dang, Y.P.; Dennis, P.G.; Schenk, P.M. One-time strategic tillage does not cause major impacts on soil microbial properties in a no-till Calcisol. Soil Tillage Res. 2016, 158, 91–99. [Google Scholar] [CrossRef]
  34. Isbell, R.F. National Committee on Soil and Terrain. The Australian Soil Classification, 2nd ed.; CSIRO Publishing: Collingwood, Australia, 2016. [Google Scholar]
  35. Roberts, F.J. The effects of sand type and fine particle amendments on the emergence and growth of subterranean clover (Trifolium subterraneun L.) with particular reference to water relations. Crop Pasture Sci. 1966, 17, 657–672. [Google Scholar] [CrossRef]
  36. Harper, R.J.; Gilkes, R.J. Soil attributes related to water repellency and the utility of soil survey for predicting its occurrence. Soil Res. 1994, 32, 1109–1124. [Google Scholar] [CrossRef]
  37. Oliver, Y.M.; Robertson, M.J.; Stone, P.J.; Whitbread, A. Improving estimates of water-limited yield of wheat by accounting for soil type and within-season rainfall. Crop Pasture Sci. 2009, 60, 1137–1146. [Google Scholar] [CrossRef]
  38. Robertson, M.J.; Kirkegaard, J.A. Water-use efficiency of dryland canola in an equi-seasonal rainfall environment. Aust. J. Agric. Res. 2006, 56, 1373–1386. [Google Scholar] [CrossRef]
  39. King, P.M. Comparison of methods for measuring severity of water repellence of sandy soils and assessment of some factors that affect its measurement. Soil Res. 1981, 19, 275–285. [Google Scholar] [CrossRef]
  40. Rayment, G.E.; Lyons, D.J. Soil Chemical Methods—Australasia. In Australian Soil and Land Survey Handbooks Series; CSIRO Publishing: Collingwood, Australia, 2010. [Google Scholar]
  41. Blair, G.J.; Chinoim, N.; Lefroy, R.D.; Anderson, G.C.; Crocker, G.J. A soil sulfur test for pastures and crops. Soil Res. 1991, 29, 619–626. [Google Scholar] [CrossRef]
  42. Indorante, S.J.; Hammer, R.D.; Koenig, P.G.; Follmer, L.R. Particle-size analysis by a modified pipette procedure. Soil Sci. Soc. Am. J. 1990, 54, 560–563. [Google Scholar] [CrossRef]
  43. McQuaker, N.R.; Brown, D.F.; Kluckner, P.D. Digestion of environmental materials for analysis by inductively coupled plasma-atomic emission spectrometry. Anal. Chem. 1979, 51, 1082–1084. [Google Scholar] [CrossRef]
  44. Reuter, D.J. Nutrient Balance in Regional Farming Systems and Soil Nutrient Status; National Land and Water Resources Audit Final Report September; NLWRA: Canberra, Australia, 2001. [Google Scholar]
  45. Schultz, J.E.; French, R.J. The mineral content of cereals, grain legumes and oilseed crops in South Australia. Aust. J. Exp. Agric. 1978, 18, 579–585. [Google Scholar] [CrossRef]
  46. Davies, S.; Blackwell, P.; Bakker, D.; Scanlan, C.; Roper, M.; Ward, P. Developing and Accessing Agronomic Strategies for Water Repellent Soils; WA Agribusiness Crop Updates: Perth, Australia, 2012. [Google Scholar]
  47. Davies, S.; Betti, G.; Edwards, T.; McDonald, G.; Hall, D.; Anderson, G.; Scanlan, C.; Reynolds, C.; Walker, J.; Poulish, G.; et al. Ten Years of Managing Water Repellent Soils Research in Western Australia—A Review of Current Progress and Future Opportunities; Grains Research Updates; Grains Research and Development Corporation: Perth, Australia, 2019. [Google Scholar]
  48. VSN International Genstat for Windows, 19th ed.; VSN International: Hemel Hempstead, UK, 2019; Available online: https://www.vsni.co.uk/software/genstat/ (accessed on 1 May 2018).
  49. Reuter, D.J.; Robinson, J.B. Plant Analysis: An Interpretation Manual, 2nd ed.; CSIRO Publishing: Collingwood, Australia, 1997. [Google Scholar]
  50. Roper, M.M. Potential for remediation of water repellent soils by inoculation with wax-degrading bacteria in south-western Australia. Biologia 2006, 61, S358–S362. [Google Scholar] [CrossRef]
  51. Azam, G.; Gazey, C. Slow movement of alkali from surface-applied lime warrants the introduction of strategic tillage for rapid amelioration of subsurface acidity in south-western Australia. Soil Res. 2020. [Google Scholar] [CrossRef]
  52. Dempster, D.N.; Jones, D.L.; Murphy, D.V. Clay and biochar amendments decreased inorganic but not dissolved organic nitrogen leaching in soil. Soil Res. 2012, 50, 216–221. [Google Scholar] [CrossRef]
  53. Grover, S.P.; Butterly, C.R.; Wang, X.; Gleeson, D.B.; Macdonald, L.M.; Hall, D.J.M.; Tang, C. An agricultural practise with climate and food security benefits: “Claying” with kaolinitic clay subsoil decreased soil carbon priming and mineralisation in sandy cropping soils. Sci. Total Environ. 2020, 709, 134488. [Google Scholar] [CrossRef]
  54. Schapel, A.; Davenport, D.; Marschner, P. Increases in organic carbon concentration and stock after clay addition to sands: Validation of sampling methodology and effects of modification method. Soil Res. 2017, 55, 124–133. [Google Scholar] [CrossRef]
  55. Hoyle, F.C.; D’Antuono, M.; Overheu, T.; Murphy, D.V. Capacity for increasing soil organic carbon stocks in dryland agricultural systems. Soil Res. 2014, 51, 657–667. [Google Scholar] [CrossRef] [Green Version]
  56. French, R.J.; Seymour, M.; Malik, R.S. Plant density response and optimum crop densities for canola (Brassica napus L.) in Western Australia. Crop Pasture Sci. 2016, 67, 397–408. [Google Scholar] [CrossRef]
  57. Anderson, W.K. Some relationships between plant population, yield components and grain yield of wheat in a Mediterranean environment. Crop Pasture Sci. 1986, 37, 219–233. [Google Scholar] [CrossRef]
  58. Anderson, W.K.; Sharma, D.L.; Shackley, B.J.; D’Antuono, M.F. Rainfall, sowing time, soil type, and cultivar influence optimum plant population for wheat in Western Australia. Crop Pasture Sci. 2004, 55, 921–930. [Google Scholar] [CrossRef]
  59. Roper, M.M.; Ward, P.R.; Keulen, A.F.; Hill, J.R. Under no-tillage and stubble retention, soil water content and crop growth are poorly related to soil water repellency. Soil Tillage Res. 2013, 126, 143–150. [Google Scholar] [CrossRef]
  60. Hollist, R.L.; Foy, C.L. Trifluralin interactions with soil constituents. Weed Sci. 1971, 19, 11–16. [Google Scholar] [CrossRef]
  61. Edwards, T.; Betti, G.; Hall, D.; Davies, S.; Sinnot, A. Ripping and Clay Delving Responses on Shallow Clay Duplex Soil: First Year Results from a Site at Grass Patch WA; Research Updates: Perth, Australia, 2018. [Google Scholar]
  62. Davies, S.; Blackwell, P.; Scanlan, C.; Best, B.; Bakker, D.; Hagan, J.; Falconer, K.L. Grower Adoption and Implementation of Strategies to Manage Soil Water Repellence in Farming Systems; Agribusiness Crop Updates: Perth, Australia, 2013. [Google Scholar]
  63. Davies, S.; Boyes, T.; Petersen, L.; Reynolds, C.; Walker, J.; Fulwood, T.; Dempster, R. Comparing strategic deep tillage options on soil constraint removal and crop performance across two soil types in Western Australia. In Proceedings of the 2019 Agronomy Australia Conference, Wagga Wagga, Australia, 25–29 August 2019. [Google Scholar]
  64. Unkovich, M.; McBeath, T.; Llewellyn, R.; Hall, J.; Gupta VSR, V.; Macdonald, L.M. Challenges and opportunities for grain farming on sandy soils of semi-arid south and south-eastern Australia. Soil Res. 2020, 58, 323–334. [Google Scholar] [CrossRef]
  65. Davies, S.L.; Bakker, D.M.; Scanlan, C.A.; Gazey, C.; Hall, D.J.; Riethmuller, G.P.; Abrecht, D.G.; Newman, P.D.; Harding, A.; Hayes, D.W.; et al. Deep soil cultivation to create improved soil profiles for dryland crop production. In Proceedings of the 2013 Society for Engineering in Agriculture Conference: Innovative Agricultural Technologies for a Sustainable Future; Engineers Australia: Perth, Australia, 2013; pp. 410–420. [Google Scholar]
  66. Betti, G.; Davies, S.L.; Reynolds, C.D. How Can We Ameliorate Water Repellent Soils Cost Effectively? Indications from Three Trials in WA; GRDC Research Updates: Perth, Australia, 2018. [Google Scholar]
  67. Gazey, C.; Davies, S.; Master, R. Soil Acidity: A Guide for WA Farmers and Consultants; Bulletin 4858; Department of Agriculture and Food: Perth, Australia, 2014. [Google Scholar]
  68. Fageria, V.D. Nutrient interactions in crop plants. J. Plant Nutr. 2001, 24, 1269–1290. [Google Scholar] [CrossRef]
  69. Douglas, A.; Peltzer, S.C. Managing herbicide resistant annual ryegrass (Lolium rigidum Gaud) in no-till systems in Western Australia using occasional inversion ploughing. In Proceedings of the 14th Australian Weeds Conference, Wagga Wagga, NSW, Australia, 6–9 September 2004; pp. 300–303. [Google Scholar]
  70. Young, I.M.; Montagu, K.; Conroy, J.; Bengough, A.G. Mechanical impedance of root growth directly reduces leaf elongation rates of cereals. New Phytol. 1997, 135, 613–619. [Google Scholar] [CrossRef]
  71. Timmins, A. Discerning Biological, Physical and Chemical Changes to Agriculturally Inverted Soils on the Esperance sand Plain; University of Western Australia: Perth, Australia, 2018. [Google Scholar]
  72. Antille, D.L.; Bennett, J.M.; Jensen, T.A. Soil compaction and controlled traffic considerations in Australian cotton-farming systems. Crop Pasture Sci. 2016, 67, 1–28. [Google Scholar] [CrossRef]
  73. Busscher, W.J.; Bauer, P.J.; Frederick, J.R. Recompaction of a coastal loamy sand after deep tillage as a function of subsequent cumulative rainfall. Soil Tillage Res. 2002, 68, 49–57. [Google Scholar] [CrossRef]
  74. Schneider, F.; Don, A.; Hennings, I.; Schmittmann, O.; Seidel, S.J. The effect of deep tillage on crop yield—What do we really know? Soil Tillage Res. 2017, 174, 193–204. [Google Scholar] [CrossRef]
  75. Bluett, C.; Tullberg, J.N.; McPhee, J.E.; Antille, D.L. Soil and Tillage Research: Why still focus on soil compaction? Soil Tillage Res. 2019, 194, 1–2. [Google Scholar] [CrossRef]
Figure 1. Effect of the tillage main treatments on water repellence as measured by the molarity of ethanol droplet (MED) test on soils collected to a depth of 0–0.10 m. Measurements made during 2014, 2015 and 2016 prior to seeding and wetter application. The LSD (p ≤ 0.05) shown is the maximum value calculated over the three years. Treatment abbreviations are listed in Table 2.
Agronomy 10 01881 g001
Figure 2. Effect of tillage and clay treatments on soil pHCaCl2 without lime (A), soil pHCaCl2 with lime added (B) clay % (C), organic carbon (OC%) (D), sum of nitrate and ammonium (mg kg−1) (E) extractable S (mg kg−1) (F) Colwell-extractable K (KCol)(mg kg−1) (G) and Colwell-extractable P (PCol) (mg kg−1) (H) at four depths 0–0.1, 0.1–0.2, 0.2–0.3 and 0.3–0.4 m. Data collected in June 2017. Treatment abbreviations are listed in Table 2. Horizontal bars represent the LSD (p ≤ 0.05) for the corresponding depth; ns- not significant (p ≤ 0.05).
Agronomy 10 01881 g002aAgronomy 10 01881 g002b
Figure 3. Soil strength as affected by the control, spaded (±clay) (Sp35) and mouldboard ploughed (Mbd) treatments. Measurements recorded during the winter months of 2013 (A), 2014 (B), 2015 (C) and 2016 (D). Treatment abbreviations are listed in Table 2. Horizontal bars represent the LSD (p ≤ 0.05) for the corresponding depth; ns- not significant (p = 0.05).
Agronomy 10 01881 g003
Figure 4. Reduction in soil strength between the Control and the treatment spaded to 35 cm depth (Sp35) (A) and between the Control and the treatment mouldboard ploughed to 35 cm depth (Mbd35) (B) to 60 cm depth for each year (2013–2016). Positive values occur where soil strength for the Sp35 and Mbd35 treatments exceed that of the Control. Horizontal bars represent the LSD (p ≤ 0.05) for the corresponding depth; ns- not significant (p ≤ 0.05).
Agronomy 10 01881 g004
Figure 5. Treatment effects on cumulative nutrient balances (kg/ha) for Nitrogen (A), Phosphorus (B), Potassium (C) and Sulfur (D) for the years 2012 to 2016. Vertical bars represent the LSD (p ≤ 0.05) for the corresponding year; ns is not significant (p > 0.05). Note K fertiliser was only added in 2012 and 2015. Treatment abbreviations are listed in Table 2.
Agronomy 10 01881 g005
Table 1. Initial soil properties including soil strength (cone index, CI), water repellence using the molarity of ethanol droplet test (MED), electrical conductivity (EC), organic carbon (OC), pHCaCl2, exchangeable Al, extractable P, K and S and cation exchange capacity (CEC) for the deep sand profile and the clay-rich subsoil material applied to the clay treatments at the experimental site.
DepthCIMEDOCpHCaCl2PKSAlCEC
mkPa % mg kg−1cmol (+) kg−1
0–0.115303.11.35.21238160.053.0
0.1–0.2269000.64.982290.101.3
0.2–0.3305000.34.8131540.110.9
0.3–0.4254000.14.9171640.170.7
0.4–0.52030 0.15.0261840.200.8
0.5–0.7 0.15.2112640.290.9
Applied clay rich subsoil00.18.02109023<0.00114.7
Table 2. Treatment descriptions including implements, depths and application rates.
NoMain TreatmentTreatment CodeLime Rate
1.Control—knife pointControl±Lime 2 t ha−1
2.Wetting Agent (8 L ha−1)Wetter±Lime 2 t ha−1
3.Seeding system—DiscDisc±Lime 2 t ha−1
4.Seeding system—Winged pointWingedP±Lime 2 t ha−1
5.Seeding system—Paired rowPairedR±Lime 2 t ha−1
6.Spader to 0.35 mSp35±Lime 2 t ha−1
7.Mouldboard plough to 0.35 mMbd35±Lime 2 t ha−1
8.Spader 0.2 m + Clay 170 t ha−1Clay_Sp20±Lime 2 t ha−1
9.Spader 0.35 m + Clay 170 t ha−1Clay_Sp35± Lime 2 t ha−1
Table 3. Crop species, varieties, seeding rates, fertilizer applications, seeding and harvest dates, annual rainfall total, rainfall decile and calculated potential yield for the experimental site between 2012 and 2016.
Year
Variable20122013201420152016
CropWheatCanolaBarleyCanolaWheat
VarietyMaceHentyBassWahooMace
Seeding date5 July13 May27 May5 May20 May
Seeding rate kg ha−1905103590
Fertilizer N:P:K:S kg ha−139:14:0:963:10:29:1032:9:0:13116:9:60:2056:14:0:43
Ann Rainfall mm511626410470539
Rainfall Decile610247
Rainfall limited yield potential (t ha−1)3.83.33.22.74.0
Table 4. Crop establishment (plants m−2) for wheat (2012, 2016), canola (2013, 2015) and barley (2014). Treatment abbreviations are listed in Table 2.
Treatment20122013201420152016
CropWheatCanolaBarleyCanolaWheat
Control158 ab79 b116 a38 a151 c
Disc +142 abNANANANA
WingedP182 c74 b135 b41 bc130 ab
PairedR153 ab75 b145 b37 ab119 a
Wetter162 bc74 b121 a31 a136 ab
Sp35141 ab76 b139 b43 bc148 bc
Mbd35144 ab58 a116 a40 b140 b
Clay_Sp20154 ab76 b134 b54 d160 c
Clay_Sp35139 a73 b145 b51 cd160 c
+ Mechanical problems with the disc seeder prevented even establishment in the years after 2012. NA measurement not available. Means in each column followed by the same letter were not significantly (p < 0.05) different.
Table 5. Grain yields (t ha−1) for wheat (2012, 2016), canola (2013, 2015) and barley (2014) as affected by the main treatments. Treatment abbreviations are given in Table 2.
Treatment20122013201420152016Total
CropWheatCanolaBarleyCanolaWheat
Control1.01 a2.08 a2.04 a1.81 abc4.32 ab11.2 a
Disc1.18 abNANANANANA
PairedR0.96 a2.33 ab2.12 a1.94 ab4.28 ab11.6 a
Wetter1.08 a2.08 a1.84 a1.42 ab3.91 a10.6 a
WingedP1.01 a2.15 ab1.93 a1.31 a4.15 a10.3 a
Sp351.71 d2.22 ab3.08 c1.94 abc4.72 bc13.7 b
Mbd351.74 d2.33 abc2.92 c2.30 c4.55 bc13.8 b
Clay_Sp201.46 cd2.57 c2.56 b2.15 c4.64 bc13.4 b
Clay_Sp351.43 bc2.38 bc2.97 c1.99 bc4.91 c13.7 b
NA measurement not available. Means in each column followed by the same letter were not significantly (p < 0.05) different.
Table 6. Shoot nutrient concentrations as affected by the tillage and clay main treatments collected in each of the cropping years from 2012 to 2016. The plant part sampled was the flag leaf (2012) and whole shoots in all other years. Plant samples were collected in early September of each year. Treatment abbreviations are listed in Table 2.
Year and CropTreatmentN %P %K %S %Ca %B mg kg−1Zn mg kg−1
2012Control3.99 b0.34 c1.99 b0.27 b0.33 b 6.3 a18.3 a
WheatSp353.78 a0.30 a1.83 ab0.25 a0.35 b 6.3 a16.8 a
Mbd353.78 a0.30 a1.79 a0.25 a0.36 b 6.8 a17.4 a
Clay_Sp203.95 b0.32 b2.00 b0.27 b0.28 a18.9 b18.1 a
Clay_Sp353.90 ab0.32 b1.93 ab0.26 ab0.27 a18.5 b17.0 a
Probp < 0.02p < 0.02p < 0.06p < 0.01p < 0.001p < 0.001ns
LSD (p≤0.05)0.140.020.160.020.041.17
2013Control2.75 a0.45 a2.74 a0.31 a1.52 a26.0 a29.7 b
CanolaSp353.00 a0.51 ab2.90 ab0.31 a2.09 b29.0 ab27.0 ab
Mbd353.28 a0.54 b2.97 ab0.36 a1.94 b28.4 ab28.8 b
Clay_Sp202.67 a0.46 a3.33 bc0.27 a1.76 ab32.5 b24.7 a
Clay_Sp353.37 a0.50 ab3.53 c0.42 a1.75 ab32.2 b24.3 a
Probnsp < 0.04p < 0.02nsp < 0.03p < 0.04p < 0.02
LSD (p≤0.05) 0.060.48 0.344.383.88
2014Control1.77 a0.24 a1.74 a0.14 a0.27 a3.06 a24.8 a
BarleySp352.03 a0.27 a2.01 b0.17 b0.47 b3.52 a25.3 a
Mbd352.46 b0.29 a1.76 a0.19 b0.62 c3.48 a37.5 a
Clay_Sp202.04 a0.25 a2.57 d0.17 b0.36 a5.07 b27.0 a
Clay_Sp352.18 ab0.28 a2.35 c0.17 b0.35 a4.94 b27.8 a
Probp < 0.001nsp < 0.001p < 0.001p < 0.001p < 0.001ns
LSD (p ≤ 0.05)0.31 0.200.020.090.98
2015Control2.89 a0.29 a2.08 a0.36 a1.11 bc20.5 a38.9 c
CanolaSp352.91 a0.29 a2.52 b0.30 a1.14 c23.3 b33.2 b
Mbd353.37 a0.34 a2.66 b 0.31 a1.19 c24.1 b37.9 c
Clay_Sp202.70 a0.27 a3.18 c0.28 a0.91 a26.8 c26.5 a
Clay_Sp353.05 a0.34 a3.18 c0.30 a0.97ab 31.0 d30.8 b
Probnsnsp < 0.001nsp < 0.002p < 0.001p < 0.001
LSD (p ≤ 0.05) 0.34 0.142.514.18
2016Control2.15 a0.341.29 a0.17 a0.44 b2.92 a20.4 a
BarleySp352.25 a0.351.76 b0.17 a0.37 b2.57 a21.7 a
Mbd352.32 a0.381.83 b 0.18 a0.41 b2.76 a22.1 a
Clay_Sp202.27 a0.322.27 c0.16 a0.25 a3.21 a18.7 a
Clay_Sp352.29 a0.332.37 c0.17 a0.29 a2.98 a17.4 a
Probnsnsp < 0.001nsp < 0.001nsns
LSD (p ≤ 0.05) 0.26 0.07
Means in each column followed by the same letter were not significantly (p < 0.05) different.
Table 7. Effect of treatments on annual gross margins for the years 2012 to 2016.
AUD ha−1
20122013201420152016NPV5%ΔProfit
Control6392623977895624950
Wetter428861535238062037−458
WingedP639652145039112246−249
PairedR3910642478499382648153
Sp35102100347884910642952457
Mbd351501064442104710193148653
Clay_Sp20−591119635996510432442−53
Clay_Sp35−674109145387711162334−161
Net Present Value (NPV5%, AUD ha−1) discounted at a rate of 5% and the increase in NPV over the Control (ΔProfit).
Publisher’s Note: MDPI stays neutral with regard to jurisdictional claims in published maps and institutional affiliations.

