Article

Effect of Foliar Applied Acetylsalicilic Acid on Wheat (Triticum aestivum L.) under Field Conditions

1
Institute of Plant Protection—National Research Institute, Władysława Węgorka 20, 60-318 Poznan, Poland
2
Department of Mathematical and Statistical Methods, Poznan University of Life Sciences, Wojska Polskiego 28, 60-637 Poznan, Poland
*
Author to whom correspondence should be addressed.
Agronomy 2020, 10(12), 1918; https://doi.org/10.3390/agronomy10121918
Submission received: 30 October 2020 / Revised: 2 December 2020 / Accepted: 4 December 2020 / Published: 6 December 2020
(This article belongs to the Special Issue Effects of Biostimulants and Bioeffectors on Plant Growth)

Abstract

:
The exogenous application of salicylic acid prevents plant damage caused by various abiotic stresses (drought, high and low temperatures, salinity) and helps plants to build resistance to biotic stresses (pathogens). Acetylsalicylic acid, which is a synthetic salicylic acid derivative, has the same properties. In the face of climate change and a greater likelihood of extreme weather events, the use of these acids can significantly help to ensure proper growth and development of plants, especially sensitive species, even under stress conditions. The problem, however, is choosing the right dose (concentration) and time of application, and individual species sensitivity. The aim of the study was to assess the effect of acetylsalicylic acid on the growth and yield parameters of spring wheat. A field trial was carried out in 2013 and 2014 at the Institute of Plant Protection—National Research Institute in Poznan (Poland). The experiment was established on spring wheat cv. ‘Tybalt’, in four replications. Acetylsalicylic acid was tested in two concentrations: 0.3 and 0.5 mM. Each concentration was applied to the crop twice at growth stage BBCH 29 (end of tillering) and 7 days afterwards, and at growth stage BBCH 37 (flag leaf just visible) and 7 days afterwards. The study evaluated 12 traits of the crop, including plant height, chlorophyll content in the flag leaf, length of the ear, and quality and quantity parameters of the yield. The study showed that both the selection of the appropriate concentration and the time of acetylsalicylic acid application have a significant impact on the growth and development of the wheat. The acetylsalicylic acid increased the amount of chlorophyll in the leaves, the number of grains in the ear, the mass of a thousand grains, and grain yield. The present study did not confirm significant differences between the acetylsalicylic acid concentrations. The concentration of 0.5 mM proved more effective only for such traits as plant height and protein content in the grain. The study showed that it is not the concentration but the time of acetylsalicylic acid application that is more important for the growth of the wheat. Although there were no significant differences between the effects of earlier and later application time on plant height or chlorophyll content, most of the structural and qualitative parameters of the yield (number of grains in the ear, grain density, grain hardness, protein, gluten and starch content) were better after later application of acetylsalicylic acid (GS BBCH 37).

1. Introduction

Wheat, maize and rice make up the largest share of the world’s agricultural crop production. Together, these three crops provide food for over 4.5 billion people. The area devoted to wheat production alone covers 220 million ha [1,2,3]. Recently, more and more attention has been given to the impact of climate change on arable crops. Climate change and the higher frequency of extreme weather events will, undoubtedly, have an enormous impact on crops in the future. However, due to variable plant-environment interactions, it is difficult to predict the extent of yield losses [4,5]. It is believed that in the dry areas of Central Europe, periods of drought and heat stress will be the factors that limit crop yields to the greatest extent, especially if they occur during the critical periods of the crop growth cycle [1,6].
Wheat production depends largely on climatic and environmental conditions. Therefore, new wheat cultivars are expected to be more adaptable to any extreme weather conditions, while maintaining high- and good-quality yields [5,7]. During the growing season, plants are often exposed to occasional periods of drought. In the case of wheat, there is a linear reduction in yield along with a decrease in water availability. However, an overlap of several types of abiotic stress (drought, high temperature, salinity) can cause an even more dramatic drop in productivity. Water stress causes a drastic reduction in transpiration, leading to dehydration of tissues, damage to the photosynthetic apparatus and disruptions in plant metabolism [2,8]. Wheat needs water throughout the entire growth and development period, but when a water shortage occurs in the post-anthesis phase, crop losses can reach 30%, and during flowering and grain filling, these losses can even reach 58–92% [8,9].
Various adaptive agronomic strategies are introduced to minimize yield losses. Such strategies include the selection of appropriate cultivars, crop rotation, changes in soil cultivation, shift of sowing dates, proper selection of fertilizers and plant protection products [6]. In addition to farming and agricultural methods, increased attention is being paid to various natural or synthetic substances which can reduce the periodic impact of abiotic stress factors on crops. When applied to plants, these substances enhance processes stimulating the plant’s resistance to biotic (e.g., pathogens) and abiotic (inanimate nature factors) stresses. These substances, which are usually used in small amounts, can effectively protect the plant against stresses by enhancing its assimilation capacity, increasing the surface of leaves and root mass, improving the photosynthetic apparatus, etc. The scientific literature describes the beneficial effects of numerous substances, e.g., α-tocoferol, polyamines, L-ascorbate, glutathione, glycine betaine, putrescine, arginine, L-cysteine, glycine, spermine, spermidyne, hydrogen peroxide, silicone, alginic acid, polyphenols, trehalose, and yeast extract [10,11,12,13,14,15,16,17,18,19,20,21,22,23,24].
Compounds with a bio-stimulating effect in the regulation of plant development include phenolic acids, i.e., salicylic acid and its derivatives—acetylsalicylic acid and methyl salicylate [25]. Salicylic acid is a popular, organic, and easily available compound found in vascular plants. Organic acid metabolism plays a fundamental role at the cellular level, including energy production, the formation of amino acid biosynthesis precursors and the modulation of the plant response to environmental factors. The amount of naturally occurring organic acids in a plant depends on the species, age and tissue type. Their content in certain plants may be up to 100 times greater than in others, and often such differences occur within one family [26]. The highest amounts of salicylic acid are found in inflorescences of thermogenic plants and in plants infected with necrotizing pathogens [27].
Salicylates are produced primarily in mitochondria and stored mainly in vacuoles [28]. They play a significant role in regulating plant development and interactions with other organisms, and in the response to environmental stresses, including biotic stress e.g., pathogens [29,30]. They effectively protect plants against the harmful effects of high and low temperatures, salinity, heavy metals, UV radiation, ozone and water stress [31]. They are found in many agriculturally important plant species, such as rice, crabgrass, barley and soybean. Salicylates occur even in 1 µg·g−1 of fresh mass. When released to the rhizosphere, they exhibit an allelopathic effect by inhibiting the growth of neighboring plants [30,32].
The exogenous application of salicylic acid has a positive effect on plants, improving their resistance to low and high temperatures and also to drought stress by protecting cell membranes and the photosynthetic apparatus against destruction [25,33]. The effects of salicylic acid are relatively well known from the biochemical and physiological standpoint, but there are still doubts concerning the most effective method of administering it to plants (e.g., soaking seeds, foliar application or as an ingredient of the medium) and the most effective concentration (dose) [34]. It has been shown that even when used in small amounts (less than 1 mM), salicylic acid affects the metabolism of plants by activating the immune mechanisms. There are reports that salicylic acid increases the amount and quality of essential oils in basil and marjoram [25,35], improves maize productivity under conditions of temperature stress, and reduces damage to barley cell membranes. It also effectively prevents damage to bean, tomato, and maize crops caused by low temperatures, and by salt stress in the case of orange and mandarin [13,33,36,37]. Moreover, it has been reported that salicylic acid increases the accumulation of Cu, Co, Fe and Zn in sunflower shoots and roots. It also has a significant effect on IAA, GA and ABA plant hormones in sunflower, wheat and peas [38,39,40]. Wheat plants obtained from seeds soaked in salicylic acid demonstrate greater activity of antioxidant enzymes [34,41]. Salicylates used in rapeseed increase the concentration of glucosinolates [32]. Many authors pointed out that the effect of salicylic acid on plants depends largely on the concentration used [36]. A decrease in chlorophyll content was observed with an increased salicylic acid concentration in wheat, mung bean and barley leaves [42,43]. However, there are studies in the scientific literature suggesting that higher concentrations of salicylic acid may be toxic to plants [44,45,46].
Acetylsalicylic acid is not a natural product but a synthetic compound (trade name: Aspirin), which easily degrades to salicylic acid and has the same effect as the latter. Its undoubted advantage is its easy availability and low price.
The aim of the present study was to determine the effect of acetylsalicylic acid on morphological and physiological traits, as well as on the amount and quality of spring wheat yield. The research hypothesis is that the foliar application of acetylsalicylic acid has a positive effect on wheat plants, but the effect depends on the concentration used and the time of application. Studies carried out so far on the exogenous application of salicylic acid and its derivatives have primarily focused on the concentrations of these compounds. Meanwhile, there are no reports related to the impact of the crop’s growth stage on the effectiveness of acetylsalicylic acid, and the interaction between the time of application and the concentration used. The advantage of the present study is that the experiments were carried out under field conditions, which resulted in a natural crop response.

2. Materials and Methods

2.1. Trial Conditions

The field experiments on spring wheat were conducted in the years 2013 and 2014 at the experimental station in Winna Góra (52°12′17″ N 17°26′48″ E), the Institute of Plant Protection—National Research Institute in Poznan (Poland). The spring wheat cultivar ‘Tybalt’ was chosen for the experiments, which, according to the characteristics provided by the breeding company (Wiersum Plantbreeding B.V.), is one of the highest-yielding spring wheat cultivars in Poland. Due to its good resistance and consistent yielding, which is not encountered in other cultivars, ‘Tybalt’ accounts for over 24% of the entire spring wheat market in Poland.
Spring wheat was sown on 8 April 2013 and 10 April 2014, at a sowing density of 200 kg·ha−1, thus obtaining 400 seeds per 1 m2. In the first year of the study, the forecrop was winter barley, and in the second year, it was sugar beet. The experiment was conducted in grey-brown podzolic soil, with pH of 5.6–5.8 and an organic matter content of 0.93–1.4%, depending on the year of the study. Mineral fertilization was used: N 140 kg·ha−1, P2O5 540 kg·ha−1 and K2O 60 kg·ha−1. Plant protection against weeds, diseases, and pests was used in the entire experiment according to the recommendations for wheat. The crop was harvested on 16 July 2013 and 20 July 2014.

2.2. Experimental Set-up

The experiment was conducted in 4 replications. The area of each plot was 16.5 m2, and the inter-row width was 12.5 cm. Two concentrations of acetylsalicylic acid (ASA) were analyzed. ASA was applied in a dose of 5 l·ha−1. The experimental design included: control (untreated) plots; treatments of ASA in a concentration of 3 mM applied at growth stage BBCH 29 (end of tillering)—T1, and then 7 days after the first treatment—T2; treatments of ASA in a concentration of 5 mM applied at growth stage BBCH 29 (end of tillering)—T1, and then 7 days after the first treatment—T2; treatments of ASA in a concentration of 3 mM applied at growth stage BBCH 37 (flag leaf just visible, still rolled)—T3, and then 7 days after the first treatment—T4, and treatments of ASA in a concentration of 5 mM applied at growth stage BBCH 37 (flag leaf just visible, still rolled)—T3, and then 7 days after the first treatment—T4.

2.3. Characteristics of the Preparation

ASA was used as a preparation of acetylsalicylic acid ≥ 99.0% (synonym: 2-acetoxybenzoic acid, O-acetylsalicylic acid, ASA, aspirin) produced by Merck (Merck & Co., Kenilworth, NJ, USA); linear formula: 2-(CH3CO2)C6H4CO2H; molecular weight—180.16; form—powder; color—white; pKa (25 °C) 3.5; mp 134–136 °C (lit.); solubility—H2O: 10 mg/mL at 37 °C (lit.), H2O: 3 mg/mL at 25 °C (lit.), ethanol: 50 mg/mL.

2.4. Spraying Parameters

Treatments were conducted using a bicycle-mounted Victoria sprayer equipped with TeeJet 110 02 VP sprayers (TeeJet Technologies, Wheaton, IL, USA) using 200 dm3 of spray liquid per ha, with an operating pressure of 0.3 MPa. The temperature during the applications varied between 15 and 20 °C, depending on the time of application and the year of the study.

2.5. Observations

During the growing season, the height of the plants and the chlorophyll content in the flag leaf were assessed. The height was measured before the harvest, in a sample of 25 plants from each experimental plot. The chlorophyll content was measured in 30 randomly selected flag leaves from each plot using a Chlorophyll Meter SPAD-502Plus produced by Konica Minolta (Tokio, Japan). The area for a single measurement was 2 mm × 3 mm. Harvesting was performed with a Wintersteiger plot combine. Next, the following parameters were determined: mass of a thousand grains, number of grains per ear, grain density; and qualitative characteristics of the yield: protein, gluten, and starch content, sedimentation index, and grain hardness. The number of grains per ear was calculated based on a sample of 25 ears collected from each plot. The mass of a thousand grains and grain density were both measured based on a 1 kg sample from each plot. Grain density was measured using a cylinder bulk density meter, and the qualitative analysis was carried out with an Infratec TM 1241 grain analyzer produced by Foss (Hillerød, Denmark).

2.6. Weather Conditions

Weather data were obtained from the Meteorological Station in Winna Góra (52°12′17″ N 17°26′48″ E). Weather conditions were analyzed using the Selyaninov hydrothermal coefficient (HTC) calculated by applying the formula by G. Selyaninov: HTC= 10Σ x/Σ t; where Σ x means the monthly sum of precipitation and Σ t means the sum of temperatures in a given decade (ten days) of the month. In this paper, the sum of air temperatures > 0 °C was considered, which differs from Selyaninov’s original HTC [47].
Weather conditions differed in the two study years (2013 and 2014), as presented in Table 1. The differences were recorded in the sowing period and during the initial growth of wheat. The first decades of April 2013 were very humid, whereas the same period in 2014 was marked by a considerable precipitation shortage (drought). In both years of the study, the third decade of April, and the first and second decades of May saw a shortage of precipitation. The Selyaninov coefficient (HTC) calculated for these periods indicated drought conditions. The situation changed in the third decade of May, when heavy precipitation was recorded in 2014 and HTC denoted a very humid period. In June 2014, during the ear development period, the hydrothermal conditions were highly conducive to the further development of the crop. On the other hand, throughout the entire period of intense wheat growth, ear development and grain formation in 2013 (third decade of May and entire June), the weather conditions were adverse and HTC indicated an ongoing period of drought.

2.7. Statistical Analysis

The significance of differences was assessed with Tukey’s confidence half-interval at a significance level of p = 0.05. All statistical analyses for the study were carried out in R version 3.6.2 [48].

3. Results

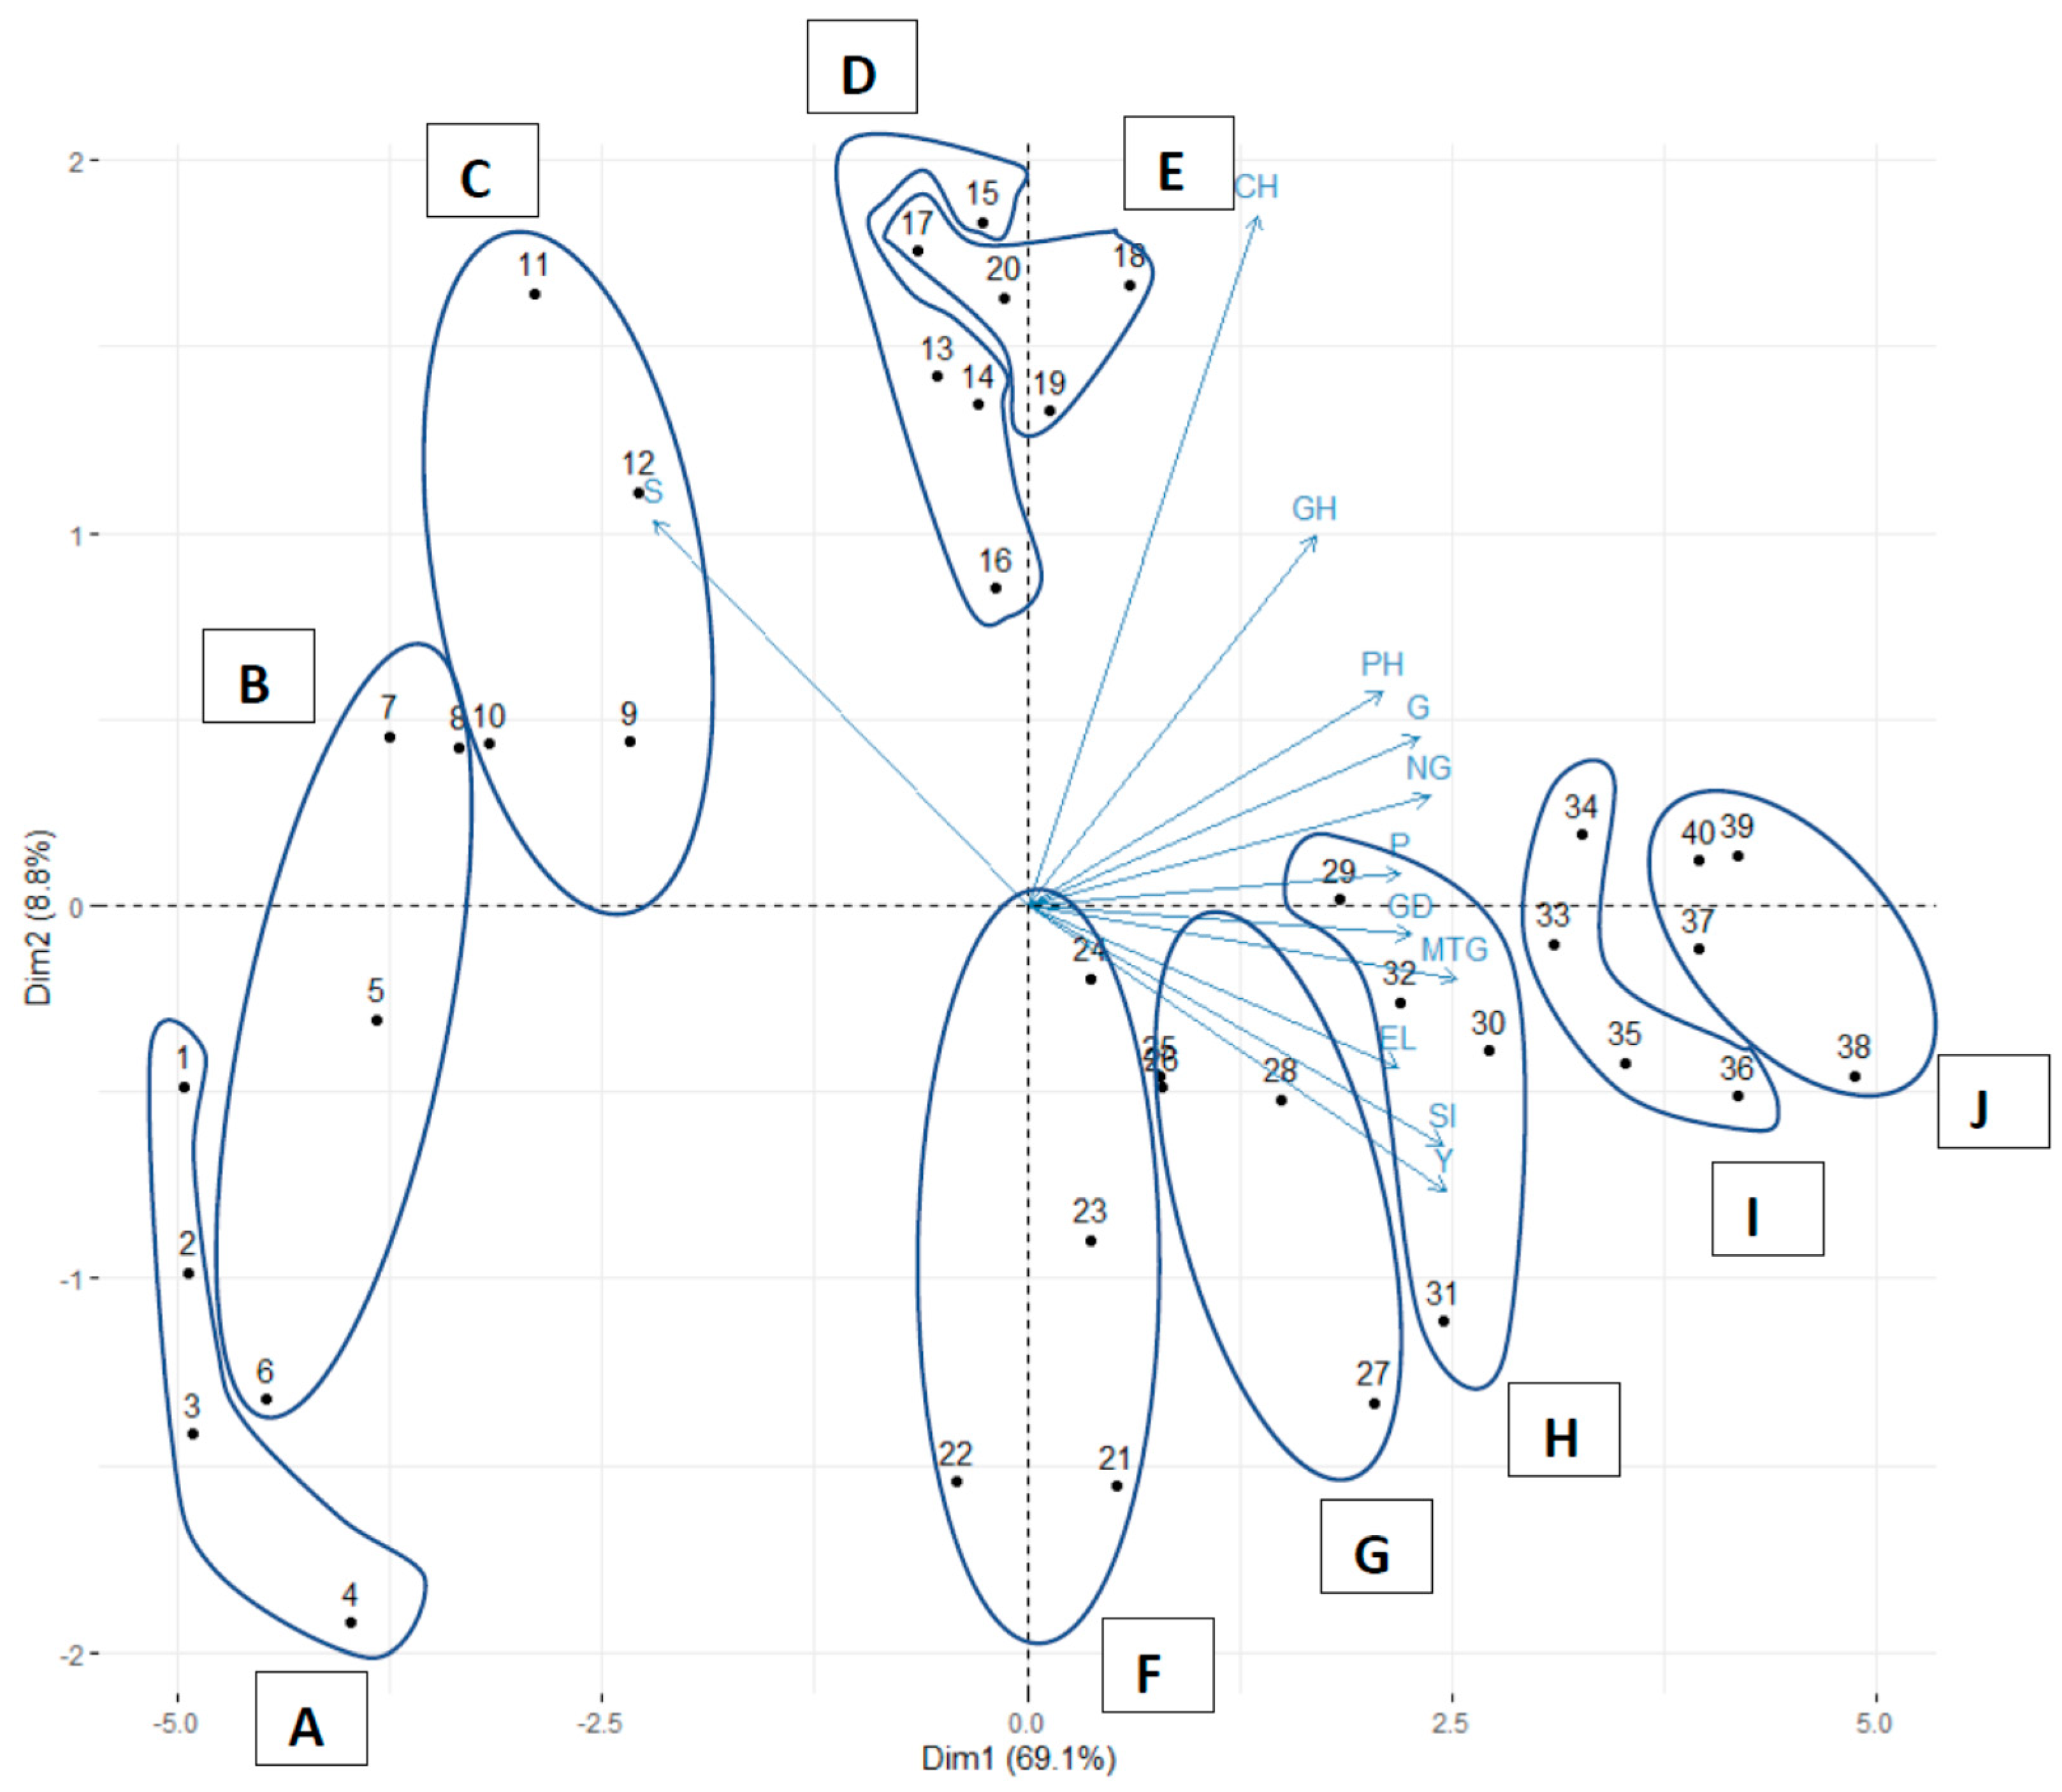
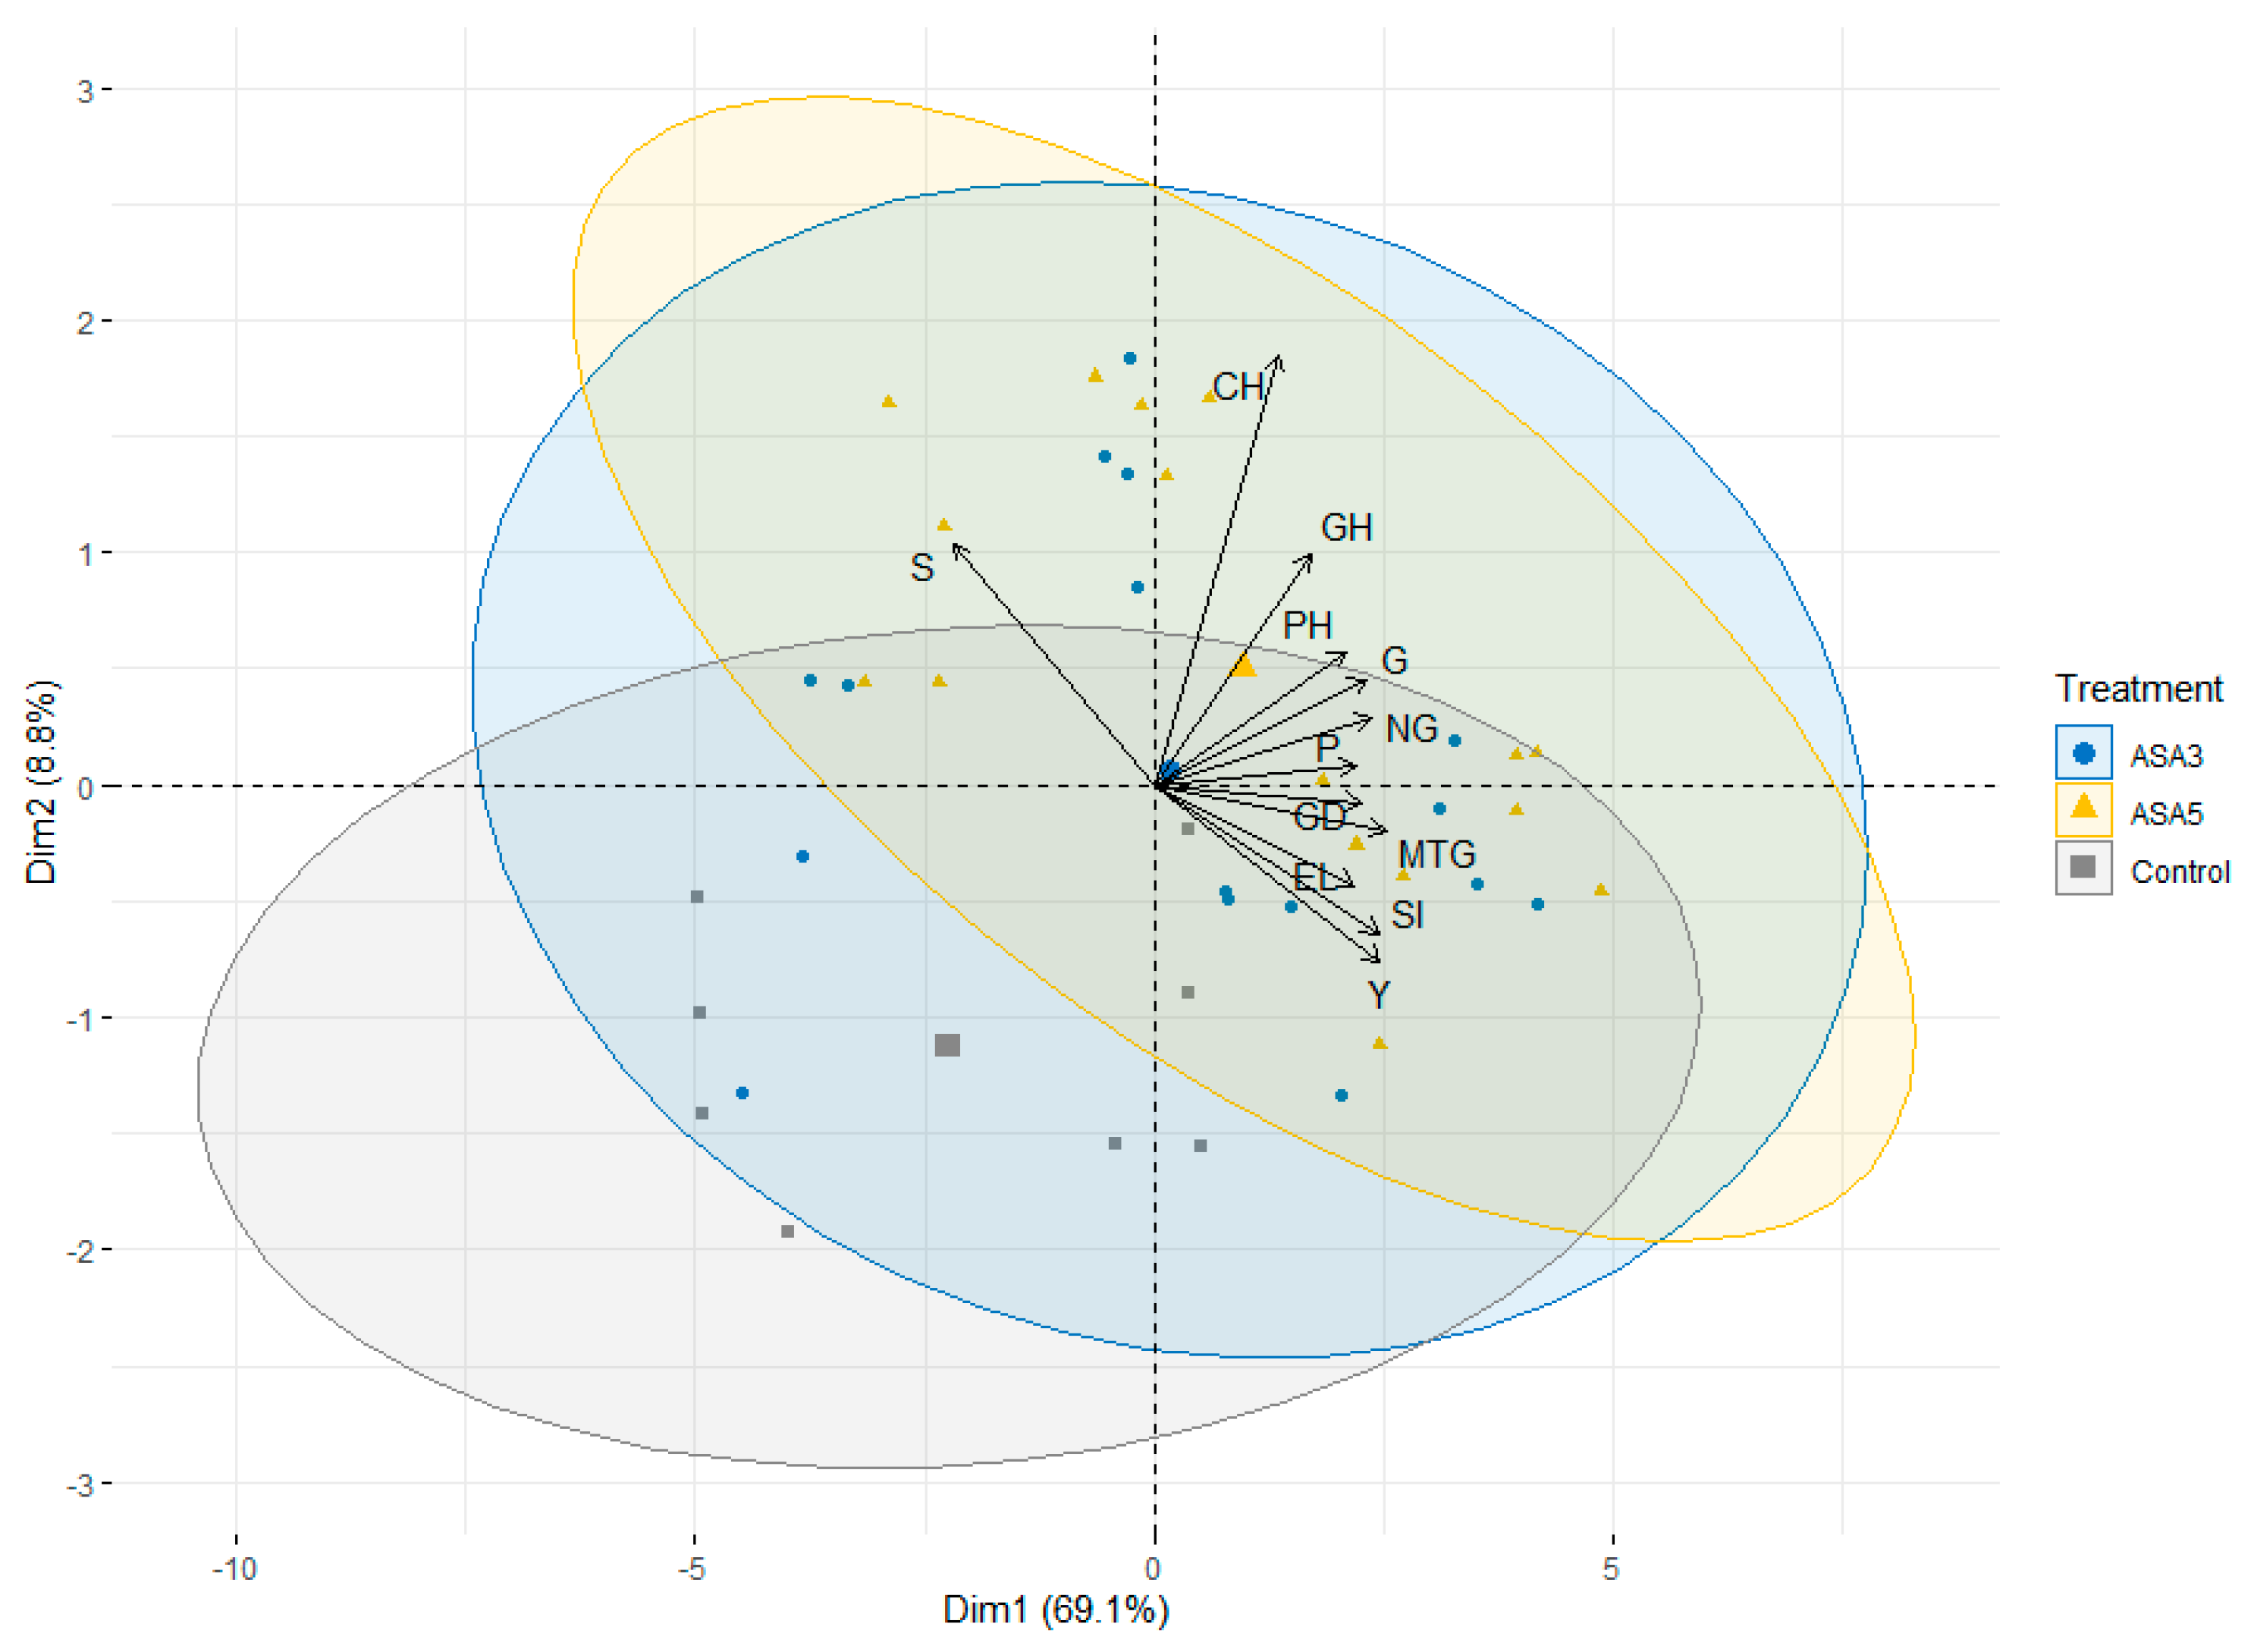
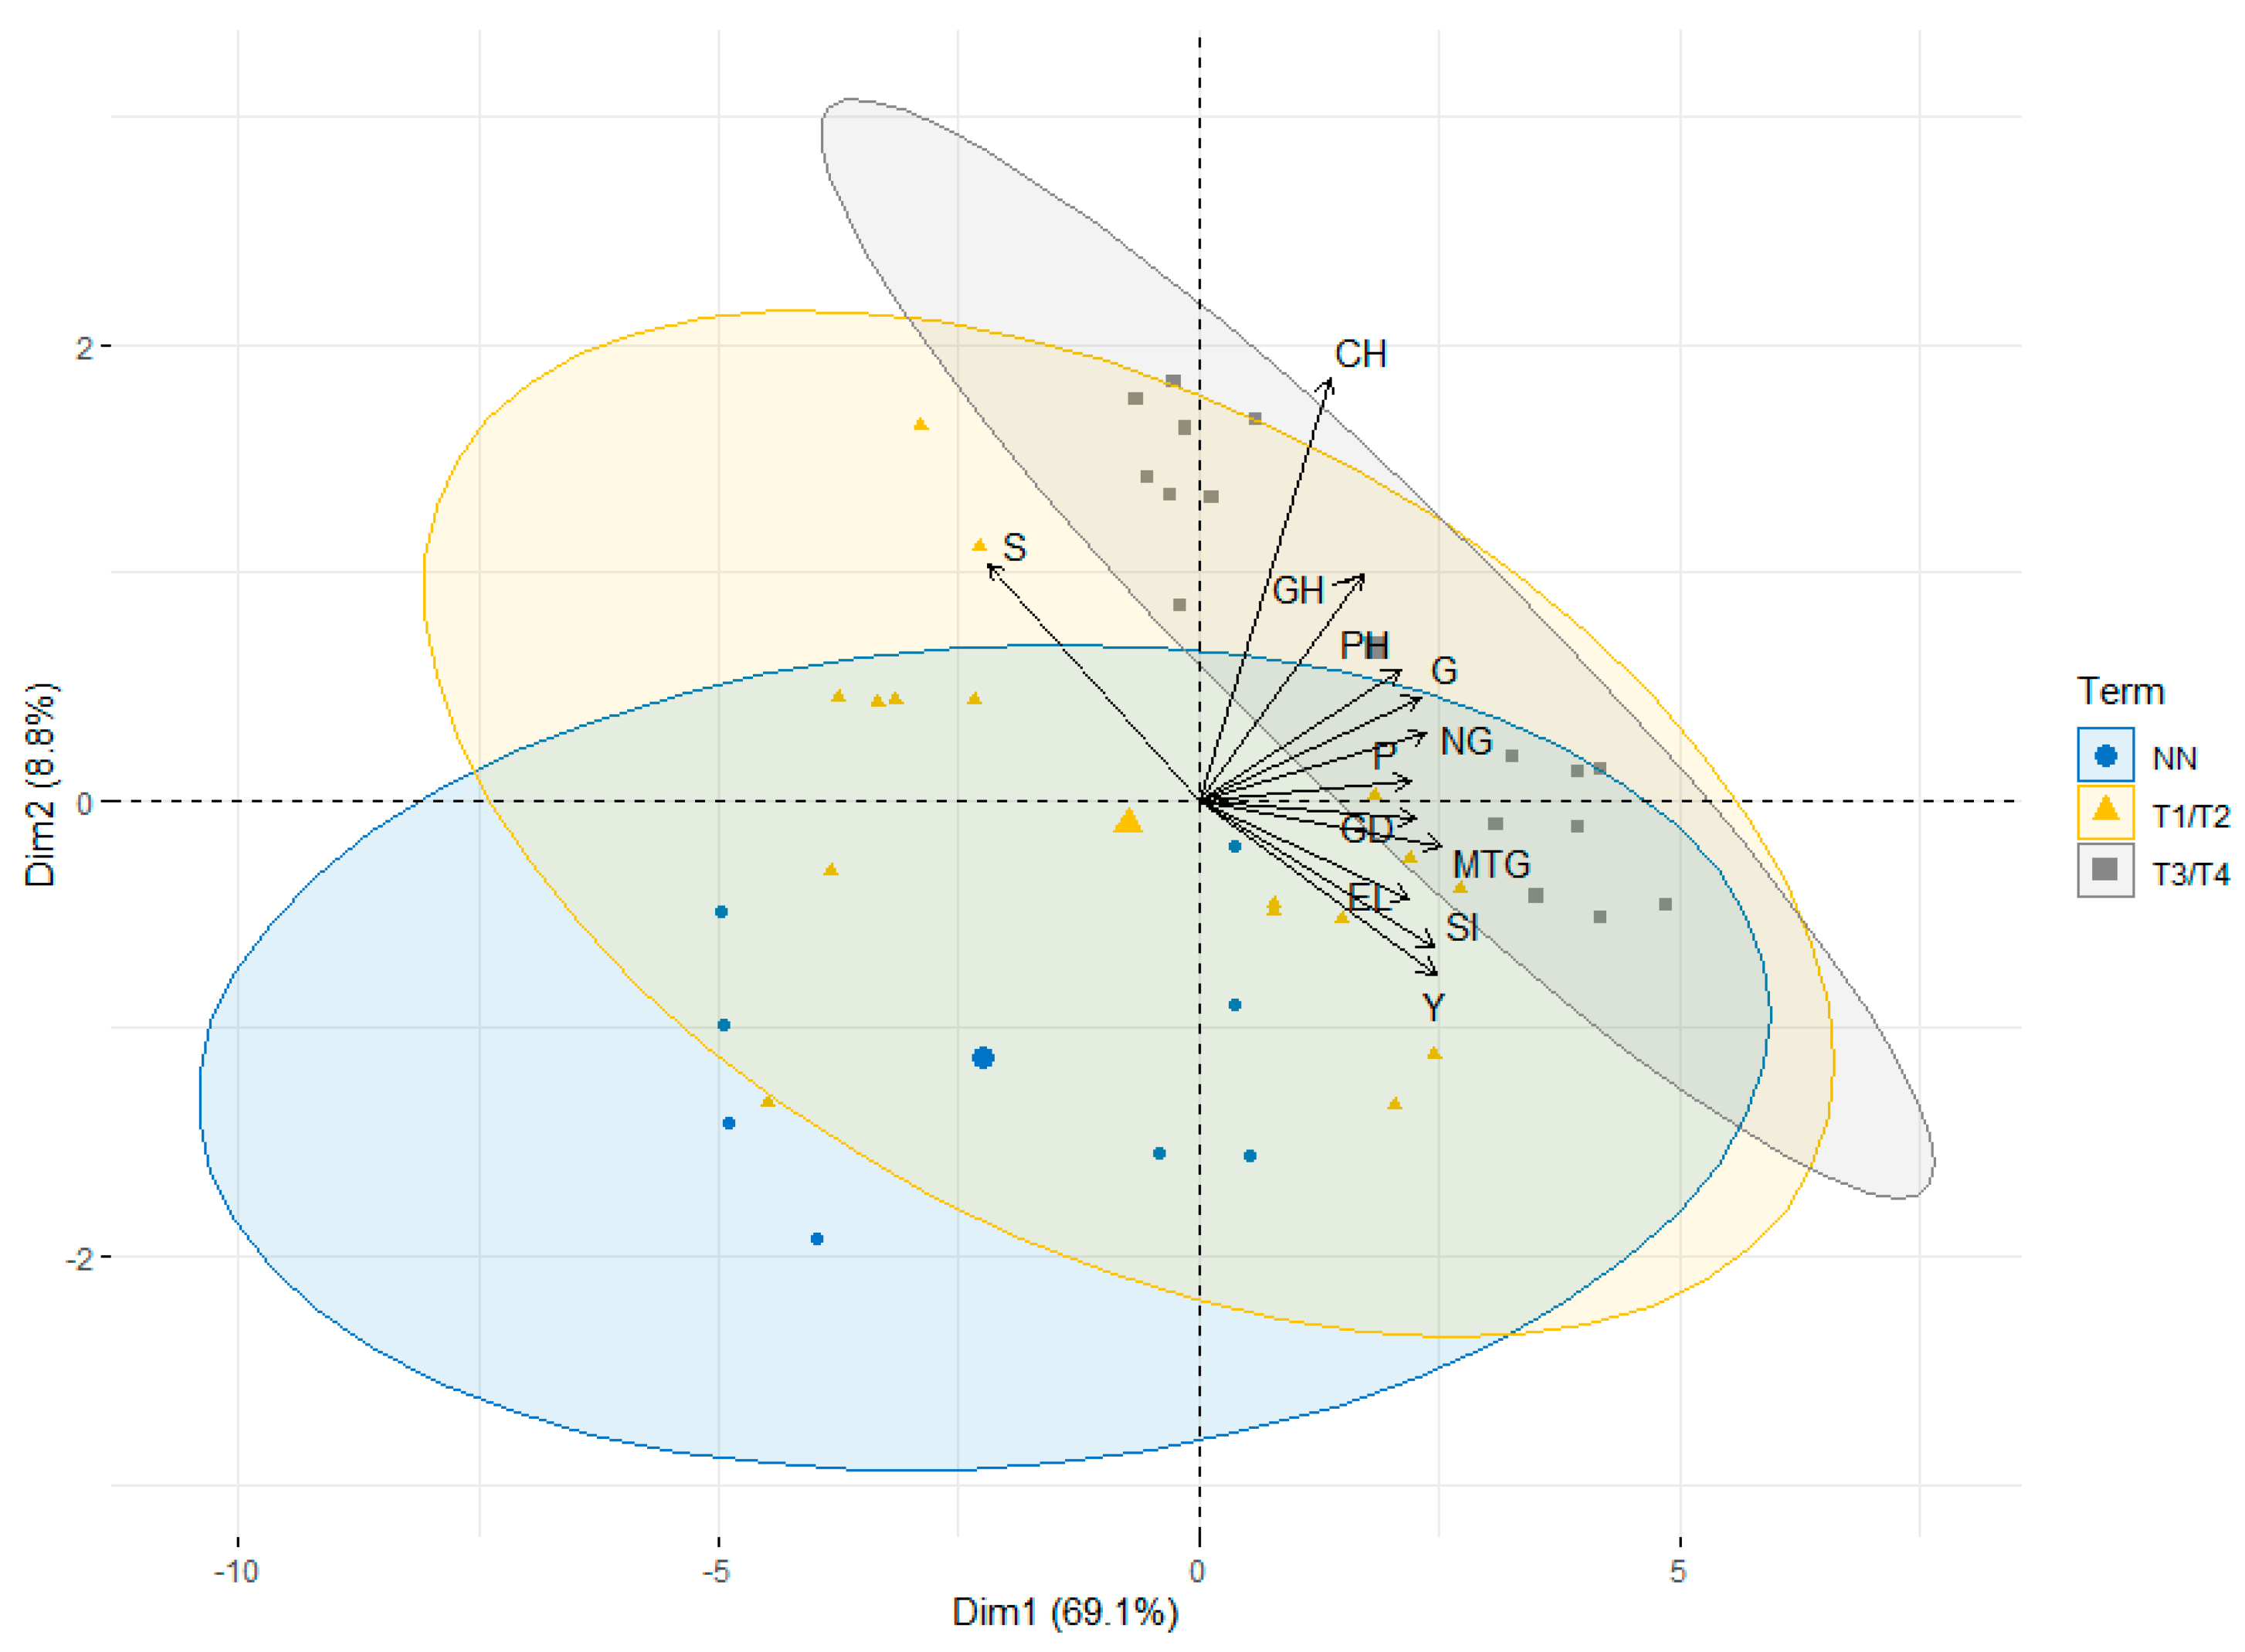
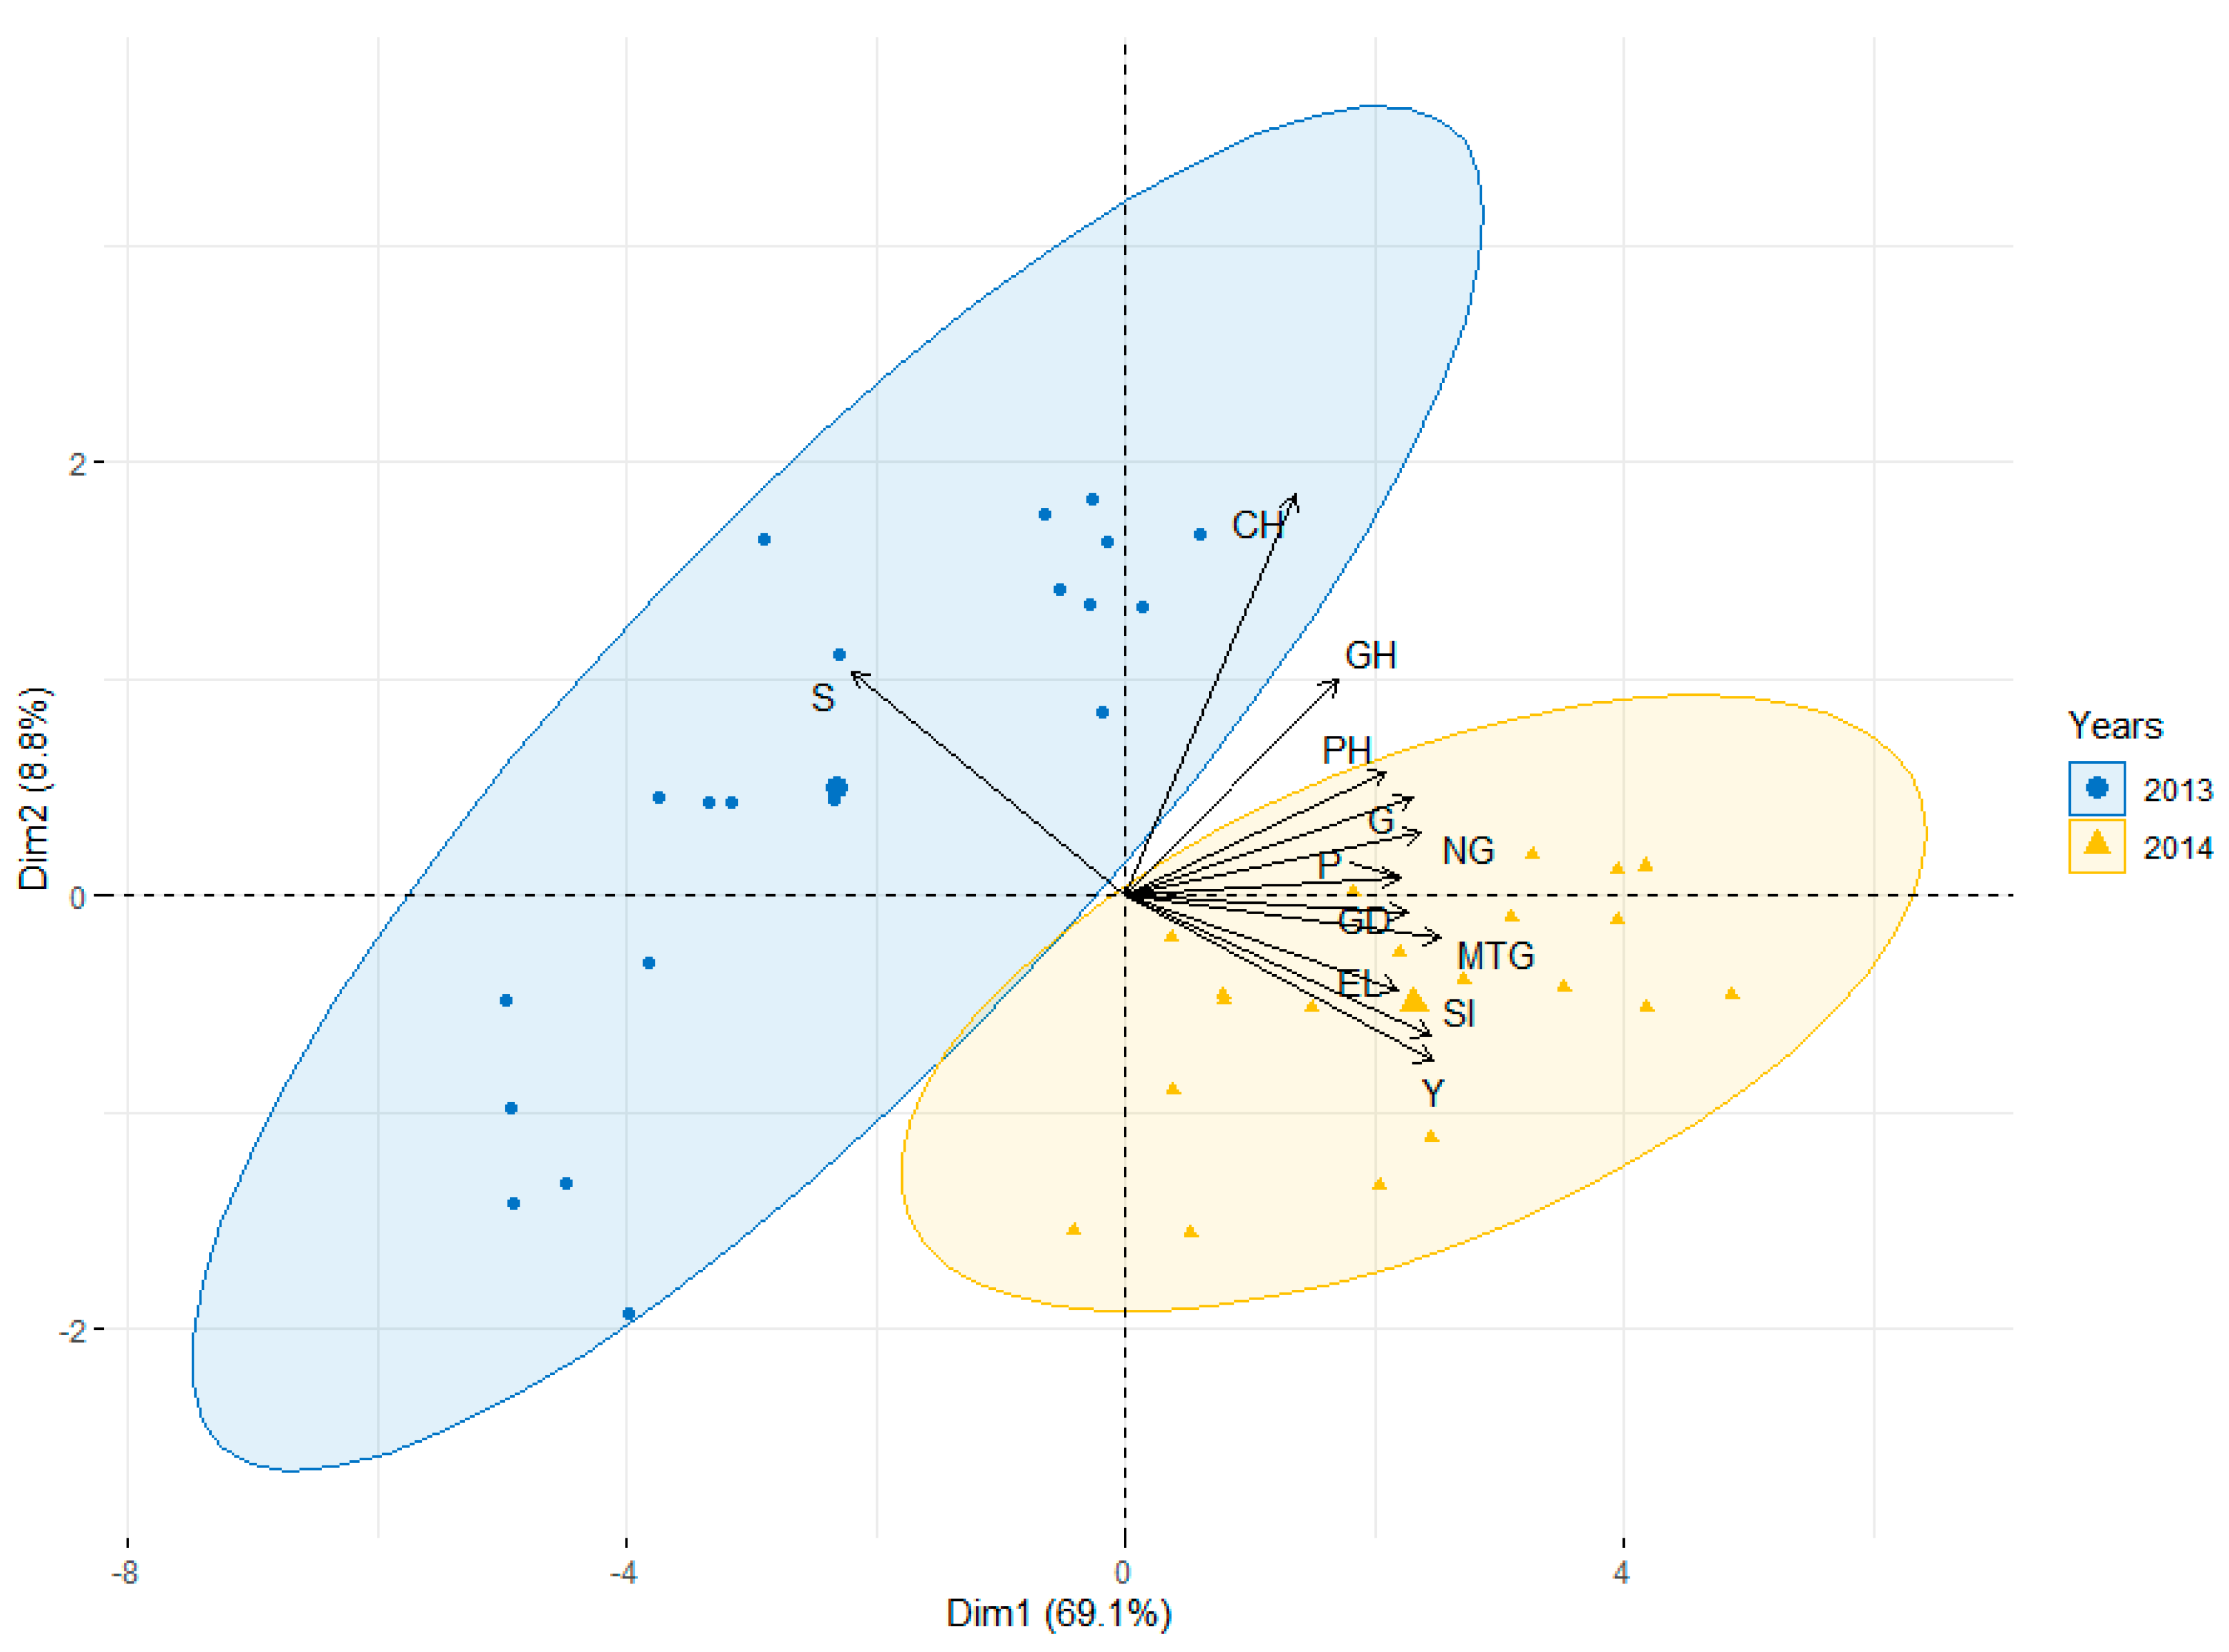
3.1. General Influence of Acetylsalicylic Acid on Wheat

The analysis of variance revealed that some of the traits studied were more sensitive to the concentration of ASA and others to the time of application (Table 2). However, the effect of ASA varied considerably for individual years and times of application. This variation is presented in Figure 1. The PCA biplot shows the trait distribution for each of the treatments studied (concentration, time of application and year). The plot clearly shows that individual areas do not overlap, which denotes a very high variability of the results obtained. The plot also demonstrates that 2014 (the second year of trials) was a year when ASA had a markedly stronger effect on wheat. Most of the traits studied are grouped in or aim towards the areas which cover this very year (areas G, H, I, J). A particular focus should be placed on area H, which denotes ASA concentration of 0.3 mM in the first application (T1/T2). This area groups such traits as ear length, mass of a thousand grains, grain density, protein content, sedimentation index, and yield. These are the traits most significantly influenced by ASA.
Figure 2, which only shows PCA for ASA concentrations (years and times of application are combined), indicates that the concentration of 0.5 mM had the greatest impact on wheat. Area ASA 5 denoting ASA concentration of 0.5 mM covers all the traits (arrows). When comparing times of application (Figure 3), one can notice that this parameter strongly determined the impact of the experimental factors on wheat. The plot only pertains to times of application (years and concentrations have been combined). PCA shows that it was the later time of application that determined such traits as chlorophyll content, plant height, mass of a thousand grains, and grain density. From Figure 4, where cases are grouped by years, we can conclude that the results for the variables, such as plant height, ear length, thousand grains mass, number of grains per ear, grain density, sedimentation index, gluten and protein content in ears, and the grain yield are greater for the year 2014 (the second year of research) than for 2013. From this biplot, we can see the strong positive correlation between these traits (arrows).

3.2. Plant Height (PH) and Ear Length (EL)

When comparing the traits analyzed in the two years of the study, it was demonstrated that in 2014, both plant height and ear length were greater by 10–12% on average (Table 3). Both concentrations increased the PH in both times of application, but the concentration of 0.5 mM had a better effect. ASA increased the PH by 15%. The effect of ASA on PH did not differ between the earlier and later time of application. When comparing all experimental factors (concentration x time of application x year) in the context of PH, it was observed that there were no significant differences in wheat height between the ASA concentrations and times of application studied either in the first or second year of the study (Figure 5A).
Ear length was affected not by the ASA concentration used but by the time of application (Table 3). It was demonstrated that ASA used at stage T3/T4 significantly influenced EL, extending it by 7%. Figure 5B shows that the effect of ASA on NG in 2014 was more consistent compared to 2013, as there were no differences in EL between the treatments studied. In 2013, values similar to those obtained in 2014 were observed for both ASA concentrations applied in the later time of application (T3/T4).

3.3. Chlorophyll in the Flag Leaf (CH)

ASA had a significant effect on the chlorophyll content in the flag leaf of wheat. Irrespective of the study year, the amount of CH increased as a result of ASA application by 18% for 0.3 mM and by 23% for 0.5 mM compared to non-treated plants (Table 3). There were also significant differences between the time of ASA application. When ASA was applied at stage T1/T2, the content of CH in the flag leaf increased by 18%, whereas at stage T3/T4, it increased by 23%. As for the years of the study, the plants had generally more CH (12%) in 2014 than in 2013. When analyzing the effect of all experimental factors (concentration, time of application, year), no differences were observed between 0.3 and 0.5 mM concentrations used at the later stage (T3/T4), and the concentration of 0.5 mM applied at the earlier stage (T1/T2) in 2013 (Figure 5C). On the other hand, a significantly lower CH content was recorded when ASA 0.3 mM had been applied at stage T1/T2 compared to other treatments in 2013. In 2014, the effect on CH content was very consistent, and the experimental treatments studied did not differ significantly.

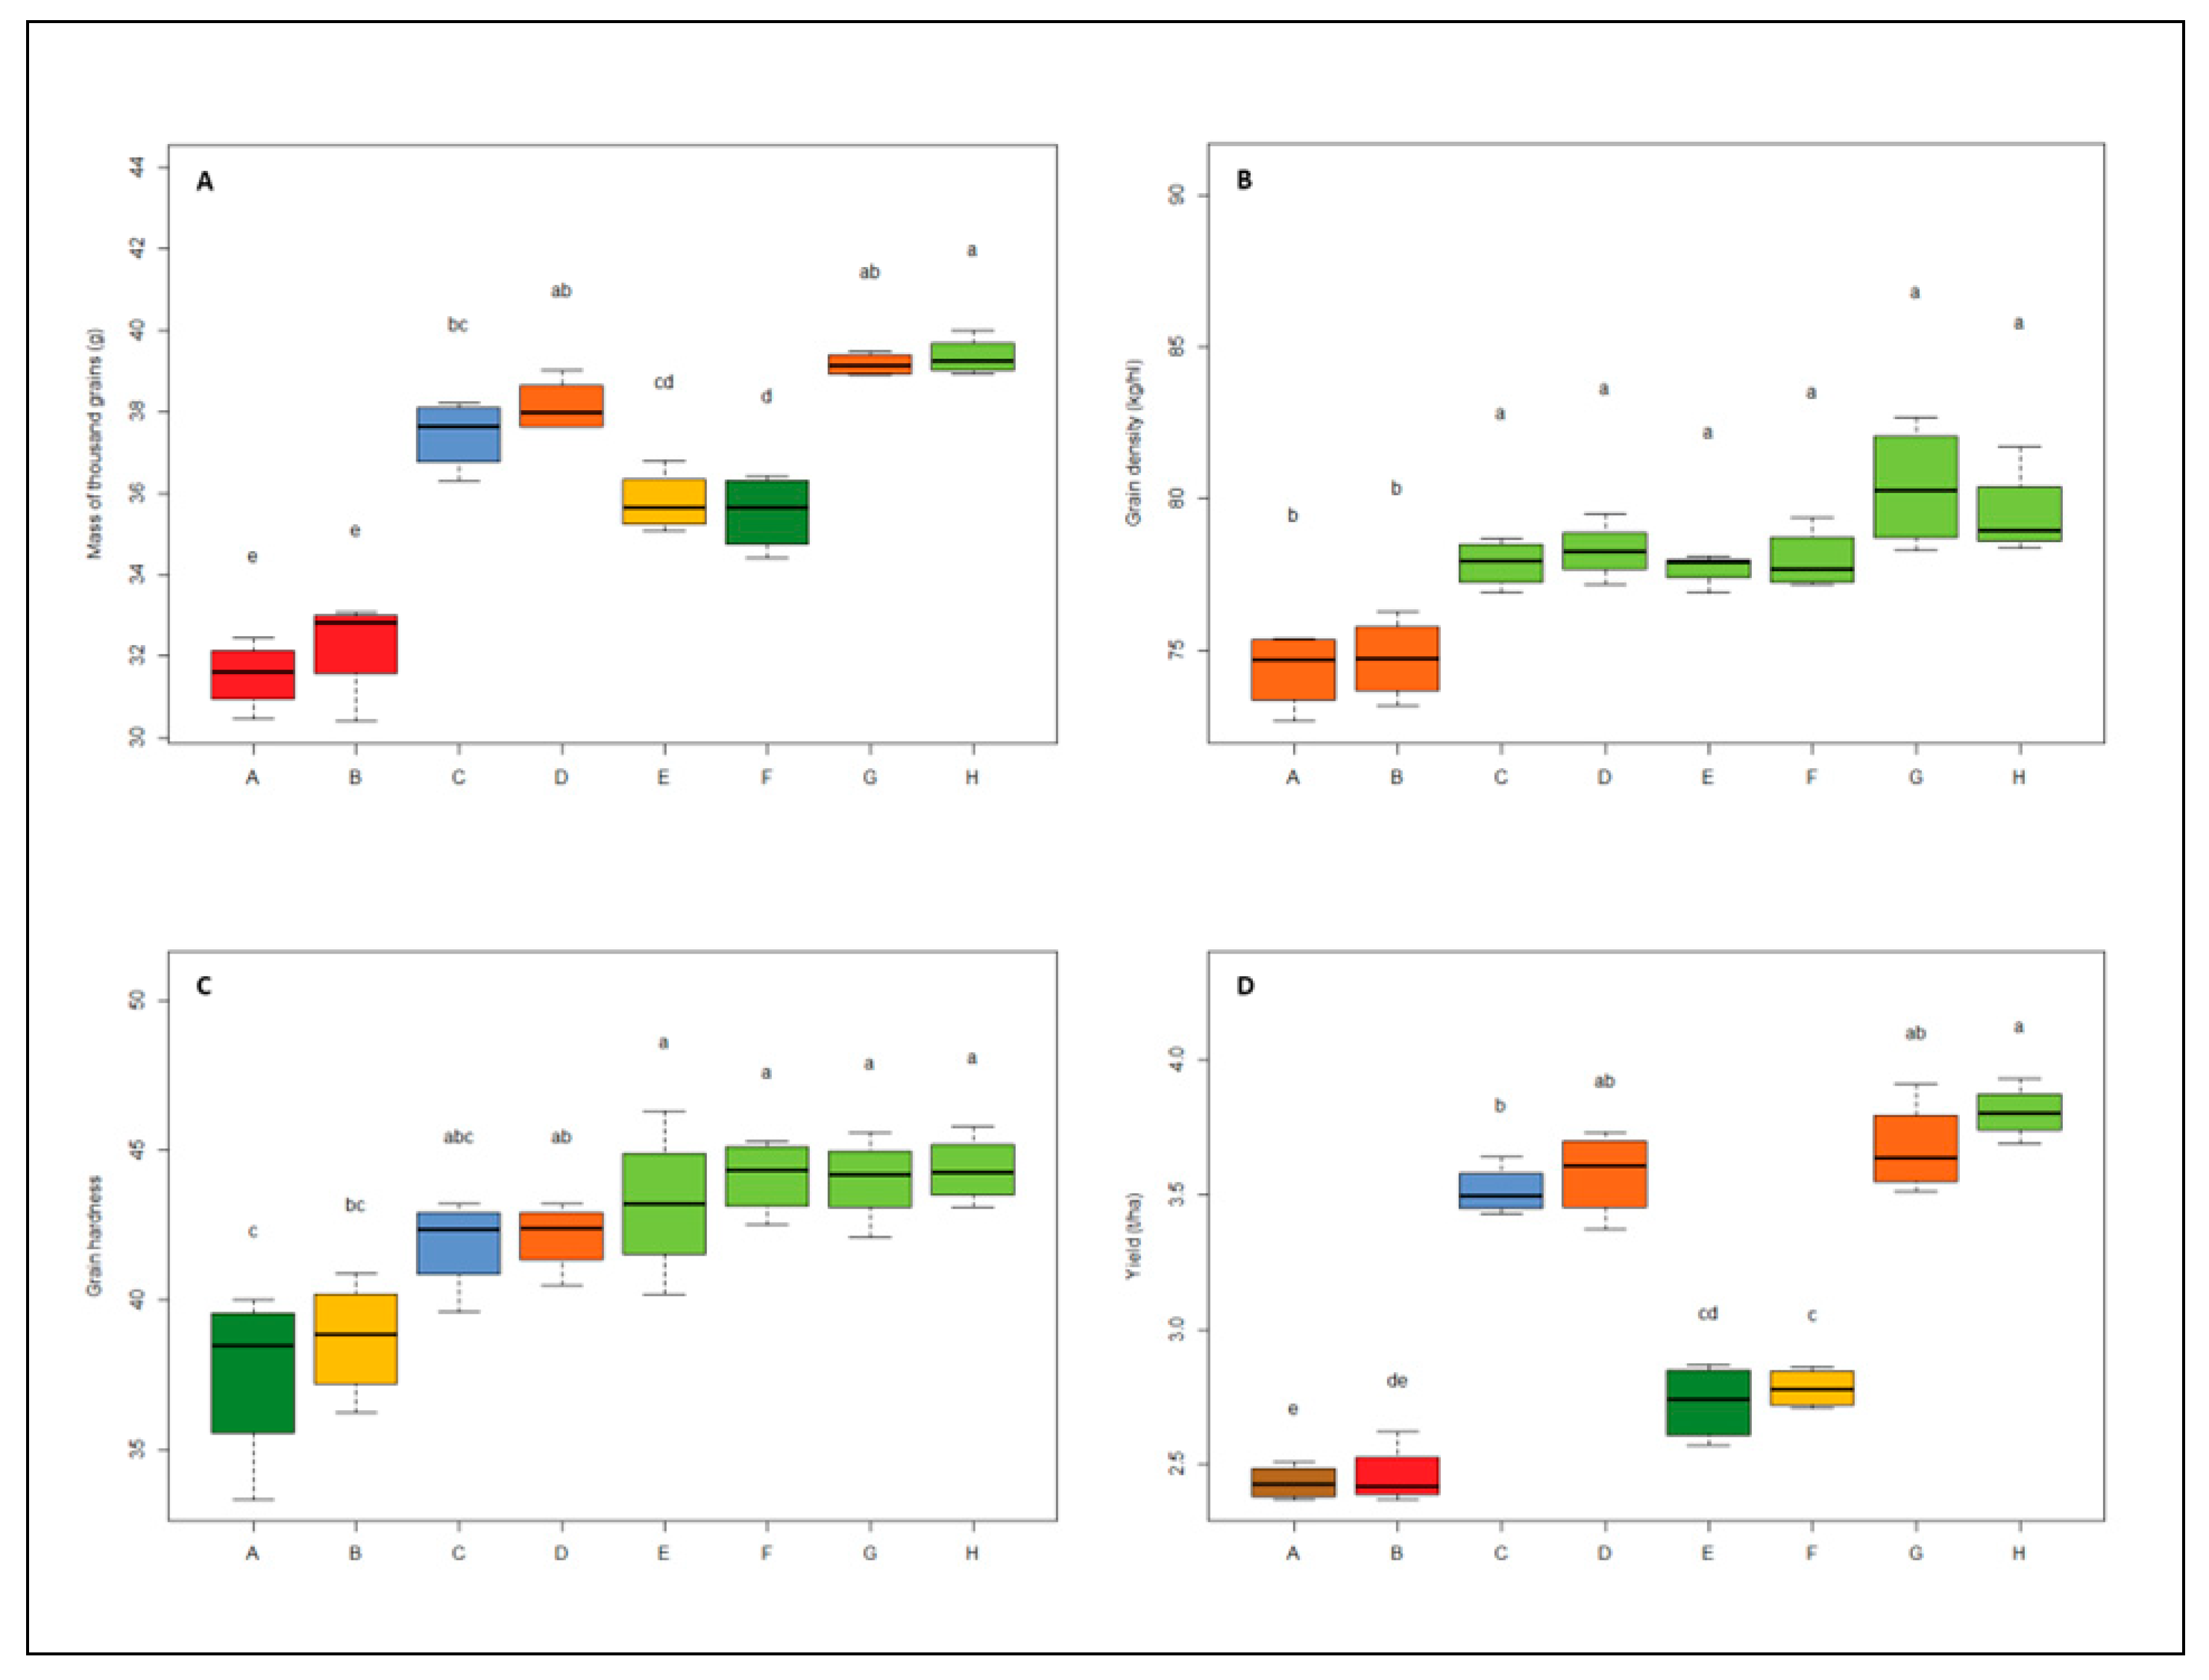
3.4. Number of Grains (NG) and Mass of a Thousand Grains (MTG)

The second year of the study (2014) was also more favorable to wheat in terms of the number of grains per ear and the mass of a thousand grains (Table 3). The NG per ear that year was higher by 12% compared to 2013. As for MTG, it increased by 15% in 2014 compared to 2013. ASA concentrations of 0.5 and 0.3 mM caused an increase in NG by 13% and 9%, respectively, compared to the control. A later time of application (T3/T4) had a better effect on NG (14% increase) compared to T1/T2 (6% increase). There were no significant differences for NG between the two times of application, but MTG increased by approximately 6–7% in both these times compared to the control.
The statistical analysis of the experimental factors indicated that with regard to NG, there were no differences between ASA 0.3 and 0.5mM applied at T1/T2, and ASA 0.3 mM and ASA 0.5 mM applied at T3/T4 in the two years of the study (Figure 5D). Time of application was not a dominating factor for NG. The highest NG was observed for the treatment that involved ASA 0.5 mM applied at T3/T4 (2014).
Varying conditions in the two years of the study strongly determined MTG. The analysis of the experimental factors demonstrated that ASA 0.3 and 0.5 mM applied at T1/T2 did not have an effect on MTG in 2013 (Figure 6A). An increase in this value was observed for ASA applied at T3/T4, irrespective of the concentration used. In 2014, there were no significant differences in the effect of ASA between the two concentrations at T3/T4 and 0.5 mM at T1/T2.

3.5. Grain Density (GD) and Grain Hardness (GH)

Grain density and grain hardness were the least variable traits as regards the study years, ASA concentrations, and times of application. Although the study showed that GD and GH were significantly higher in 2014, that value was only 4%. In the case of GD, there were no significant differences between the ASA concentrations. A higher value of GD was observed only for the later time of ASA application, i.e., T3/T4 (3% increase) (Table 3).
As for GH, a 5% increase was observed for ASA 0.5 mM. Moreover, T3/T4 proved to have a more positive impact on this trait (9% increase). The analysis of the experimental factors in the context of GD clearly shows an almost complete lack of variability in the ASA effect on this trait for individual treatments (Figure 6B). The exception is ASA (both concentrations) applied at T1/T2 in 2013. These treatments resulted in considerably lower GD values.
The data on grain hardness (Figure 6C) clearly show that there were no significant differences in the value of the grain hardness between the concentration of ASA 0.3 mM and 0.5 mM (the both years) and the term of application of T3/T4 and the term T1/T2 (only in 2014). In 2013, the lowest values of grain hardness were obtained for both concentrations of ASA in the application term T1/T2.

3.6. Yield (Y)

The analysis of variance revealed that more favorable weather conditions were conducive to higher yield in 2014. The yield of wheat that year was 28% higher than in 2013 (Table 3). Both ASA concentrations had a positive effect on the yield 9% and 12% yield increase was observed for ASA 0.3 mM and ASA 0.5 mM, respectively, compared to the control treatments. A similar correlation was demonstrated for the times of application. At T1/T2, the yield increased by 6%, and at T3/T4 by 15% (Table 3). Wheat yielding for individual treatment was more consistent in 2014 (Figure 6D). In this year, ASA 0.5 mM (T1/T2) had the same effect on the yield as ASA 0.3 mM and 0.5 mM at T3/T4. In 2013, similarly higher yielding was obtained for treatments involving ASA application at T3/T4. A lack of significant differences was also observed between ASA 0.3 mM and ASA 0.5 mM at T1/T2—these were the treatments that resulted in the lowest yield.

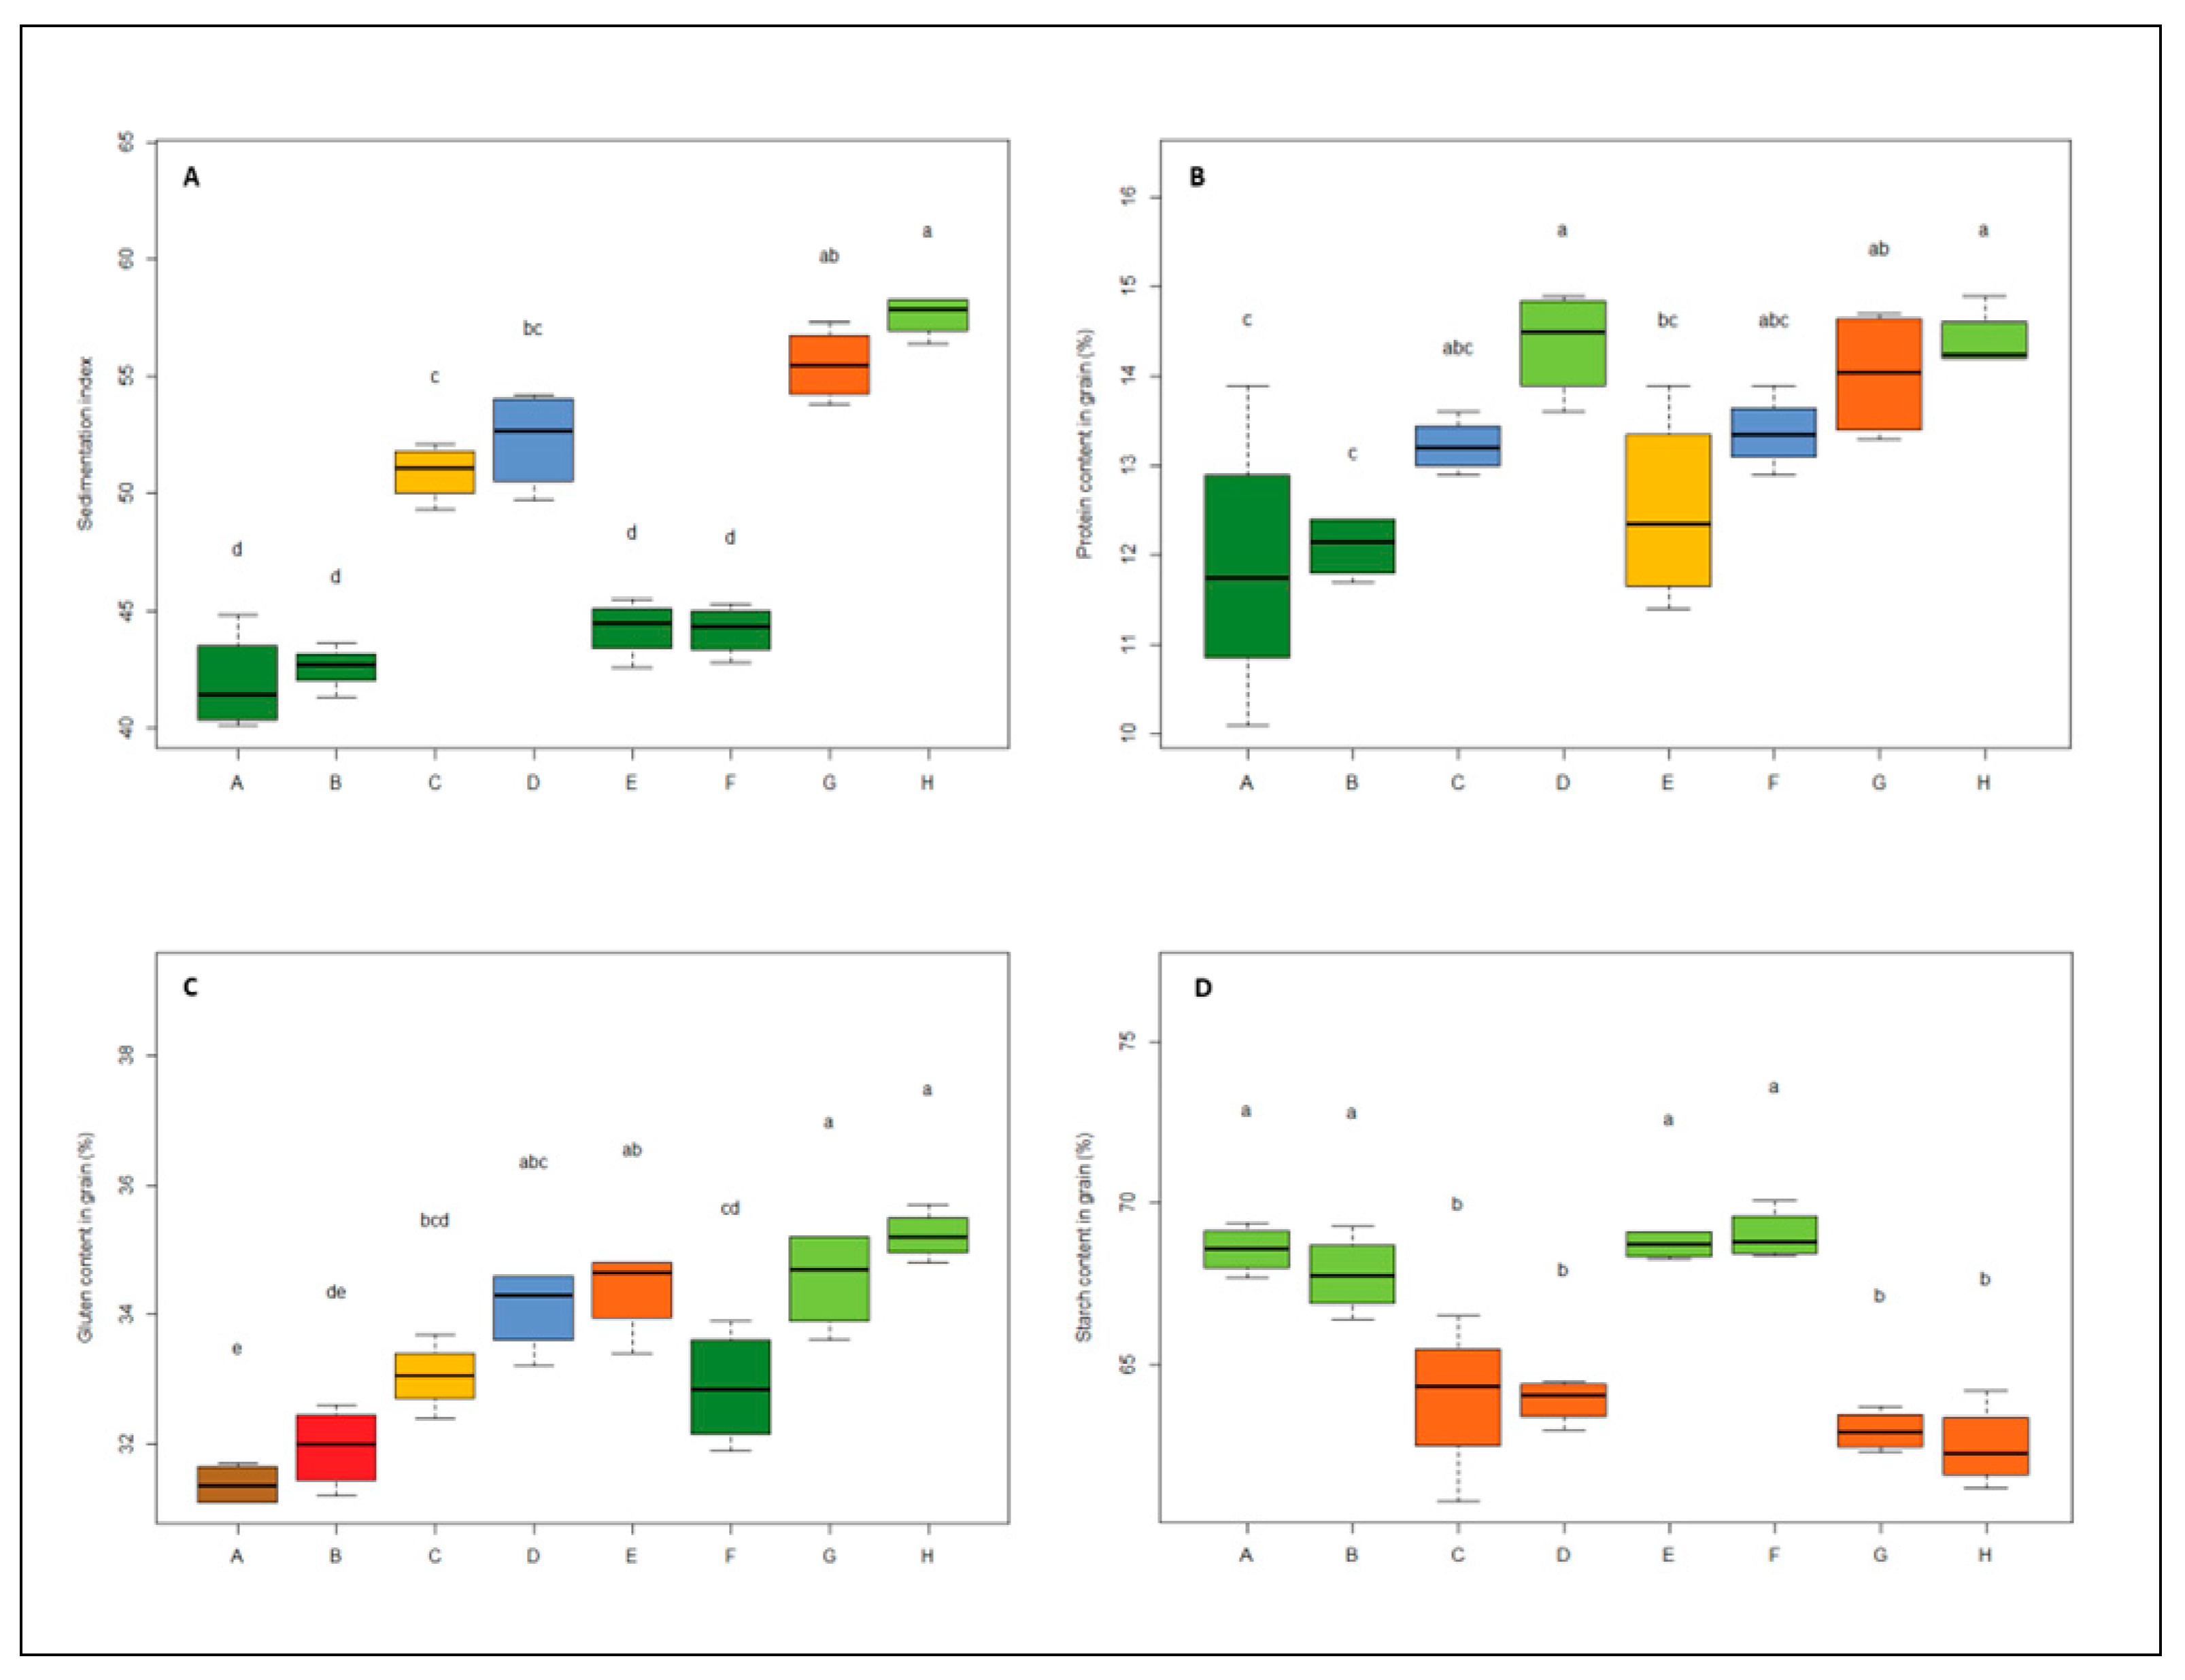
3.7. Sedimentation Index (SI), Protein (P), Gluten (G) and Starch (S) in Grains

The analysis of variance revealed differences in the sedimentation index between the years of study. Irrespective of the other factors (ASA concentration and time of application), the index was higher by 20% in 2014 compared to the value recorded in 2013. ASA did not have a strong effect on this trait, increasing SI by 5–9% compared to the control (Table 3). T3/T4 proved to have a more positive effect on the index, which increased by 10% at that time of application. In 2013, there were no differences in SI values between the treatments studied. Such differences were observed in 2014 (Figure 7A). The highest values were recorded for both ASA concentrations applied at T3/T4. T1/T2 was less favorable for this trait, but there were no differences between the ASA concentrations either.
In 2014, the content of protein and gluten was higher by 11% and 5%, respectively, compared to 2013, but in 2014 there was observed decrease in starch content by 8%. The P content increased by 8% after ASA 0.3 mM application, and by 14% after ASA 0.5 mM (Table 3). T3/T4 proved to have a more positive effect on this trait, as it resulted in a 14% increase. The P content increased by 8% after ASA application at T1/T2. Changes in the P content were mostly determined by the year of the study (Figure 7B). The G content increased by 5% after ASA application (for both concentrations), and significant differences were observed only for T3/T4 (8% increase). The analysis of the experimental factors demonstrated that ASA 0.3 mM applied at T3/T4 had the strongest effect on this trait in 2013 (Figure 7C). In 2014, the highest content of G was observed after the following treatments: ASA 0.5 mM T1/T2, ASA 0.3 mM T3/T4, and ASA 0.5 T3/T4. The S content was the only trait negatively affected by ASA. Both concentrations and both times of application decreased the S content (by 2%). The analysis of interactions between the experimental factors did not show any significant effect of the study year on this trait (Figure 7D).

4. Discussion

The present study was conducted over two years which differed in terms of hydrothermal conditions during the critical stages of wheat growth and development. Although 2013 saw more favorable humidity conditions in the first stage of vegetative growth compared to 2014, the subsequent months were classified as very dry. This was reflected in the parameters studied, whose values were much lower in 2013 compared to 2014. However, the hydrothermal conditions in the second year of the study cannot be regarded as perfect, as the drought conditions lasted for nearly half of the wheat growing season. Yet, the difference between the study years pertained to the wheat growth stages when such adverse conditions occurred and to the duration of water shortage. In the second year of the study, drought affected the earlier stages of wheat growth and was definitely shorter compared to 2013. In the first study year, on the other hand, drought occurred in growth stages that are critical for yielding, and lasted from booting until harvest. As a result, the difference in wheat yield between the two years was over 1 t·ha−1.
Biotic and abiotic stress accompanies every plant growing in natural conditions. It is estimated that due to abiotic stressors (drought, high temperature, salinity), crop yields can be a dozen or so times lower compared to yields from a crop affected by unfavorable biotic stressors (weeds, pathogens etc.) [49]. Spring wheat is very sensitive to water shortage, but the effects of drought depend on its intensity and duration. Given the short growing period of spring wheat, the greatest threat to this crop is a long-term drought lasting over a considerable part of its growth and development period. Long-term drought causes a large reduction in the yield, stemming from disrupted plant growth and development, and often irreversible metabolic changes in the plant. Water is essential in the initial growth stages of spring wheat (tillering, booting), but the most adverse consequences for this crop arise when drought occurs during its flowering and filling stage. A major problem faced by contemporary plant agriculture is that climate change increases the likelihood of extreme weather events, which include prolonged droughts [50,51].
The individual resistance of particular plant species or cultivars (introduction of resistant cultivars) or the use of appropriate chemical agents allow for minimizing or even preventing the effects of factors that are detrimental to plants [15,52,53]. The available research on the impact of salicylic acid on plants confirms that this compound entirely reduces the drought-induced decline of auxin levels in the plant. Thus, it has a positive effect on shoot and root mass, flower bud regeneration, flowering, and tuber formation [25,26,27]. Plants naturally contain very small amounts of salicylic acid. Studies have shown that SA is an organic acid, the amount of which differs depending on the crop species and even particular tissues. Biosynthesis, transport, and accumulation of organic acids in plants increase dramatically under stress conditions [28,29].
A study by Kaydan et al. [49] conducted on wheat under salt stress conditions showed that SA contributes to an increase in the shoot and root mass, the content of chlorophyll a and b in leaves, osmotic potential and the K+/Na+ ratio in plants. In turn, a study of sunflower plants demonstrated that the content of chlorophyll and carotenoids may decrease by as much as 64% in plants cultivated under drought conditions, and the use of SA considerably reduces this risk. It was confirmed that in sunflower, SA increases Cd, Pb and Ni accumulation in roots, Cd and Ni accumulation in shoots, shoot length, root mass, the content of chlorophyll, carotenoids and proteins in leaves, and the amount of sugar, phenols, and antioxidant enzymes [38]. Other studies showed that SA has an impact on plant growth (shoot and root mass), essential oil content in plants (basil and marjoram), oil quality, and carbohydrate and amino acid content. It also increases the content of proline, micro- and macro-elements, and polyamines (spermidine, putrescine) [35].
The present study demonstrated that the SA derivative acetylsalicylic acid (ASA) also has a positive influence on the morphological (plant height, ear length) and physiological (chlorophyll content) parameters of wheat, as well as on the structure and quality of the yield. These findings are consistent with other studies on the effect of ASA on crops [38,54]. Some authors emphasized that the effects of exogenous SA application may be more dependent on plant species and cultivar compared to those exerted by other substances. Salicylic acid occurs in every plant and its amount depends not only on the plant growth stage (as is the case with phytohormones) but also environmental conditions. In the case of endogenous salicylic acid, additional application of this substance may be toxic to the plant [32,54,55]. It has been hypothesized that a high concentration of SA may cause oxidative stress in plants, especially through hydrogen peroxide accumulation [34].
Therefore, it is of key importance to establish an effective but at the same time non-toxic concentration of SA or ASA. The present study tested two concentrations of ASA: 3 and 5 mM. However, other researchers suggested that in the case of wheat, the effective ASA concentration is 10−2 mol/L [49]. As for salicylic acid applied on wheat seedlings, the most effective concentration is 0.05 mM. Such concentration prevented a decrease in IAA and cytokinin levels and reduced ABA accumulation under drought and salt stress conditions [39]. In the case of basil and marjoram, the optimum concentration is 0.4 mM [35]. Studies on maize showed that the SA concentration beneficial for this crop is 0.5 mM [56].
The present study did not confirm significant differences between the ASA concentrations used. The concentration of 0.5 mM proved more effective only for such traits as plant height and protein content in the grain. On the other hand, the study showed that it is not the concentration but the time of ASA application that is more important for the growth of this plant. There were no significant differences between the effects of an earlier and later ASA application time on plant height or chlorophyll content. However, most of the structural and qualitative parameters of the yield (number of grains in the ear, grain density, grain hardness, protein, gluten and starch content) were better after later application of ASA (GS BBCH 37). The present study shows that foliar ASA application may be particularly beneficial to the growth and development of wheat that was subject to drought stress in the initial stage of the growing period. Due to the scarcity of field research on salicylic acid, the present study also has a practical dimension.
The available scientific literature points to the considerable usefulness of salicylic acid and its derivative, acetylsalicylic acid, in counteracting stress consequences in plants. However, a major research problem is determining the dosing and growth stage that would allow for safe application of these substances. The use of SA and ASA in weak plants that already grow under stress conditions may prove to be an additional stressor. Another problem is the fact that due to the genotypic distinctiveness of plants, which determines their specific phytohormone composition, the concentration (dose) and optimum time of application may depend on the individual traits of a given species and cultivar. Another factor determining the effect of these substances on a plant may be its overall condition (vigor). Thus, research on these compounds should be extended to particularly include field studies which, in contrast to studies in controlled conditions, do not exclude environmental interactions.

5. Conclusions

Contemporary agricultural sciences need the highest possible number of studies on crop adaptation to the changing climatic conditions. Climate change and the related, increasing occurrence of abiotic stresses, including drought, will create new possibilities for the use of substances which in extreme conditions may help to preserve a constant level of yields from key crops. Wheat is one of the most important crops in the world. At the same time, it is very sensitive to water shortage in its critical growth stages. Acetylsalicylic acid is a relatively inexpensive substance which, when used in small concentrations, may significantly contribute to limiting yield losses, especially in drought conditions. In our study, we found that the acetylsalicylic acid at a concentration of 0.5 mM is much more favorable for wheat compared to the concentration 0.3 mM. It significantly increases the yield of the crop and is particularly beneficial when is used in the flag leaf growth stage. Acetylsalicylic acid has a positive influence on the morphological and physiological processes in wheat, and substantially improves the qualitative and quantitative properties of this crop.

Author Contributions

Conceptualization, K.M. and R.K. (Roman Kierzek); methodology, R.K. (Roman Krawczyk) and J.K.; writing—original draft preparation, K.M.; software, I.S.; writing—review and editing, K.M. and I.S. All authors have read and agreed to the published version of the manuscript.

Funding

This research received no external funding.

Acknowledgments

This study was the part of the statutory activity of the Institute of Plant Protection—National Research Institute in Poland. The project ‘Evaluation of biological activity of plant growth regulators and biostimulants in cereals’ (No. HET-08/1.3.3) was supported by the Polish Ministry of Science and Higher Education.

Conflicts of Interest

Disclosure—None of the authors has any financial or other relationships that could lead to a conflict of interest.

References

  1. Hellin, J.; Shiferaw, B.; Cairns, J.E.; Reynolds, M.P.; Ortiz-Monasterio, I.; Bänziger, M.; Sonder, K.; La Rovere, R. Climate change and food security in the developing world: Potential of maize and wheat research to expand options for adaptation and mitigation. J. Dev. Agric. Econ. 2012, 4, 311–321. [Google Scholar] [CrossRef]
  2. Shiferaw, B.; Smale, M.; Braun, H.J.; Duveiller, E.; Reynolds, M.; Muricho, G. Crops that feed the world 10. Past successes and future challenges to the role played by wheat in global food security. Food Secur. 2013, 5, 291–317. [Google Scholar] [CrossRef] [Green Version]
  3. Monneveux, P.; Jing, R.; Misra, S. Phenotyping for drought adaptation in wheat using physiological traits. Front. Physiol. 2012, 3, 429. [Google Scholar] [CrossRef] [PubMed] [Green Version]
  4. Semenov, M.A. Impacts of climate change on wheat in England and Wales. J. R. Soc. Interface 2009, 6, 343–350. [Google Scholar] [CrossRef] [PubMed]
  5. Semenov, M.A.; Stratonovitch, P.; Alghabari, F.; Gooding, M.J. Adapting wheat in Europe for climate change. J. Cereal Sci. 2014, 59, 245–256. [Google Scholar] [CrossRef] [PubMed] [Green Version]
  6. Thaler, S.; Eitzinger, J.; Trnka, M.; Dubrovsky, M. Impacts of climate change and alternative adaptation options on winter wheat yield and water productivity in a dry climate in Central Europe. J. Agric. Sci. 2012, 150, 537–555. [Google Scholar] [CrossRef]
  7. Dixon, J.; Nalley, L.; Kosina, P.; La Rovere, R.; Hellin, J.; Aquino, P. Adoption and economic impact of improved wheat varieties in the developing world. J. Agric. Sci. 2006, 144, 489–502. [Google Scholar] [CrossRef] [Green Version]
  8. Farooq, S.; Shahid, M.; Khan, M.B.; Hussain, M.; Farooq, M. Improving the productivity of bread wheat by good management practices under terminal drought. J. Agron. Crop Sci. 2015, 201, 173–188. [Google Scholar] [CrossRef]
  9. Duggan, B.L.; Domitruk, D.R.; Fowler, D.B. Yield component variation in winter wheat grown under drought stress. Can. J. Plant Sci. 2000, 80, 739–745. [Google Scholar] [CrossRef] [Green Version]
  10. Bafeel, S.O.; Ibrahim, M.M. Antioxidants and accumulation of α-tocopherol induce chilling tolerance in Medicago sativa. Int. J. Agric. Biol. 2008, 10, 593–598. [Google Scholar]
  11. Yao, X.; Chu, J.; Wang, G. Effects of selenium on wheat seedlings under drought stress. Biol. Trace Elem. Res. 2009, 130, 283–290. [Google Scholar] [CrossRef] [PubMed]
  12. Winter, G.; Todd, C.D.; Trovato, M.; Forlani, G.; Funck, D. Physiological implications of arginine metabolism in plants. Front. Plant Sci. 2015, 6, 534. [Google Scholar] [CrossRef] [PubMed] [Green Version]
  13. Ahmad, I.; Basra, S.M.A.; Wahid, A. Exogenous application of ascorbic acid, salicylic acid and hydrogen peroxide improves the productivity of hybrid maize at low temperature stress. Int. J. Agric. Biol. 2014, 16, 825–830. [Google Scholar]
  14. Ali, Q.; Anwar, F.; Ashraf, M.; Saari, N.; Perveen, R. Ameliorating effects of exogenously applied proline on seed composition, seed oil quality and oil antioxidant activity of maize (Zea mays L.) under drought stress. Int. J. Mol. Sci. 2013, 14, 818–835. [Google Scholar] [CrossRef]
  15. Ashraf, M.; Foolad, M. Roles of glycine betaine and proline in improving plant abiotic stress resistance. Environ. Exp. Bot. 2007, 59, 206–216. [Google Scholar] [CrossRef]
  16. Sotiropoulos, T.E.; Dimassi, K.N.; Therios, I.N. Effects of L-arginine and L-cysteine on growth, and chlorophyll and mineral contents of shoots of the apple rootstock EM 26 cultured in vitro. Biol. Plant. 2005, 49, 443–445. [Google Scholar] [CrossRef]
  17. Hassanein, R.A.; El-Khawas, S.A.; Ibrahim, S.K.; El-Bassiouny, H.M.; Mostafa, H.A.; Abdel-Monem, A.A. Improving the thermo tolerance of wheat plant by foliar application of arginine or putrescine. Pak. J. Bot. 2013, 45, 111–118. [Google Scholar]
  18. Venkatesh, J.; Park, S.W. Role of L-ascorbate in alleviating abiotic stresses in crop plants. Bot. Stud. 2014, 55, 38. [Google Scholar] [CrossRef] [Green Version]
  19. Yang, X.; Cui, X.; Zhao, L.; Guo, D.; Feng, L.; Wei, S.; Zhao, C.; Huang, D. Exogenous glycine nitrogen enhances accumulation of glycosylated flavonoids and antioxidant activity in lettuce (Lactuca sativa L.). Front. Plant Sci. 2017, 8, 2098. [Google Scholar] [CrossRef] [Green Version]
  20. Xiaochuang, C.; Chu, Z.; Lianfeng, Z.; Junhua, Z.; Hussain, S.; Lianghuan, W.; Qianyu, J. Glycine increases cold tolerance in rice via the regulation of N uptake, physiological characteristics, and photosynthesis. Plant Physiol. Biochem. 2017, 112, 251–260. [Google Scholar] [CrossRef]
  21. Waqas, M.A.; Khan, I.; Akhter, M.J.; Noor, M.A.; Ashraf, U. Exogenous application of plant growth regulators (PGRs) induces chilling tolerance in short-duration hybrid maize. Environ. Sci. Pollut. Res. 2017, 24, 11459–11471. [Google Scholar] [CrossRef] [PubMed]
  22. Matysiak, K.; Miziniak, W.; Kaczmarek, S.; Kierzek, R. Herbicides with natural and synthetic biostimulants in spring wheat. Ciência Rural 2018, 48, 1–10. [Google Scholar] [CrossRef]
  23. Matysiak, K.; Kierzek, R.; Siatkowski, I.; Kowalska, J.; Krawczyk, R. Effect of exogenous application of amino acids L-Arginine and Glycine on maize under temperature stress. Agronomy 2020, 10, 769. [Google Scholar] [CrossRef]
  24. Hammad, S.A.; Ali, O.A. Physiological and biochemical studies on drought tolerance of wheat plants by application of amino acids and yeast extract. Ann. Agric. Sci. 2014, 59, 133–145. [Google Scholar] [CrossRef] [Green Version]
  25. Ghazijahani, N.; Hadavi, E.; Jeong, B.R. Foliar sprays of citric acid and salicylic acid alter the pattern of root acquisition of some minerals in sweet basil (Ocimum basilicum L.). Front. Plant Sci. 2014, 5, 573. [Google Scholar] [CrossRef] [Green Version]
  26. Rivas-San Vicente, M.; Plasencia, J. Salicylic acid beyond defence: Its role in plant growth and development. J. Exp. Bot. 2011, 62, 3321–3338. [Google Scholar] [CrossRef] [Green Version]
  27. Raskin, I. Role of salicylic acid in plants. Annu. Rev. Plant Biol. 1992, 43, 439–463. [Google Scholar] [CrossRef]
  28. Lopez-Bucio, J.; Nieto-Jacobo, M.I. Organic acid metabolism in plants: From adaptive physiology to transgenic varieties for cultivation in extreme soils. Plant Sci. 2000, 160, 1–13. [Google Scholar] [CrossRef]
  29. Malamy, J.; Klessig, D.F. Salicylic acid and plant disease resistance. Plant J. 1992, 2, 643–654. [Google Scholar] [CrossRef]
  30. Raskin, I. Salicylate, a new plant hormone. Plant Physiol. 1992, 99, 799. [Google Scholar] [CrossRef] [Green Version]
  31. Hayat, Q.; Hayat, S.; Irfan, M.; Ahmad, A. Effect of exogenous salicylic acid under changing environment: A review. Environ. Exp. Bot. 2010, 68, 14–25. [Google Scholar] [CrossRef]
  32. Popova, L.; Pancheva, T.; Uzunova, A. Salicylic acid: Properties, biosynthesis and physiological role. Bulg. J. Plant Physiol. 1997, 23, 85–93. [Google Scholar]
  33. Bandurska, H.; Stroiński, A. The effect of salicylic acid on barley response to water deficit. Acta Physiol. Plant. 2005, 27, 379–386. [Google Scholar] [CrossRef]
  34. Gondor, O.K.; Janda, T.; Soós, V.; Pál, M.; Majláth, I.; Adak, M.K.; Balázs, E.; Szalai, G. Salicylic acid induction of flavonoid biosynthesis pathways in wheat varies by treatment. Front. Plant Sci. 2016, 7, 1447. [Google Scholar] [CrossRef] [Green Version]
  35. Gharib, F.A. Effect of salicylic acid on the growth, metabolic activities and oil content of basil and marjoram. Int. J. Agric. Biol. 2006, 4, 485–492. [Google Scholar]
  36. Senaratna, T.; Touchell, D.; Bunn, E.; Dixon, K. Acetyl salicylic acid (Aspirin) and salicylic acid induce multiple stress tolerance in bean and tomato plants. Plant Growth Regul. 2000, 30, 157–161. [Google Scholar] [CrossRef]
  37. Khoshbakht, D.; Asgharei, M.R. Influence of foliar-applied salicylic acid on growth, gas-exchange characteristics, and chlorophyll fluorescence in citrus under saline conditions. Photosynthetica 2015, 53, 410–418. [Google Scholar] [CrossRef]
  38. Khan, N.; Zandi, P.; Ali, S.; Mehmood, A.; Adnan Shahid, M.; Yang, J. Impact of salicylic acid and PGPR on the drought tolerance and phytoremediation potential of Helianthus annus. Front. Microbiol. 2018, 9, 2507. [Google Scholar] [CrossRef] [Green Version]
  39. Sakhabutdinova, A.R.; Fatkhutdinova, D.R.; Bezrukova, M.V.; Shakirova, F.M. Salicylic acid prevents the damaging action of stress factors on wheat plants. Bulg. J. Plant Physiol. 2003, 21, 314–319. [Google Scholar]
  40. El-Shraiy, A.M.; Hegazi, A.M. Effect of acetylsalicylic acid, indole-3-bytric acid and gibberellic acid on plant growth and yield of Pea (Pisum sativum L.). Aust. J. Basic Appl. Sci. 2009, 3, 3514–3523. [Google Scholar]
  41. Erdal, S.; Aydın, M.; Genisel, M.; Taspınar, M.S.; Dumlupinar, R.; Kaya, O.; Gorcek, Z. Effects of salicylic acid on wheat salt sensitivity. Afr. J. Biotechnol. 2011, 10, 5713–5718. [Google Scholar] [CrossRef]
  42. Moharekar, S.T.; Lokhande, S.D.; Hara, T.; Tanaka, R.; Tanaka, A.; Chavan, P.D. Effect of salicylic acid on chlorophyll and carotenoid contents of wheat and moong seedlings. Photosynthetica 2003, 41, 315. [Google Scholar] [CrossRef]
  43. Pancheva, T.V.; Popova, L.P.; Uzunova, A.N. Effects of salicylic acid on growth and photosynthesis in barley plants. J. Plant Physiol. 1996, 149, 57–63. [Google Scholar] [CrossRef]
  44. Çanakçi, S.; Munzuroğlu, Ö. Effects of salicylic acid on growth and chlorophyll destruction of some plant tissues. World J. Agric. Res. 2009, 5, 577–581. [Google Scholar]
  45. Çanakçi, S. Effects of salicylic acid on fresh weight change, chlorophyll and protein amounts of radish (Raphanus sativus L.) seedlings. J. Biol. Sci. 2008, 8, 431–435. [Google Scholar] [CrossRef]
  46. Çanakçi, S. Effects of salicylic acid on growth, biochemical constituents in pepper (Capsicum annuum L.) seedlings. Pak. J. Biol. Sci. 2011, 14, 300–304. [Google Scholar] [CrossRef] [PubMed]
  47. Iwańska, M.; Stępień, M. The effect of soil and weather conditions on yields of winter wheat in multi-environmental trials. Biom. Lett. 2019, 56, 263–279. [Google Scholar] [CrossRef] [Green Version]
  48. R Core Team. R: A Language and Environment for Statistical Computing; R Foundation for Statistical Computing: Vienna, Austria, 2019; Available online: https://www.R-project.org/ (accessed on 6 May 2020).
  49. Kaydan, D.; Yagmur, M.; Okut, N. Effects of salicylic acid on the growth and some physiological characters in salt stressed wheat (Triticum aestivum L.). Tarim Bilimleri Dergisi 2007, 13, 114–119. [Google Scholar]
  50. Yu, H.; Zhang, Q.; Sun, P.; Song, C. Impact of droughts on winter wheat yield in different growth stages during 2001–2016 in Eastern China. Int. J. Disaster Risk Sci. 2018, 9, 376–391. [Google Scholar] [CrossRef] [Green Version]
  51. Cogato, A.; Meggio, F.; De Antoni Migliorati, M.; Marinello, F. Extreme Weather Events in Agriculture: A Systematic Review. Sustainability 2019, 11, 2547. [Google Scholar] [CrossRef] [Green Version]
  52. Fleming, T.R.; Fleming, C.C.; Levy, C.C.; Repiso, C.; Hennequart, F.; Nolasco, J.B.; Liu, F. Biostimulants enhance growth and drought tolerance in Arabidopsis thaliana and exhibit chemical priming action. Ann. Appl. Biol. 2019, 174, 153–165. [Google Scholar] [CrossRef]
  53. Bulgari, R.; Franzoni, G.; Ferrante, A. Biostimulants application in horticultural crops under abiotic stress conditions. Agronomy 2019, 9, 306. [Google Scholar] [CrossRef] [Green Version]
  54. Yildirim, E.; Turan, M.; Guvenc, I. Effect of foliar salicylic acid applications on growth, chlorophyll, and mineral content of cucumber grown under salt stress. J. Plant Nutr. 2008, 31, 593–612. [Google Scholar] [CrossRef]
  55. Hayat, S.; Ali, B.; Ahmad, A. Salicylic acid: Biosynthesis, metabolism and physiological role in plants. In Salicylic Acid: A Plant Hormone; Springer: Dordrecht, The Netherlands, 2007; pp. 1–14. [Google Scholar]
  56. Janda, T.; Szalai, G.; Tari, I.; Paldi, E. Hydroponic treatment with salicylic acid decreases the effects of chilling injury in maize (Zea mays L.) plants. Planta 1999, 208, 175–180. [Google Scholar] [CrossRef]
Figure 1. PCA biplot showing the interaction between individuals (1, 2, …, 40) and selected traits. A: Control-NN-2013; B: ASA3-T1/T2-2013; C: ASA5-T1/T2-2013; D: ASA3-T3/T4-2013; E: ASA5-T3/T4-2013; F: Control-NN-2014; G: ASA3-T1/T2-2014; H: ASA5-T1/T2-2014; I: ASA3-T3/T4-2014; J: ASA5-T3/T4-2014. PH-plant height; EL-ear length; CH-chlorophyll; NG-number of grains per ear; MTG-mass of thousand grains; Y-yield; P-proteins in grain; G-gluten in grain; S-starch in grain; SI-sedimentation index; GH-grain hardness index; GD-grain density.
Agronomy 10 01918 g001
Figure 2. PCA biplot showing the interaction between concentrations of acetylsalicylic acid (ASA) and selected traits in spring wheat broken down by terms of application (T1/T2, T3/T4). PH-plant height; EL-ear length; CH-chlorophyll; NG-number of grains per ear; MTG-mass of a thousand grains; Y-yield; P—proteins in grain; G-gluten in grain; S-starch in grain; SI-sedimentation index; GH-grain hardness index; GD-grain density.
Agronomy 10 01918 g002
Figure 3. PCA biplot showing the interaction between terms of application (T1/T2, T3/T4) and selected traits in spring wheat with the distinction of acetylsalicylic acid concentrations. PH-plant height; EL-ear length; CH-chlorophyll; NG-number of grains per ear; MTG-mass of a thousand grains; Y-yield; P-proteins in grain; G-gluten in grain; S-starch in grain; SI-sedimentation index; GH-grain hardness index; GD-grain density.
Agronomy 10 01918 g003
Figure 4. PCA biplot showing the interaction between concentrations of acetylsalicylic acid (ASA3, ASA5) used in two terms (T1/T2, T3/T4) and selected traits in spring wheat analyzed in both years. PH-plant height; EL-ear length; CH-chlorophyll; NG-number of grains per ear; MTG-mass of a thousand grains; Y-yield; P-proteins in grain; G-gluten in grain; S-starch in grain; SI-sedimentation index; GH-grain hardness index; GD-grain density.
Agronomy 10 01918 g004
Figure 5. (A) Plant height (PH); (B) ear length (EL); (C) chlorophyll content (CH); (D) number of grains per ear (NG) of wheat: concentrations (ASA3, ASA5) *terms of applications (T1/T2, T3/T4) *years (2013, 2014). Boxes: the interquartile range. Lines across the boxes: the average of the values. The line above and below the vertical dashed lines: the maximum and minimum values. Boxes of the same color indicate a group of similar objects. The letters a, ab, b, … indicate similar objects in order of highest average value. A = ASA3 *T1/T2 *2013; B = ASA5 *T1/T2 *2013; C = ASA3 *T1/T2 *2014; D = ASA5 *T1/T2 *2014; E = ASA3 *T3/T4 *2013; F = ASA5 *T3/T4 *2013; G = ASA3 *T3/T4 *2014; H = ASA5 *T3/T4 *2014.
Agronomy 10 01918 g005
Figure 6. (A) Mass of thousand grains (MTG); (B) grain density (GD); (C) grain hardness (GH); (D) yield (Y) of wheat: concentrations (ASA3, ASA5) *terms of applications (T1/T2, T3/T4) *years (2013, 2014). Boxes: the interquartile range. Lines across the boxes: the average of the values. The line above and below the vertical dashed lines: the maximum and minimum values. Boxes of the same color indicate a group of similar objects. The letters a, ab, b, … indicate similar objects in order of highest average value. A = ASA3 *T1/T2 *2013; B = ASA5 *T1/T2 *2013; C = ASA3 *T1/T2 *2014; D = ASA5 *T1/T2 *2014; E = ASA3 *T3/T4 *2013; F = ASA5 *T3/T4 *2013; G = ASA3 *T3/T4 *2014; H = ASA5 *T3/T4 *2014.
Agronomy 10 01918 g006
Figure 7. (A) Sedimentation index (SI); (B) protein (P); (C) gluten (G); (D) starch (S) content of wheat grains: concentrations (ASA3, ASA5) *terms of applications (T1/T2, T3/T4) *years (2013, 2014). Boxes: the interquartile range. Lines across the boxes: the average of the values. The line above and below the vertical dashed lines: the maximum and minimum values. Boxes of the same color indicate a group of similar objects. The letters a, ab, b, … indicate similar objects in order of highest average value. A = ASA3 *T1/T2 *2013; B = ASA5 *T1/T2 *2013; C = ASA3 *T1/T2 *2014; D = ASA5 *T1/T2 *2014; E = ASA3 *T3/T4 *2013; F = ASA5 *T3/T4 *2013; G = ASA3 *T3/T4 *2014; H = ASA5 *T3/T4 *2014.
Agronomy 10 01918 g007
Table 1. Selyaninov hydrothermic coefficient in months during the vegetative seasons of wheat.
YearMonth/Decades
AprilMayJune
IIIIIIMeanIIIIIIMeanIIIIIIMean
20132.12.50.01.50.10.50.10.200.30.10.1
20140.10.10.20.10.40.43.21.31.91.33.72.3
0–1.3—water deficit; 1.31–1.6—adequate water supply; >1.61—excessive water supply.
Table 2. ANOVA test for plant height, ear length, chlorophyll content, number of grains per ear, grain density, mass of thousand grains, grain yield, sedimentation index, grain hardness index and protein, gluten and starch content in grains of wheat.
Experimental FactorDfSum SqMean SqF valuePr (>F)
Plant height
Years157057035.256<0.0001 ***
Terms of treatment2602.2301.118.623<0.0001 ***
Concentrations1116.3116.37.1920.0111 *
Residuals35565.916.2
Ear length
Years19.6049.60453.75<0.0001 ***
Terms of treatment23.0881.5448.6410.0009 ***
Concentrations10.090.090.5050.4818
Residuals356.2540.179
Chlorophyll content
Years1226522651.5120.227
Terms of treatment2682023410122.758<0.0001 ***
Concentrations1458445843.0590.089
Residuals35524461498
Number of grains per ear
Years190.690.676.159<0.0001 ***
Terms of treatment297.7548.8841.085<0.0001 ***
Concentrations16.396.395.3720.0264 *
Residuals3541.641.19
Grain density
Years180.3780.3755.411<0.0001 ***
Terms of treatment262.2631.1321.462<0.0001 ***
Concentrations10.020.020.0140.907
Residuals3550.771.45
Mass of thousand grains
Years1240.15240.15228.899<0.0001 ***
Terms of treatment289.1544.5742.485<0.0001 ***
Concentrations10.980.980.9370.34
Residuals3536.721.05
Yield
Years110.49610.496851.231<0.0001 ***
Terms of treatment21.070.53543.405<0.0001 ***
Concentrations10.0370.0373.0110.0915
Residuals350.4320.012
Sedimentation index
Years11180.51180.5391.595<0.0001 ***
Terms of treatment2151.475.725.108<0.0001 ***
Concentrations18.38.32.7540.106
Residuals35105.53
Grain hardness index
Years131.4931.499.2120.00452 **
Terms of treatment2137.5468.7720.118<0.0001 ***
Concentrations13.423.4210.3241
Residuals35119.643.42
Protein content in grain
Years123.56223.56246.561<0.0001 ***
Terms of treatment214.277.13514.1<0.0001 ***
Concentrations13.4453.4456.8080.0133 *
Residuals3517.7120.506
Gluten content in grain
Years130.6230.62544.664<0.0001 ***
Terms of treatment237.5818.7927.404<0.0001 ***
Concentrations10.320.320.4670.499
Residuals35240.686
Starch content in grain
Years1246.41246.41172.973<0.0001 ***
Terms of treatment214.257.135.0020.0123 *
Concentrations10.560.560.3930.5351
Residuals3549.861.42
Df: Degrees of freedom; Sum Sq: Sum of squares; Mean Sq: Mean square; F value: The value of the F statistic; Pr (>F): Probability of rejecting the null hypothesis. Levels of significance are as follows: *, p <0.05; **, p < 0.01 and ***, p < 0.001.
Table 3. Influence of acetylsalicylic acid on morphological traits, chlorophyll content in leaves and yield parameters of wheat.
TraitConcentrationTerm of ApplicationYear
ControlASA3
mM
ASA5
mM
ControlT1/T2T3/T420132014
Plant height (cm)70.75 ± 6.63 c77.75 ± 6.36 b81.56 ± 4.59 a70.75 ± 6.63 b77.94 ± 5.76 a81.38 ± 5.46 a74.10 ± 6.23 b81.65 ± 5.36 a
Ear length (cm)8.56 ± 0.71 a8.82 ± 0.75 a8.93 ± 0.66 a8.56 ± 0.71 b8.59 ± 0.72 b9.15 ± 0.55 a8.32 ± 0.59 b9.30 ± 0.38 a
Chlorophyll content (SPAD)470.8 ± 63.64 b556.6 ± 35.83 a580.6 ± 30.59 a470.8 ±63.64 b553.9 ± 37.84 a583.3 ± 25.12 a541.5 ± 74.67a556.6 ± 31.86 a
Number of grains per ear (pcs.) 24.6 ± 1.62 b26.8 ± 2.27 a27.7 ± 2.43 a24.6 ± 1.62 c26.0 ± 2.15 b28.6 ± 1.84 a25.2 ± 2.01 b28.3 ± 1.91 a
Mass of thousand grains (g)33.81 ± 3.16 b35.97 ± 2.99 a36.33 ± 2.91 a33.81 ± 3.16 b34.85 ± 3.17 b37.45 ± 1.95 a33.23 ± 2.29 b38.13 ± 1.19 a
Grain density (kg·hl–1)76.4 ± 1.84 a77.6 ± 2.49 a77.6 ± 2.12 a76.4 ± 1.84 b76.3 ± 2.08 b78.9 ± 1.68 a76.0 ± 1.90 b78.8 ± 1.52 a
Grain hardness index40.31 ± 0.92 b41.67 ± 3.25 ab42.32 ± 2.66 a40.31 ± 0.92 b40.07 ± 2.73 b43.93 ± 1.56 a40.78 ± 3.20 b42.55 ± 1.86 a
Yield (t·ha–1)2.83 ± 0.52 b3.09 ± 0.55 a3.16 ± 0.58 a2.83 ± 0.51 c3.00 ± 0.58 b3.25 ± 0.52 a2.55 ± 0.20 b3.57 ± 0.20 a
Sedimentation index 45.70 ± 6.21 b 48.14 ± 5.73 a49.16 ± 6.43 a45.70 ± 6.21 b46.93 ± 5.09 b50.38 ± 6.51 a42.63 ± 2.03 b53.49 ± 3.13 a
Protein content in grain (%)11.95 ± 0.88 c12.91 ±1.24 b13.56 ± 1.05 a11.95 ± 0.88 c12.89 ± 1.29 b13.58 ± 0.98 a12.21 ± 1.10 b13.75 ± 0.81 a
Gluten content in grain (%)31.85 ± 1.51 b33.34 ± 1.42 a33.54 ± 1.41 a31.85 ± 1.51 b32.62 ± 1.19 b34.26 ± 1.09 a32.25 ± 1.43 b34.00 ± 1.10 a
Starch content in grain (%)67.39 ± 2.34 a66.06 ± 2.94 b65.80 ± 2.93 b67.39 ± 2.34 a66.07 ± 2.55 b65.79 ± 3.28 b68.71 ± 1.01 b63.74 ± 1.54 a
ASA—acetylsalicylic acid; T1—application at GS BBCH 29; T2—application 7 days after T1; T3—application at GS BBCH 37; T4—application 7 days after T3. Mean values ± SD with different letters in the rows (Control, ASA 3 mM, ASA 5 mM; Control, T1/T2; T3/T4; 2013, 2014) are significantly different according to Tukey’s test at p < 0.05.
Publisher’s Note: MDPI stays neutral with regard to jurisdictional claims in published maps and institutional affiliations.

