Article

Modification of the TOMCAST Model with Aerobiological Data for Management of Potato Early Blight

by
Laura Meno
,
Olga Escuredo
*,
Maria Shantal Rodríguez-Flores
and
Maria Carmen Seijo
Department of Vegetal Biology and Soil Sciences, Faculty of Sciences, University of Vigo, As Lagoas, 32004 Ourense, Spain
*
Author to whom correspondence should be addressed.
Agronomy 2020, 10(12), 1872; https://doi.org/10.3390/agronomy10121872
Submission received: 21 October 2020 / Revised: 20 November 2020 / Accepted: 25 November 2020 / Published: 27 November 2020
(This article belongs to the Special Issue Integrated Pest Management of Horticultural Crops)

Abstract

:
The present study focuses on establishing thresholds of weather variables for predict early blight in potato crops. For this, the TOMCAST model was adjusted using weather variables and Alternaria conidia levels (mainly A. solani and A. alternata) during six growing seasons in A Limia (Northwest Spain). TOMCAST for the effective management of early blight considers leaf wetness and air temperature to calculate daily severity values (DSVs). Spearman correlations between temperature (minimum and average), mean temperature during leaf wetness period and Alternaria concentration showed the highest positive significant coefficients (0.386, 0.230 and 0.372, respectively; p < 0.01). Specifically, Alternaria levels higher than 50 spores/m3 were found the days with air mean temperature above 18 °C, more than 7 h of leaf wetness. Leaf wetness was decisive to estimate the concentration of Alternaria, resulting in a significant linear regression model (R2 = 0.41; p < 0.001). TOMCAST was adapted to the area, considering 10 °C the minimum threshold for the mean value of temperature during the wet period and 10–15 accumulated disease severity values (DSV). Using TOMCAST, it was possible to predict the first Alternaria peak in most of potato growing seasons. Combining aerobiological and meteorological data to control fungal diseases during crops are a useful tool for sustainable agriculture.

1. Introduction

The potato (Solanum tuberosum L.) is the world’s fourth-most important crop after rice, wheat and maize, and the first among non-grains [1]. Spain produces less than 4% of European potato production, but in some Spanish areas such as A Limia, this crop is the primary income source for people. The potatoes are alternated with cereal crops generating many jobs for families.
The main part of the agricultural land in the area is a consequence of the mechanical desiccation of the largest wetland in the Iberian Peninsula. Thus, the sandy and silty soils together with weather conditions during summer, increase the agricultural drought risk and forcing growers to practice irrigated agriculture [2]. These conditions provide the ideal environment for the development of fungal diseases on potato plants. When ideal conditions occurred over time, the disease gets worse having a negative impact on yields.
In terms of economic losses, one of the most important fungal diseases is early blight caused by various Alternaria species. This pathogen has devastating effects in many potato-growing regions [3,4,5,6]. The main causal agents are the species A. solani Soraeur and A. alternata (Fr.) Keissl [3,4,6]. However, other Alternaria spp. have been advised to be associated with potato leaf blight, such as A. arborescens, A. arbusti and A. tenuissima in the U.S. northwest [7]; A. tenuissima in China [8]; A. tomatophila and A. grandis in Brazil [9]; A. tenuissima, A. dumosa, A. arborescens and A. infectoria in Iran [10]; A. protenta in Algeria [11] and A. alternata, A. arborescens, A. protenta, and A. grandis in Europe [12]. Recently, considering morphologic traits of conidia complemented with molecular analyses, Alternaria species can be classified in two groups: large-spored species like A. solani and small-spored species such as A. alternata and A. tenuissima [8]. A. tomatophila was associated with early blight, but it is weakly aggressive to potato [9,13]. Due to morphological differences and the serious threats caused by A. solani and A. alternata in potato, the aerobiological sampling focused on both species.
The presence of alternative hosts (weeds or other solanaceous species) increases their incidence and severity [14,15]. Early blight produces dark coloured lesions recognized by its distinctive concentric rings around 3 to 12 mm diameter [3]. These lesions are also restricted within the leaf veins. First foliar symptoms become visible on the lowest and, oldest leaves just a few weeks after emergence [6]. So, the greatest intensity is usually observed on mature and senescent tissues [16], causing damage in potato crops with up to 50% yield losses [3]. Although early blight is particularly prevalent in tropical and temperate zones, 70% foliage destruction at the end of the growing season was documented in northern Europe [17].
In recent years, a higher incidence of early blight has been observed on potato plants in A Limia [5,18]. Several researchers have highlighted the effects of global climatic changes on agricultural pests [19,20,21], considering the temperature as the main limiting factor [14,15,22,23]. Climate change is exerting variations in the distribution of the pathogen and due to possible adaptations generating changes in the ideal conditions for the development and sporulation. Hence, the importance of an extensive collection of updated data that allows establishing controls in local environments and diminish the incidence of the disease in the field.
Growers try to fight these pathogens by applying fungicides. The chemical treatment has been applied for years employing pre-established calendars, based on applications every 15 days independently of the risk of disease. Prediction models based on meteorological variables are an opportunity for the environmentally friendly application of chemical products. However, the precise modelling of plant disease is particularly difficult because it requires specialist staff to identify critical biophysical processes driving disease spread based on time and location [24].
Epidemiological models using mathematical descriptions of the interaction between the environment, host and pathogen to forecast when the disease will occur and to improve the use of control measures were developed [24]. Many models are based exclusively on meteorological factors to calculate accumulated risk units when the conditions are favorable for the infection. Most of them consider temperature as the crucial factor for a successful decision support system applied to vegetable crops [25]. This is the case of the TOMato disease foreCASTing (TOMCAST) system, based on a computer model developed to predict early blight with field data validated in different locations in the United States [26]. This model is derived from the original Forecasting Alternaria solani on Tomatoes (FAST) program and considers leaf wetness and air temperature to calculate daily severity values (disease severity values: DSV) that quantitatively represents favorable conditions for the development of early blight [26]. These values are accumulated until reaching at least 10 DSV to 45 DSV, depending on local environmental conditions or crop [27,28,29,30]. Firstly, the model was developed to estimate diseases such as early blight, septoria leaf spot and anthracnose affecting tomatoes [28,29]. Later, TOMCAST was used to predict Stemphyllium in Asparagus and foliar blight in carrots, celery or pistachios [31,32,33,34,35,36,37]. In the case of potato crops, TOMCAST model was adapted to predict early blight in different geographical areas [15,25,27,30,38].
A successful forecast system of early blight in potato may improve disease control, reduce environmental impact by lower application of chemical products, improve crop quality and reduce costs for growers. Until now, the studied geographical area has not adopted decision support models to predict fungal diseases and regulate the application of fungicides. The objective of the present study was to improve a decision support system for Alternaria management in potato crops growing in A Limia (Northwest Spain) by applying the TOMCAST forecasting model. For this purpose, weather conditions and Alternaria conidia concentration in the environment during 6 growing seasons were considered. This is the first study that considers Alternaria levels in the crop environment to improve the prediction of the TOMCAST model. Before fitting the model, the climate data were statistically treated to establish significant relationships with Alternaria levels in the crop, and possible favorable thresholds for this pathogen.

2. Material and Methods

2.1. Geographical Area, Growing Period and Agronomic Practices of Potato Crop

The study was conducted in a potato field situated in A Limia (Ourense, northwestern Spain) during six growing seasons from 2014 to 2019. The sowing day fluctuated between ends of April to early June depending on the year. This difference was caused by previous rain episodes, which affect soil management and delay tubers sowing. The dates of the main phenological phases, some agronomic practices and fungicide application during the growing seasons are included in Table 1.
The potato cultivar planted each year was Agria. These potatoes are in high demand in the food industry because are used for cooking and widely consumed as French fries or chips. Plants of this potato cultivar are characterized by good and dense foliage with erect growth habit and late maturity. Agria is resistant to many virus and fungi [34], but for Alternaria, this cultivar is categorized as susceptible [35].

2.2. Weather Monitoring

Meteorological data were recorded using an iMETOS ® 3.3. by a Pessl Instruments weather station (Weiz, Austria) (Figure 1) and an ONSET HOBO H08-032-08 recorder (Onset Computer Corporation, MA, USA). The monitored variables were temperature, relative humidity and leaf wetness recorded each hour by specific station sensors. The sensors of these weather systems were placed 1.5 m above the potato plants. The mean temperature of the leaf wetness period was calculated with the average hourly temperature during the hours in which wetness was recorded in leaves by leaf wetness sensor. Rainfall information was obtained from the nearest weather station of the National Weather Service [39].

2.3. Aerobiological Sampling

The level of Alternaria conidia in the environment of the crop were sampled using a volumetric sampler Lanzoni VPSS 2000 (Lanzoni S.r.l., Bologna, Italia), which was placed in the study field at a height of 1.5 m above ground level (Figure 1). This sampler contains a pump that lets an active suction method of airflow (10 L/min). The air entrance allows impaction of particles in a Melinex tape coated with a silicon solution as the adhesive trapping surface placed inside the recorder drum. The drum rotates due to a clockwork mechanism, ensuring daily sampling for 7 consecutive days. Alternaria conidia counted using an Eclipse E200 optical microscope (Nikon YS100, Nikon Instruments Inc., New York, NY, USA) equipped with a 40X/0.65 lens, following the methodology proposed by the Spanish Aerobiological Network (R.E.A) [40]. Concretely, A. solani and A. alternata are the most relevant in the study area, and these species based on their conidia morphology were identified. Finally, the results were expressed as the number of spores per cubic meter of air.

2.4. The TOMCAST Weather-Timed Fungicide Spray

The TOMCAST weather-timed fungicide spray [28], derived from original FAST model, is based on weather variables [26]. The original model establishes daily severity values (DSV) considering interactive effects of hours of leaf wetness and the average air temperature during these hours (Table 2).
The daily scale of DSVs ranging from 0 (environmental conditions unfavorable for Alternaria spore formation) to 4 (highly favorable conditions) [26]. DSVs are accumulated daily during the growing season, when the early blight infection risk value is reached, a fungicide sprays is recommended. The original TOMCAST model was applied for each growing season during the first stages of the crop to predict first peaks of potato Alternaria counted. Four thresholds were fixed: 10 DSV, 15 DSV, 20 DSV and 30 DSV. Similar values were set by other authors for different geographical areas to control early blight in tomato and potato crops [15,25,27,28,30,38]. To adapt TOMCAST model the level of Alternaria conidia in the potato crop ambient, was consider together with two different thresholds for temperature (10 °C and 13 °C) [15,25,30,38].

2.5. Statistical Analysis

Aerial potato Alternaria concentration and meteorological factors for each growing season were compared through an analysis of variance using the Bonferroni test (p < 0.05). Spearman linear correlation analysis was applied to determine direct relationships among each meteorological variable and Alternaria levels in air. The Spearman correlation coefficients were calculated using the conidia concentration and weather variables for the same day and the 5 previous days, with a significance level of p < 0.05. The meteorological variables, as independent variables, were used to estimate the Alternaria concentration in the crop environment through a linear regression analysis. For statistical treatments, the SPSS 21.0 software package for Windows (IBM, Somers, NY, USA) was used.

3. Results

3.1. Airborne Concentration of Alternaria Conidia during the Growing Season

Aerial potato Alternaria were present during the entire potato crop season. Differences in the total number of spores and mean concentration of the pathogen between the six growing seasons were found. In 2017 and 2018, a greater number of total conidia were counted, with values above 10,000 spores (Table 3). Also, the daily average concentration was significantly higher than other years, with a mean value of 116 spores/m3 and 89 spores/m3, respectively (p < 0.05). On the contrary, the 2015 had the lower number of Alternaria conidia (3651 spores in total), with a mean concentration of 42 spores/m3 (the lowest of the study period). The growing season of 2014, 2016 and 2019 showed a similar trend in the total number of conidia and mean concentration, with total values around 6000 spores, and a mean concentration between 59 spores/m3 and 74 spores/m3.

3.2. Seasonal Variability of Environmental Conditions

There were significant differences among values of the meteorological factors recorded each growing season (Table 4). The growing season of 2015 and 2016 had a mean value significantly higher in the maximum temperature (with mean values of 29.8 °C and 32.3 °C, respectively) than the other growing seasons (mean maximum value lower than 26.5 °C) (p < 0.05). The average temperature was significantly higher in 2015, 2016 and 2018 cycles, with mean values around 19 °C. On the contrary, the lower values (around 17 °C) (p < 0.05) were registered the years 2014, 2017 and 2019. Respect to minimum temperature, 2018 had mean value significantly higher (11.8 °C) than the other growing seasons. The greatest differences were found in average and maximum temperatures.
Analyzing the two years of higher concentration of Alternaria (2018 and 2017), it was not possible to verify a similar climatic trend that explains the high spore levels in the crop environment. Both years presented an intermediate average temperature and a relatively low maximum temperature. Quite the opposite occurred with years of less concentration of Alternaria, such as 2015 and 2016, which recorded the highest average and maximum temperatures. However, the average minimum temperature was decisive in the 2018 cycle, with the highest mean values, being able to relate it to the high Alternaria concentration recorded throughout this year.
Respect to the variation of temperature by cycle represented by the coefficient of variation, the average minimum temperature had the greatest variation (>20%) (Table 4). On the contrary, the mean and maximum temperatures showed a similar trend, with a percentage of variation of approximately 15% in the first years and around 20% in recent years. The year 2017 stood out for presenting the highest coefficient of variation for the average, maximum and minimum temperature, coinciding with the crop cycle of higher Alternaria concentration. However, in 2018, despite having less oscillation in the minimum temperature compared to the rest of the years, the variability of the maximum and average temperatures was higher (>20%) than the first years. Therefore, the maximum temperature oscillations affected positively the development of the pathogen.
The wet period during the growing cycle can also affect Alternaria development. The relative humidity and hours of leaf wetness showed greater differences between the years. Significantly higher average relative humidity in 2014 and 2018 were recorded (with mean values greater than 76%); while, 2016 and 2017 cycles showed significantly lower mean values (<73%). The number of hours with leaf wetness in 2018 was significantly higher than other cycles (with a mean value of 9.1 h), while, in 2014, 2015 and 2017, the daily values were significantly lower (less than 7.4 h). Analyzing the mean temperature recorded during the leaf wetness period, the cycles with more leaf wetness hours had a higher mean temperature within this period. This was the case of 2018 cycle, which had a significantly higher mean value (13.6 °C). Leaf wetness had the highest coefficient of variation (>40%), with the greatest values in 2017. However, the mean values of temperature during the leaf wetness period had low variation, with values around 20%. Mean relative humidity had the lower coefficient of variation, with values between 11.1% in 2015 and 16.2% in 2017. Finally, the mean values of the accumulated rainfall were significantly different between the years, being in 2017 and 2018 significantly higher (mean value of 2.9 mm) when compared to other cycles.
The variables affecting wet period of plants, such as relative humidity, leaf wetness and rainfall, had a common pattern with the presence of high levels of Alternaria (especially in 2018). The days with high Alternaria levels had higher accumulated rainfall, higher relative humidity, greater number of hours of leaf wetness, as well as a higher mean temperature during the period of leaf wetness. On the other hand, the year of lesser Alternaria concentration (year 2015) presented an opposite weather pattern. It is important to highlight the high coefficients of variation found in the meteorological factors in 2017. Intermittent and continuous changes in temperature and wet period throughout the crop cycle could favor the high incidence of Alternaria resulting in the high concentration of conidia in the environment.

3.3. Optimal Requirement of Temperature and Wet Period for the Quantitative Abundance of Airborne Alternaria Conidia

To carry out a deeper analysis of the influence of the meteorological variables on Alternaria, classes with conidia levels in the crop environment were established. The classes were based on the daily concentration: zero (0 spores/m3), low (0–50 spores/m3), intermediate (51–90 spores/m3) and high (>90 spores/m3). Table 5 includes the mean values of meteorological variables recorded according to the period of each Alternaria level categorized. Comparing the mean temperature calculated by Alternaria class, it was possible to distinguish an ascended temperature related to Alternaria concentrations above 50 spores/m3. Thus, the presence of Alternaria spores considering low, intermediate and high levels had a significantly higher mean temperature (17.3 °C, 18.9 °C and 18.3 °C, respectively) than the class without conidia (16.3 °C). The same occurred for the maximum and minimum temperature, with mean values above 27 °C and 10 °C, in the intermediate and high levels, respectively. Therefore, the thermal requirement necessary to find Alternaria in the atmosphere of the potato crop in A Limia comprising these values of minimum and maximum temperature.
The higher concentrations of Alternaria (high level) corresponded with the higher mean relative humidity (mean value of 75.6%), being significantly different with the intermediate class. The hours of humidity above 80% were similar in the four categories, with an average value around 12 h. It was impossible to establish a direct relationship among the pathogen levels and the rainfall. However, the hours of leaf wetness were significantly higher within high-level (8.3 °C) respect to the other levels. The mean temperature registered during this wet period was significantly higher in intermediate and high levels (13 °C). These results explain that wet periods in the leaves of the plants favor the formation of Alternaria conidia. At the same time, if the required air temperature conditions (in terms of maximum and minimum values) occur, important daily peaks such as those recorded above 90 spores/m3 were possible.

3.4. Linear Associations among Weather Variables and Airborne Alternaria Conidia

Spearman’s linear correlation analysis allowed establishing direct relationships with the levels of the pathogen. The environmental factors and the presence of aerial Alternaria conidia counted during same day and with up to 5 previous days were considered (Table 6). The mean, minimum and maximum temperatures of the day and 5 days prior (p < 0.01) were positively correlated with Alternaria. To minimum temperature, the best correlation coefficient was reached at 5 previous days (0.386). To maximum and mean temperature, best coefficient was at same day (0.141 and 0.230, respectively). The mean relative humidity of the previous days was strongly positive correlation, with the highest correlation coefficient being up to 5 days (0.236) (p < 0.01). However, considering the mean relative humidity on the same day, the correlation coefficient was not significant. The days with hours of relative humidity higher than 80% (previous day and until 5 days) showed significant correlation coefficients and positive with Alternaria concentration (from 0.113 to 0.196). Spearman analysis showed significant correlation with mean temperature during leaf wetness, from previous day to 5 days before (p < 0.05) and better correlation coefficients at fourth and fifth previous days (0.357 and 0.372, respectively). Rain had not correlation with Alternaria concentration.
The statistical treatment showed the need to consider the environmental conditions registered days before, since they will condition the proliferation of spores of fungi and the consequent manifestation of leaf disease in the field. A linear regression analysis was applied to relate multiple variables with the Alternaria level in the environment of the potato crop. A predictive model is based on a number of factors that are likely to influence or predict future behavior. In this case, the best estimator of Alternaria concentration was the pathogen level during the previous day, the mean temperature during the wet period of the previous 3 days and relative humidity registered 5 days before. The regression equation showed an F value of 140 (p < 0.001), accounting for 41% of variation of data (Table 7).

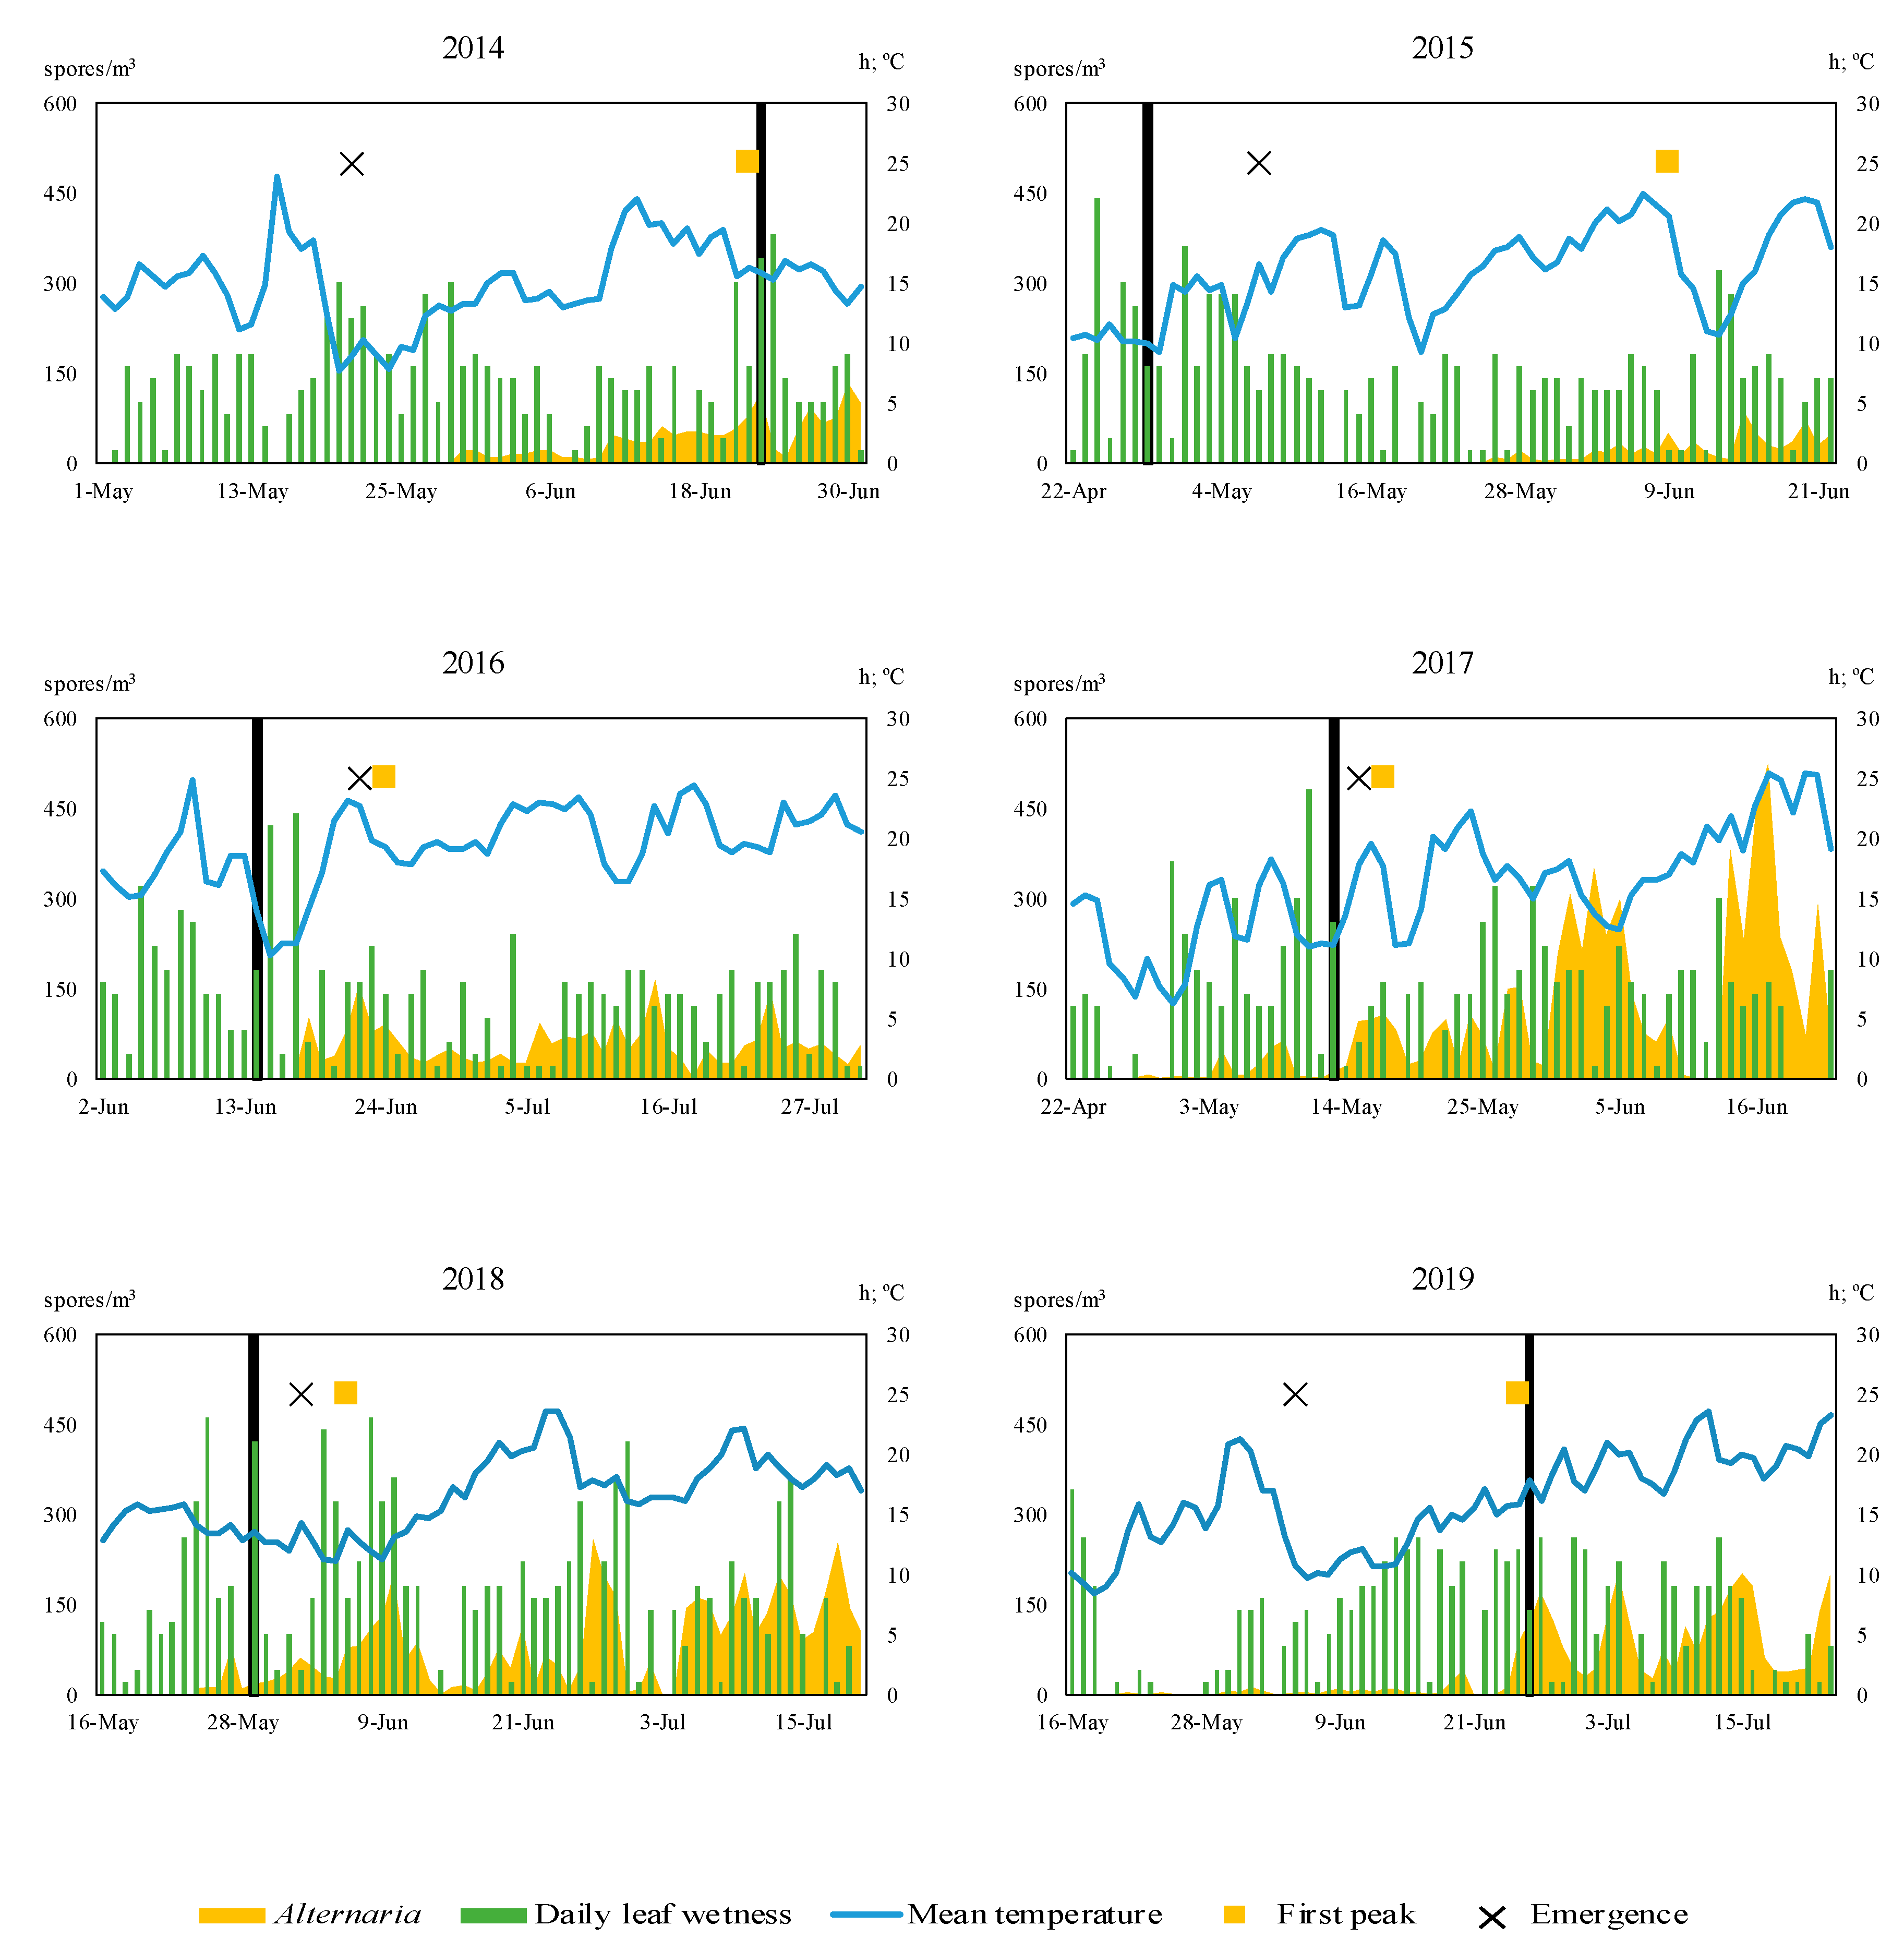
3.5. Combining TOMCAST System with Aerobiological Data for the Prediction of the First Alternaria Peak

The prediction of the potato Alternaria identified at first peak are very important to reduce the presence of inoculum at entire growing season. The first significant potato Alternaria spores that cause peaks in all growing season were identified in May or June (Figure 2). Even in the 2016, 2017 and 2018 growing seasons, the first important peaks were registered in the air within the germination of the first plants. Therefore, plants were exposed to infection since early phenology stages such as germination and development of leaves.
The mean temperature of 13 °C is included in the theoretical model described in the literature. Considering this value, no disease severity value was reached before the first peaks (Table 8). However, with values above 10 °C during the period of leaf wetness, an increase in the levels of Alternaria in the air was detected. A similar modification of this thermal requirement was also considered by other authors to adapt TOMCAST model to local conditions. For this reason, the threshold for the daily mean temperature used during leaf wet hours was down to 10 °C. This improved the prediction for the first peak adjusting the number of days before. Specifically, the best result was obtained at 10 DSV, with an acceptable previous prediction in some cycles (3 days in advance in 2017, 8 days in 2018, 9 days in 2016). For 2014 and 2019, it was not possible to predict the first peak early, but the model showed a close date (1 day after). For 2015, the prediction was 42 days before. When 15 DSV level was considered, the prediction was also acceptable for the years 2015, 2016, and 2018, but worse for 2014, 2017 and 2019.

4. Discussion

In the last decades, the infection patterns of some agricultural pests, their severity, and the area of expansion have been modified due to the changing trend in climatic factors [19,20,21]. In Spain, increases on temperatures, shorter winters and longer, drier and hotter summers are some of the reliable effects. Thus, a longer duration and intensity of early blight attacks in potato crops for future years is expected [5,18].
The influence of the main meteorological factors on the concentration of Alternaria was manifested during the study period in A Limia. However, it is difficult to establish a specific behavior of the pathogen related to the variation of weather during the growing seasons. Agricultural practices, nearby plots with contaminated plants, chemical treatments, type of irrigation and potato variety resistance are factors influencing Alternaria pressure. Some of these factors also depend on variations in climate regimes [19,25]. Consequently, the estimation of the influence of weather variables on the development of the disease in field is a difficult task. Some reports suggested that 10 °C and 35 °C are the minimum and maximum temperatures at which early blight epidemics can occur [25]. This range of temperature was found several days before important peaks of conidia concentration in the potato field of A Limia. Concretely, Alternaria levels higher than 50 spores/m3 in the studied area coincided with a minimum temperature of 10 °C, and a maximum temperature above 27 °C. Therefore, this range of temperature can be considered as the favorable threshold for infection risk in the area. The higher number of days with these conditions were recorded in 2017 and 2018 years (with 66 and 72 days, respectively), manifesting a greater pressure of the inoculum in the environment. It was also found that alternate changes in the relative humidity or temperature throughout the growing season, positively affected the conidia levels. This fact was verified concretely for 2017 (with the highest number of conidia), presenting the highest coefficient of variation of air temperature (more than 20%), leaf wetness (65.8%), and mean temperature during the leaf wetness (28.6%).
Wet periods favor germination and infection of Alternaria [18,25,41,42]. The relative humidity of air is the most studied variables influencing positively in the sporulation and infection of potato early blight [5,18,25]. However, some researchers concluded that leaf wetness duration together with potato variety are critical factors to forecast the risk of infection of early blight in Solanaceae [14]. It was specified temperatures above 22 °C and more than 8h of leaf wetness, as favorable weather conditions for A. solani infections [6]. The presence of a high number of hour of relative humidity (values higher than 80%) during growing season, was correlated with Alternaria levels. This is a dependence previously manifested, even setting optimal values at 85% [25] or 80% [18] for potato early blight. However, considering the mean value of the relative humidity for the periods within the four classes of conidia established (zero, low, intermediate and high), no clear pattern was found. This is due an interrupted wetting period may often be more conducive to producing spores than a continuous wet period [3,6,18,25,41]. Again, growing seasons of 2017 and 2018 had the most important variation in relative humidity values. In addition, days with high levels of Alternaria (>90 spores/m3) had a greater number of hours of leaf wetness.
Effective management of disease during crop is essential to obtain high quality tubers. Tools to forecast the risk of the disease allow to implement treatments and to control it effectively. Many numerical models and monitoring networks have been developed to forecast the spread of some diseases locally and over long distances [24,43,44]. Frequently, these models use weather variables and plant phenology but do not consider the presence of pathogen in field, being this the third support for the disease. For this reason, the development of statistical models with aerobiological data to prevent phytopathological damages in crops has increased in recent years [44,45,46,47,48]. Most of the predictive models concluded daily Alternaria conidia in air can be predicted using the spore concentrations of days before, and meteorological variables like maximum and minimum temperature and minimum relative humidity [23,46,49]. This study showed the influence of wet period or the hours of leaf wetness, as well as the existence of interrupted wet periods as favorable conditions for the presence of Alternaria.
Decision support systems are also used as a part of crop disease management in response to the climatic conditions of the specific area [2,18,30,33,37,50]. The TOMCAST model was developed in 1976 for early blight prediction on tomato in Pennsylvania [18], being applied later to predict early blight on potatoes in other parts of the United States [15]. A good forecasting model need to be effective in multiple environments, making necessary the local validation [37]. For this reason, TOMCAST has been successfully implemented to manage early blight on different crops [28,31,32,33,36,37,51]. Recently, the model was validated in Denmark on potato fields lowering the thermal requirements (using a mean temperature of 10 °C) to reduce the possibilities of false negative prediction [25,30]. In this work the same limit for mean temperature was used, being first time the TOMCAST system is adapted to local environmental conditions in Spain to predict early blight on potatoes.
The disease severity values (DSV) reached by TOMCAST system to recommend the first fungicide treatment are variable. To control early blight in tomato in Canada, a threshold of 35 DSV was recommended [28], to control Alternaria in pistachio growing in California, the value was 10 DSV [36]. The same value was proposed to control Septoria late blight on celery [32] whereas 20 DSV was settled for asparagus crop [37]. There are few works about the validation of TOMCAST for early blight on potato [15,25,27,30,38]. In Denmark thresholds of 15 DSV, 20 DSV and 25 DSV were used for timing fungicide application to control disease attack, but 15 DSV and 25 DSV was the most efficient [25,30,37]. A similar DSV value (of 15) was proposed combining irrigation and rainfall data to control early blight in potato crops of Maine [15] and Southern Alberta (Canada) (17 DSV) [27]. To determine the DSV threshold favorable for Alternaria in A Limia, the TOMCAST model was supported with aerobiological data. The first Alternaria peaks were detected when the mean temperature was above 10 °C during hours with leaf wetness. The value of 10 DSV was the warning threshold proposed for the first fungicide application, whereas the limit of 15 DSV (proposed for other areas), was useful only in some of the growing season (giving the advice risk some days late).
This study is the first report that combines aerobiological data with the TOMCAST system (based on weather data) to predict days before the first important Alternaria peak in the environment of the potato crop. Despite having a limited number of years to validate TOMCAST model, the first results showed an acceptable prediction to detect early blight attacks. The use of disease models like TOMCAST, to apply fungicides instead of calendar-based sprays, favors a reduction of up to 70% in pesticides [30,33,50]. In addition to use an ecofriendly management of the disease, growers spend less money in fungicides and conscious consumers had a better opinion about safety of tubers as food. Therefore, the disease risk obtained from the combination of decision support system and aerobiological data is a useful tool for the forecasting of potato early blight, and integrated management of crops.

5. Conclusions

The present study contributes to the knowledge of the main weather factors that affect the formation of Alternaria conidia in the air of a potato crop. The linear regression equation and the Spearman correlation coefficients obtained underline the critical importance of leaf wetness and temperature to the development of early blight of potato. Favorable temperature thresholds in function of Alternaria concentration on crop have been established. The highest levels of Alternaria (>50 spores/m3) occurred with air minimum temperatures above 10 °C, maximum temperatures above 27 °C, and mean temperatures above 18 °C. Previous knowledge of the presence of Alternaria conidia in the environment allowed prediction systems such as TOMCAST to be adapted in A Limia with acceptable results. The first significant peak of Alternaria was predicted days in advance in most of the cycles sampled, considering mean temperatures during the leaf wetness of at least 10 °C and a disease severity value of 10–15 DSV. Careful monitoring of Alternaria levels and weather conditions help to prevent disease severity and to reduce chemical applications on the crop. Therefore, to promote the use of forecast methods by farmers for an effective control of potato early blight is a considerable challenge for future.

Author Contributions

O.E. and M.C.S. conceived and designed experiments. L.M., O.E. and M.S.R.-F. performed field experiments and field tracking. L.M., O.E. and M.C.S. analyzed data. L.M., O.E., M.S.R.-F. and M.C.S. wrote the paper. All authors have read and agreed to the published version of the manuscript.

Funding

This study was supported by Xunta de Galicia (Rural Development Programme 2014/2020-FEADER). Laura Meno is a beneficiary of the pre-PhD contract FPU 17/00267 granted by the Ministry of Education, Culture and Sports.

Conflicts of Interest

The authors declare no conflict of interest.

References

  1. Zhang, H.; Xu, F.; Wu, Y.; Hu, H.; Dai, X. Progress of potato staple food research and industry development in China. J. Integr. Agric. 2017, 16, 2924–2932. [Google Scholar] [CrossRef]
  2. Escuredo, O.; Seijo-Rodríguez, A.; Rodríguez-Flores, M.S.; Seijo, M.C. Decision support systems for detecting aerial potato Phytophthora infestans sporangia in Northwestern Spain. Agron. J. 2018, 111, 354–361. [Google Scholar] [CrossRef]
  3. Van der Waals, J.E. A review of early blight of potato. Afr. Plant Prot. 2001, 7, 91–102. [Google Scholar]
  4. Singh, V.; Shrivastava, A.; Jadon, S.; Wahi, N.; Singh, A.; Sharma, N. Alternaria diseases of vegetable crops and its management control to reduce the low production. Int. J. Agric. Biol. 2015, 7, 834–840. [Google Scholar]
  5. Escuredo, O.; Seijo-Rodríguez, A.; Meno, L.; Rodríguez-Flores, M.S.; Seijo, M.C. Seasonal dynamics of Alternaria during the potato growing cycle and the influence of weather on the early blight disease in North-West Spain. Am. J. Potato Res. 2019, 96, 532–540. [Google Scholar] [CrossRef]
  6. Campos, H.; Ortiz, O. The Potato Crop: Its Agricultural, Nutritional and Social Contribution to Humankind; Springer Nature: Cham, Switzerland, 2020; p. 518. [Google Scholar]
  7. Tymon, L.S.; Peever, T.L.; Johnson, D.A. Identification and enumeration of small-spored Alternaria species associated with potato in the US Northwest. Plant Dis. 2016, 100, 465–472. [Google Scholar] [CrossRef] [Green Version]
  8. Zheng, H.H.; Zhao, J.; Wang, T.Y.; Wu, X.H. Characterization of Alternaria species associated with potato foliar diseases in China. Plant Pathol. 2015, 64, 425–433. [Google Scholar] [CrossRef]
  9. Rodrigues, T.T.M.S.; Berbee, M.L.; Simmons, E.G.; Cardoso, C.R.; Reis, A.; Maffia, L.A.; Mizubuti, E.S.G. First report of Alternaria tomatophila and A. grandis causing early blight on tomato and potato in Brazil. New Dis. Rep. 2010, 22, 28. [Google Scholar] [CrossRef] [Green Version]
  10. Ardestani, S.T.; Sharifnabi, B.; Zare, R.; Moghadam, A.A. New Alternaria species associated with potato leaf spot in various potato growing region of Iran. Iran J. Plant Pathol. 2010, 45, 83–86. [Google Scholar]
  11. Ayad, D.; Leclerc, S.; Hamon, B.; Kedad, A.; Bouznad, Z.; Simoneau, P. First report of early blight caused by Alternaria protenta on potato in Algeria. Plant Dis. 2017, 101, 836–837. [Google Scholar] [CrossRef] [Green Version]
  12. Landschoot, S.; Vandecasteele, M.; De Baets, B.; Hofte, M.; Audenaert, K.; Haesaert, G. Identification of A. arborescens, A. grandis, and A. protenta as new members of the European Alternaria population on potato. Fungal Biol. 2017, 121, 172–188. [Google Scholar] [CrossRef] [PubMed]
  13. Gannibal, P.B.; Orina, A.S.; Mironenko, N.V.; Levitin, M.M. Differentiation of the closely related species, Alternaria solani and A. tomatophila, by molecular and morphological features and aggressiveness. Eur. J. Plant Pathol. 2014, 139, 609–623. [Google Scholar] [CrossRef]
  14. Vloutoglou, I.; Kalogerakis, N. Effects of inoculum concentration, wetness duration and plant age on development of early blight (Alternaria solani) and on shedding of leaves in tomato plants. Plant Pathol. J. 2000, 49, 339–345. [Google Scholar] [CrossRef]
  15. Olanya, O.M.; Honeycutt, C.W.; Larkin, R.P.; Griffin, T.S.; He, Z.; Halloran, J.M. The effect of cropping systems and irrigation management on development of potato early blight. Plant Pathol. J. 2009, 75, 367–375. [Google Scholar] [CrossRef]
  16. Wale, S.; Platt, H.W.B.; Cattiln, N. Diseases, Pests and Disorders of Potatoes—A Colour Handbook; Wale, S., Platt, H.W., Cattlin, N., Eds.; Manson Publishing Ltd.: London, UK, 2008; p. 240. [Google Scholar]
  17. Runno-Paurson, E.; Loit, K.; Hansen, M.; Tein, B.; Williams, I.H.; Mänd, M. Early blight destroys potato foliage in the northern Baltic region. Acta Agr. Scand. B 2015, 65, 422–432. [Google Scholar] [CrossRef]
  18. Meno, L.; Escuredo, O.; Rodríguez-Flores, M.S.; Seijo, M.C. Interrupted wet period (IWP) to forecast the aerial Alternaria in potato crops of A Limia (Spain). Agronomy 2019, 9, 585–595. [Google Scholar] [CrossRef] [Green Version]
  19. Kapsa, J. Important threats in potato production and integrated pathogen/pest management. Potato Res. 2008, 51, 385–401. [Google Scholar] [CrossRef]
  20. Jönsson, A.M.; Lagergren, F.; Smith, B. Forest management facing climate change—an ecosystem model analysis of adaptation strategies. Mitig. Adapt. Strateg. Glob. Chang. 2013, 20, 201–220. [Google Scholar] [CrossRef]
  21. Kasprzyk, I.; Rodinkova, V.; Šaulienė, I.; Ritenberga, O.; Grinn-Gofron, A.; Nowak, M.; Sulborska, A.; Kaczmarek, J.; Weryszko-Chmielewska, E.; Bilous, E.; et al. Air pollution by allergenic spores of the genus Alternaria in the air of central and eastern Europe. Environ. Sci. Pollut. Res. 2015, 22, 9260–9274. [Google Scholar] [CrossRef] [Green Version]
  22. Leiminger, J.H.; Hausladen, H. Early blight control in potato using disease-orientated threshold values. Plant Dis. 2012, 96, 124–130. [Google Scholar] [CrossRef] [Green Version]
  23. Maya-Manzano, J.M.; Muñoz-Triviño, M.; Fernández-Rodríguez, S.; Silva-Palacios, I.; Gonzalo-Garijo, A.; Tormo-Molina, R. Airborne Alternaria conidia in Mediterranean rural environments in SW of Iberian Peninsula and weather parameters that influence their seasonality in relation to climate change. Aerobiologia 2016, 32, 95–108. [Google Scholar] [CrossRef]
  24. Pan, Z.; Li, X.; Yang, X.B.; Andrade, D.; Xue, L.; McKinney, N. Prediction of plant diseases through modelling and monitoring airborne pathogen dispersal. Plant Sci. J. 2010, 2011, 191–203. [Google Scholar] [CrossRef]
  25. Abuley, I.K. Decision Support System in the Control of Potato Early Blight (Alternaria solani and Alternaria alternata). Ph.D. Thesis, MSc Agrobiology Plant Nutrition and Health MSc Aarhus University, Aarhus, Denmark, 21 May 2015. [Google Scholar]
  26. Madden, L.; Pennypacker, S.P.; MacNab, A.A. FAST, a forecast system for Alternaria solani on tomato. Phytopathology 1978, 68, 1354–1358. [Google Scholar] [CrossRef] [Green Version]
  27. Harms, T.; Howard, R.; Konschuh, M. Evaluation of Early Blight (Alternaria solani) Prediction Techniques for Southern Alberta. Available online: http://www.demofarm.ca/pdf/early_blight_prediction.pdf (accessed on 15 July 2020).
  28. Pitblado, R.E. Development and Implementation of Tom-Cast. In Ridge Town College of Agricultural Technology; Ministry of Agriculture and Food: Guelph, ON, Canada, 1992; p. 22. [Google Scholar]
  29. Cowill, W.P., Jr.; Maletta, M.H.; Manning, T.; Tietjen, W.H. Early blight forecasting systems: Evaluation, modification and validation for use in fresh-market tomato production in Northern New Jersey. HortScience 2005, 40, 85–93. [Google Scholar] [CrossRef] [Green Version]
  30. Abuley, I.K.; Nielsen, B.J. Evaluation of models to control potato early blight (Alternaria solani) in Denmark. J. Crop Prot. 2017, 102, 118–128. [Google Scholar] [CrossRef]
  31. Bounds, R.S.; Hausbeck, M.K.; Podolsky, R.H. Comparing disease forecasters for timing fungicide sprays to control foliar blight on carrot. Plant Dis. 2006, 90, 264–268. [Google Scholar] [CrossRef]
  32. Trueman, C.L.; McDonald, M.R.; Gossen, B.D.; McKeown, A.W. Evaluation of disease forecasting programs for management of septoria late blight (Septoria apiicola) on celery. Can. J. Plant Pathol. 2007, 29, 330–339. [Google Scholar] [CrossRef] [Green Version]
  33. Raid, R.N.; Pernezny, K.; Havranek, N.; Sanchez, J.; Saddler, B. Weather-based forecasting systems reduce fungicide use for early blight of celery. J. Crop Prot. 2008, 27, 396–402. [Google Scholar] [CrossRef]
  34. EUROPOTATO-The European Cultivated Potato Database. Available online: https://www.europotato.org/varieties/view/Agria-E (accessed on 15 July 2020).
  35. De NIJS. Available online: https://denijspotatoes.com/wp-content/uploads/2020/11/De-Nijs-Potatoes-Agria-brochure-English-27-10-2020.pdf (accessed on 15 July 2020).
  36. Morgan, D.; Puckett, R.; Michailides, T.J. Reducing fungicide applications to control Alternaria late blight of California pistachios by spraying after early season 10-unit DSV thresholds. Phytopathology 2013, 103, S.3. [Google Scholar]
  37. Foster, J.; McDonald, M. Evaluation of the TOM-CAST Forecasting model in Asparagus for management of Stemphylium leaf spot in Ontario, Canada. Plant Dis. 2018, 102, 2253–2257. [Google Scholar] [CrossRef] [Green Version]
  38. Abuley, I.K.; Nielsen, B.J. Integrating cultivar resistance into the TOMCAST model to control early blight of potato, caused by Alternaria solani. Crop Prot. 2019, 117, 69–76. [Google Scholar] [CrossRef]
  39. National Weather Service website. Meteogalicia: Xunta de Galicia. 2020. Available online: http://www.meteogalicia.es/ (accessed on 1 March 2020).
  40. Galán-Soldevilla, C.; Cariñanos-González, P.; Alcázar-Teno, P.; Domínguez-Vilches, E. Manual de Calidad y Gestión de la Red Española de Aerobiología; Servicio de Publicaciones de la Universidad de Córdoba: Córdoba, Spain, 2007; p. 39. [Google Scholar]
  41. Van der Waals, J.E.; Denner, F.D.N.; Van Rij, N.; Korsten, L. Evaluation of PLANT-plus, a decision support system for control of early blight on potatoes in South Africa. J. Crop Prot. 2003, 22, 821–828. [Google Scholar] [CrossRef]
  42. Chaerani, R.; Voorrips, R.E. Tomato early blight (Alternaria solani): The pathogen, genetics, and breeding for resistance. J. Gen. Plant Pathol. 2006, 72, 335–347. [Google Scholar] [CrossRef]
  43. Fernández-Rodríguez, S.; Sadyś, M.; Smith, M.; Tormo-Molina, R.; Skjøth, C.; Maya-Manzano, J.M.; Silva-Palacios, I.; Gonzalo-Garijo, Á. Potential sources of airborne Alternaria spp. spores in South-west Spain. Sci. Total Environ. 2015, 533, 165–176. [Google Scholar] [CrossRef] [PubMed]
  44. Vélez-Pereira, A.M.; de Linares, C.; Canela, M.A.; Belmonte, J. Logistic regression models for predicting daily airborne Alternaria and Cladosporium concentration levels in Catalonia (NE Spain). Int. J. Biometeorol. 2019, 63, 1541–1553. [Google Scholar] [CrossRef]
  45. Rodríguez-Rajo, F.J.; Jato, V.; Fernández-González, M.; Aira, M.J. The use of aerobiological methods for forecasting Botrytis spore concentrations in a vineyard. Grana 2010, 49, 56–65. [Google Scholar]
  46. Recio, M.; Trigo, M.M.; Docampo, S.; Melgar, M.; García-Sánchez, J.; Bootello, L.; Cabezudo, B. Analysis of the predicting variables for daily and weekly fluctuations of two airborne fungal spores: Alternaria and Cladosporium. Int. J. Biometeorol. 2012, 56, 983–991. [Google Scholar] [CrossRef]
  47. Fernández-González, M.; Rodríguez-Rajo, F.J.; Escuredo, O.; Aira, M.J. Optimization of integrated pest management for powdery mildew (Uncinula necator) control in a vineyard based on a combination of phenological, meteorological and aerobiological data. J. Agric. Sci. 2013, 151, 648–658. [Google Scholar] [CrossRef]
  48. Seijo-Rodríguez, A.; Escuredo, O.; Rodríguez-Flores, M.S.; Seijo, M.C. Improving the use of aerobiological and phenoclimatological data to forecast the risk of late blight in a potato crop. Aerobiologia 2018, 34, 315–324. [Google Scholar]
  49. Escuredo, O.; Seijo, M.C.; Fernández-González, M.; Iglesias, I. Effects of meteorological factors on the levels of Alternaria spores on a potato crop. Int. J. Biometeorol. 2011, 55, 243–252. [Google Scholar] [CrossRef]
  50. Hill, S.N.; Hausbeck, M.K. Evaluation of TOM-CAST in timing fungicide sprays for management of Alternaria blight on american ginseng. Plant Dis. 2008, 92, 1611–1615. [Google Scholar] [CrossRef] [PubMed] [Green Version]
  51. Meyer, M.P.; Hausbeck, M.K.; Podolsky, R. Optimal fungicide management of purple spot of asparagus and impact on yield. Plant Dis. 2000, 84, 525–530. [Google Scholar] [CrossRef] [PubMed]
Figure 1. iMETOS ® 3.3. by Pessl Instruments weather station and Lanzoni VPSS 2000 volumetric sampler.
Agronomy 10 01872 g001
Figure 2. Distribution of daily Alternaria concentration, daily air mean temperature, hours of daily leaf wetness during first weeks of growing seasons. The black bar shows results of the adaptation of TOMCAST model by growing season.
Agronomy 10 01872 g002
Table 1. Timing of the main phenological phases and agronomic practices in each growing season.
YearSowing DayEmergenceFloweringSenescenceSeason (Days)Number of Fungicide Sprays *
201425 April20 May1 July22 July1385 (from 30 June to 26 August)
201522 April12 May16 June14 July1355 (from 21 June to 19 August)
20162 June23 June21 July28 August1265 (from 3 July to 5 September)
201722 April16 May13 June18 July1356 (from 5 June to 13 August)
201815 May1 June4 July15 August1387 (from 27 June to 29 August)
201916 May4 June15 July22 August1235 (from 5 July to 1 September)
* Sprays applied according to a pre-established schedule every 15 days to control late blight (Phytophthora infestans). Some active ingredients considered in the applied treatments: mancozeb 64% + metalaxyl 8% (2.2 kg/ha); Benthiavalicarb isopropil 1.75% + mancozeb 70% (WP) (1.6 kg/ha); cymoxanil 9% + propamocarb 50% (2 L/ha); amisulbrom 20% (SC) (0.4 L/ha).
Table 2. Disease severity values of FAST model according to leaf wetness period and average ambient air temperature during the wetness period [26].
Mean T during Lw Period (°C)Leaf Wetness Time (h) Required to Produced DSV
13–170–67–1516–20>21
18–200–34–89–1516–22>23
21–250–23–56–1213–20>21
26–290–34–89–1516–22>23
DSV (scale *)01234
T: temperature; Lw: leaf wetness; DSV: disease severity value. *: scale of values ranging from 0 (environmental conditions unfavorable for spore formation) to 4 (highly favorable conditions).
Table 3. Aerobiological data expressed such as total Alternaria and mean Alternaria concentration by potato growing season.
201420152016201720182019
Alternaria (total spores)62903651614312155104546452
Alternaria daily mean value (spores/m3)74 ab42 b65 ab116 c89 ac59 ab
Days with more than 50 spores/m3 432548667240
Different letters indicate significant differences between years according to Bonferroni test (p < 0.05).
Table 4. Meteorological data by potato crop cycle.
201420152016201720182019
Avg minimum T (°C)9.0 a (36.9)9.2 a (31.6)9.3 a (30.4)9.1 a (46.2)11.8 b (20.6)9.0 a (40.6)
Avg maximum T (°C)26.3 a (15.0)29.8 b (14.2)32.3 c (16.3)26.0 a (21.6)25.4 a (21.7)24.7 a (20.7)
Avg T (°C)17.2 ab (14.7)19.0 b (13.4)19.2 b (16.0)17.1 ab (23.6)18.0 b (17.7)16.7 a (21.0)
Avg T during Lw period (°C)12.1 a (24.1)11.7 a (24.3)12.5 ab (19.6)11.9 a (28.6)13.6 b (16.2)11.8 a (30.0)
Avg Lw (h)7.3 a (53.4)6.5 a (50.9)8.0 ab (45.1)7.4 a (65.8)9.1 b (54.2)7.8 ab (55.8)
Avg RH (%)77.4 ab (12.6)73.4 abc (11.1)73.0 c (13.9)71.6 c (16.2)77.0 ab (11.3)74.5 abc (11.7)
Avg rainfall (mm)0.7 ab0.1 a0.4 ab2.9 b2.9 b1.1 ab
Avg: Average value; T: temperature; RH: relative humidity; Lw: leaf wetness. Meteorological data are represented with average value and coefficient of variation (CV) in percentage (data in parentheses). Different letters indicate significant differences between years according to Bonferroni test (p < 0.05).
Table 5. Descriptive analysis of meteorological factors according to Alternaria conidia classes (zero level: 0; low level: 1–50; intermediate level: 51–90; high level: >91 spores/m3).
Zero LevelLow LevelIntermediate LevelHigh Level
Avg minimum T (°C)9.0 a8.9 a10.4 b10.5 b
Avg maximum T (°C)24.8 a27.0 ab28.7 c27.4 bc
Avg T (°C)16.3 a17.3 a18.9 b18.3 b
Avg T in Lw period (°C)11.7 b11.7 b13.0 a13.0 a
Avg Lw (h) 7.2 a7.6 a7.3 a8.3 a
Avg RH (%)75.1 ab74.3 ab73.0 a75.6 b
RH > 80% (h)12.812.712.312.8
Avg rainfall (mm)1.8 ab0.9 a2.6 b1.5 ab
Avg: Average value; T: temperature; RH: relative humidity; Lw: leaf wetness. Different letters indicate significant differences between spore levels according to Bonferroni test (p < 0.05).
Table 6. Spearman correlation coefficients between Alternaria concentration and meteorological variables since 5 days before.
Alternaria Concentration
Day 0Day 1Day 2Day 3Day 4Day 5
Minimum T0.258 **0.258 **0.320 **0.356 **0.374 **0.386 **
Maximum T0.141 **0.123 **0.094 *0.089 *0.089 *0.084 *
Mean T0.230 **0.199 **0.190 **0.197 **0.203 **0.196 **
Mean T during Lw period0.260 **0.293 **0.286 **0.332 **0.357 **0.372 **
Lw0.090 *0.132 **0.131 **0.120 **0.121 **0.130 **
Mean RH0.0700.119 **0.164 **0.187 **0.211 **0.236 **
RH > 80%0.0670.113 **0.162 **0.161 **0.145 **0.196 **
Rainfall−0.0100.0300.010−0.0100.0010.020
* (p < 0.05); ** (p < 0.01). T: temperature; RH: relative humidity; Lw: leaf wetness.
Table 7. Summary of linear regression analysis to predict Alternaria concentration.
Statistics of Model
RR2R2 AdjustedStandard ErrorFp
0.640.410.4164.95140.00<0.001
Coefficients of Predictor Variables
BStd Error BBetatp
Constant−66.4325.70
Alternaria −10.590.030.6018.24<0.001
Mean T during Lw period −32.861.050.092.740.006
Mean RH −30.840.350.082.410.016
Equation: Alternaria = 0.59 Alternaria −1 + 2.86 Mean T during Lw period −3 + 0.84 Mean RH −3 − 66.43
T: temperature; RH: relative humidity; Lw: leaf wetness; R: coefficient of determination; B: unstandardized coefficients; t: statistic t of regression analysis.
Table 8. Proposed adjustment of the TOMCAST model for the growing conditions of A Limia.
Mean T during Lw Period (°C)DSV201420152016201720182019
1330 DSV--69-3064
20 DSV42-29522138
15 DSV295914431824
10 DSV24161291316
1030 DSV341813281430
20 DSV223−213214
15 DSV9−8−710−16
10 DSV1−42−9−3−81
T: temperature; Lw: leaf wetness; DSV: disease severity value.
Publisher’s Note: MDPI stays neutral with regard to jurisdictional claims in published maps and institutional affiliations.

