Article

Evaluation of Soil Water Content Measurements with Capacitance Probes to Support Irrigation Scheduling in a “Red Beaut” Japanese Plum Orchard

Centre for Scientific and Technological Research of Extremadura (CICYTEX), Department of Horticulture, Finca La Orden, Regional Government of Extremadura, Highway A-V, Km 372, 06187 Guadajira, Badajoz, Spain
*
Author to whom correspondence should be addressed.
Agronomy 2020, 10(11), 1757; https://doi.org/10.3390/agronomy10111757
Submission received: 9 October 2020 / Revised: 7 November 2020 / Accepted: 8 November 2020 / Published: 12 November 2020
(This article belongs to the Special Issue Optimizing Plant Water Use Efficiency for a Sustainable Environment)

Abstract

:
Advances in electromagnetic sensor technologies in recent years have made automated irrigation scheduling a reality through the use of state-of-the-art soil moisture sensing devices. However, correct sensor positioning and interpretation of the measurements are key to the successful implementation of these management systems. The aim of this study is to establish guidelines for soil moisture sensor placement to support irrigation scheduling, taking into account the physiological response of the plant. The experimental work was carried out in Vegas Bajas del Guadiana (Extremadura, Spain) on a drip-irrigated experimental orchard of the early-maturing Japanese plum cultivar “Red Beaut”. Two irrigation treatments were established: control and drying. The control treatment was scheduled to cover crop water needs. In the drying treatment, the fruit trees were irrigated as in control, except in certain periods (preharvest and postharvest) in which irrigation was suspended (drying cycles). Over 3 years (2015–2017), a series of plant parameters were analyzed in relation to the measurements provided by a battery of frequency domain reflectometry probes installed in different positions with respect to tree and dripper: midday stem water potential (Ψstem), sap flow, leaf stomatal conductance, net leaf photosynthesis and daily fraction of intercepted photosynthetically active radiation. After making a comparison of these measurements as indicators of plant water status, Ψstem was found to be the physiological parameter that detected water stress earliest. The drying cycles were very useful to select the probe positions that provided the best information for irrigation management and to establish a threshold in the different phases of the crop below which detrimental effects could be caused to the crop. With respect to the probes located closest to the drippers, a drop in the relative soil water content (RSWC) below 0.2 would not be advisable for “non-stress” scheduling in the preharvest period. When no deficit irrigation strategies are applied in the postharvest period, the criteria are similar to those of preharvest. However, the probes located between the dripper at 0.15 and 0.30 m depth provide information on moderate water stress if the RSWC values falls below 0.2. The severe tree water stress was detected below 0.1 RSWC in probes located at 60 cm depth from this same position.

1. Introduction

The amount of water available for irrigation is limited [1], especially in the face of the increasing demand of a constantly growing world population which is predicted to rise to about 9.8 billion in 2050 [2]. Problems derived from a lack of water will likely increase if long-term global climate change predictions are correct. It has been reported that global mean land and ocean surface temperatures increased by 0.8 °C between 1888 and 2012 [3,4] and the worldwide average surface temperature has been predicted to increase by 1.4 to 5.8 °C by 2100 [3]. Furthermore, increases in evaporation and reductions in precipitation rates are expected [4], which will entail a reduction of the available water resources for the twenty-first century [5]. In this context, the adoption of efficient irrigation systems can help to decrease agricultural water consumption, improve farm profitability and reduce environmental impacts.
Despite constant advances in agriculture, it remains difficult to obtain accurate predictions of the crop water requirements of fruit trees in field conditions [6]. Nowadays, three methods can be used in this respect for proper irrigation scheduling: the water balance-based method, the method based on monitoring soil water content or potential and the method which uses plant water status as the reference for irrigation scheduling [1,7]. While each of these methods has its advantages and disadvantages, the water balance method is the most commonly applied. Soil water content monitoring does not always provide information about plant water status, as this depends on the complex relationship between soil, plant and atmosphere, and in addition, the uncertainty caused by the heterogeneous distribution of water in the soil needs to be taken into account. Despite this, the use of soil and plant measurements for irrigation scheduling assessment is a very attractive approach because they allow adaptation to specific plot and crop conditions. However, such an approach also entails greater complexity in terms of the collection, processing and interpretation of information. Today, through the use of state-of-the-art sensors and information and communications technologies, it is possible to integrate different scheduling methods and develop intelligent systems for irrigation automation or decision support for technicians and farmers [8,9,10].
Among the methods available for measuring soil water content (SWC), both gravimetry and neutron probe measurements are considered to be the most accurate. In both cases, measurements are time consuming and laborious. Moreover, neutron probes tend to be expensive, a radiation hazard, display insensitivity near the soil surface, give readings that vary due to changes in soil density [11], and require a trained operator due to the use of the radioactive source as well as extensive soil specific calibrations [12]. However, sensors are widely available that provide measurements with the desired frequency, have low maintenance needs and costs and are easily automatable. These include sensors based on frequency domain reflectometry (FDR), a technique to determine SWC which is based on the dielectric properties of the soil [13]. These probes require soil-specific calibration for accurate results [12], and are sensitive to air gaps, soil salinity, temperature, bulk density and clay content [14,15]. The proper positioning of the probes in the soil plays a key role in the quality of the information provided by them since each probe has a limited zone of influence. Due to the heterogeneity of environmental factors, SWC can also vary spatially [16,17]. In irrigated crops, SWC patterns in the root zone are dynamic and conditioned by numerous parameters including soil hydraulic properties, spatial heterogeneity, and the characteristics of the crop (e.g., rooting patterns) and the irrigation system that is employed (e.g., drip line spacing, emitter flow rate, irrigation dose) [18]. In drip irrigation systems, the spatial variability of the SWC formed under the emitters is higher due to the local application of irrigation water [19]. Consequently, the correct positioning and placement of the soil moisture probes are even more relevant in the case of drip irrigation systems [20].
When the SWC becomes limiting for the plant, it triggers a series of mechanisms that modify the plant’s physiological processes in response to water stress. The physiological response of plants to water deficits depends on the severity as well as the duration of the stress. Only the most sensitive processes are altered by very mild stress, but as the water stress increases the changes intensify, and additional processes become affected in accordance with their relative sensitivity to the stress [21]. Water stress affects almost all plant functions, including photosynthesis and respiration, as well as having an impact on crop yield [22]. The extent of the effects depends on the interaction between SWC, the evaporative demand of the atmosphere and the sensitivity of each process to water stress. Growth is one of the first physiological processes to be affected by water stress through a decline in tree canopy development. It is important to have reliable indicators of the water status of the crop for proper irrigation programming and irrigation strategy management. For various decades, the midday stem water potential (Ψstem) has been widely used to determine the water status of plants in many species [23], but especially in woody crops like the Japanese plum [24], as it is directly related to climatic and soil conditions. Stomatal conductance (Gs) is linked to the degree of the opening of the stomata. Usually, stomatal closure takes place during periods of drought to limit water loss by evapotranspiration, thus acting as an early physiological mechanism to reduce dehydration damage to water transport tissues [25,26]. Several works have also demonstrated the potential of Ψstem as a water status reference [27,28], mainly in species of anisohydric behavior as is the case of the Japanese plum cv. “Angeleno” [29]. Water stress can also affect the photosynthetic rate (Fn) of leaves, either through stomatic opening [30] or by intrinsically altering the photosynthesis process [31], and can also be considered a physiological water status indicator. Under mild to severe drought conditions, the basic plant organization structure could be damaged, giving rise to the inhibition of carbon assimilation and damaging photosynthetic apparatus [32]. The fraction of intercepted photosynthetically active radiation (FIPAR) determines the production of photosynthates, which influence plant growth, productivity and fruit quality [33]. One response of plants to water stress is to reduce the amount of intercepted radiation by reducing the rate of growth, modifying the leaf angle or accelerating the senescence of older leaves. However, using FIPAR as a reference for water status has its limitations as changes in the canopy can be slow or subtle, and so precise determinations are necessary and not always automatable. Casadesus et al. [34] observed that an automated irrigation system based on measurements of light interception by the canopy had slight deviations from actual irrigation requirements, but that these could be corrected through the use of additional measurements of, for example, air temperature or vapor pressure deficit. Sap flow (SF) is a continuous measurement related to daily transpiration, reaching its maximum value at solar midday and its minimum value during the night, coinciding with stomatal closure. Transpiration has an important role in physiology, the hydrological cycle and the global energy balance of crops in arid and semiarid regions [35,36,37]. Transpiration is controlled by the response of stomata to environmental factors such as solar radiation, vapor pressure deficit, air temperature, soil water availability and precipitation [36,38]. A progressive decrease in transpiration rates for a given crop and demand is indicative of a water stress situation [39]. Most of the aforementioned plant-based water stress indicators have different dimensions. For this reason, it is better to use the concept of signal intensity (SI), normalizing the absolute values of the indicator with respect to values in non-limiting soil water conditions [40]. The SI of the plant water indicator is a dimensionless variable, in which values above unity indicate that there is deficit irrigation and values equal to unity indicate that there is a lack of water stress [6]. In addition, the main characteristic that an indicator should have is sensitivity to water stress. Goldhamer and Fereres [41] defined the term sensitivity (S) as the ratio between the SI and the noise (coefficient of variation measurements for each indicator measured, CV).
Drought stress can cause serious damages in most crop plants including plum trees, but water excess can lead to root asphyxia, phytopathological problems, lower water use efficiency or unjustified increases in production costs. Due to the increasing water shortage worldwide, management of available soil water based on drought stress plant signals is becoming a crucial tool [42]. In the present study, we evaluate the relationship between the response of different plant physiological parameters to the dynamics of soil moisture in the face of increasing water stress and subsequent recovery in an early-maturing Japanese plum cultivar. The objective is to provide the necessary information to establish guidelines for the location and interpretation of soil moisture probes in automated or semi-automated irrigation scheduling systems, considering the possibility of using regulated deficit irrigation strategies. The aim of this work is to contribute to improving the usefulness of capacitance probes for the continuous measurement of SWC, as a reference or support for irrigation scheduling in fruit orchards. To do so, two key aspects are emphasized: (i) the selection of the most suitable points for the installation of the probes; and (ii) the interpretation of the measurements in relation to the physiological behavior of the tree in order to provide information for the decision-making process.

2. Materials and Methods

2.1. Experimental Plot Description and Climate

This work was carried out over three years (2015–2017) in a 1 ha orchard planted with early-maturing Japanese plum (Prunus salicina Lindl.) of the variety “Red Beaut”. The plot was located in an experimental farm of Badajoz, in southwestern Spain (latitude 38°51′19.06″ N, longitude 6°40′18.90″ W, datum WGS8), property of the Centre for Scientific and Technological Research of Extremadura (Regional Government of Extremadura). Plum trees were planted in the spring of 2005 with a 6 × 4 m spacing and in an east–west row orientation (5° toward the north). The soil of the plot is classified as an Anfisols according to the Soil Taxonomy [43], with slightly acidic pH values, low organic matter content (0.62%), high apparent density (ᵖa = 1.41 g cm−3) and low cation exchange capacity (9.41 meq/100 g). Soil texture is loam, with an average 19.4% clay content, 40.2% silt content and 40.4% sand content. The soil was kept untilled and free of weeds through the application of herbicide treatments. Fertilization as well as control of pests or diseases were those commonly used in commercial orchard techniques.
The climate of the area is Mediterranean with a mild Atlantic influence, with a dry season from June to September (summer) and a wet season from October to May (winter) in which 80% of total precipitation falls. Average values in the area of reference evapotranspiration (ETo) and precipitation (P) were 1296 mm and 473 mm, respectively, for the 2007–2017 period. For that period, average maximum and minimum air temperatures were 23.38 °C and 9.42 °C, respectively. The hottest months are July and August. Maximum temperatures over 40 °C are recorded nearly every year, with peak values rarely over 45 °C. The coolest months are December and January. Temperatures below 0 °C are recorded every year, with minimum values rarely below −6 °C.
Sprouting was on 5 March 2015, 26 February 2016 and 2 March 2017. 31 October was considered the date of leaf fall in the three years.

2.2. Irrigation System, Irrigation Treatments and Experimental Design

Trees were irrigated daily using a drip system with a single lateral line per tree row located close to the base of the tree, with pressure-compensating drippers spaced at 1 m and with 4 l h−1 discharge rates (16 l/h/tree). The treatments were: control (CON) and drying (D). The experimental design of the plot was a completely randomized blocks with four replicates per treatment. Each experimental plot consisted of four adjacent rows, with each row containing four trees (16 trees/block). Data collection was carried out for the four central trees, with the other trees acting as guard trees including the four corner trees which were of a different cultivar (Figure 1a). In CON, trees were irrigated to cover crop water needs throughout the crop cycle. The irrigation dose applied was evapotranspiration (ETc) minus effective rainfall. The ETc was calculated following the procedure of Allen et al. [44], multiplying the reference evapotranspiration (ETo) by the crop coefficient (Kc). ETo was determined according to the Penman–Monteith method (ETo-PM) using the data obtained from a weather station located 200 m from the study plot (REDAREX), and the Kc was adjusted to the crop and local climatic conditions [45]. In the D treatments, fruit trees were irrigated as CON except in certain periods (preharvest and postharvest) in which irrigation was detained (drying) to induce a mild and severe water deficit in preharvest and postharvest, respectively (Table 1). The volume of applied water in each treatment was measured with a multi-jet meter with pulse output for remote reading (MTK, Zenner, Madrid, Spain) on a daily basis.

2.3. Soil Water Content Probes

2.3.1. FDR Probes

In the D treatment, three trees in one block were selected to continuously monitor SWC. Nine 10HS capacitance probes (Decagon Devices Inc., Pullman, WA, USA) per tree were installed at different positions (position A, position B and position C) in relation to the dripper located under the tree canopy (Figure 1). Position A was located 0.15 m from the dripper to the alley, position B at 0.50 m from the dripper to the alley and position C between two drippers. In each position, the probes were installed at three depths: 0.15, 0.30 and 0.60 m. All probes used the general calibration for mineral soils proposed by the manufacturer and were connected to a datalogger (CR1000, Campbell Scientific Inc., Logan, UT, USA) which stored the data once every 5 min. The values obtained with each of the soil moisture probes were normalized every year calculating the RSWC. For this purpose, an interpolation was made to assign the value 1 to the highest value reached with each of them and the lowest value was assigned a 0.

2.3.2. Neutron Probes

Three other trees were selected in the D treatment to take the measurements with neutron probes (CPN 503DR Hydroprobe, CPN International Inc., Port Chicago Highway, CA, USA). Three access tubes (2.1 m long) were installed for each tree in the same position with respect to the dripper where the FDR probes were installed (Figure 1b). Soil water content (SWC) was monitored weekly throughout the irrigation season from a depth of 0.30 m to 1.8 m at intervals of 0.30 m. The neutron probe readings were calibrated according to the experimental equation:
Θ = 0.00015 × N/SC − 0.488 (R2 = 0.97; p < 0.0001)
where Θ is the volumetric soil water content (m3m−3), N is the neutron probe count reading and SC is the standard count reading.

2.4. Plant Measurements

2.4.1. Plant Water Status

The Ψstem was measured from two to three times a week from the beginning of the irrigation campaign to the end, between 13:00 and 15:00 h solar time, with a pressure chamber (Model 3005, Soil Moisture Equipment, Santa Barbara, CA, USA) during the drought periods, and once a week outside of these periods. Determinations were carried out on four trees per single plot: two mature and shaded leaves per tree were selected close to the base of the trunk and covered with aluminum foil at least 2 h before measurements started [23].

2.4.2. Photosynthesis and Leaf Stomatal Conductance

The Gs and Fn measurements were taken from just before the drought period until recovery from the drought period using an LI-6400XT device (Licor Inc., Lincoln, NE, USA) at midday (11:30 ± 13:30 h local solar time) every 2–3 days and on the same days as for Ψstem. Measurements were carried out on eight trees per treatment on four fully-developed young green leaves per tree on clear days, making a total of thirty-two replicated measurements per treatment. The device was calibrated before use on each occasion using factory calibration. In 2016, the LI-6400XT device broke down and Gs and Fn measurements could not be taken throughout the entire irrigation season.

2.4.3. Sap Flow

Sap flow was measured continuously using the compensation heat pulse method [46] combined with the calibrated average gradient technique [47] when sap velocities were low. Sap flow probes were installed on four trees of each treatment. The probes used were designed and produced at the Instituto de Agricultura Sostenible (CSIC, Córdoba, Spain). Each probe measures the heat pulse velocity at four depths in the xylem, spaced 10 mm apart, so that heat-pulse velocities were obtained at 5, 15, 25 and 35 mm below the cambium [47]. The probes were installed at 50 cm height from the soil, and measurements were taken continuously (every 30 min) from the date of installation in 2015 until the end of 2017. The system was controlled by a datalogger (CR1000, Campbell Scientific Inc., Logan, UT, USA). Due to variability in sap velocity and the thickness of conductive xylem around the perimeter of the tree [48], some uncertainty arises when the transpiration of each tree is calculated by azimuth integration of sap flow measurements obtained from a low number of probes. In order to solve this problem in treatment CON, the soil water balance method was applied in a dry period (8 days during spring) in which there was no rainfall to calibrate each sap flow probe.
ET = P + I − SR − DP ± ΔS − Es
ΔS = ∑(θi − θi−1). Z
where ET is crop evapotranspiration, P is rainfall (mm), I is applied irrigation (mm), SR is surface runoff (mm), DP is deep percolation (mm), ΔS is the difference in soil-stored water at the beginning and end of a period, Es is soil evaporation, θ is soil water content (mm) and Z is the upper 1800 mm of the soil. The values of SR were considered negligible as the surface was flat and no runoff was observed. DP was considered null at the maximum observed depth (1.8 m). The values of θ were obtained from neutron probe measurements performed once a week throughout the irrigation period.
In order to estimate the soil evaporation coefficient (Ke) value, it was necessary to calculate a daily balance of the water present in the surface layer of the soil in order to determine the accumulated evaporation or depletion sheet.
De,I = De,i − 1 − Pi + SRi − Ii/fw + Esi/few + Tew,i + DPi
Esi = ke.ETo
where De,i is accumulated evaporation (exhaustion) after complete wetting at the end of day i [mm], De,i − 1 is accumulated evaporation (depletion), after complete wetting, originating from the exposed and wetted upper soil fraction at the end of day i − 1 (mm), fw is the fraction of the soil surface moistened through irrigation, Esi is evaporation on day i (mm), few is the exposed and wetted soil fraction, and Tew is transpiration that occurs in the exposed fraction and moistened from the surface layer of the soil on day i (mm). De,i and De,i − 1 were considered null because the topsoil was close to field capacity after irrigation. The value of fw was taken as 0.3 since a drip irrigation system was used. The value of few was taken as 0.3, and Tew was ignored as the crop in question was considered to be one with roots deeper than 0.6 m after a trial-pit had been dug and root depth visualized.
Assuming that transpiration (Ep) is practically equal to the ET, an estimate of total water transpired between day i and day f was obtained:
α = Ep × (i-f)/SF(i-f)
where SF is total sap flow accumulated between days i and f, Ep is transpiration and α is a constant that serves to calculate the calibrated transpiration on any day of the year through the following equation:
Ep = SF × α
The time evolution of sap flow allowed assessment of the transpiration coefficient (KT) calculated as the ratio of transpiration to ETo. The relative transpiration (RT) was determined as follows:
RT = Kt,d/Kt,con
where Kt is the transpiration coefficient for the irrigation drying (D) and control (CON) treatments in the year of measurement.
The normalized values of RT provided us with a datum against which our observations of sap flow could be referenced. This datum also allowed us to interpret changes either in relation to a plant-induced behavioral modification, or a response due to changes in the environment of the soil.

2.4.4. The Canopy Photosynthetically Active Radiation Interception

The fraction of photosynthetically active radiation intercepted at solar noon by the canopy was measured weekly before the beginning of the drought period, during the drought periods and in the recovery from the drought period between 12:00 and 13:00 solar time with a linear ceptometer (probe length 80 cm; Accupar Linear PAR, Decagon Devices, Pullman, WA, USA). For 1 tree per treatment, the mean Fipar (Fiparm) was taken as the average of 40 measurements taken at fixed positions by the ceptometer placed at soil level. The daily Fipar (Fipard) was calculated using the following linear relationship [49]:
Fipard = 0.9427 Fiparm + 0.0562 (R2 = 0.99; p < 0.0001)

2.5. Signal Intensity, Noise and Sensitivity

Signal intensity (SI) was calculated as the ratio between the values (V) of the D and CON treatments. SI = VD × VCON−1 in the case of Ψstem and Fipard, and SI = VCON × VD−1 in the case of Fn, Gs and SF. To determine the noise, the coefficient of variation (CV) of the measurements for each indicator was used.
The sensitivity of the indicators was determined using two algorithms:
  • Traditional method (S), as proposed by Goldhamer et al. [50]: S is always higher than 0, and the higher its value the greater the sensitivity.
    S = SI/CV
  • Corrected sensitivity (S*), as proposed by De la Rosa et al. [6]: The interpretation of the values obtained with this algorithm is as follows:
    S* = SI−1/CV
(a).
S* > 1: indicates sensitivity to water deficit.
(b).
1 > S* > 0: The noise is greater than the increase in signal intensity. Therefore, there are no differences between treatments.
(c).
S* = 0: no differences between treatments, not sensitive to water deficit.
(d).
S* < 0: anomalous behavior.

2.6. Statistical Analysis

A means comparison with t-tests for independent samples was used for the statistical analysis of the data using the statistical package IBM SPSS version 24.0 for Windows (IBM Corp. Armonk, NY, USA).

3. Results

3.1. Climatic Conditions and Water Applied

In Table 2, it can be observed that the driest year from sprouting to leaf fall was 2017, which had the lowest rainfall and mean relative humidity and the highest annual ETo. The rainfall for this period was between 108 mm and 309 mm and during the pre-sprouting period (from leaf fall to sprouting) ranged from 158 to 438 mm. In 2016, pre-sprouting rainfall was high in relation to the average for the area. The highest mean temperature (Tmean) values were reached during the postharvest period coinciding with the summer months. Spring 2016 had a colder Tmean in the preharvest period and the Tmean was similar in the three years of study in the postharvest periods. The annual ETo-PM was similar in the three study years, with higher values in the postharvest period. The amount of water applied in the C treatment was 814 mm in 2017, which was notably higher than in the other years. The reduction of water applied in the D treatment compared to the CON treatment was 6%, 45% and 37% for 2015, 2016 and 2017, respectively.

3.2. Signal Intensity, Noise and Sensitivity

To compare the different responses to water deprivation in both continuously recorded plant-based measurement (SF) and discretely measured plant-based measurements (Ψstem, Fn, Gs and Fipard) were calculated: signal intensity (SI), the signal noise evaluated as the coefficient of variation (CV), sensitivity (S) as SI/CV and corrected sensitivity (S*) as SI−1/CV during the irrigation season (Table 3, Table 4 and Table 5).
In 2015, the SI of all parameters, except Fipard, increased as water stress progressed and responded in the opposite direction when irrigation was restored. During the drying cycle, the highest SI values were 1.53 and 1.67, reached by Ψstem and Gs respectively. The lowest CV values were measured in Ψstem (between 0.15 and 0.19), while the rest of the plant parameters (Fn, SF, Gs and Fipard) had values between 0.25 and 1.25. When sensitivity was calculated with the traditional method (S), Ψstem presented the highest values followed by Fn, SF, Gs and Fipard. When corrected sensitivity (S*) was used, Fn had the highest values followed by Ψstem, SF, Fipard and Gs.
In 2016, the SI of SF decreased in the three drying cycles, whereas Fipard only decreased in the second and third drying cycles. In contrast, the SI of Ψstem increased in the three drying cycles, presenting the highest values in the third drying cycle. Once irrigation was restored again, the SI of Ψstem decreased. The lowest average CV value was obtained in Ψstem. The results obtained with S and S* were the same, with Ψstem presenting the highest values followed by SF and Fipard.
In 2017, the SI of all the measurements increased in the first and second drying cycles, except for Fipard. The highest values of SI were reached by Gs during the drying cycles. The lowest average CV value was measured in Ψstem (0.18), while the other plant water parameters (Fn, SF, Gs and Fipard) presented the highest values (between 0.31 and 0.90). With respect to S, Ψstem presented the highest values followed by Fn, Gs, SF and Fipard. When S* was used Ψstem also presented the highest values followed by SF, Fn, Gs and Fipard.

3.3. Seasonal Dynamics

3.3.1. Stem Water Potential and Gas Exchange

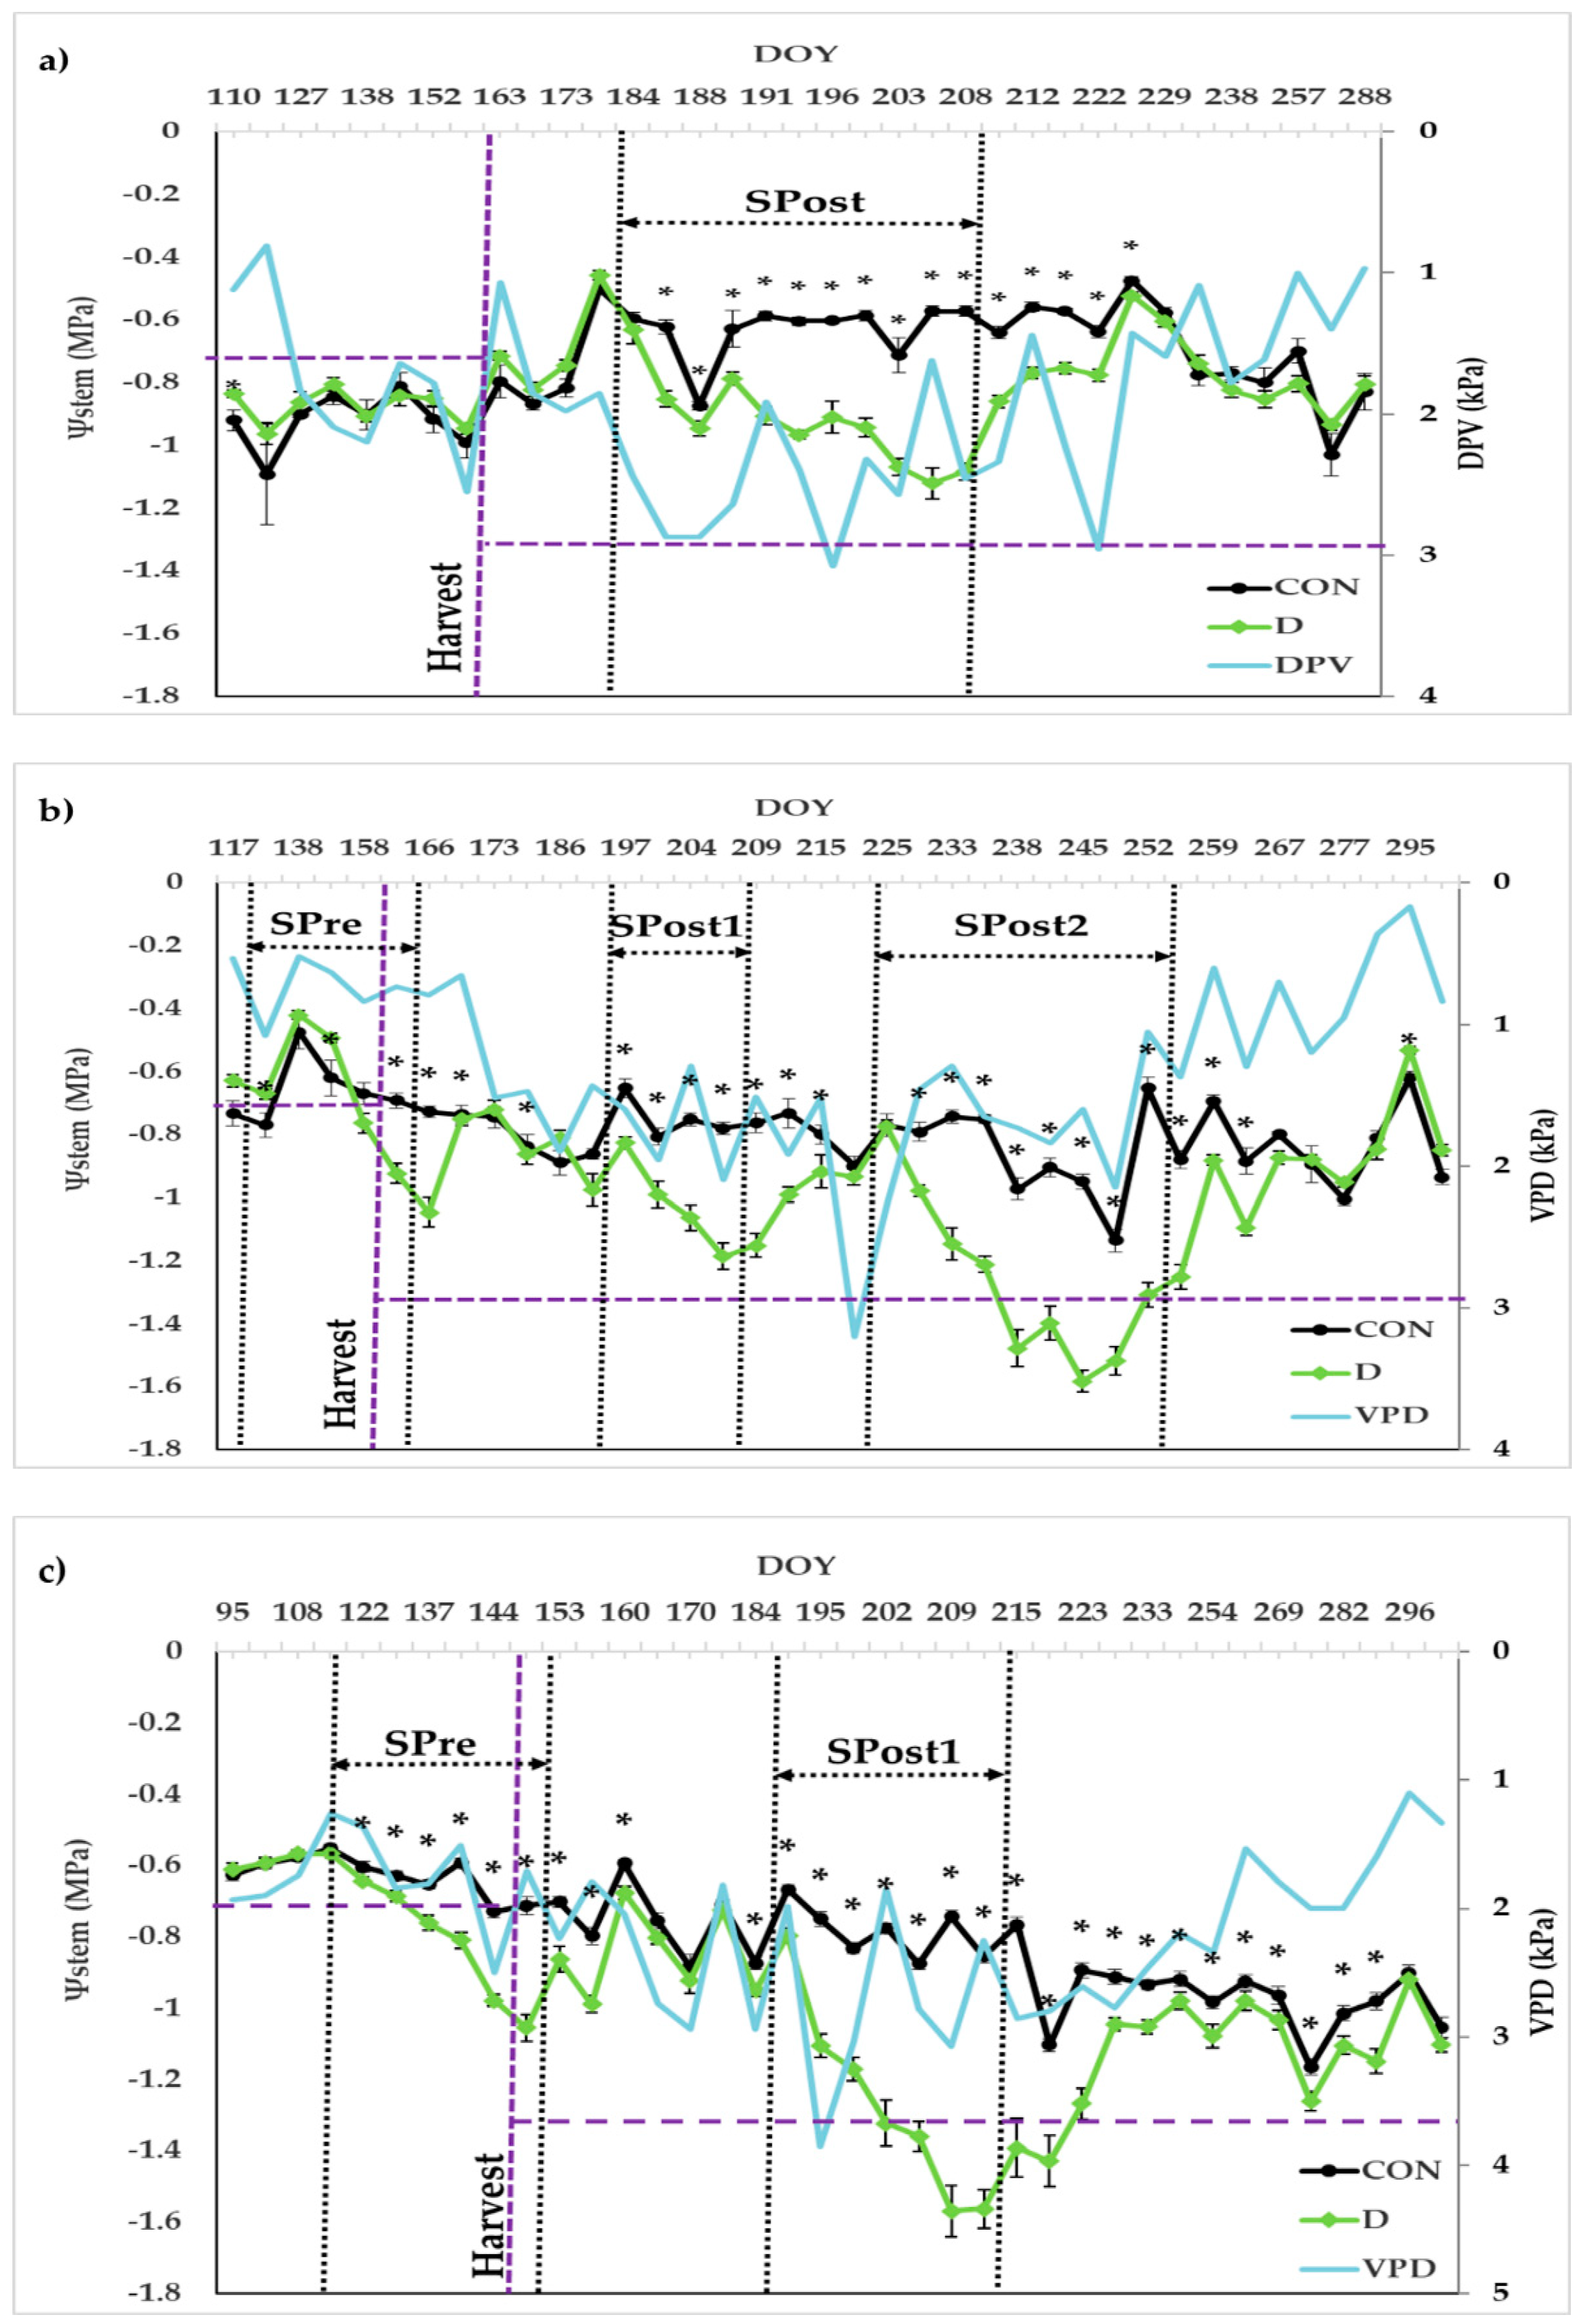
Figure 2 shows the seasonal evolution of Ψstem and vapor pressure deficit (VPD) for each study year.
In the three years of the experiment, the average Ψstem of the CON treatment was −0.80 MPa, with values higher than −0.90 MPa for most of the crop cycle. In 2015, the Ψstem values in both treatments were similar and lower during the preharvest period than in 2016 and 2017 and increased after the harvest. This was the year with the lowest pre-sprouting rainfall (LF-S). In 2016 and 2017, the initial (pre-irrigation) Ψstem of the trees was around −0.62 MPa with a declining trend as the crop season advanced, which was more pronounced in 2017 because of lower rainfall in the postharvest period.
In 2015 (Figure 2a), Ψstem for the CON treatment decreased from an initial value of −0.92 MPa at the start of the irrigation campaign to a final value of −0.81 MPa. The D treatment responded to the suppression of irrigation with a decrease in Ψstem to a minimum value of −1.32 MPa at 18 days after irrigation cut-off. Once irrigation was restored, Ψstem recovered to the CON values after 21 days.
In 2016 (Figure 2b), the Ψstem for the CON treatment fell from an initial value of −0.73 MPa to a final value of −0.94 MPa. With respect to the D treatment, Ψstem fell from initial values of −0.57 MPa to minimum values of −0.92 MPa 43 days after the first suppression of irrigation. In the second drought period, the minimum value reached was −1.19 MPa after 11 days without irrigation. In the third drought period, there followed a pronounced fall in Ψstem values, reaching a minimum value of −1.58 MPa after 21 days without irrigation. After irrigation was restored in the D treatment, the Ψstem recovered to the CON values at 8 days after the first and 14 days after the second and third drought period.
In 2017 (Figure 2c), the CON treatment had the highest Ψstem at the start of the season on DOY 95 (05 April 2017) and the lowest water status before the end of the season on DOY 225 (02 October 2017). In the preharvest drying cycle, the D treatment had the minimum Ψstem value just before rewatering (Figure 2c). The Ψstem fell from initial values of −0.61 MPa to minimum values of −1.06 MPa 36 days after the irrigation cut-off in preharvest. In the first postharvest drying cycle, Ψstem decreased sharply from −0.66 MPa to a minimum value of −1.60 MPa after 22 days without irrigation. These differences between the first and second drying-cycles were due to the spring rains that occurred in the second cycle and the higher evaporative demand. Once irrigation was restored again in the D treatment, Ψstem values recovered to the CON values at 13 days after the first drought period and 83 days after the second drought period.
For the 3 years of the evaluation, fluctuations in VPD consistently affected Ψstem values.
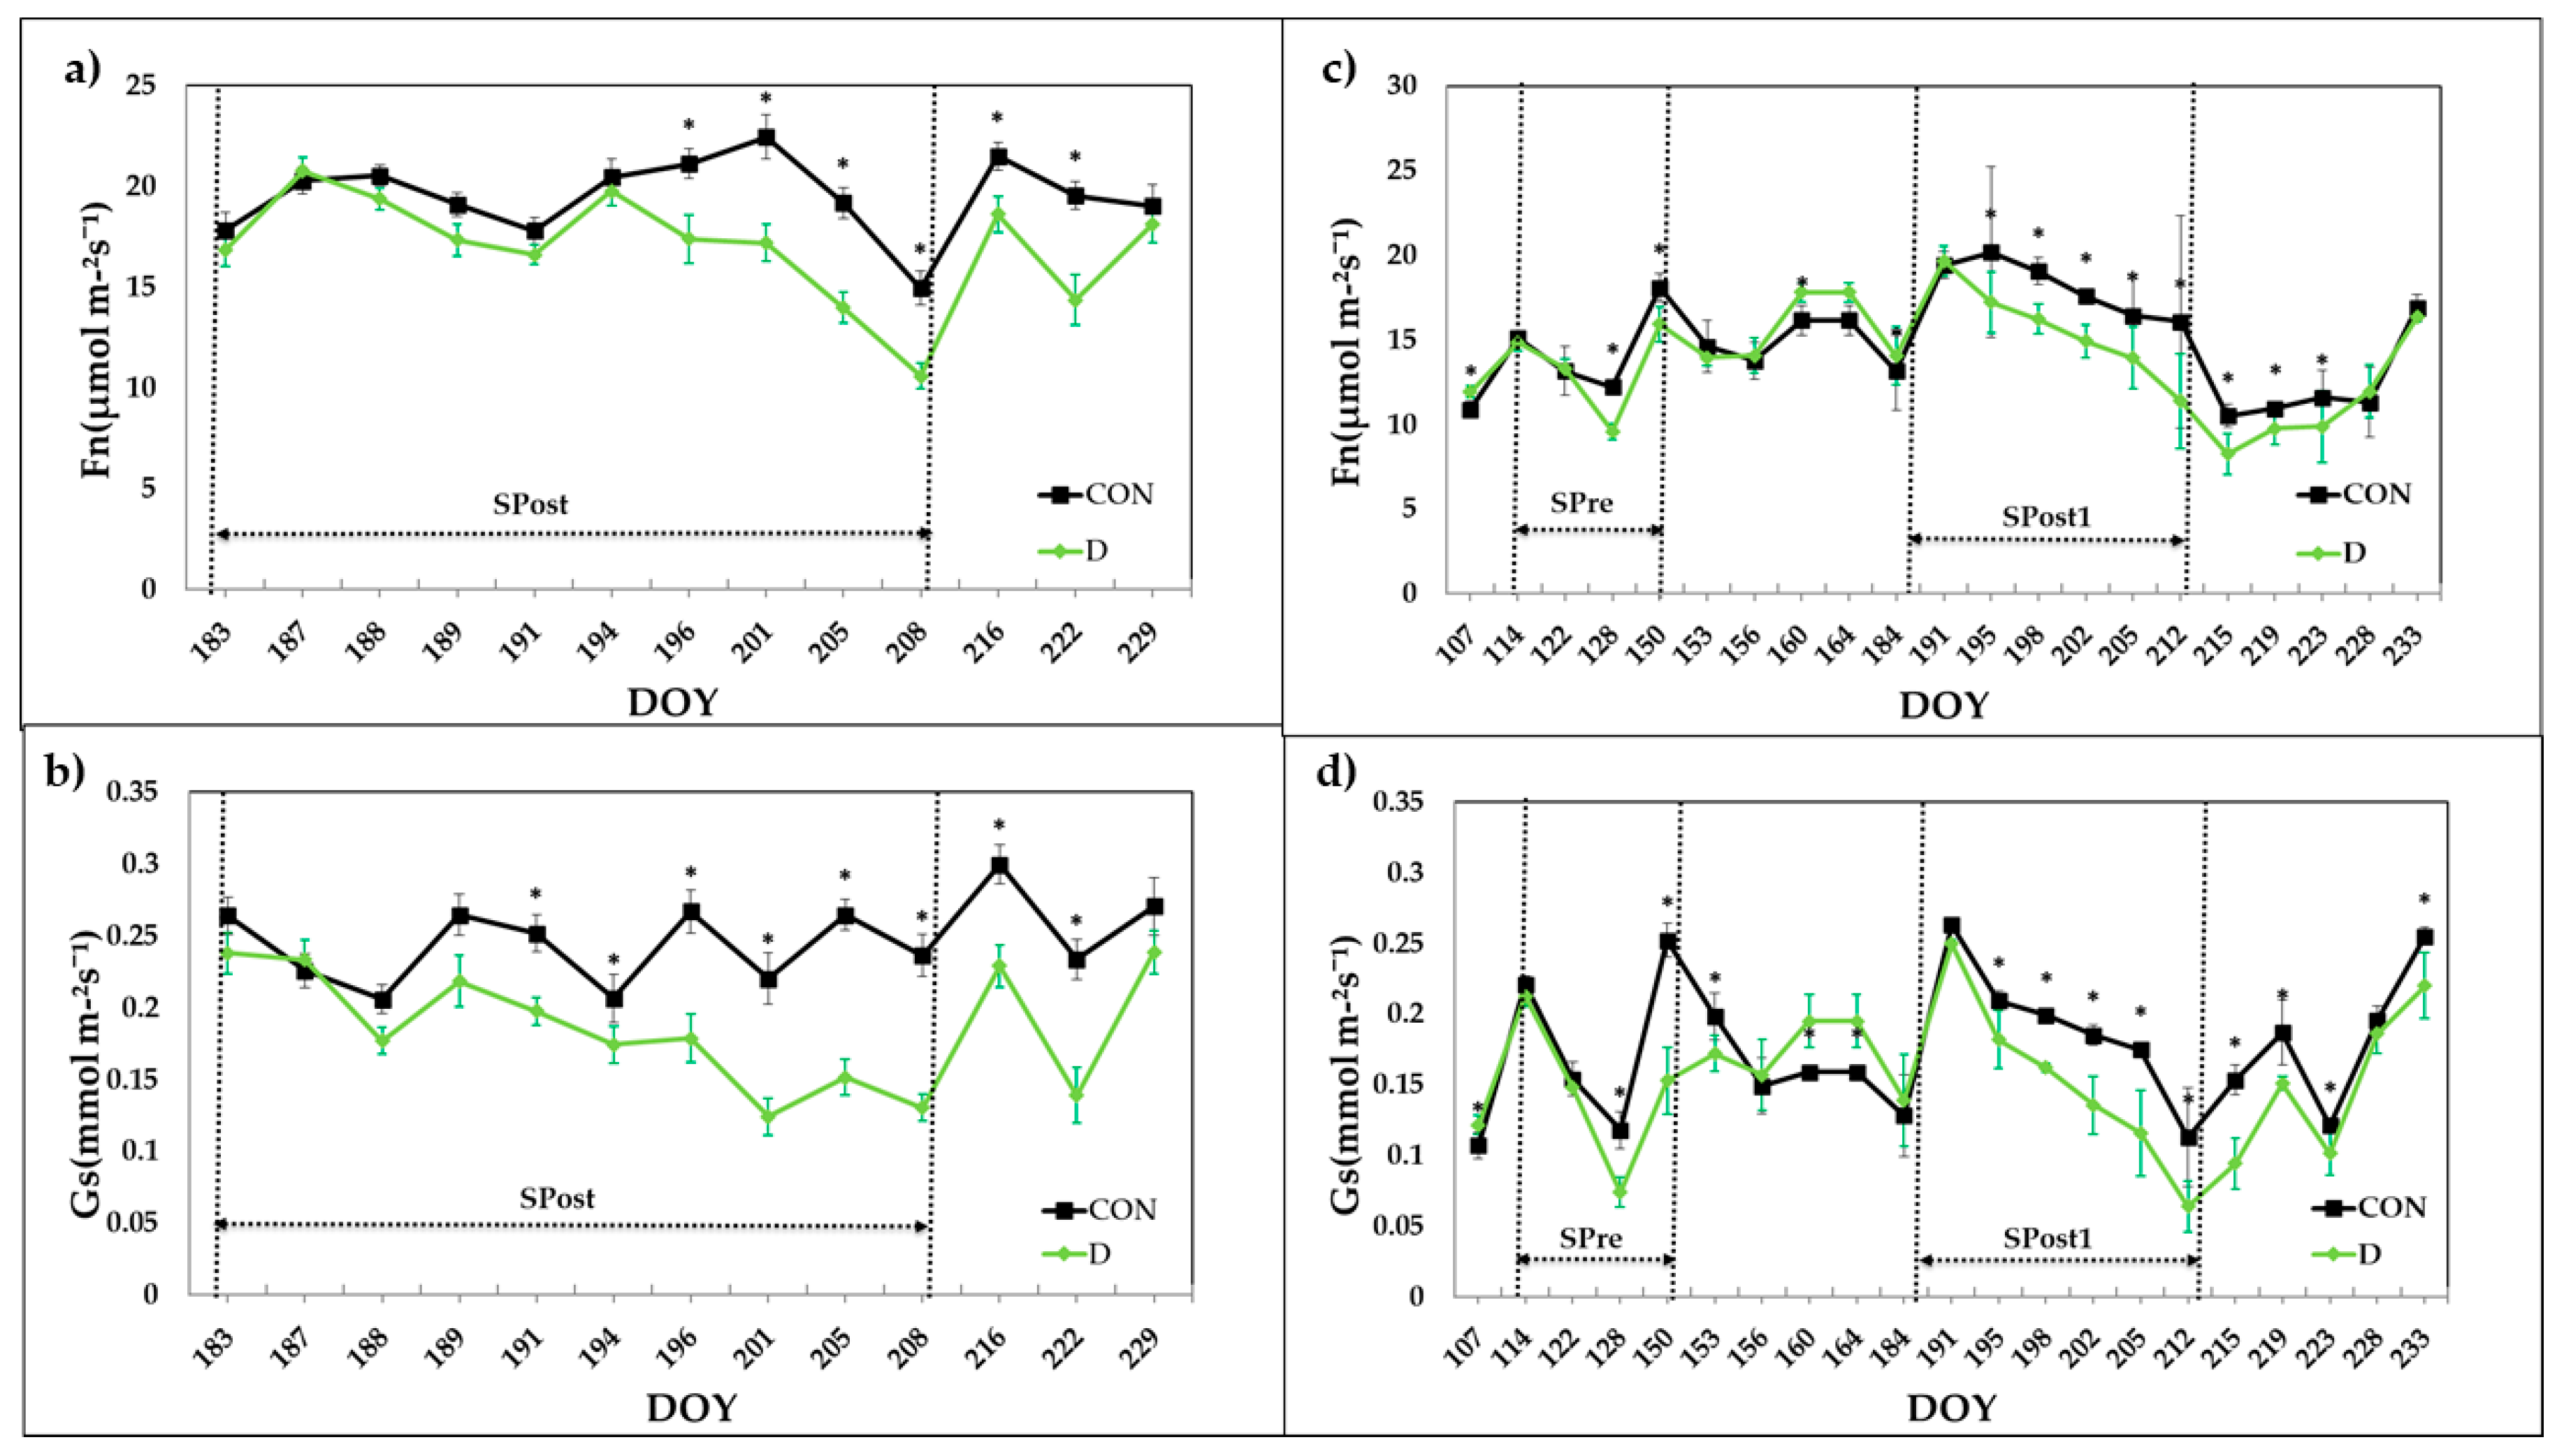
The values of Fn and Gs during the drying cycles are presented in Figure 3. In 2015, Fn and Gs values varied in the CON treatment, presenting a tendency to increase as the irrigation season progressed (Figure 3a,b). In this treatment, Fn and Gs values averaged 19.51 (µmolm−2s−1) and 0.25 (mmolm−2s−1), respectively. In the initial phase of the drying cycle, the suppression of irrigation in D caused a reduction in Fn and Gs values in relation to CON. The slight differences in Fn were not significant until DOY 196. In contrast, significant differences were found in Gs from DOY 191, reflecting an important degree of water use efficiency at leaf level. After restarting irrigation in D, Fn and Gs recovered to the CON values at 21 days on DOY 229.
In 2017, the Fn and Gs values also varied over time. The two gas exchange parameters presented a similar seasonal pattern, with significant differences between treatments from DOY 128 in the preharvest drying cycle and from DOY 195 in the postharvest drying cycle. An increasing trend of Fn and Gs can be seen as the irrigation season advanced in the CON treatment, from an initial value of 10.90 (µmolm−2s−1) to a final value of 16.90 (µmolm−2s−1) for Fn and from an initial value of 0.11 (mmolm−2s−1) to a final value of 0.26 (mmolm−2s−1) for Gs. The D treatment responded to irrigation cut-off with a decrease in Fn and Gs to a minimum value of 9.58 (µmolm−2s−1) and 0.07 (mmolm−2s−1) at 14 days after the start of the preharvest drying cycle. In the postharvest drying cycle, the minimum value reached was 11.4 (µmolm−2s−1) on DOY 212 for Fn and 0.06 (mmolm−2s−1) for Gs after 25 days without irrigation.
Table 6 shows the days that elapsed between irrigation cut-off and the existence of significant differences in Ψstem, Fn and Gs between the treatments in each drying cycle, and the days necessary for them to be equal again after restoring irrigation. In all drying cycles the first significant differences were always found in Ψstem after irrigation cut-off and ranged from 1 to 8 days. However, recovery after irrigation was restored was faster for Fn and Gs, ranging from 2 to 21 days. In 2017, it took 83 days of recovery for the Ψstem of D to equal that of CON.

3.3.2. Sap Flow

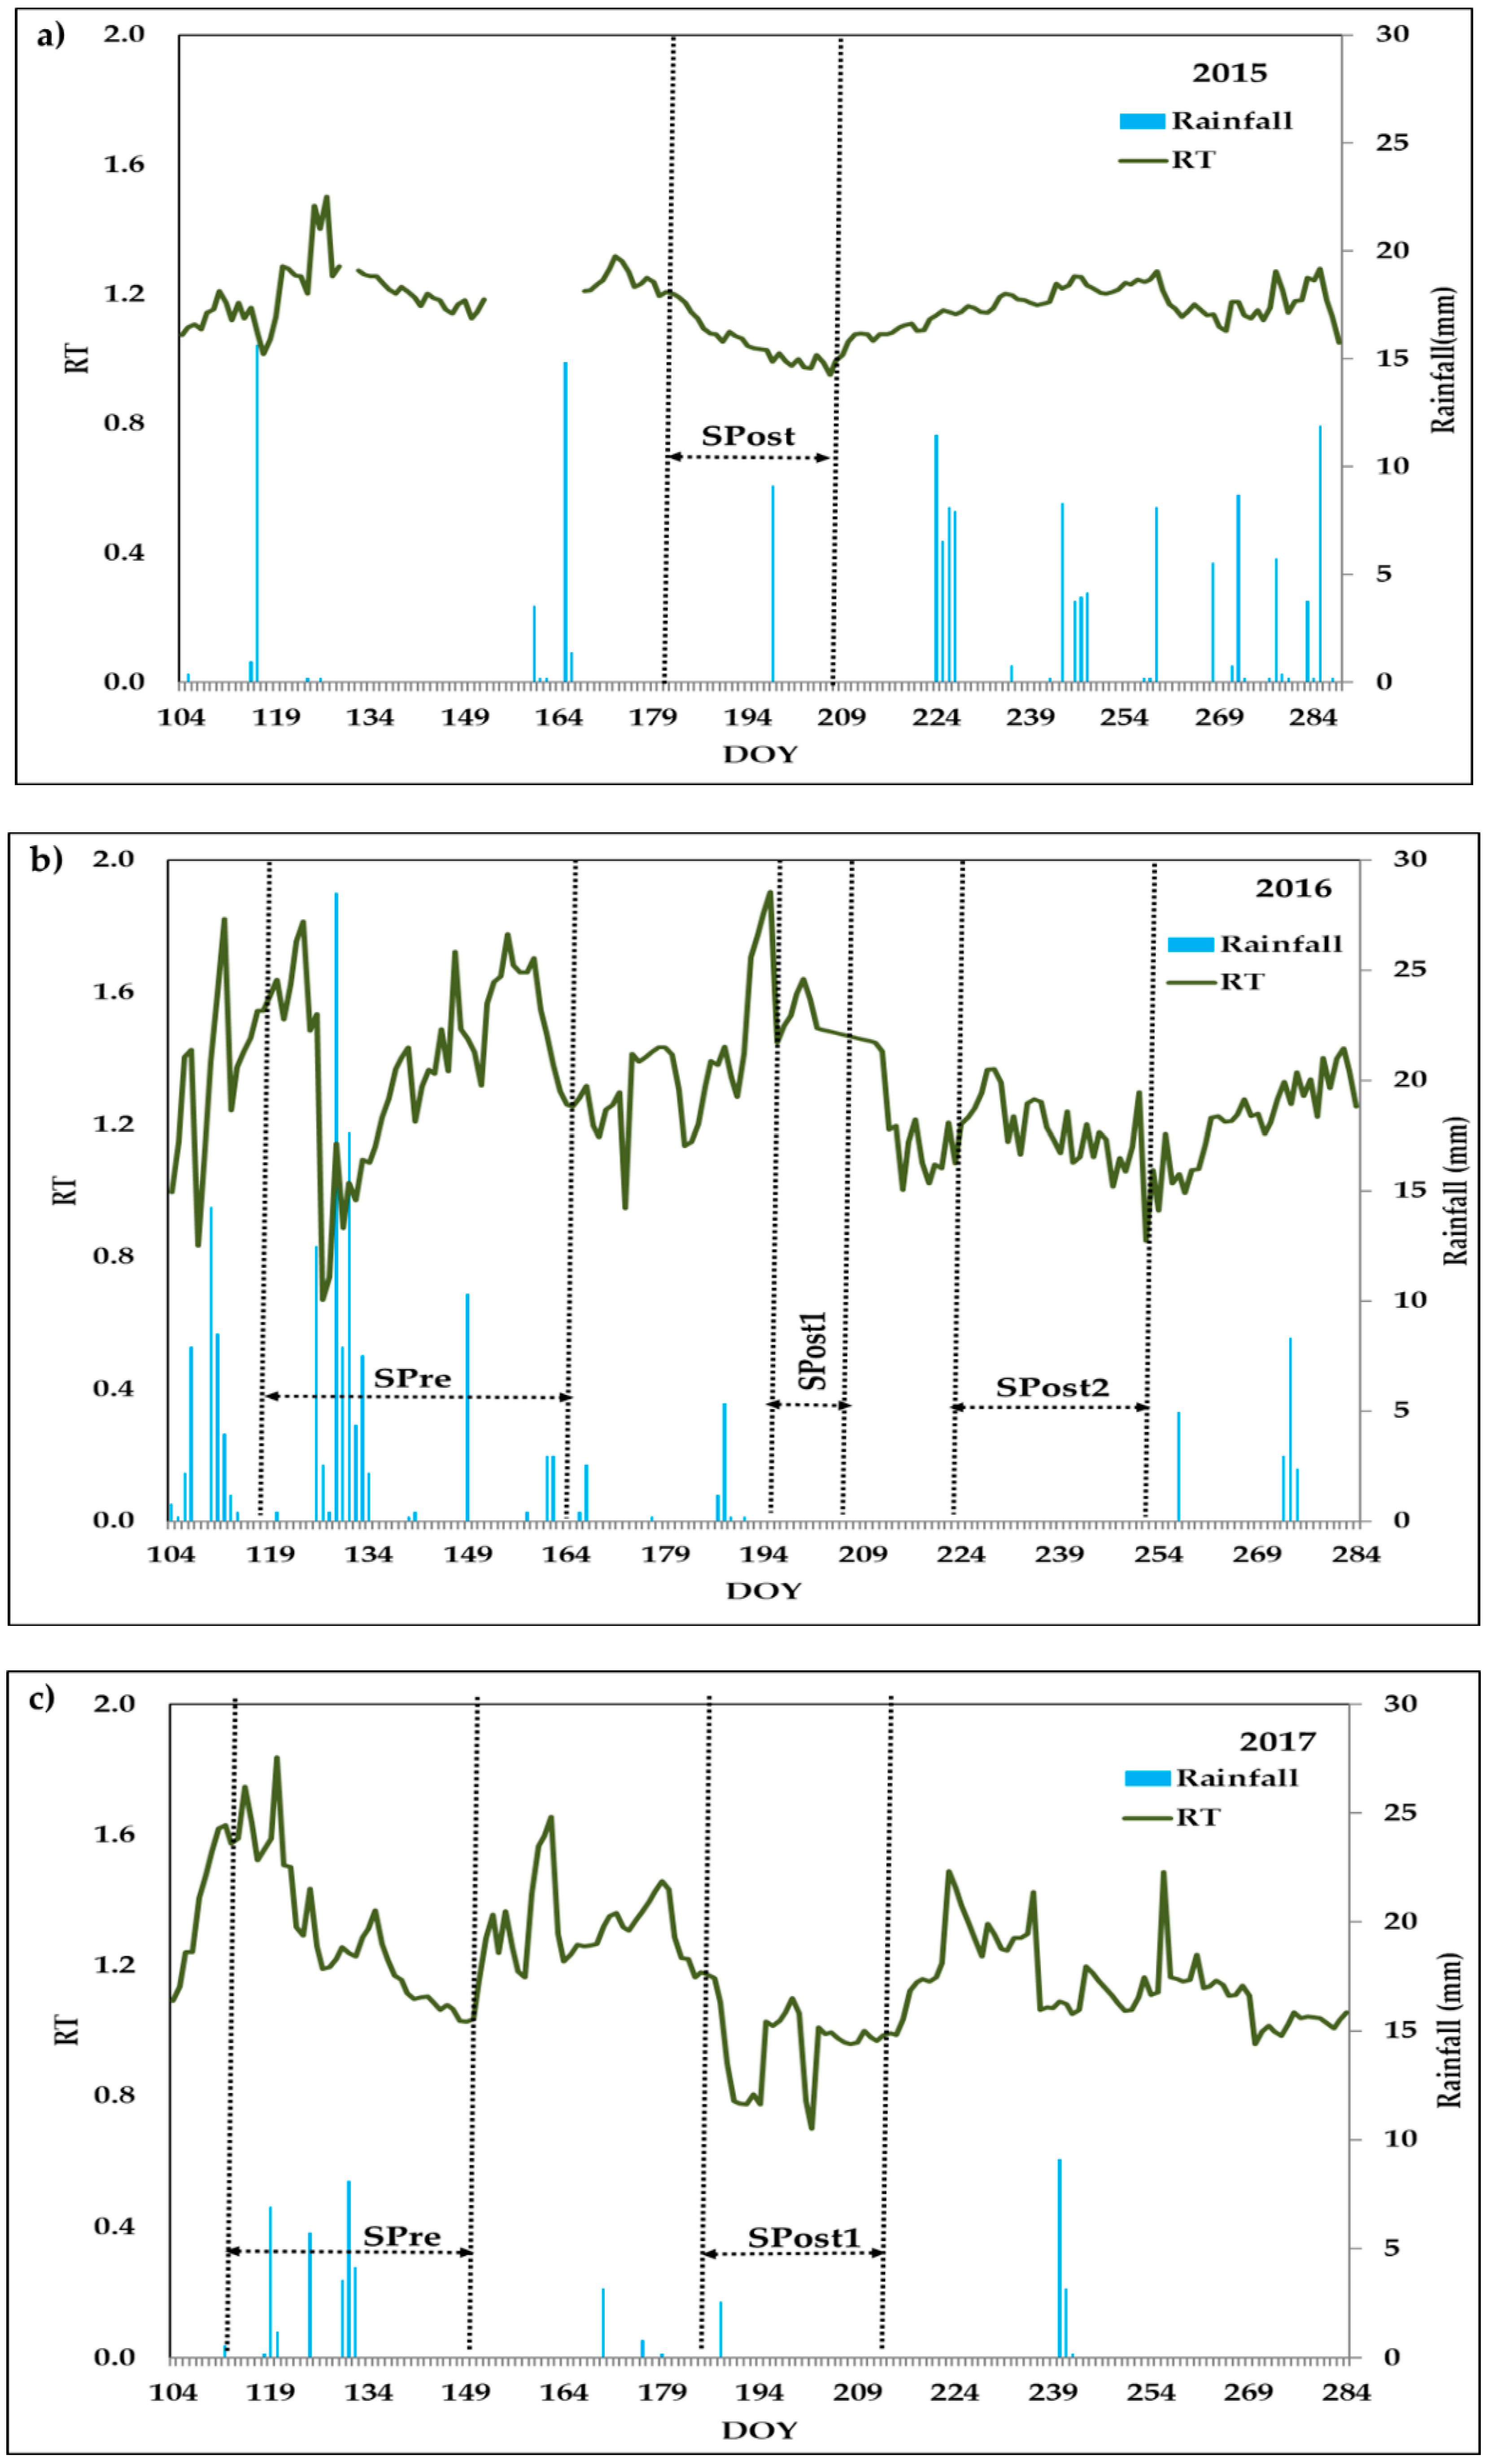
The relative transpiration (RT) for the 3 years of study is presented in Figure 4. Due to a failure in the sap flow probes, the RT was not calculated during a period of fifteen days in 2015, between DOY 153 and 167 (Figure 4a). Given the calibration procedure, the average values at the beginning of the experiment were close to 1. Once the drought period started, RT decreased to values below 1, reaching a minimum just before irrigation was restored. Soon after the restoration of irrigation, RT increased to values close to or even above 1 (Figure 4a).
In 2016 (Figure 4b), the daily values of RT fluctuated over time. Before the start of the different drying cycles, the average RT values were close to or even above 1, and after irrigation cut-off, they reached minimum values close to 0.6 on DOY 127, 1.44 on DOY 211 and 0.84 on DOY 252 for the first, second and third drying cycles, respectively. At the end of the irrigation season, RT was at a value above 1.
As in the previous years, in 2017 daily RT values fluctuated (Figure 4c). When the irrigation season began the average RT values were close to 1. Before the start of the first drying cycle, RT reached maximum values close to 1.8. Once the first drying cycle had started, RT decreased to values below 1, reaching a minimum just before the restoration of irrigation. In the first period of drought, RT was highly influenced by rainfall events. Just before the start of the second drying cycle, the RT values were close to 1. After the start of the second drying cycle, RT decreased, reaching a minimum value close to 0.7 on DOY 200. Once irrigation was restored, the RT values increased.
Despite the fact that RT responded to irrigation cut-off, constant fluctuations were observed throughout the vegetative cycle, indicating that other factors besides the availability of water in the soil were influencing the transpiration of the tree.

3.3.3. Soil Water Content (FDR Probes)

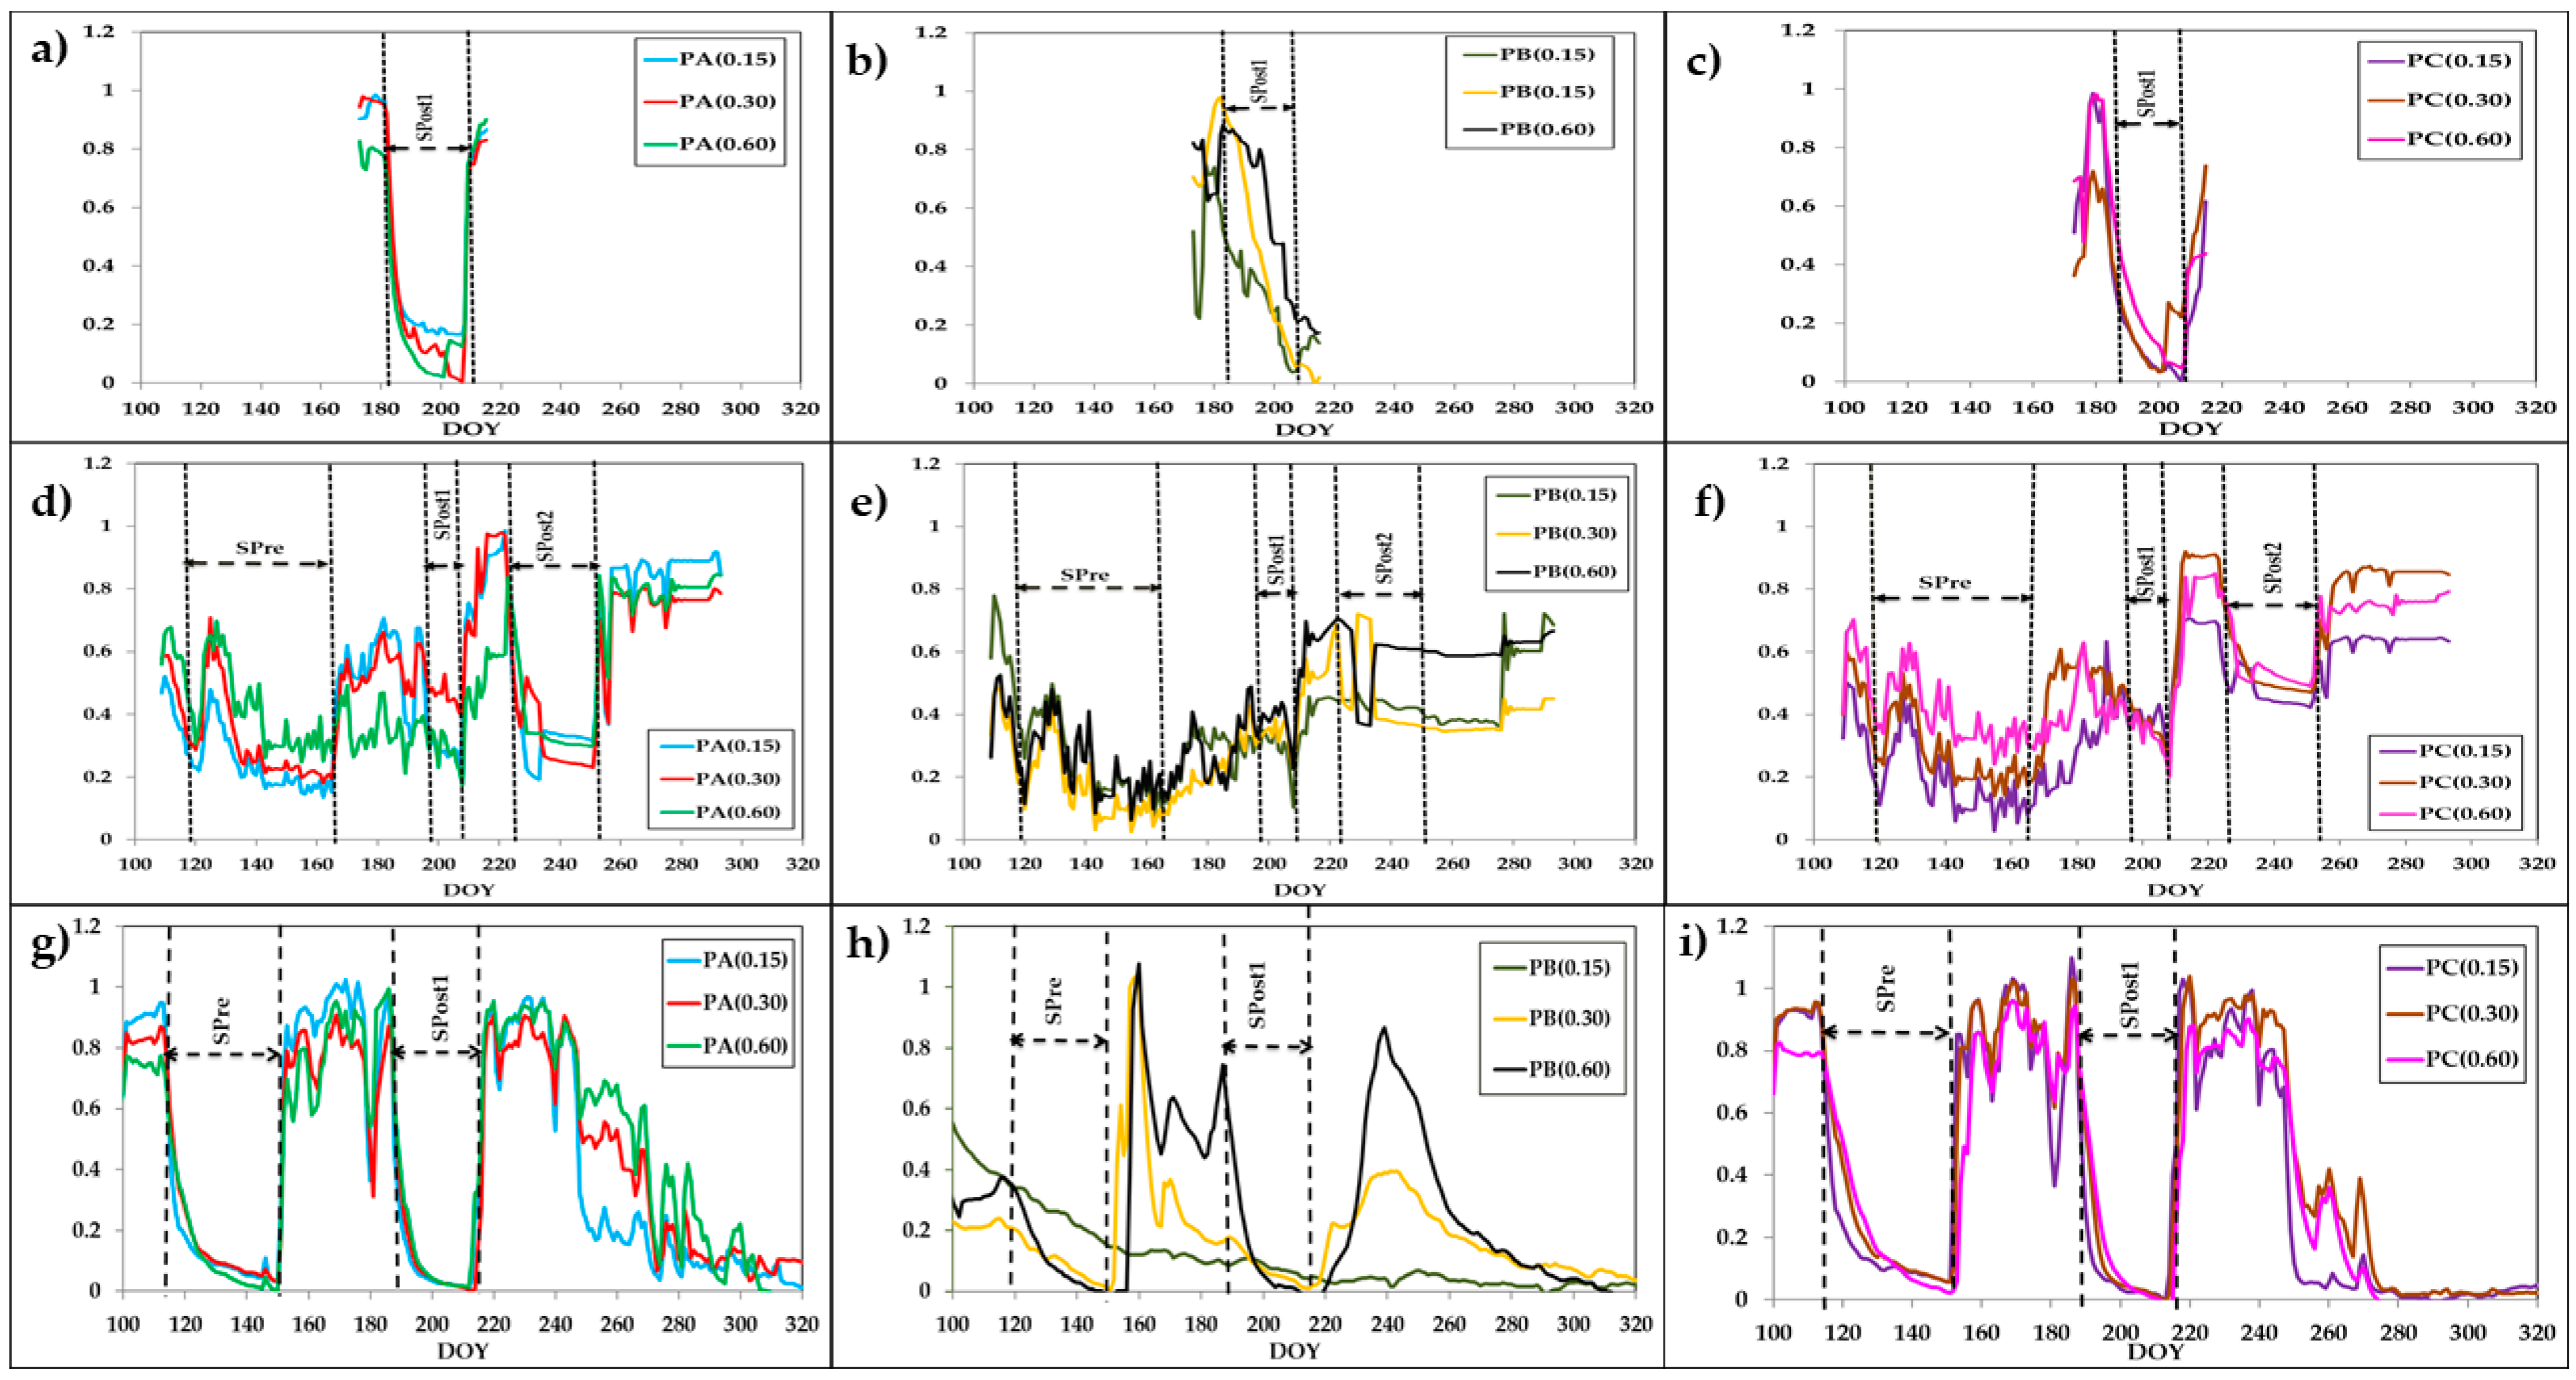
The seasonal evolution of RSWC, measured with FDR probes, is presented in Figure 5 for the D treatment in the different years of study. In Figure 5a–c, corresponding to 2015, only the period of the drying cycle is presented. Due to the calibration procedure that was carried out, the average values at the beginning of the drying cycle were close to 1. The probes located in position A (Figure 5a) were very sensitive to irrigation and had a very marked amplitude response between the maximum before the start of the drying cycle and the minimum at the end of the drying cycle. After irrigation cut-off, the RSWC fell very quickly in an initial stage between DOY 183 and DOY 191, and then slowed down to values close to 0 just before irrigation was restored. Soon after the restoration of irrigation, RSWC increased to values close to or even above 1 (Figure 5a). Probes located in position C (Figure 5c) at 0.15 and 0.30 m depth followed the same pattern as sensors located in position A, but these probes responded later to the suppression of irrigation. Probes located at 0.6 m depth (Figure 5c) showed a slower response to irrigation cut-off, and these probes presented a lower amplitude between the minimum just before irrigation cut-off and the maximum after its restoration. The probes located in position B (Figure 5b) were the last to respond to irrigation cut-off, having a progressive decrease in RSWC. After restarting irrigation, these probes detected almost no irrigation water.
In 2016 (Figure 5d–f), the year with the highest number of rain events during the vegetative cycle of the crop, RSWC fluctuated over time, representing the year with the highest number of rain events during the vegetative cycle of the crop. During the preharvest drying, the probes responded to the spring rains with an initial increase in RSWC after the suppression of irrigation (Figure 5d–f). In position A (Figure 5d), RSWC decreased to a minimum just before the restoration of irrigation. The RSWC values decreased slowly as depth increased. Just before the start of the first postharvest drying cycle, the RSWC values varied between 0.40 (probes located at 0.60 m depth) and 0.67 (probes located at 0.15 and 0.30 m depth). When the first postharvest drying cycle started, the decrease in RSWC varied between 0.17 (probes located at 0.6 m depth) and 0.44 (probes located at 0.15 and 0.30 m depth). In the last drying cycle, the three probes located in position A responded very fast to irrigation cut-off in the first 9 days before stabilizing. With respect to position C (Figure 5f), the progression of RSWC followed the same pattern as with the probes located in position A. However, only probes located at 0.30 m depth in position B (Figure 5e) followed the same pattern as the probes located in position A, but with less amplitude.
In 2017 (Figure 5g,i), after the beginning of the irrigation season, RSWC was higher than in 2016, the rainiest year. When the irrigation season began, the average RSWC values were close to 0.9 in both positions A and C. Before the preharvest drying cycle, RSWC reached maximum values close to 1. Once the first drying cycle started, RSWC decreased to values below 0, reaching a minimum just before irrigation was restored. Right before the start of the second drying cycle, the RSWC values were even above 1. From the start of the second drying cycle, RSWC decreased, reaching a minimum value close to 0 on DOY 213. Once irrigation was restored, the RSWC values increased until reaching a maximum value close to 1 on DOY 220. With respect to position B, the RSWC values of the probes located at 0.15 m depth decreased throughout the irrigation campaign from an initial value of 0.55 to a final value of 0. The probes located at 0.30 m and 0.60 m depth presented a similar pattern with RSWC decreasing progressively once the first and second drying cycles had started, but the probes located at 0.60 m responded later to the restoration of irrigation.

4. Discussion

4.1. Signal Intensity, Noise and Sensitivity

Many physiological processes in the plant can be affected by reducing soil water availability. Therefore, different plant measurements can be used as references for plant water status and to check the response to irrigation. For this purpose, they must be able to detect changes in water availability in short periods of time to optimize irrigation scheduling. In this work, we studied signal intensity (SI), the noise (CV) and the signal/noise ratio (S and S*) during the irrigation season in three different study years, both from indicators recorded continuously (SF) and from indicators recorded punctually (Ψstem, Fn, Gs and Fipard).
The similar SI of Ψstem and Gs to soil water depletion could be attributable to the fact that the main factor controlling Gs is xylem water potential, which determines the driving force for water transport between the bark and the xylem vessels [51]. In Japanese plum cv. “Angeleno”, Blanco-Cipollone et al. [29] observed an anisohydric behavior and concluded that midday Ψstem can be a good reference for the water status of the plant in this species. De la Rosa et al. [6] studied maximum daily trunk shrinkage (MDS), trunk growth rate (TGR), Ψstem, Gs and Fn in extra-early nectarine trees and found that the plant indicator with the highest SI was Gs. However, in young almond trees, MSD was the indicator that presented the highest SI [52]. Other studies have also found that MSD had a higher SI than Ψstem in adult apple [53], young plum [54] and adult kaki [55]. In all these cases, MSD was more variable (higher CV) than Ψstem. In the present work, the CV values reached for Ψstem were also less variable than the other plant water indicators (Fn, SF, Gs and Fipard). Fipard was the most variable indicator. Part of this variability may also be attributed to the fact that the Fipard in fruit crops is influenced by planting density, the size and shape of the tree crown (which depends on tree age and the conduction system) and the leaf area index [56]. If to the high variability of FIPAR we add the time required to take the measurements, it turns out that this parameter is poorly adapted to support irrigation scheduling since it has to be adjusted by using some other measure due to deviations from the estimated water needs, as reported by Casadesus et al. [34]. The Gs and Fn leaf-to-leaf variability could be due to the effect on leaf transpiration of microenvironmental conditions [57], branch crop load [58], and leaf distance to fruit [59]. The SF also presented a high CV, which is probably caused by the variability that exists in sap velocity and the thickness of conductive xylem around the perimeter of the tree [48]. The Ψstem was the most sensitive indicator for detecting the initiation of stress in the three-year study and was the first one that showed significant differences between treatments, confirming that it is the most suitable indicator for early-maturing Japanese plum irrigation scheduling. Badal et al. [55] measured Ψstem, Gs, fruit growth rate and MDS in kaki trees and reported that Ψstem presented the highest S. Several authors have also observed that Ψstem shows the highest sensitivity values obtained by the traditional method, including in peach [60], pomegranate [61] and nectarine [6] trees. Tuccio et al. [62] measured the pre-dawn and midday leaf water potential, Ψstem, leaf temperature and Gs in one-year-old potted grapevines and identified Ψstem as the most sensitive indicator. However, the results obtained with S* indicate that Fn was the most sensitive indicator in 2015 and Ψstem in 2016 and 2017. The S is more influenced by the CV values, while the S* is influenced by the SI values as well as the CV values.

4.2. Plant Response to Soil Water Content Deprivation

The trees exhibited increasing water stress when irrigation was suppressed in the D treatment. According to Ψstem as the indicator of water status, the cut-offs of irrigation during the postharvest period led the plants to support more severe water stress than in preharvest: the plant had already used up rainwater reserves (outside the area of influence of the drippers), evaporative demand was higher, the period without irrigation was longer in some cases and the tree crown was fully formed. Samperio et al. [24] carried out previous studies on deficit irrigation strategies in an early-maturing Japanese plum crop (Prunus salicina Lindl. cv. Red Beaut) and recommended that Ψstem values should be above −0.7 MPa in the preharvest period and no less than −1.2 MPa in the postharvest period. However, Millán et al. [9] indicated that trees under regulated deficit irrigation could support more severe stress in the postharvest period, since the Ψstem values were above −1.3 MPa with no resulting loss in yield in “Red Beaut” Japanese plum cultivar. In our study, the Ψstem values were about −1.05 MPa in 2016 and 2017 during the drying cycles in the preharvest period in the D treatment. In the postharvest period, the Ψstem values in the D treatment were above −1.30 MPa in 2015, supporting more severe stress levels of around −1.60 MPa during the drying cycles in 2016 and 2017 (Figure 2). In this work, Ψstem during the drying cycles reached values lower than those recommended for this species and variety, both in pre- and post-harvest.
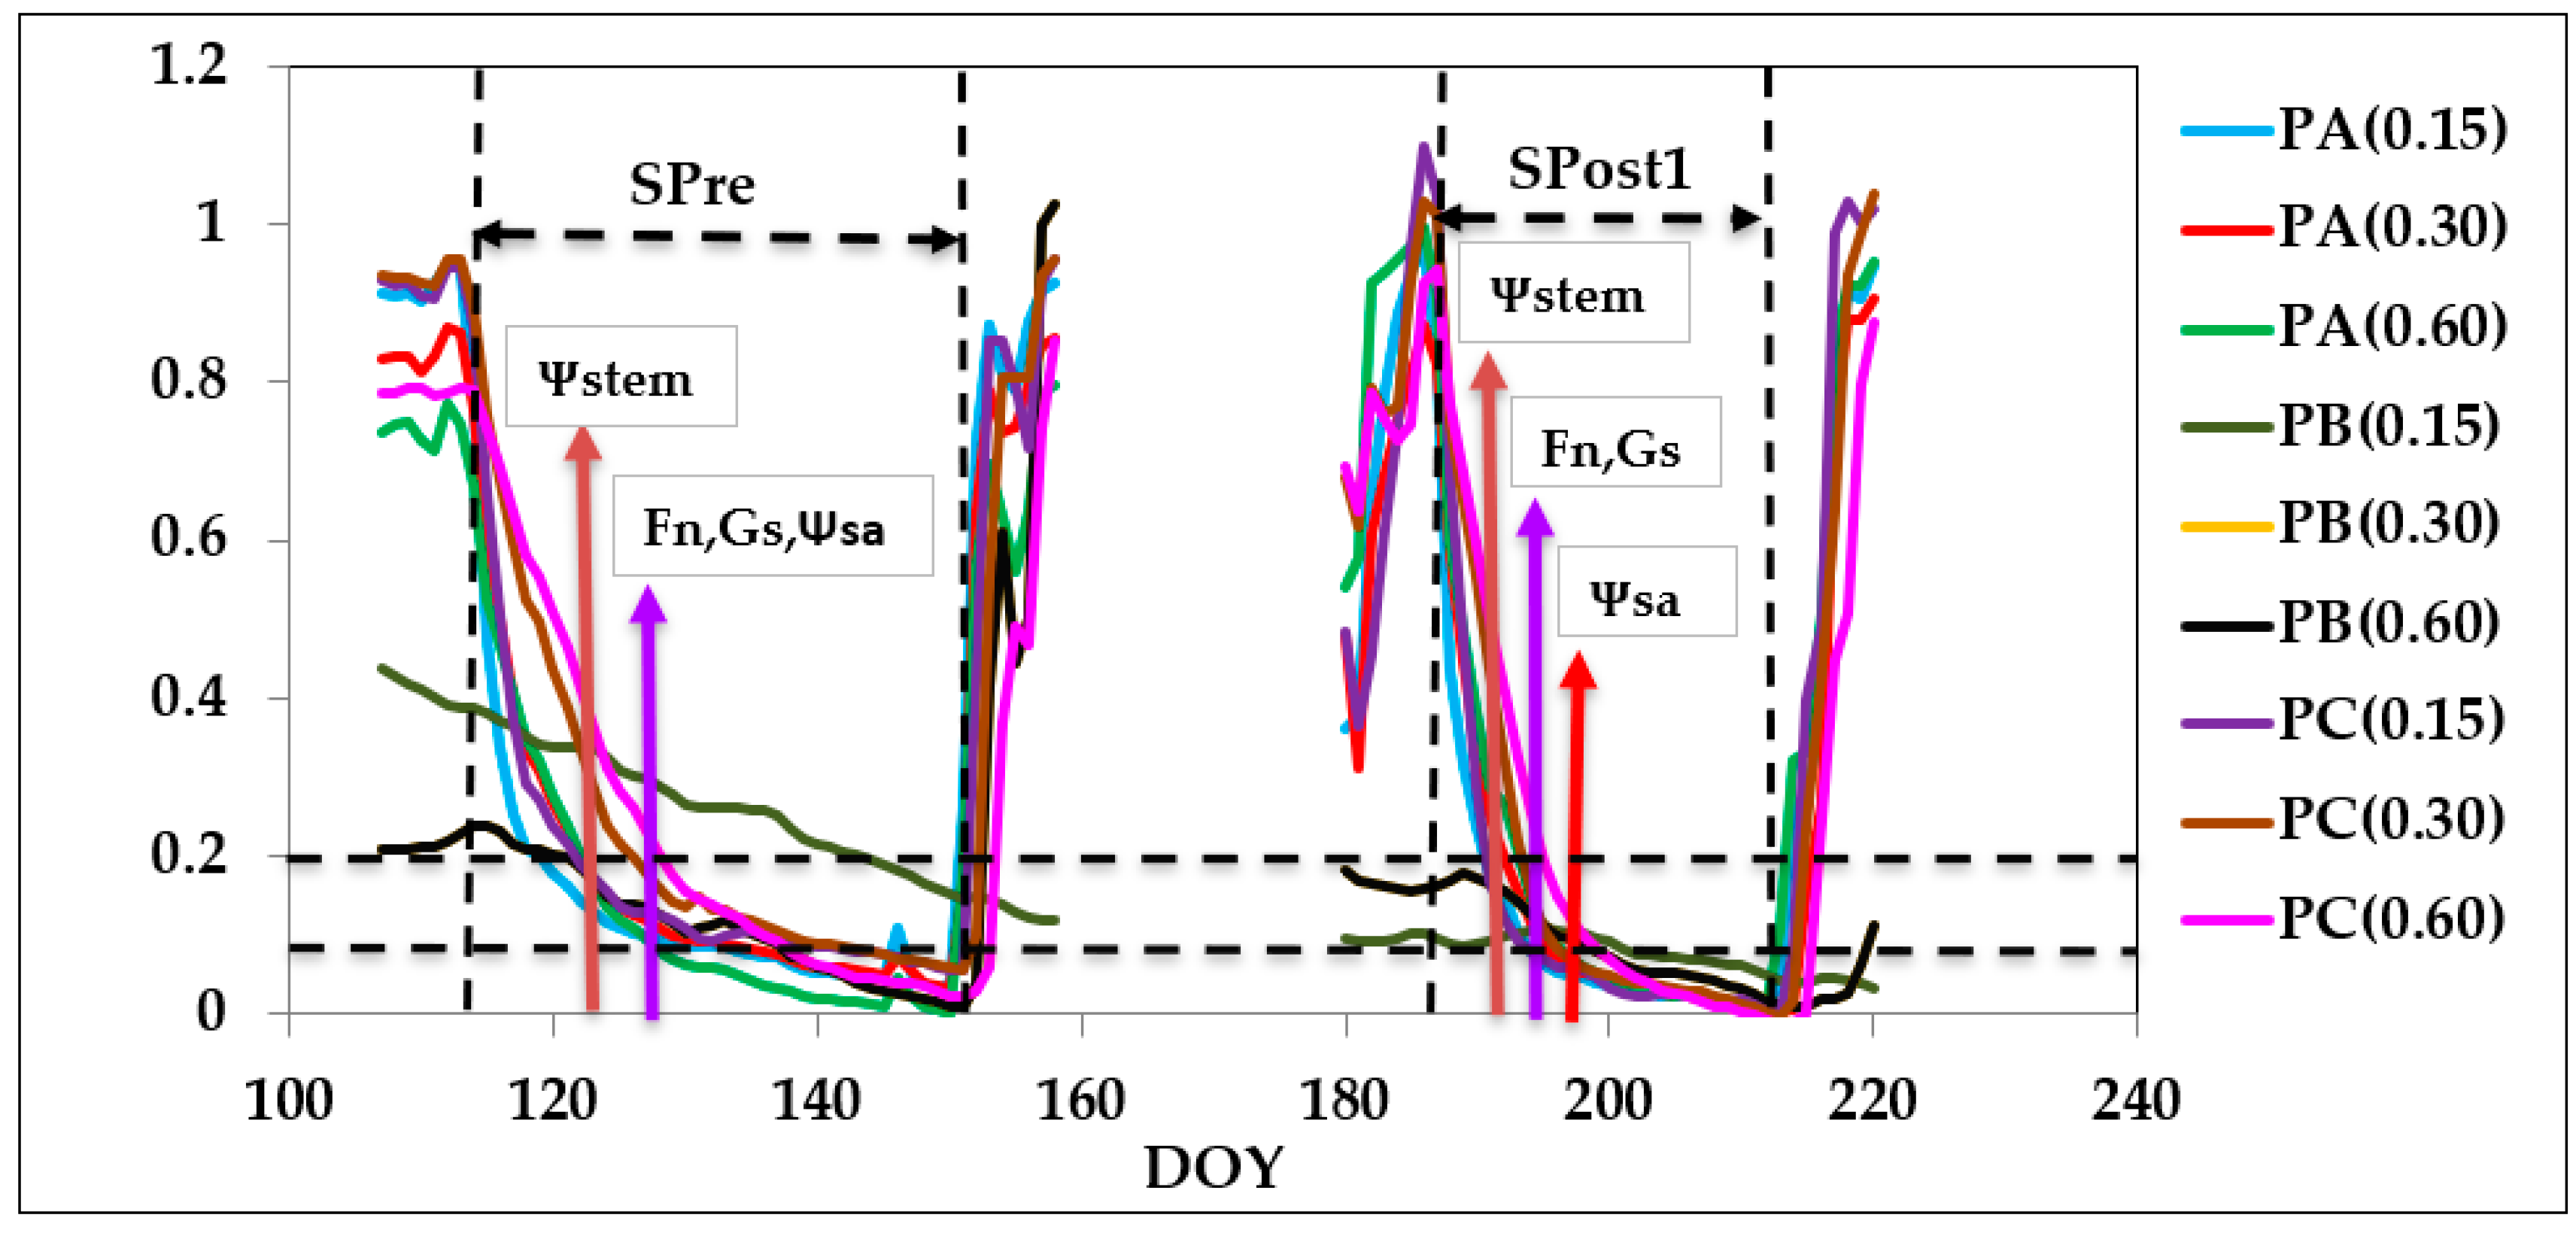
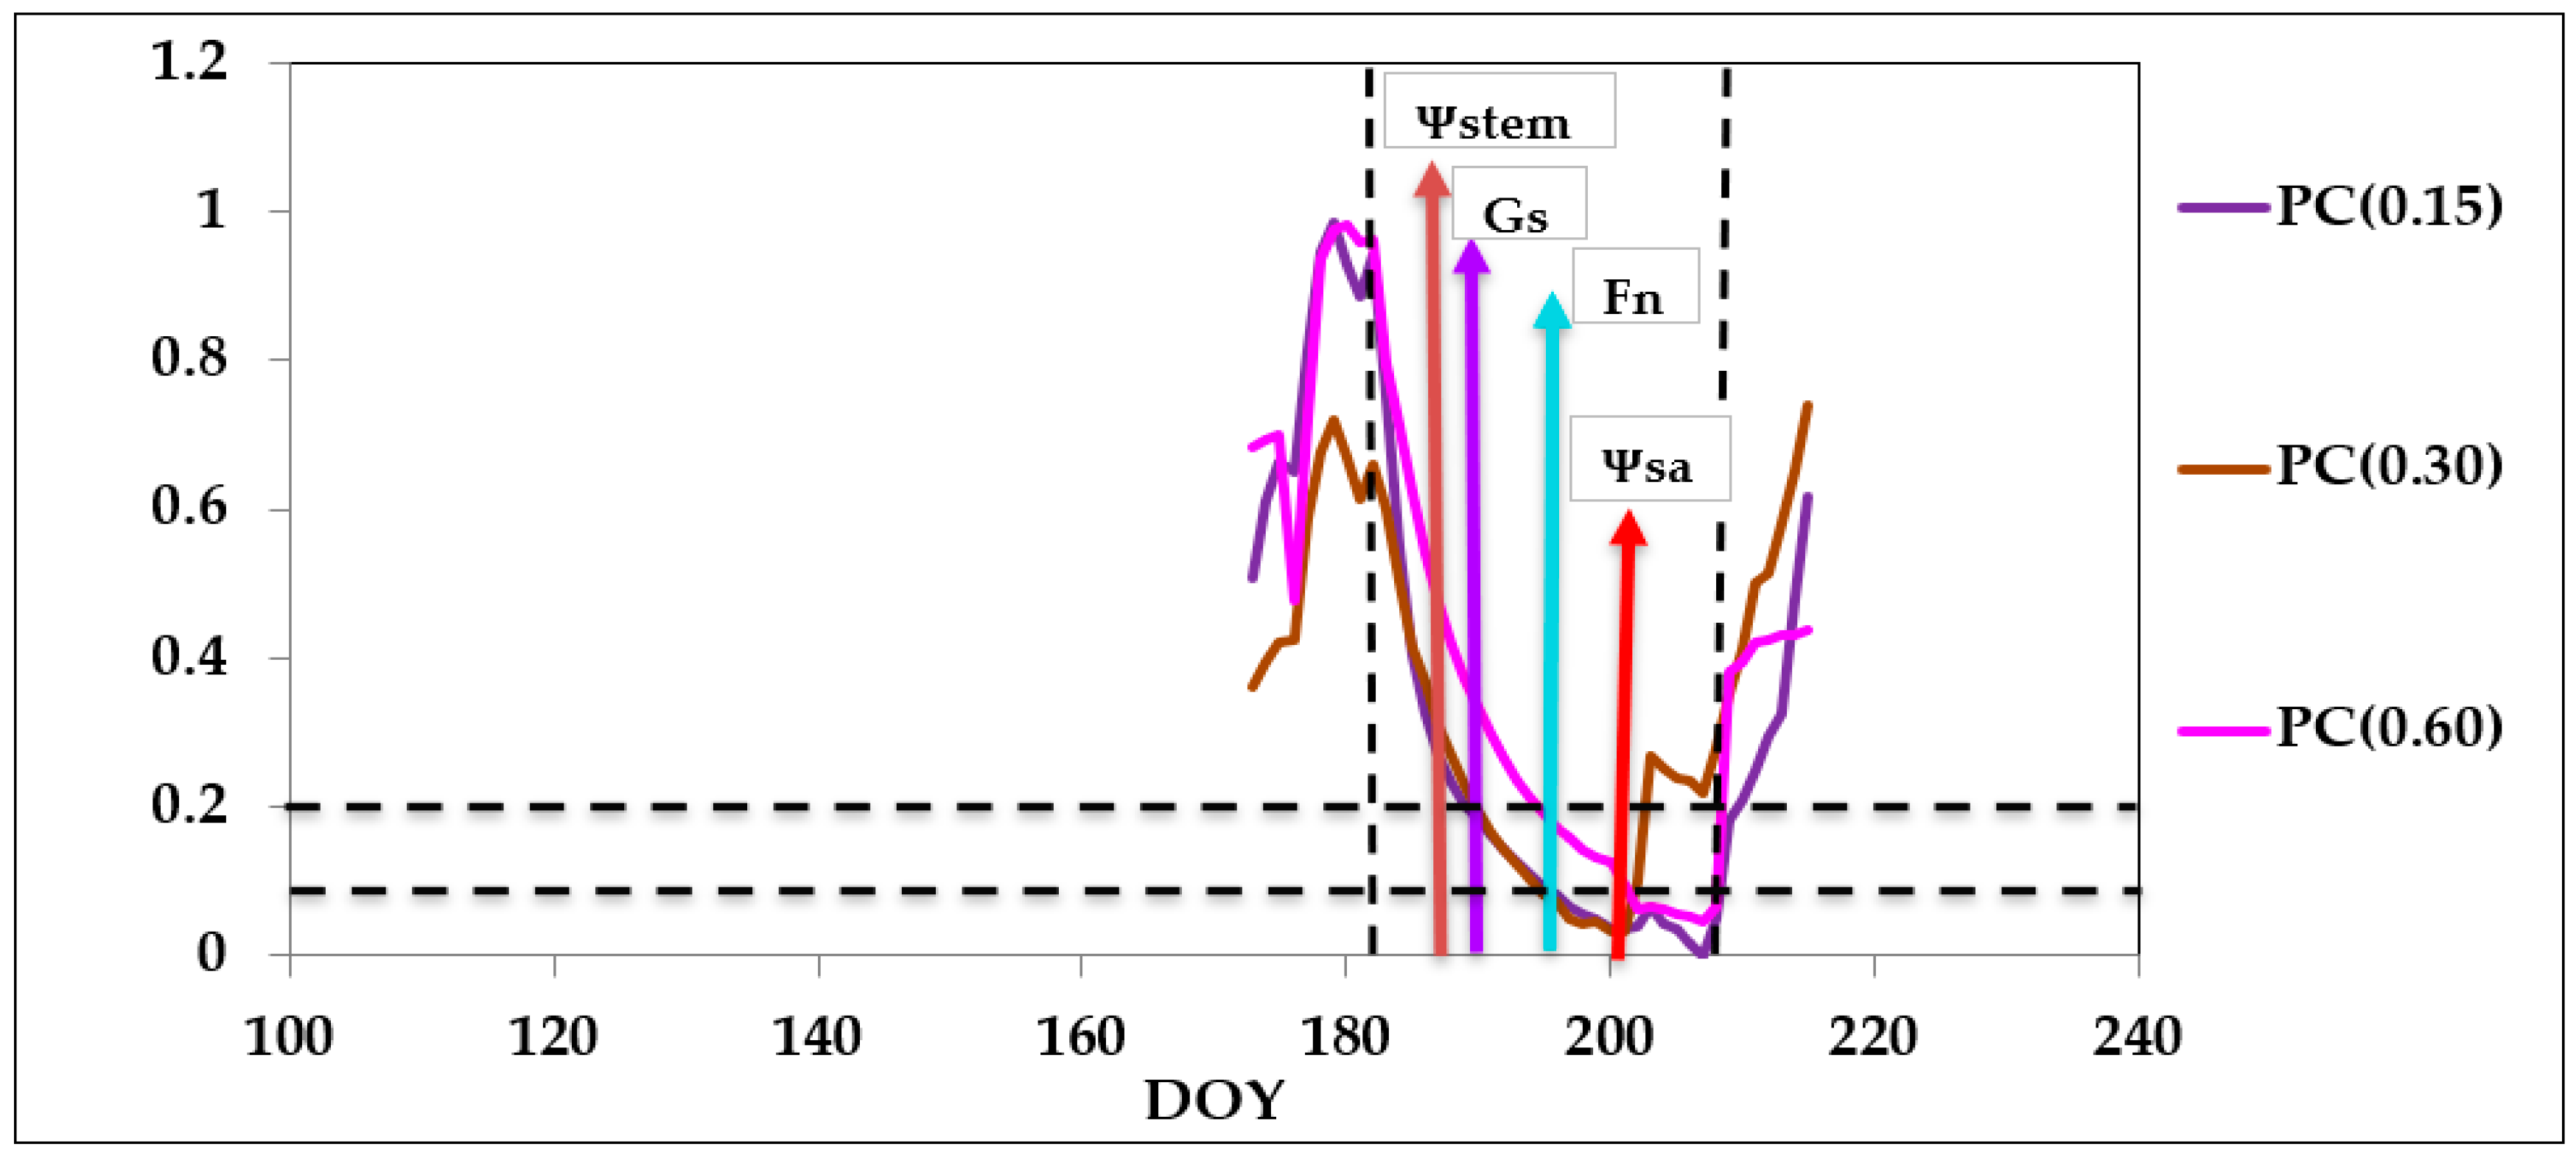
In order to efficiently use the measurements of soil water content provided by continuous measurement probes in the adjustment of irrigation scheduling, both to cover the needs of the crop and to establish deficit irrigation strategies, there are two key aspects: the location of the probes in relation to the dripper and the criteria for the interpretation of the measurements in the decision making process. Regarding the FDR probes, the driest year with the highest ETo was taken into account to establish a protocol for placing the probes in the optimum position. Figure 6 and Figure 7 shows the temporal trends of soil moisture measured with FDR probes during the drying cycles of 2015 and 2017, which were the two years with the clearest response to irrigation cut-offs. The probes clearly react to the suppression of irrigation, with a sharp drop in RSWC immediately after each irrigation cut-off followed by a change in slope when irrigation is restored. This pattern was similar in the two drying cycles, although the second cycle presented a sharper fall of RSWC. The probes located furthest away from the dripper (position C at 0.3 and 0.6 m depth) and the probes located in position B at 0.15 m depth responded to the suppression of irrigation but with a greater delay in time than the rest of the probes. One approach to interpreting soil probe measurements is to analyze the physiological processes that are affected by variable water content in the soil (Table 3, Table 4, Table 5 and Table 6). As can be seen in Figure 6, we identified a short period after irrigation cut-off in which the soil moisture content recorded by the probes closest to the dripper dropped rapidly, but no stress symptoms were detected in the tree. After that, in a second step, despite the existence of evidence of water stress (Ψstem), it did not affect the exchange of gases in the leaves (Gs and Fn). This period can be considered one of “low water stress level”. When Fn and Gs are clearly affected it can be considered as “moderate stress” and below a Ψstem value of −1.2 MPa (Samperio et al., 2015) as “severe stress”.
Now using 2017 as a reference, Figure 6 shows the evolution of RSWC in the different positions and the times when significant differences were detected between treatments in Ψstem, Fn and Gs. According to Samperio et al. [24], water stress should be avoided in this variety during the preharvest period (Ψstem = −0.7 MPa), which happened on DOY 128, and so it would not be advisable to allow a drop of RSWC below 0.2 in the probes located in position A in the preharvest period. In the postharvest period, the Ψstem detected significant differences between the two treatments 4 days before starting the second drying cycle on DOY 191. In the second drought period, significant differences between the two treatments were detected on DOY 195. For unstressed postharvest scheduling, the criteria would be similar to preharvest. Following the regulated deficit irrigation recommendations for this variety, Ψstem should not fall below −1.2 MPa in the postharvest period [24]. However, this happened on DOY 198 and RSWC fell to 0.1 according to the probes located in position C at 0.6 m.
In light of these results, the probes placed in the position between drippers (C) provide enough information to establish the irrigation levels: at 15 and 30 cm deep for non-stress situations (0.2 RSWC) and at 0.6 m deep for the lower limit recommended in postharvest (0.1 RSWC).
Figure 7 applies this criterion to the 2015 drying cycle: the limit of 0.2 applied to the two probes closest to the surface would mean a delay of 2 days in relation to the detection of stress by Ψstem; and the level of 0.2 for the deepest probe would anticipate by 1 day the minimum recommended level.
Many hypotheses have been proposed to explain the causes of variation in soil water extraction patterns by plants. For example, Atkinson [63] affirmed that the distribution of thin roots reflects the water extraction potential of a crop, and Nnyamah and Black [64] suggested that the water extraction pattern of a crop was similar to the distribution of thin roots when the soil water was not limiting. However, Clothier and Green [65] observed that root water uptake was more dependent on soil water availability than on thin roots distribution. Other studies suggest that soil water extraction by plants also depends on other factors such as the diameter of lateral roots [66], soil heterogeneity, root system structure, and the availability and partitioning of carbon in the roots [67], differences in xylem maturation and in the number and diameter of xylem vessels, as well as differences in the formation of endodermis and exodermis with the development of roots [68,69,70,71]. In this experiment, the fastest water extraction occurred in the areas closest to the dripper, repeating a similar extraction pattern, but displaced in time in more distant positions.
Several authors have used a mathematical model that simulates soil water dynamics for drip irrigation to identify the time stable representative positions (TSRPs) of the moisture sensors. It has been shown that in the case of uniform soil profiles, a single sensor can provide representative readings throughout the duration of the irrigation cycle. The optimum common TSRP is located 28 cm below the soil surface and 11 cm from the drip line [72]. Soulis and Elmaloglou [18] reported that, in soils with different layers, at least one sensor in each soil layer is required in order to provide representative readings. Furthermore, the optimum TSRPs are located 11, 15 and 19 cm below the soil surface and 10 and 16 cm from the dripline. Silva et al. [73] monitored time domain reflectometry probes inside the drainage lysimeter on different soil profiles and demonstrated that the optimum sensor position varied according to the development stage of the banana crop. However, this is the first time that an attempt has been made to establish guidelines for soil moisture sensor placement taking into account the physiological response of the plant. Although it is expected that the results obtained for these specific conditions may differ in other plantations, we propose the study of the dynamics recorded by soil moisture probes, and the relation to a sensitive measure of the tree water status as a criterion for the adjustment of irrigation schedules.
It should also be noted that while the neutron probe is considered the most effective method of measuring SWC, it was difficult in this study to establish a protocol to locate the tubes in an ideal position taking into account physiological plant measurements, since, with these probes, targeted measurements were obtained with a measurement interval of 7 days (data not presented).

5. Conclusions

This document addressed two fundamental issues: selecting a reliable indicator of the water status of the Japanese plum and, secondly, establishing a procedure for positioning and interpreting the soil moisture probe readings to support irrigation scheduling. The first of the points is a preliminary step for the second, since it is proposed that the water status of the tree be the evaluation criterion used for the installation and guidance of FDR probes.
The most sensitive parameter for detecting the initiation of stress was Ψstem with a lower CV, making it the most suitable indicator for early-maturing Japanese plum irrigation scheduling. However gaseous exchange recovered more quickly after irrigation was restored. Gs had a higher SI, close to that of Ψstem but with a higher CV. In this case, both parameters are appropriate when it is necessary to quantify the SI of the water stress supported. Fn, SF and Fipard had lower sensitivity and greater difficulty in processing and interpreting these measures, been less recommendable as a support for irrigation scheduling.
The results of this study indicate the existence of high variability in soil water extraction by the plum crop in different locations of the soil profile. The drying cycles allowed the selection of the positions that best respond to the extraction of water by the tree. Additionally, they helped to establish a threshold in the different phases of the crop below which detrimental effects to the crop can be caused. We propose that this threshold be established through the physiological measures of Ψstem, Fn and Gs. In this experimental orchard, the positions closest to the drippers were the most suitable for monitoring “non-stress” schedules, while for “medium” and “severe” stress references are preferable positions further away from the drippers.

Author Contributions

S.M. (≈45%): Literature review; planning and execution of experimental work; processing of data; discussion of results and writing of the paper. C.C. (≈15%): discussion of results and final revision of the English. A.V. (≈10%) processing of data. M.J.M. (≈15%): discussion of results. M.H.P. (≈15%): project coordinator; planning of experimental work and revision of the paper. All authors have read and agreed to the published version of the manuscript.

Funding

This research was funded by INIA (RTA2013-00045-C04 project).

Acknowledgments

Junta de Extremadura (GR15112, Research Group AGA001 and CCESAGROS projects).

Conflicts of Interest

The authors declare no conflict of interest.

References

  1. Romero, R.; Muriel, J.; García, I.; de la Peña, D.M. Research on Automatic Irrigation Control: State of the Art and Recent Results. Agric. Water Manag. 2012, 114, 59–66. [Google Scholar] [CrossRef]
  2. Morales, F.; Ancín, M.; Fakhet, D.; González-Torralba, J.; Gámez, A.L.; Seminario, A.; Soba, D.; Ben Mariem, S.; Garriga, M.; Aranjuelo, I. Photosynthetic Metabolism Under Stressful Growth Conditions as a Bases for Crop Breeding and Yield Improvement. Plants 2020, 9, 88. [Google Scholar] [CrossRef] [PubMed] [Green Version]
  3. Houghton, J.T. The Scientific Basis. In Contribution of Working Group I to the Third Assessment Report of the Intergovernmental Panel on Climate Change; Cambridge University Press: Cambridge, UK, 2001. [Google Scholar]
  4. Edenhofer, O. Climate Change 2014: Mitigation of Climate Change; Cambridge University Press: Cambridge, UK, 2015. [Google Scholar]
  5. Turral, H.; Burke, J.; Faurès, J. Climate Change, Water and Food Security; Food and Agriculture Organization of the United Nations (FAO): Rome, Italy, 2011. [Google Scholar]
  6. De la Rosa, J.; Conesa, M.R.; Domingo, R.; Pérez-Pastor, A. A New Approach to Ascertain the Sensitivity to Water Stress of Different Plant Water Indicators in Extra-Early Nectarine Trees. Sci. Hortic. 2014, 169, 147–153. [Google Scholar] [CrossRef]
  7. Osroosh, Y.; Peters, R.T.; Campbell, C.S.; Zhang, Q. Comparison of Irrigation Automation Algorithms for Drip-Irrigated Apple Trees. Comput. Electron. Agric. 2016, 128, 87–99. [Google Scholar] [CrossRef] [Green Version]
  8. Casadesús, J.; Mata, M.; Marsal, J.; Girona, J. A General Algorithm for Automated Scheduling of Drip Irrigation in Tree Crops. Comput. Electron. Agric. 2012, 83, 11–20. [Google Scholar] [CrossRef]
  9. Millán, S.; Casadesús, J.; Campillo, C.; Moñino, M.J.; Prieto, M.H. Using Soil Moisture Sensors for Automated Irrigation Scheduling in a Plum Crop. Water 2019, 11, 2061. [Google Scholar] [CrossRef] [Green Version]
  10. Millán, S.; Campillo, C.; Casadesús, J.; Pérez-Rodríguez, J.M.; Prieto, M.H. Automatic Irrigation Scheduling on a Hedgerow Olive Orchard using an Algorithm of Water Balance Readjusted with Soil Moisture Sensors. Sensors 2020, 20, 2526. [Google Scholar] [CrossRef]
  11. Zazueta, F.S.; Xin, J. Soil Moisture Sensors. Soil Sci. 1994, 73, 391–401. [Google Scholar]
  12. Dobriyal, P.; Qureshi, A.; Badola, R.; Hussain, S.A. A Review of the Methods Available for Estimating Soil Moisture and its Implications for Water Resource Management. J. Hydrol. 2012, 458, 110–117. [Google Scholar] [CrossRef]
  13. Robock, A.; Vinnikov, K.Y.; Srinivasan, G.; Entin, J.K.; Hollinger, S.E.; Speranskaya, N.A.; Liu, S.; Namkhai, A. The Global Soil Moisture Data Bank. Bull. Am. Meteorol. Soc. 2000, 81, 1281–1300. [Google Scholar] [CrossRef] [Green Version]
  14. Evett, S.R. Soil Water Measurement by Time Domain Reflectometry. Encycl. Water Sci. 2003, 894–898. [Google Scholar]
  15. Erlingsson, S.; Baltzer, S.; Baena, J.; Bjarnason, G. Measurement techniques for water flow. In Water in Road Structures; Anonymous, Ed.; Springer: Dordrecht, The Netherlands, 2009; pp. 45–67. [Google Scholar]
  16. Wang, Y.-N.; Fan, J.; Li, S.-Q.; Zeng, C.; Wang, Q.-J. Effects of Sensor’s Laying Depth for Precision Irrigation on Growth Characteristics of Maturate Grapes. Yingyong Shengtai Xuebao 2012, 23, 2062–2068. [Google Scholar] [PubMed]
  17. Dabach, S.; Shani, U.; Lazarovitch, N. The Influence of Water Uptake on Matric Head Variability in a Drip-Irrigated Root Zone. Soil Tillage Res. 2016, 155, 216–224. [Google Scholar] [CrossRef]
  18. Soulis, K.X.; Elmaloglou, S. Optimum Soil Water Content Sensors Placement for Surface Drip Irrigation Scheduling in Layered Soils. Comput. Electron. Agric. 2018, 152, 1–8. [Google Scholar] [CrossRef]
  19. Elmaloglou, S.; Soulis, K.X.; Dercas, N. Simulation of Soil Water Dynamics under Surface Drip Irrigation from Equidistant Line Sources. Water Resour. Manag. 2013, 27, 4131–4148. [Google Scholar] [CrossRef]
  20. Nolz, R. A Review on the Quantification of Soil Water Balance Components as a Basis for Agricultural Water Management with a Focus on Weighing Lysimeters and Soil Water sensors/Ein Überblick Über Die Ermittlung Von Wasserhaushaltsgrößen Als Basis Für Die Landeskulturelle Wasserwirtschaft Mit Fokus Auf Lysimeter Und Bodenwassersensoren. Die Bodenkult. J. Land Manag. Food Environ. 2016, 67, 133–144. [Google Scholar]
  21. Bradford, K.; Hsiao, T. Physiological responses to moderate water stress. In Physiological Plant Ecology II; Anonymous, Ed.; Springer: Berlin/Heidelberg, Germany, 1982; pp. 263–324. [Google Scholar]
  22. Jiménez, S.; Dridi, J.; Gutiérrez, D.; Moret, D.; Irigoyen, J.J.; Moreno, M.A.; Gogorcena, Y. Physiological, Biochemical and Molecular Responses in Four Prunus Rootstocks Submitted to Drought Stress. Tree Physiol. 2013, 33, 1061–1075. [Google Scholar] [CrossRef]
  23. Shackel, K.A.; Ahmadi, H.; Biasi, W.; Buchner, R.; Goldhamer, D.; Gurusinghe, S.; Hasey, J.; Kester, D.; Krueger, B.; Lampinen, B. Plant Water Status as an Index of Irrigation Need in Deciduous Fruit Trees. HortTechnology 1997, 7, 23–29. [Google Scholar] [CrossRef] [Green Version]
  24. Samperio, A.; Prieto, M.H.; Blanco-Cipollone, F.; Vivas, A.; Moñino, M.J. Effects of Post-Harvest Deficit Irrigation in `Red Beaut´ Japanese Plum: Tree Water Status, Vegetative Growth, Fruit Yield, Quality and Economic Return. Agric. Water Manag. 2015, 150, 92–102. [Google Scholar] [CrossRef]
  25. Sperry, J.S.; Wang, Y.; Wolfe, B.T.; Mackay, D.S.; Anderegg, W.R.; McDowell, N.G.; Pockman, W.T. Pragmatic Hydraulic Theory Predicts Stomatal Responses to Climatic Water Deficits. New Phytol. 2016, 212, 577–589. [Google Scholar] [CrossRef] [Green Version]
  26. Martin-StPaul, N.; Delzon, S.; Cochard, H. Plant Resistance to Drought Depends on Timely Stomatal Closure. Ecol. Lett. 2017, 20, 1437–1447. [Google Scholar] [CrossRef] [PubMed]
  27. Ruiz-Sanchez, M.C.; Pérez-Pastor, A.; Torrecillas, A.; Domingo, R. Regulated Deficit Irrigation in Apricot Trees. Acta Hortic. 2000, 2, 759–766. [Google Scholar] [CrossRef]
  28. Bhusal, N.; Han, S.; Yoon, T. Impact of Drought Stress on Photosynthetic Response, Leaf Water Potential, and Stem Sap Flow in Two Cultivars of Bi-Leader Apple Trees (Malus× Domestica Borkh.). Scientia Hortic. 2019, 246, 535–543. [Google Scholar] [CrossRef]
  29. Blanco-Cipollone, F.; Lourenço, S.; Silvestre, J.; Conceição, N.; Moñino, M.J.; Vivas, A.; Ferreira, M.I. Plant Water Status Indicators for Irrigation Scheduling Associated with Iso-and Anisohydric Behavior: Vine and Plum Trees. Horticulturae 2017, 3, 47. [Google Scholar] [CrossRef]
  30. Medrano, H.; Escalona, J.M.; Bota, J.; Gulías, J.; Flexas, J. Regulation of Photosynthesis of C3 Plants in Response to Progressive Drought: Stomatal Conductance as a Reference Parameter. Ann. Bot. 2002, 89, 895–905. [Google Scholar] [CrossRef]
  31. Wang, X.; Wang, W.; Huang, J.; Peng, S.; Xiong, D. Diffusional Conductance to CO2 is the Key Limitation to Photosynthesis in Salt-stressed Leaves of Rice (Oryza Sativa). Physiol. Plant. 2018, 163, 45–58. [Google Scholar] [CrossRef] [Green Version]
  32. Ashraf, M.; Harris, P.J. Photosynthesis under Stressful Environments: An Overview. Photosynthetica 2013, 51, 163–190. [Google Scholar] [CrossRef]
  33. Ferree, D. Canopy Development and Yield Efficiency of’ Golden Delicious’ Apple Trees in Four Orchard Management Systems. J. Am. Soc. Hort. Sci. 1980, 105, 376–380. [Google Scholar]
  34. Casadesus, J.; Mata, M.; Marsal, J.; Girona, J. Automated Irrigation of Apple Trees Based on Measurements of Light Interception by the Canopy. Biosyst. Eng. 2011, 108, 220–226. [Google Scholar] [CrossRef]
  35. Deutscher, J.; Kupec, P.; Dundek, P.; Holík, L.; Machala, M.; Urban, J. Diurnal Dynamics of Streamflow in an Upland Forested Micro-Watershed during Short Precipitation-Free Periods is Altered by Tree Sap Flow. Hydrol. Process. 2016, 30, 2042–2049. [Google Scholar] [CrossRef]
  36. Wang, X.; Liu, J.; Sun, Y.; Li, K.; Zhang, C. Sap Flow Characteristics of Three Afforestation Species during the Wet and Dry Seasons in a Dry-Hot Valley in Southwest China. J. For. Res. 2017, 28, 51–62. [Google Scholar] [CrossRef]
  37. Kirschbaum, M.U.; McMillan, A.M. Warming and Elevated CO2 have Opposing Influences on Transpiration. Which is More Important? Curr. For. Rep. 2018, 4, 51–71. [Google Scholar] [CrossRef] [Green Version]
  38. Tie, Q.; Hu, H.; Tian, F.; Guan, H.; Lin, H. Environmental and Physiological Controls on Sap Flow in a Subhumid Mountainous Catchment in North China. Agric. For. Meteorol. 2017, 240, 46–57. [Google Scholar] [CrossRef]
  39. Domingo, F.; Villagarcía, L.; Brenner, A.; Puigdefábregas, J. Evapotranspiration Model for Semi-Arid Shrub-Lands Tested Against Data from SE Spain. Agric. For. Meteorol. 1999, 95, 67–84. [Google Scholar] [CrossRef]
  40. Goldhamer, D.; Fereres, E. Irrigation Scheduling of Almond Trees with Trunk Diameter Sensors. Irrig. Sci. 2004, 23, 11–19. [Google Scholar] [CrossRef]
  41. Goldhamer, D.A.; Fereres, E. Irrigation Scheduling Protocols using Continuously Recorded Trunk Diameter Measurements. Irrig. Sci. 2001, 20, 115–125. [Google Scholar] [CrossRef]
  42. Jones, H.G. Irrigation Scheduling: Advantages and Pitfalls of Plant-Based Methods. J. Exp. Bot. 2004, 55, 2427–2436. [Google Scholar] [CrossRef] [Green Version]
  43. Soil Survey Division Staff. Keys to Soil Taxonomy, 8th ed.; U.S.D.A.-NRCS: Lincoln, NE, USA, 1998. [Google Scholar]
  44. Allen, R.G.; Pereira, L.S.; Raes, D.; Smith, M. Crop Evapotranspiration-Guidelines for Computing Crop Water Requirements-FAO Irrigation and Drainage Paper 56; FAO: Rome, Italy, 1998; Volume 300, p. D05109. [Google Scholar]
  45. Moñino, M.; Samperio, A.; Vivas, A.; Blanco-Cipollone, F.; Prieto, M. Manual Práctico De Riego Ciruelo Japonés; CICYTEX, Gobierno de Extremadura: Badajoz, Spain, 2014. [Google Scholar]
  46. Swanson, R.; Whitfield, D. A Numerical Analysis of Heat Pulse Velocity Theory and Practice. J. Exp. Bot. 1981, 32, 221–239. [Google Scholar] [CrossRef]
  47. Testi, L.; Villalobos, F.J. New Approach for Measuring Low Sap Velocities in Trees. Agric. For. Meteorol. 2009, 149, 730–734. [Google Scholar] [CrossRef]
  48. López-Bernal, Á.; Alcántara, E.; Testi, L.; Villalobos, F.J. Spatial Sap Flow and Xylem Anatomical Characteristics in Olive Trees Under Different Irrigation Regimes. Tree Physiol. 2010, 30, 1536–1544. [Google Scholar] [CrossRef] [PubMed] [Green Version]
  49. Samperio, A.; Moñino, M.J.; Marsal, J.; Prieto, M.H.; Stöckle, C. Use of CropSyst as a Tool to Predict Water use and Crop Coefficient in Japanese Plum Trees. Agric. Water Manag. 2014, 146, 57–68. [Google Scholar] [CrossRef]
  50. Goldhamer, D.A.; Viveros, M. Effects of Preharvest Irrigation Cutoff Durations and Postharvest Water Deprivation on Almond Tree Performance. Irrig. Sci. 2000, 19, 125–131. [Google Scholar] [CrossRef]
  51. Molz, F.J.; Klepper, B.; Browning, V.D. Radial Diffusion of Free Energy in Stem Phloem: An Experimental Study 1. Agron. J. 1973, 65, 219–222. [Google Scholar] [CrossRef]
  52. Goldhamer, D.; Fereres, E.; Salinas, M. Can Almond Trees Directly Dictate their Irrigation Needs? Calif. Agric. 2003, 57, 138–144. [Google Scholar] [CrossRef] [Green Version]
  53. Naor, A.; Cohen, S. Sensitivity and Variability of Maximum Trunk Shrinkage, Midday Stem Water Potential, and Transpiration Rate in Response to Withholding Irrigation from Field-Grown Apple Trees. HortScience 2003, 38, 547–551. [Google Scholar] [CrossRef] [Green Version]
  54. Intrigliolo, D.S.; Castel, J.R. Continuous Measurement of Plant and Soil Water Status for Irrigation Scheduling in Plum. Irrig. Sci. 2004, 23, 93–102. [Google Scholar] [CrossRef]
  55. Badal, E.; Buesa, I.; Guerra, D.; Bonet, L.; Ferrer, P.; Intrigliolo, D.S. Maximum Diurnal Trunk Shrinkage is a Sensitive Indicator of Plant Water, Stress in Diospyros Kaki (Persimmon) Trees. Agric. Water Manag. 2010, 98, 143–147. [Google Scholar] [CrossRef]
  56. Robinson, T.L.; Lakso, A.N. Bases of Yield and Production Efficiency in Apple Orchard Systems. J. Am. Soc. Hort. Sci. 1991, 116, 188–194. [Google Scholar] [CrossRef] [Green Version]
  57. Hsiao, T.C. Plant Responses to Water Stress. Annu. Rev. Plant Physiol. 1973, 24, 519–570. [Google Scholar] [CrossRef]
  58. Marsal, J.; Girona, J.; Basile, B.; Dejong, T. Heterogeneity in Fruit Distribution and Stem Water Potential Variations in Peach Trees under Different Irrigation Conditions. J. Hortic. Sci. Biotechnol. 2005, 80, 82–86. [Google Scholar] [CrossRef] [Green Version]
  59. Palmer, J. Effects of Varying Crop Load on Photosynthesis, Dry Matter Production and Partitioning of Crispin/M. 27 Apple Trees. Tree Physiol. 1992, 11, 19–33. [Google Scholar] [CrossRef] [PubMed]
  60. Goldhamer, D.A.; Fereres, E.; Mata, M.; Girona, J.; Cohen, M. Sensitivity of Continuous and Discrete Plant and Soil Water Status Monitoring in Peach Trees Subjected to Deficit Irrigation. J. Am. Soc. Hort. Sci. 1999, 124, 437–444. [Google Scholar] [CrossRef] [Green Version]
  61. Intrigliolo, D.S.; Puerto, H.; Bonet, L.; Alarcón, J.; Nicolas, E.; Bartual, J. Usefulness of Trunk Diameter Variations as Continuous Water Stress Indicators of Pomegranate (Punica Granatum) Trees. Agric. Water Manag. 2011, 98, 1462–1468. [Google Scholar] [CrossRef]
  62. Tuccio, L.; Piccolo, E.L.; Battelli, R.; Matteoli, S.; Massai, R.; Scalabrelli, G.; Remorini, D. Physiological Indicators to Assess Water Status in Potted Grapevine (Vitis Vinifera L.). Sci. Hortic. 2019, 255, 8–13. [Google Scholar] [CrossRef]
  63. Atkinson, D. The Distribution and Effectiveness of the Roots of Tree Crops. Hortic. Rev. 1981. [Google Scholar]
  64. Nnyamah, J.U.; Black, T. Rates and Patterns of Water Uptake in a Douglas-Fir Forest. Soil Sci. Soc. Am. J. 1977, 41, 972–979. [Google Scholar] [CrossRef]
  65. Clothier, B.E.; Green, S.R. Rootzone Processes and the Efficient Use of Irrigation Water. Agric. Water Manag. 1994, 25, 1–12. [Google Scholar] [CrossRef]
  66. Thaler, P.; Pagès, L. Periodicity in the Development of the Root System of Young Rubber Trees (Hevea Brasiliensis Müell. Arg.): Relationship with Shoot Development. Plant Cell Environ. 1996, 19, 56–64. [Google Scholar] [CrossRef]
  67. Lecompte, F.; Pagès, L.; Ozier-Lafontaine, H. Patterns of Variability in the Diameter of Lateral Roots in the Banana Root System. New Phytol. 2005, 167, 841–850. [Google Scholar] [CrossRef]
  68. Steudle, E.; Frensch, J. Water Transport in Plants: Role of the Apoplast. Plant Soil 1996, 187, 67–79. [Google Scholar] [CrossRef]
  69. Barrowclough, D.E.; Peterson, C.A.; Steudle, E. Radial Hydraulic Conductivity along Developing Onion Roots. J. Exp. Bot. 2000, 51, 547–557. [Google Scholar] [PubMed] [Green Version]
  70. Watt, M.; Magee, L.J.; McCully, M.E. Types, Structure and Potential for Axial Water Flow in the Deepest Roots of Field-Grown Cereals. New Phytol. 2008, 178, 135–146. [Google Scholar] [PubMed]
  71. Draye, X.; Kim, Y.; Lobet, G.; Javaux, M. Model-Assisted Integration of Physiological and Environmental Constraints Affecting the Dynamic and Spatial Patterns of Root Water Uptake from Soils. J. Exp. Bot. 2010, 61, 2145–2155. [Google Scholar] [CrossRef] [Green Version]
  72. Soulis, K.X.; Elmaloglou, S. Optimum Soil Water Content Sensors Placement in Drip Irrigation Scheduling Systems: Concept of Time Stable Representative Positions. J. Irrig. Drain. Eng. 2016, 142, 04016054. [Google Scholar] [CrossRef]
  73. Da Silva, A.J.P.; Coelho, E.F.; Filho, M.A.C.; De Souza, J.L. Water Extraction and Implications on Soil Moisture Sensor Placement in the Root Zone of Banana. Sci. Agric. 2018, 75, 95–101. [Google Scholar] [CrossRef] [Green Version]
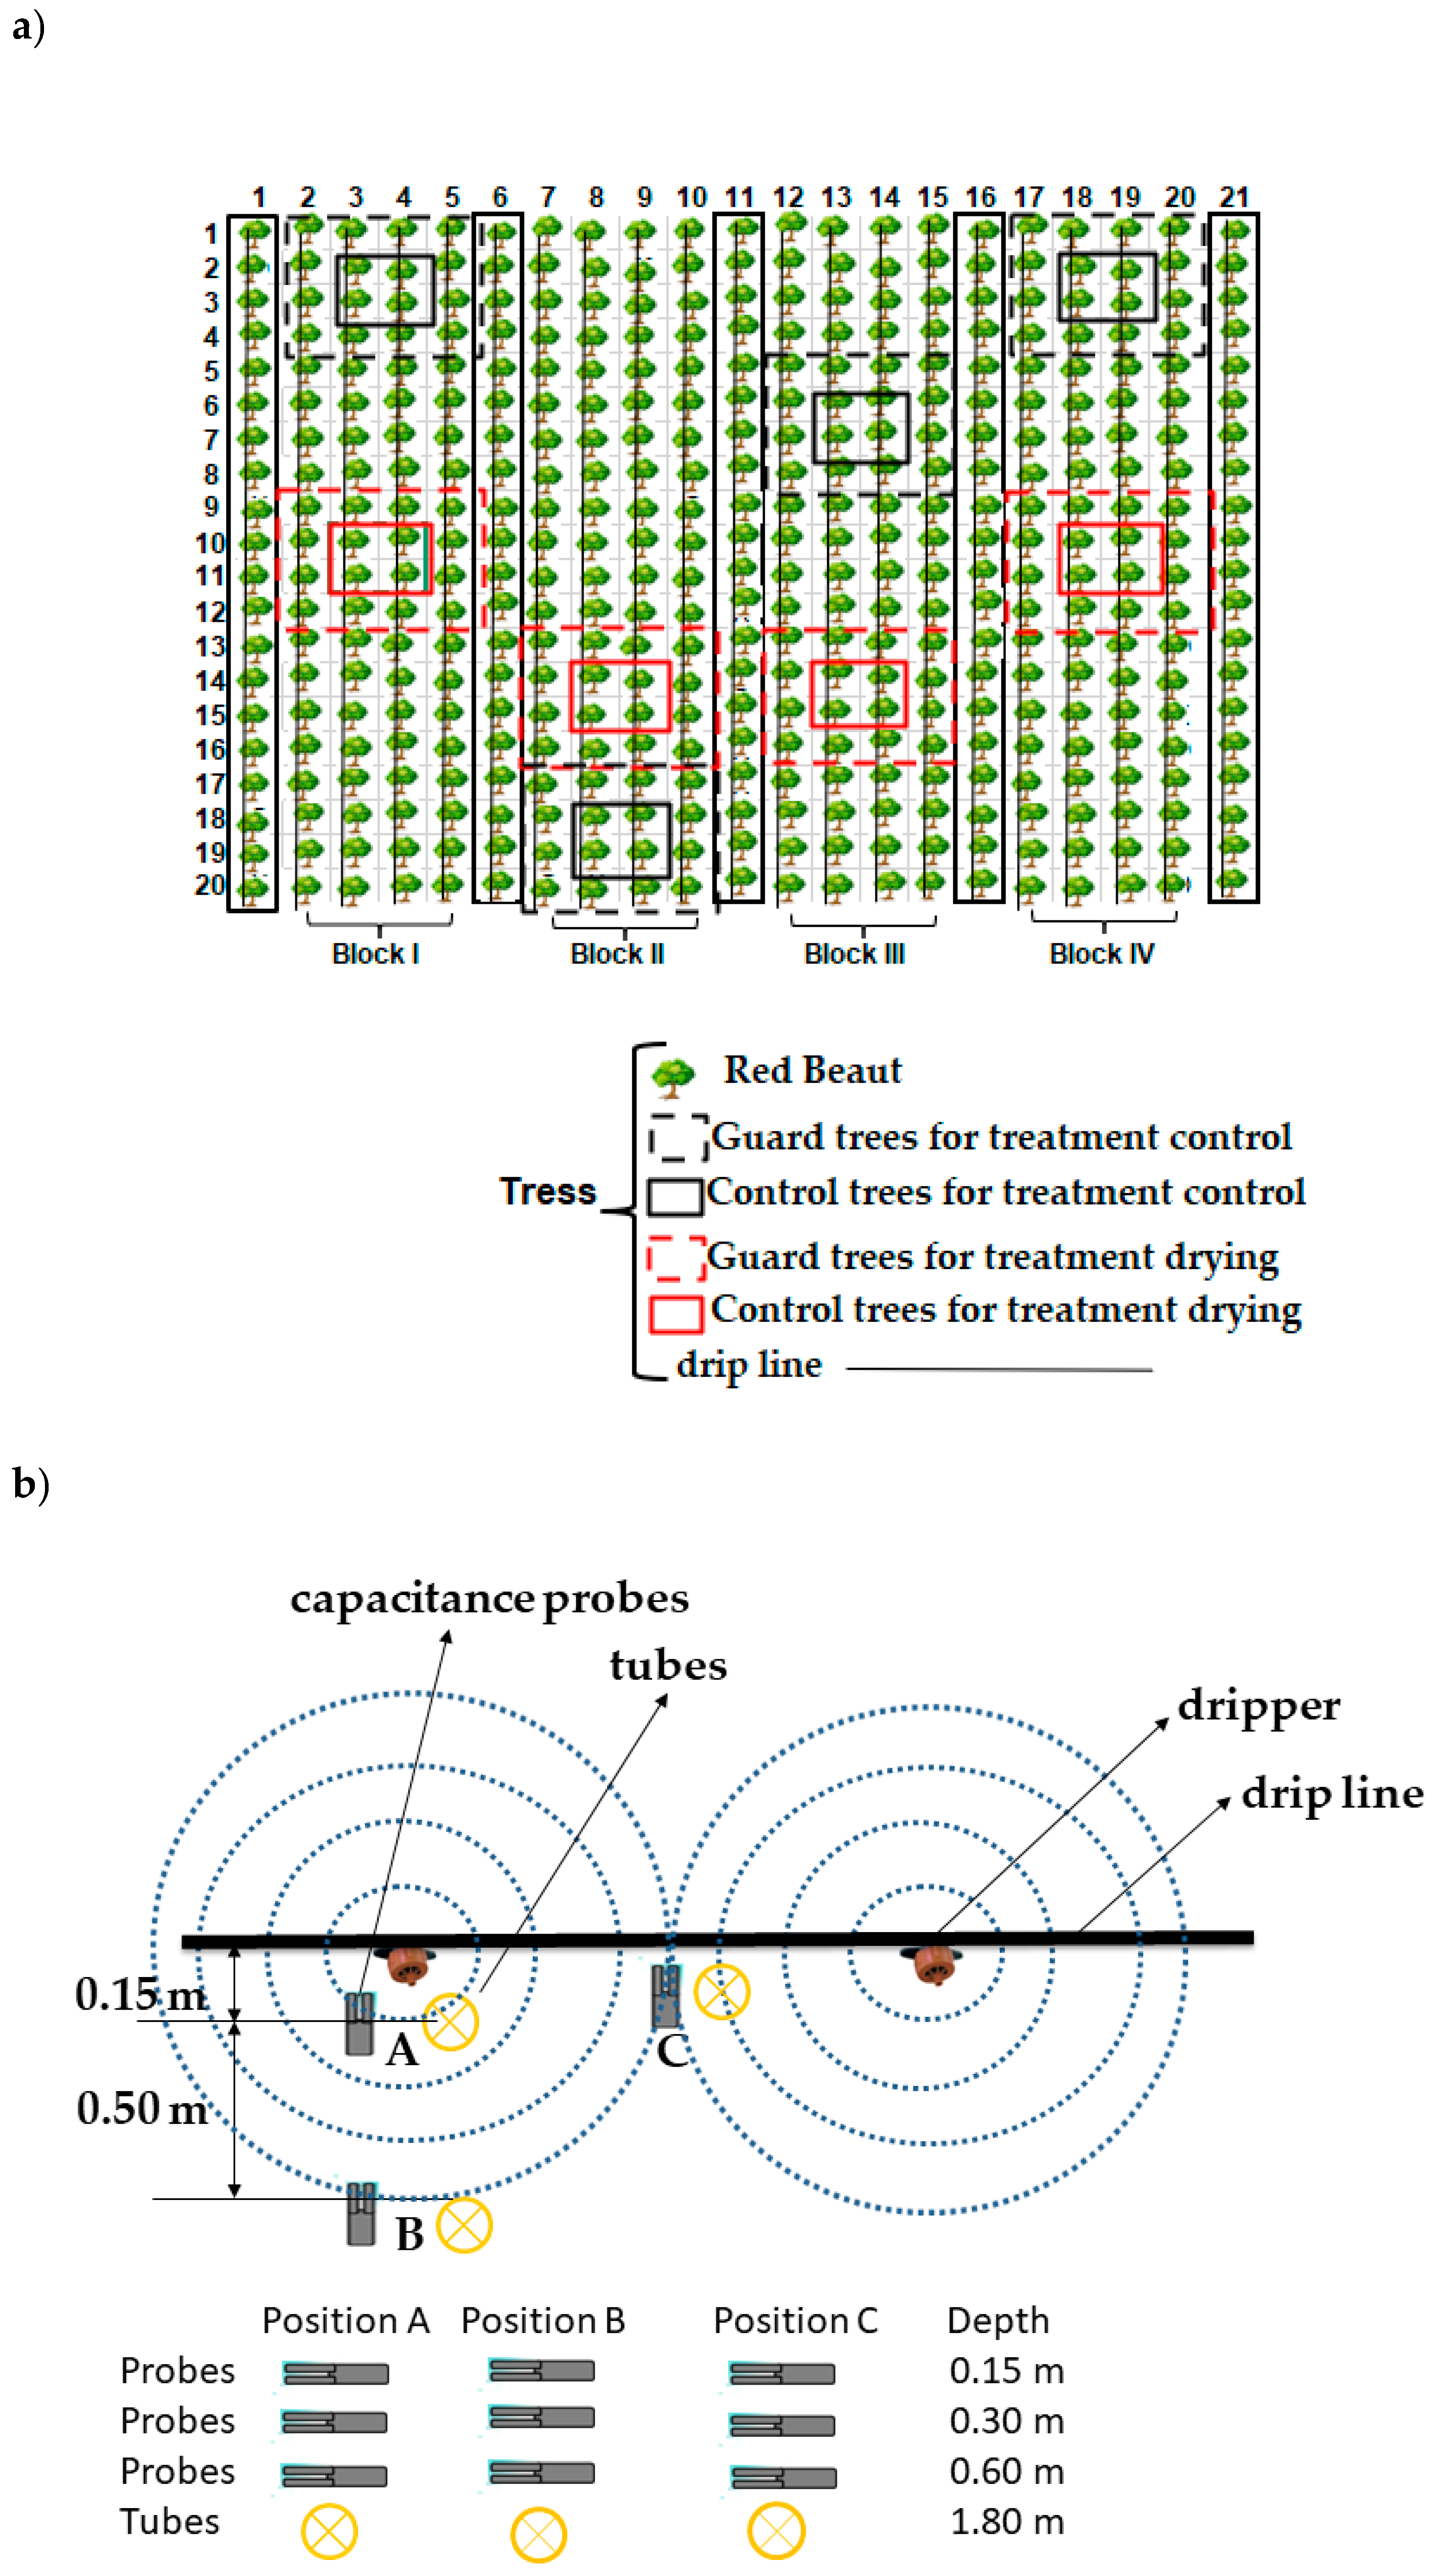
Figure 1. (a) Experimental design of the plot and (b) Localization of the neutron probe tubes and capacitance probes in the different positions and depths.
Agronomy 10 01757 g001
Figure 2. Seasonal patterns of vapor pressure deficit (VPD) and midday stem water potential (Ψstem) corresponding to the control (CON) and drying (D) treatments in “Red Beaut” plum trees during 2015 (a), 2016 (b), and 2017 (c). Each value is the mean of 32 measurements ± standard error. An asterisk (*) indicates statistically significant differences between treatments at p < 0.05. The vertical black dashed line indicates the start and end of the drying period. DOY is day of the year. The vertical violet dashed line indicates when harvest took place. The horizontal violet dashed line indicates the threshold established for each crop phase recommended by Samperio et al. [24]. Pre is the period from fruit set to harvest of the current year. Post is the period from harvest to the onset of leaf fall of the current year.
Agronomy 10 01757 g002
Figure 3. Seasonal pattern of: (a) net photosynthetic rate (Fn); (b) stomatal conductance (Gs) in 2015; (c) net photosynthetic rate (Fn) and (d) stomatal conductance (Gs) in 2017. Each value is the mean of 32 measurements ± standard error. An asterisk (*) indicates statistically significant differences between treatments at p < 0.05. The vertical black dashed line marks the start and end of the drying period. DOY is day of the year.
Agronomy 10 01757 g003
Figure 4. Evolution of relative transpiration (RT) for the 3 years of the study: (a) 2015, (b) 2016 and (c) 2017. Values correspond to the average of four trees. The vertical black dashed line marks the start and end of the drying period. DOY is day of the year.
Agronomy 10 01757 g004
Figure 5. Seasonal evolution of relative soil water content (RSWC) measured by FDR probes located in different positions in the three years of study (ac) 2015, (df) 2016 and (gi) 2017. PA, PB and PC are positions A, B and C, respectively, where the capacitance probes were installed. The depth in meters to which the probe was installed is shown in brackets. Values are averages of three FDR sensors. The black vertical line corresponds to the beginning and end of each drying cycle. DOY, day of the year.
Agronomy 10 01757 g005
Figure 6. Temporal trends of soil moisture during the drying cycles in 2017 measured by FDR probes located in different positions. The black vertical line corresponds to the beginning and end of each drying cycle. The black horizontal lines correspond to the limits below which the RSWC value should not fall. DOY is day of the year; Ψstem is stem water potential; Fn is photosynthetic rate; Gs is stomatal conductance; Ψsa is the Ψstem recommended by Samperio et al. [24]. The arrows mark the soil moisture value when significant differences with the indicated physiological parameter are found or when the Ψsa is reached. PA, PB and PC are positions A, B and C, respectively, where the capacitance probes were installed. The depth in meters to which the probe was installed is shown in brackets. Values are averages of three FDR sensors.
Agronomy 10 01757 g006
Figure 7. Temporal trends of soil moisture during the drying cycle in 2015 measured by FDR probes located in different positions. The black vertical lines correspond to the beginning and end of the drying cycle. The black horizontal lines correspond to the limits below which the RSWC value should not fall. DOY is day of the year; Ψstem is the stem water potential; Fn is the photosynthetic rate; Gs is stomatal conductance; Ψsa is the Ψstem recommended by Samperio et al. [24]. The arrows mark the soil moisture value when significant differences with the indicated physiological parameter are found or when the Ψsa is reached. PC is position C where the capacitance probes were installed. The depth in meters to which the probe was installed is shown in brackets. Values are averages of three FDR sensors.
Agronomy 10 01757 g007
Table 1. Dates of the irrigation events.
201520162017
ISD 114 April 2015 (104)19 April 2016 (109)05 April 2017 (95)
IED 215 October 2015 (288)20 October 2016 (293)08 November 2017 (312)
Drying-Pre 29 April 2016–14 June 201624 April 2017–31 May 2017
(119–165)(114–151)
First Drying-Post02 July 2015–27 July 201515 July 2016–27 July 201606 July 2017–01 August 2017
(183–208)(196–208)(187–213)
Second Drying-Post 12 August 2016–10 September 2016
(224–253)
1 Date when the irrigation season starts; 2 Date when the irrigation season ends; in brackets the day of the year.
Table 2. Mean temperature (Tmean), mean relative humidity (RHmean), accumulated rainfall, accumulated evapotranspiration (ETo) and irrigation applied in pre- and post-harvest periods and annually.
YearPhasesTmeanRHmeanETo-PMIrrigation (mm)Rainfall (mm)
(°C)(%)(mm)CONDLF-S 4S-LF 3
Pre 119.656276168172158272
2015Post 223.157720534489
Annual16.5681310702661370
Pre 117.868186334438291
2016Post 223.754730570327
Annual16.4711247603331519.5
Pre 119.75634624566214108
2017Post 223.152805569452
Annual17.0 641383814519284
RH is relative humidity; ETo-PM is reference evapotranspiration calculated through the Penman-Monteith equation; CON is control treatment; D is drying treatment; 1 from the beginning of the irrigation season to harvest of the current year; 2 from harvest to the end of irrigation season of the current year. LF = leaf fall; S = sprouting; 3 period from the previous year’s leaf fall to sprouting; 4 period from sprouting of current year to leaf fall.
Table 3. Mean values of each parameter in the CON and D treatments, signal intensity, coefficient of variation and sensitivity determined according to the traditional (S) and corrected (S*) methods in 2015.
Parameters 2015 A
(182DOY)
SPost1
(208DOY)
RPost1
(288DOY)
Average
SI1.381.531.191.37
ΨstemCV 0.180.190.150.17
S 7.809.998.228.67
S*4.104.635.914.88
SI0.830.960.910.90
SFCV 0.310.290.280.29
S 2.673.343.243.08
S*3.863.613.893.79
SI0.951.241.361.18
FnCV 0.250.290.390.31
S 3.774.823.44.00
S*15.6717.996.6413.43
SI0.911.671.281.29
GsCV 0.360.540.630.53
S 2.503.312.722.84
S*1.100.630.620.78
SI1.041.021.001.02
FipardCV 1.211.251.091.18
S 0.860.810.940.87
S*0.960.980.990.98
A is the period previous to irrigation cut-off; SPost1 is the first period without irrigation in postharvest; RPost1 is the first recovery period in postharvest; Ψstem is midday stem water potential; SF is sap flow; Fn is net photosynthesis; Gs is stomatal conductance; Fipard is the fraction of daily photosynthetically active radiation canopy interception; DOY is day of the year.
Table 4. Mean values of each parameter in the CON and D treatments, signal intensity, coefficient of variation and sensitivity determined according to the traditional (S) and corrected (S*) method in 2016.
Parameters 2016 A
(118)
SPre (165)RPre (195)SPost1 (208)RPost1
(210)
SPost2 (253)RPost2
(293)
Average
SI0.831.070.991.341.031.381.091.10
ΨstemCV 0.250.230.190.170.460.160.190.24
S 3.375.725.047.962.9114.719.036.96
S*4.894.655.254.472.358.087.65.33
SI0.820.740.750.640.870.860.80.78
SFCV0.500.440.60.620.550.470.50.53
S1.641.691.241.031.591.881.611.53
S*1.283.292.232.492.152.562.532.36
SI0.981.061.041.031.071,000.941.02
FipardCV0.880.870.850.870.890.961.250.94
S1.111.211.221.191.191.050.791.11
S*1.020.950.960.970.940.991.070.99
A is the period previous to irrigation cut-off; SPre is the period without irrigation in preharvest; RPre is the recovery period in preharvest; SPost1 is the first period previous to irrigation cut-off in postharvest; RPost1 is the first recovery period in postharvest; SPost2 is the second period previous to irrigation cut-off in postharvest; RPost2 is the second recovery in postharvest; day of the year in brackets. Ψstem is midday stem water potential; SF is sap flow; Fn is net photosynthesis; Gs is stomatal conductance; Fipard is the fraction of daily photosynthetically active radiation canopy interception.
Table 5. Mean values of each parameter in the CON and D treatments, signal intensity, coefficient of variation and sensitivity determined according to the traditional (S) and corrected (S*) method in 2017.
Parameters 2017 A
(113)
SPre
(151)
RPre
(186)
SPost1
(213)
RPost1
(312)
Average
SI0.981.241.121.681.131.23
ΨstemCV 0.230.170.160.180.160.18
S 4.617.697.689.237.447.33
S*4.695.186.243.785.625.10
SI0.650.790.761.070.870.828
SFCV0.470.350.370.390.360.388
S1.452.292.12.742.492.21
S*3.513.663.542.53.233.29
SI0.961.160.951.221.181.09
FnCV0.410.320.260.230.320.31
S2.343.953.765.243.743.81
S*2.542.934.133.592.753.19
SI0.941.51.011.71.531.34
GsCV0.460.460.760.630.570.58
S2.063.341.452.882.692.48
S*2.291.81.421.491.351.67
SI 0.990.970.970.910.96
FipardCV 1.070.90.80.830.90
S 0.921.081.211.11.08
S* 1.011.041.031.091.04
A is the period previous to irrigation cut-off; SPre is the period without irrigation in preharvest; RPre is the recovery period in preharvest; SPost1 is the first period previous to irrigation cut-off in postharvest; RPost1 is the first recovery period in postharvest; day of the year in brackets. Ψstem is midday stem water potential; SF is sap flow; Fn is net photosynthesis; Gs is stomatal conductance; Fipard is the fraction of daily photosynthetically active radiation canopy interception.
Table 6. Period of time that elapses since each parameter detects water stress in each drying cycle and time that the D treatment takes to recover.
ParametersYearT_SPre
(days)
T_RPre
(days)
T_SPost1
(days)
T_RPost1
(days)
T_SPost2
(days)
T_RPost2
(days)
2015 421
Ψstem201658114514
2017813483
Fn2015 13 21
2017142815
Gs2015 8 21
2017145815
T_SPre, T_SPost1 and T_SPost2 are the number of days that passed between the suppression of irrigation in the first, second and third drying cycles, respectively, and the detection of water stress; T_RPre, T_RPost1 and T_RPost2 are the number of days between the end of the first, second and third drying cycles, respectively, and the recovery of treatment D to the values of treatment CON.
Publisher’s Note: MDPI stays neutral with regard to jurisdictional claims in published maps and institutional affiliations.