Article

Modelling and Prediction of Organic Carbon Dynamics in Arable Soils Based on a 62-Year Field Experiment in the Voronezh Region, European Russia

1
Faculty of Soil Science, Lomonosov Moscow State University, 119991 Moscow, Russia
2
Geographical Network Department, All-Russian Research Institute of Agrochemistry, 127550 Moscow, Russia
3
All-Russian Research Institute for Sugar and Sugar Beet, 396030 Ramon, Voronezh Region, Russia
*
Author to whom correspondence should be addressed.
Agronomy 2020, 10(10), 1607; https://doi.org/10.3390/agronomy10101607
Submission received: 10 September 2020 / Revised: 17 October 2020 / Accepted: 19 October 2020 / Published: 20 October 2020
(This article belongs to the Special Issue Effects of Agricultural Management on Soil Properties and Health)

Abstract

:
Organic carbon (OC) accumulation in soil mitigates greenhouse gases emission and improves soil health. We aimed to quantify the dynamics of OC stock in soils and to justify technologies that allow annual increasing OC stock in the arable soil layer by 4‰. We based the study on a field experiment established in 1936 in the 9-field crop rotation with a fallow on Chernozem in European Russia. The RothC version 26.3 was used for the reproducing and forecasting OC dynamics. In all fertilizer applications at FYM background, there was a decrease in the OC stock with preferable loss of active OC, except the period 1964–1971 with 2–5‰ annual OC increase. The model estimated the annual C input necessary to maintain OC stock as 1900 kg·ha−1. For increasing OC stocks by 4‰ per year, one should raise input to 2400 kg·ha−1. The simulation was made for 2016–2090 using climate scenarios RCP4.5 and RCP8.5. Crop rotation without fallowing provided an initial increase of 3‰ and 6‰ of stocks in the RCP8.5 and RCP4.5 scenarios accordingly, followed by a loss in accumulated OC. Simulation demonstrates difficulties to increase OC concentration in Chernozems under intensive farming and potential capacity to rise OC stock through yield management.

1. Introduction

Organic carbon (OC) dynamics in the soil is given special attention during the last few decades [1]. On the one hand, the relevance of these studies is related to the significant role of soil carbon in the global carbon cycle, which includes the release of greenhouse gases into the atmosphere, which is believed to have an impact on recent climate changes on Earth [2]. On the other hand, the importance of soil organic matter (SOM) for the soil health, its fertility, maintaining the species diversity of soil organisms and providing other ecosystem services related to the soil is being understood at a new level [3]. In natural ecosystems, OC cycling and storage is regulated by multiple factors [4], which are susceptible to human impact and global climatic change [5].
In agricultural systems, soil health is under the intense pressure of human activities, and thus the maintenance of soil health should be specially addressed [6]. Its decline may be associated with the degradation of the physical and chemical properties of soils, reduction in biodiversity and biological activity [7]. OC stock is one of the main pre-conditions and indicators of soils health, and its preservation is an indispensable condition for the sustainability of agroecosystems.
At the Paris climate conference (COP 21) in 2015, a voluntary action programme was proposed as part of the Agenda, “Initiative 4 per 1000: Soils for food security and climate”, which emphasizes the role of soil organic matter in addressing a three-level problem: food safety, the adaptation of food systems to climate change, and mitigation of anthropogenic greenhouse gas emissions [8]. This initiative calls for fixing C in soils through advanced methods of soil treatment: it is believed that an increase in the OC content in cultivated soils by 4‰ per year will compensate for all greenhouse gas emissions associated with agriculture while ensuring soil health [9]. A broader context for the importance of soil OC for mitigating the climatic change was given in the decision on Koronivia Joint Work on Agriculture at the UN climate conference (COP23) in 2017. However, practical mechanisms for responding to these initiatives should be developed on the regional and local level [3].
There are several limitations to the increase in OC in agricultural soils [10]. One of these limitations is the reverse dependence of soil potential to accumulate OC on the current SOM concentration. Generally, soils with low OC concentration may easily increase C stock after application of organic fertilizers and conservation agricultural practices. In contrary, in soils with initially high SOM reserves, it is difficult to increase their OC stock; some of these soils even lose C under intensive cultivation despite the use of manure. Ironically, fertile soils with high SOM concentration turn to be the most difficult with respect to the increase of OC stock by 4% per year. In Russia, Chernozems are the most productive soils that stretch from the western borders of the country to Eastern Siberia in the steppe and forested steppe zones; they contain up to 6% OC in the topsoil [11,12]. Our previous studies based on the long-term field agrochemical experiments in Russia showed that just to maintain OC in Chernozem in steppe zone inputs of 2.6–2.9 Mg C ha−1 yr−1 were required [13]. The loss of SOM in soils leads to the reduction in soil health and consequently, to the depletion of soil-related ecosystem services [14].
This work aimed to quantify the long-term dynamics of OC stocks in arable soils of the region using data on production processes and to justify optimal agricultural technologies that allow maintaining and increasing organic carbon stock in the arable soil layer by 4% per year, providing both stabilization of productivity and mechanisms for reproduction of soil health.

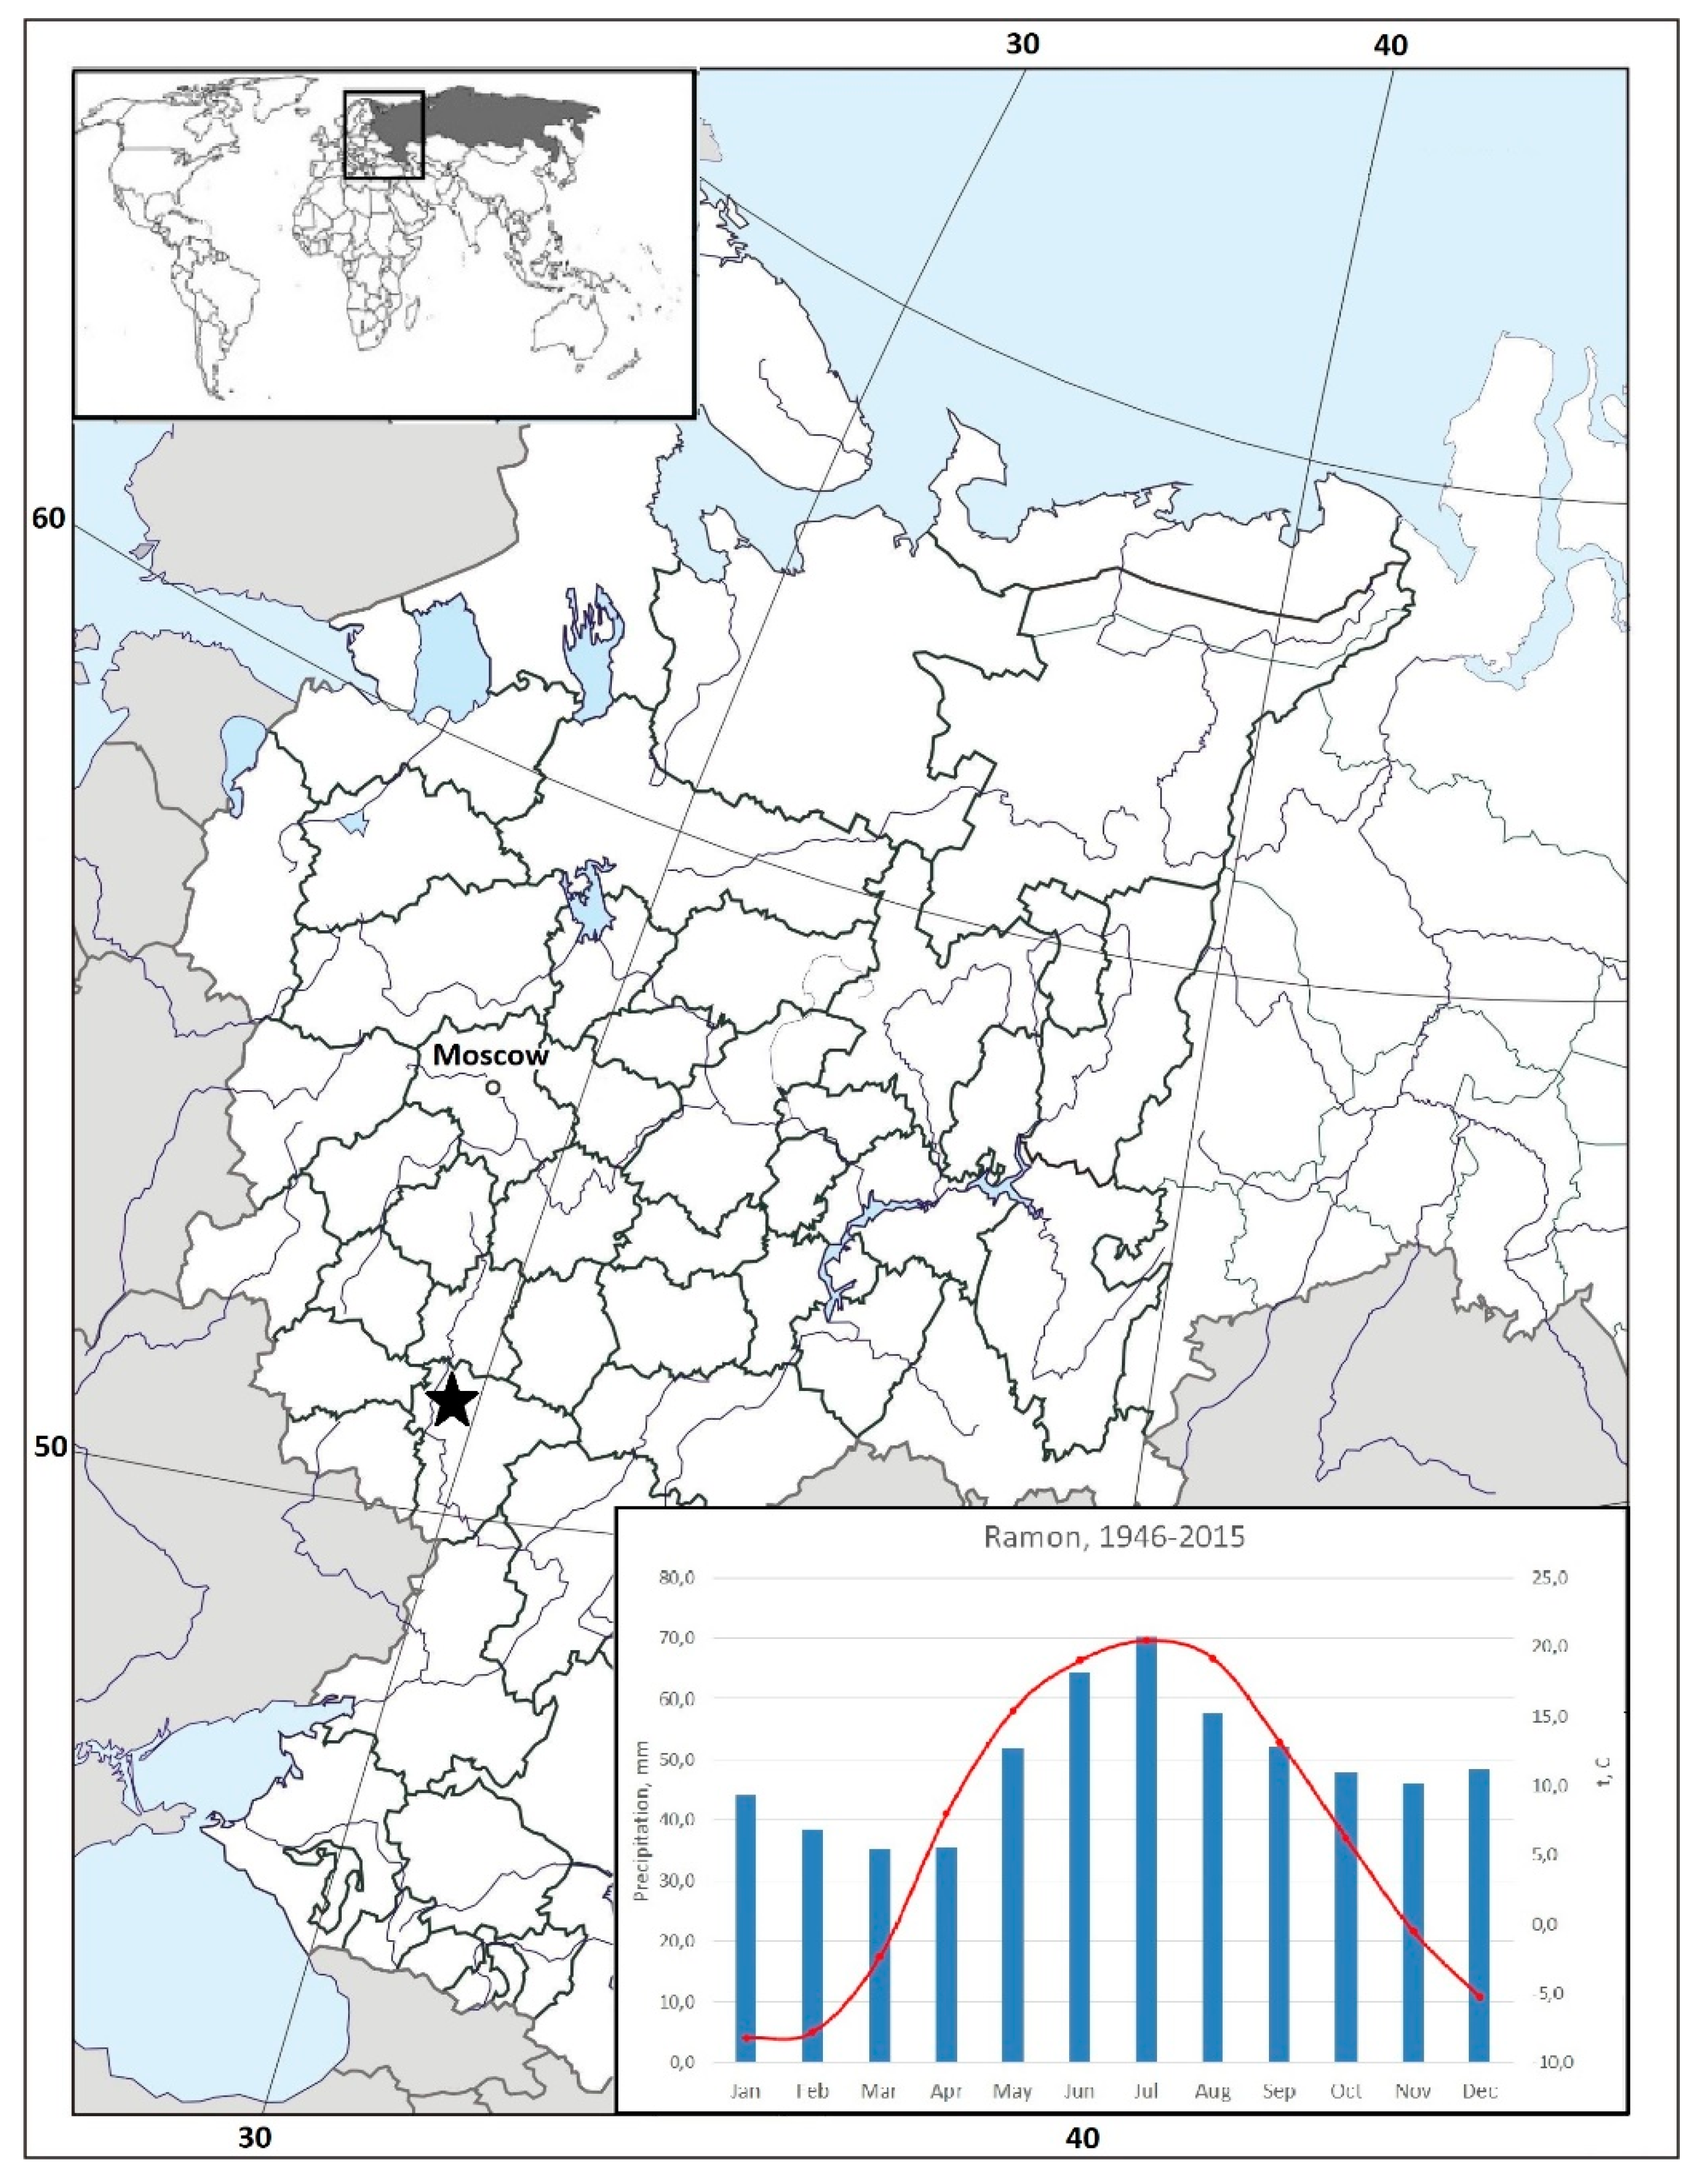
2. Materials and Methods

The study was based on a long-term field experiment “the system of fertilizers for sugar beet and other crops in crop rotation with beet” launched in 1935 at the experimental field (51°55′23″ N 39°15′45″ E) of the All-Russian Research Institute of Sugar and Sugar Beet named after A. L. Mazlumov (VNIISS), located in a typical forest-steppe in the North of the Voronezh region on leached chernozem (Luvic Chernozem in WRB system). The texture of the plough layer (0–20 cm) was silty clay loam: 333 g·kg−1 clay, 586 g·kg−1 silt, and 81 g·kg−1 sand, as determined using a pipette method. The location of the site and its climatic characteristics are shown in Figure 1; in the Köppen system, the climate is Dfb (Snow climate, fully humid with warm summer). The 9-field crop rotation included black fallow—winter wheat––sugar beet––spring barley with clover––clover––winter wheat––sugar beet––peas––oats and was studied at nine fields. Carbon input under fallow was regarded as negligible and weed biomass was not taken into consideration for modelling. Under the crops, both mechanical and chemical methods of weed control were applied and during the fallowing period only mechanical cultivations (five treatments to the depth 10–12 cm). This allowed keeping 90% of the area free of weeds. To simulate the dynamics of organic carbon stocks, four treatments of the experiment from field No.4 were used: the first was control without fertilization, hereinafter marked as “Control”; the second with the application 25 t·ha−1 of organic fertilizer (FYM—farmyard manure) and one rate of mineral fertilizers (FYM25 + N45P60K45), hereinafter marked as ‘1 NPK’; the third with a double rate of mineral fertilizers (FYM25 + N90P120K90), hereinafter marked as ‘2 NPK’; and the forth tested the application of a triple rate of mineral fertilizers (FYM25 + N135P180K135) at the same organic fertilizer rate, hereinafter marked as ‘3 NPK’. FYM was applied during fallowing and mineral fertilizers for sugar beet. The effect of fertilization on selected soil properties is shown in Table 1. Nitrates were extracted with 1N K2SO4, P and K—with 0.5N CH3COOH, and hydrolytic (non-exchangeable) acidity—with 1N CH3COONa solution according to the procedure accepted in Russia [15]. The values for available P and K were within “increased” and “high” gradations for P and “very high” gradation for K.
For each treatment, 15 measurements of SOC content were available since 1954. The sampling for C content was done regularly at two field replications at least once per rotation (seven samplings in May 1954, 1963, 1968, 1979, 1981, and 1986)) and more intensively since 2004 (nine samplings in May 2004, 2005, 2006, 2007, and 2008; in May, July and September 2014) to monitor SOC dynamics during vegetation period in the upper (0–20 cm) and lower (20–40 cm) parts of arable soil layers. Carbon content in all samples was measured using Turin wet oxidation method, similar to Walkey and Black technique: soil samples were incubated for one hour over a boiling-water bath with 10 mL of 0.4 N dichromate oxidizing solution (K2Cr2O4:H2SO4 = 1:1), and then titrated with Fe(NH4)2(SO4).6H2O using phenylanthranilic acid as an indicator [16]. The same method for OC determination was used from the beginning of the experiment to its termination, and the determination was done in the same laboratory. Only topsoil (0–20 cm) measurements were used in this study for the model validation.
The Rothamsted model RothC version 26.3 was used for studying the dynamics of organic carbon. This mathematical modelling method allows taking into account the entire range of influencing factors and is widely used in calculating the carbon stock in agricultural and forest automorphic soils [17]. This model requires monthly climate information (average temperature, precipitation, and evaporation), and the main characteristics of soils (initial carbon content in the arable layer, clay content, density) and the input of organic residues into the soil as input data for the period under review. This model allows calculating the stock of organic carbon on a monthly basis and can be used for long-term modelling.
Verification of the model based on the experimental data with a statistical accuracy assessment was carried out based on the Modeval model. Some statistical indicators are presented in Table 2. Based on the data presented in Table 2, we concluded that the calculated data adequately reproduce the real dynamics of OC stocks. OC stocks for all the tested treatments demonstrated a steady decline at the initial period, followed by the period of near-equilibrium and opposite positive trend, followed by a slow decrease since the mid of 80s. RothC describes the measured data better than the mean of the measurements, which can be concluded from the coefficient of determination (CD) values greater than 1. Despite low root mean square error (RMSE) values, the model tended to overestimate OC stocks, which can be partially attributed to high spatial variability of carbon content in plot replications. However, M values did not reveal significant bias. For further explanation on the assessment of statistical accuracy, please consult [17].

3. Results

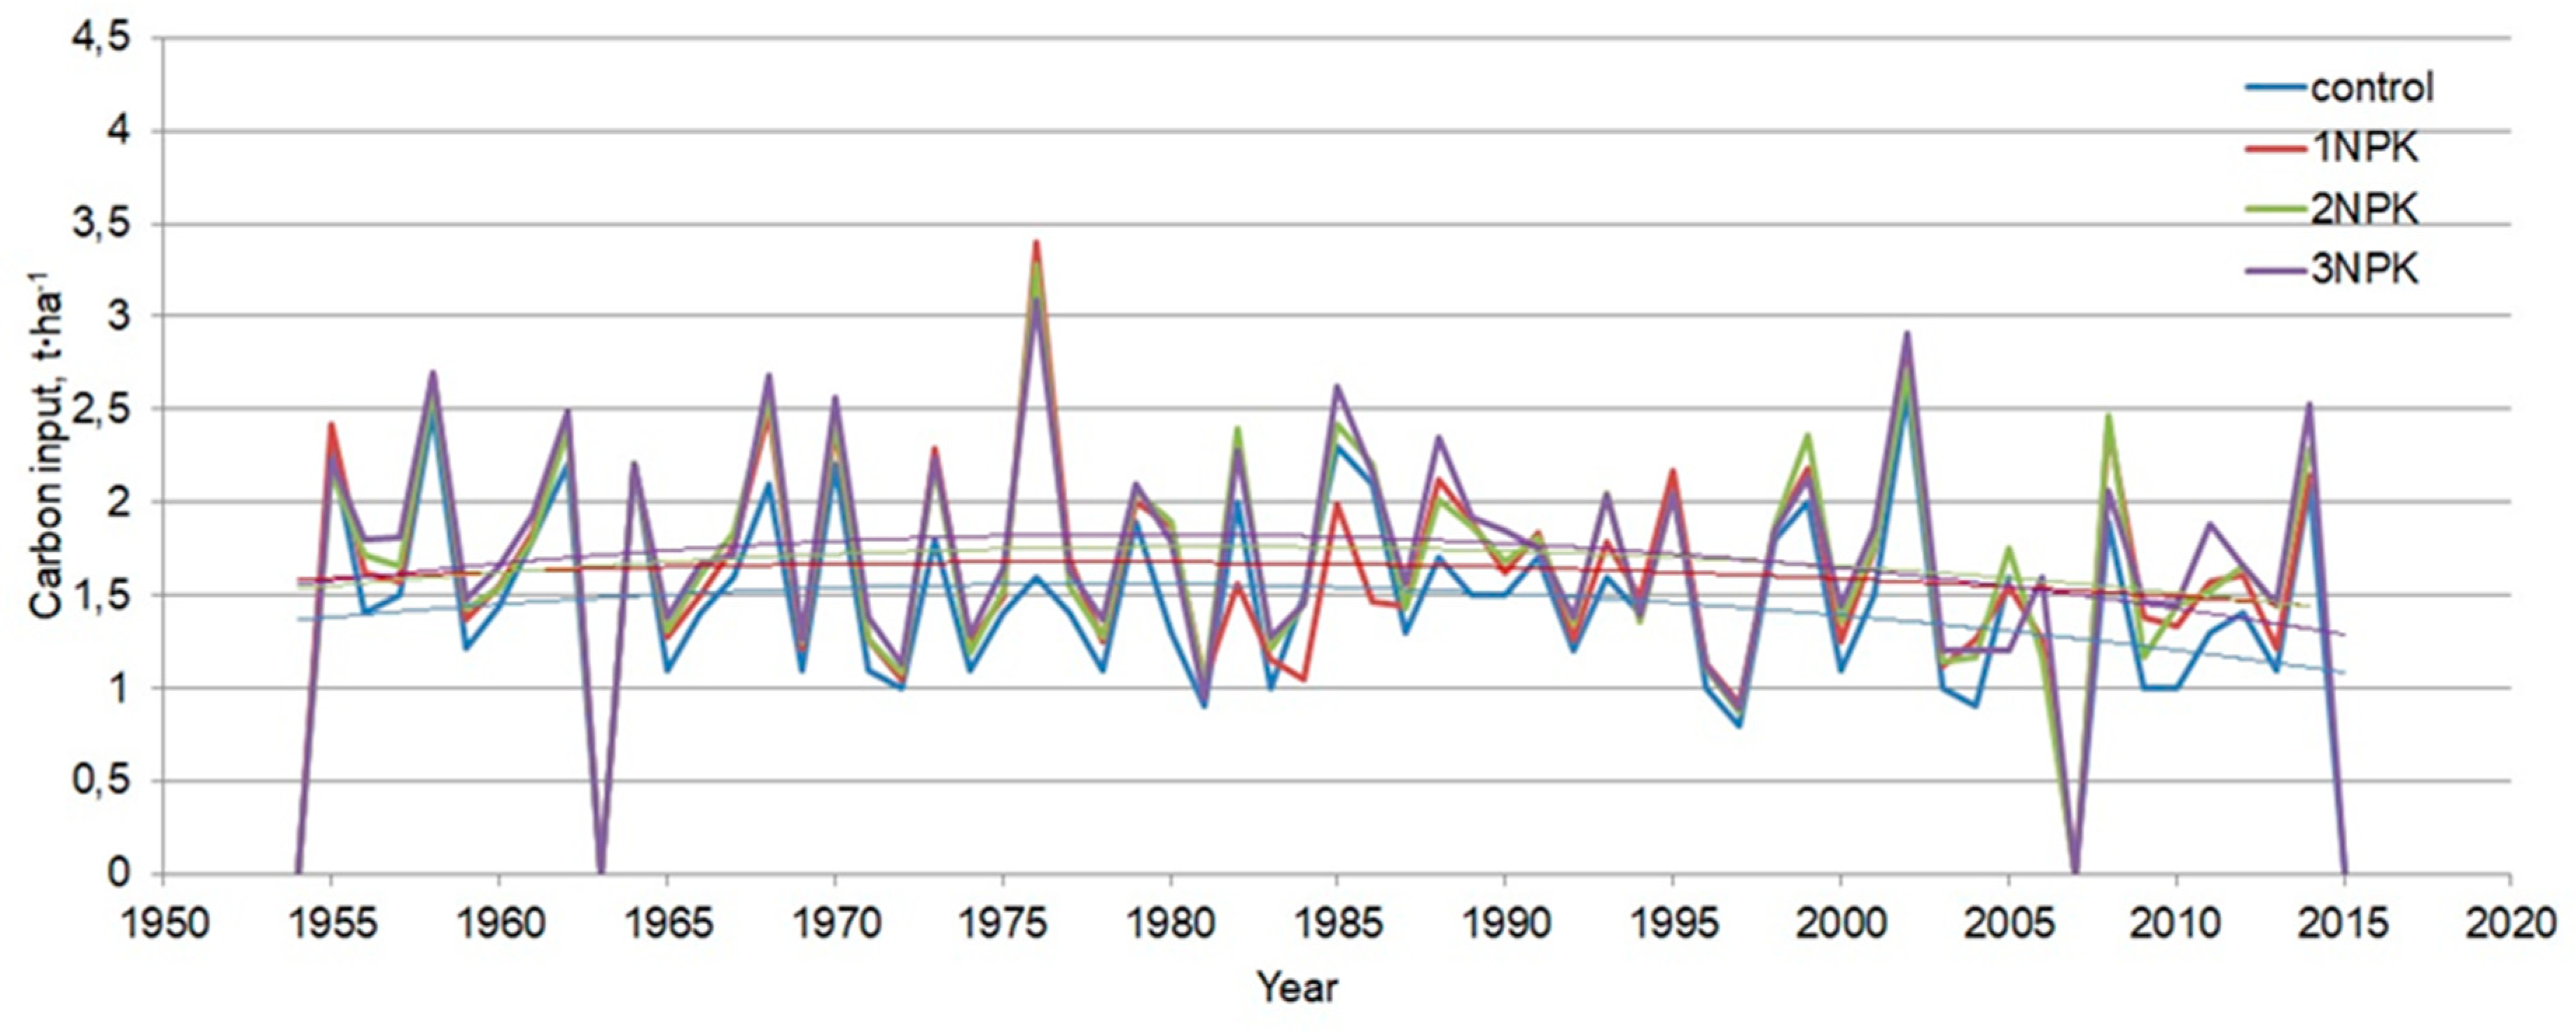
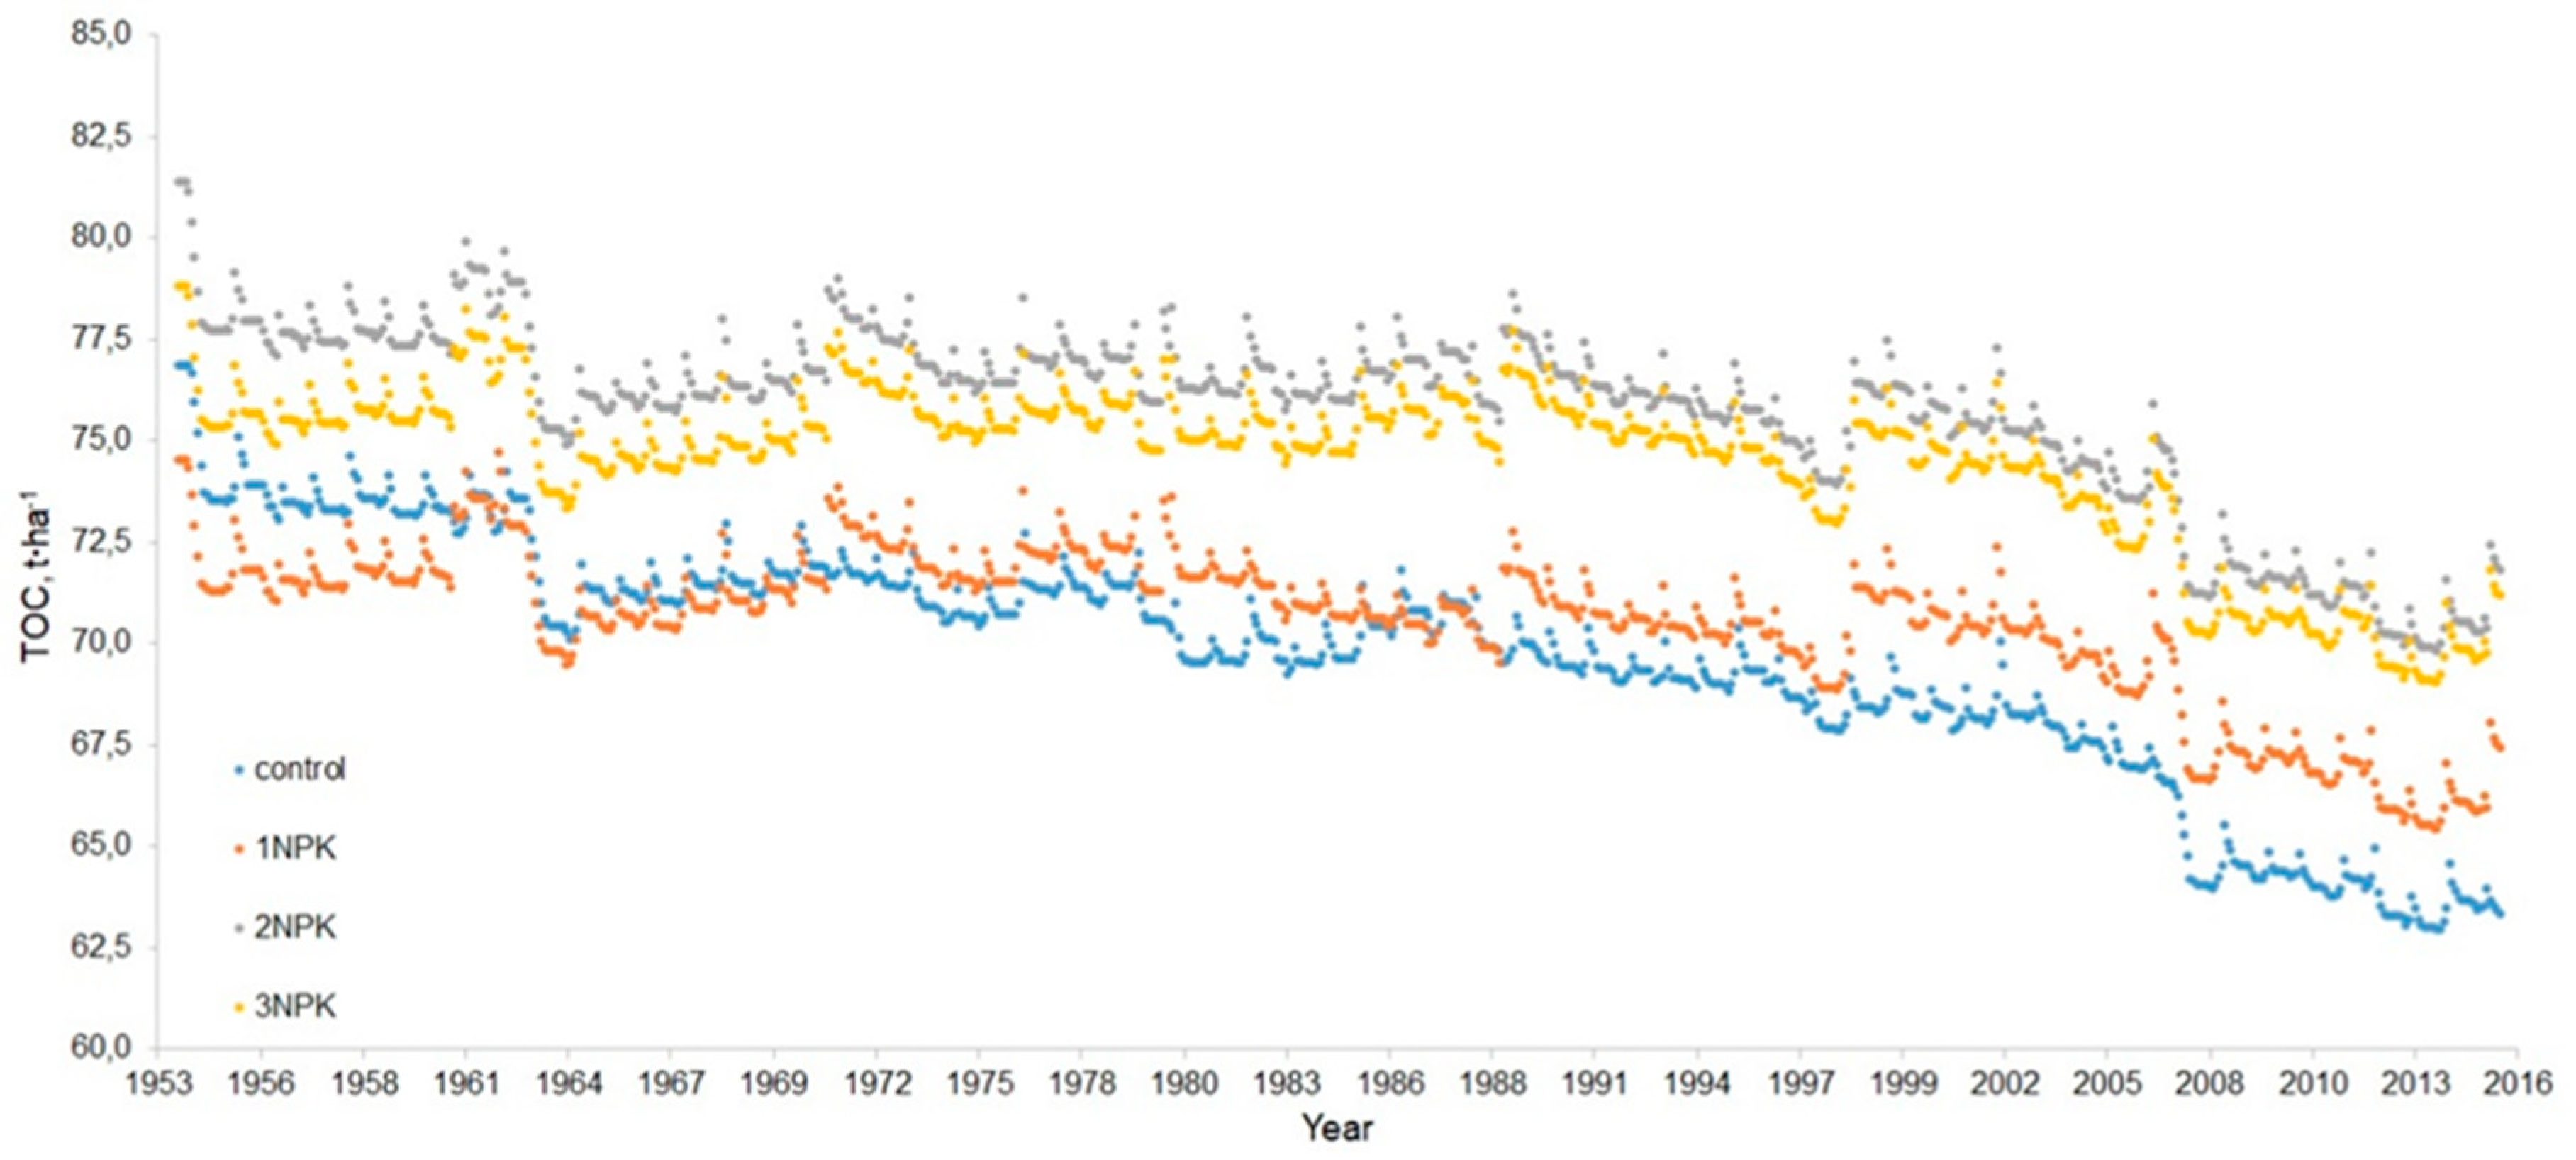
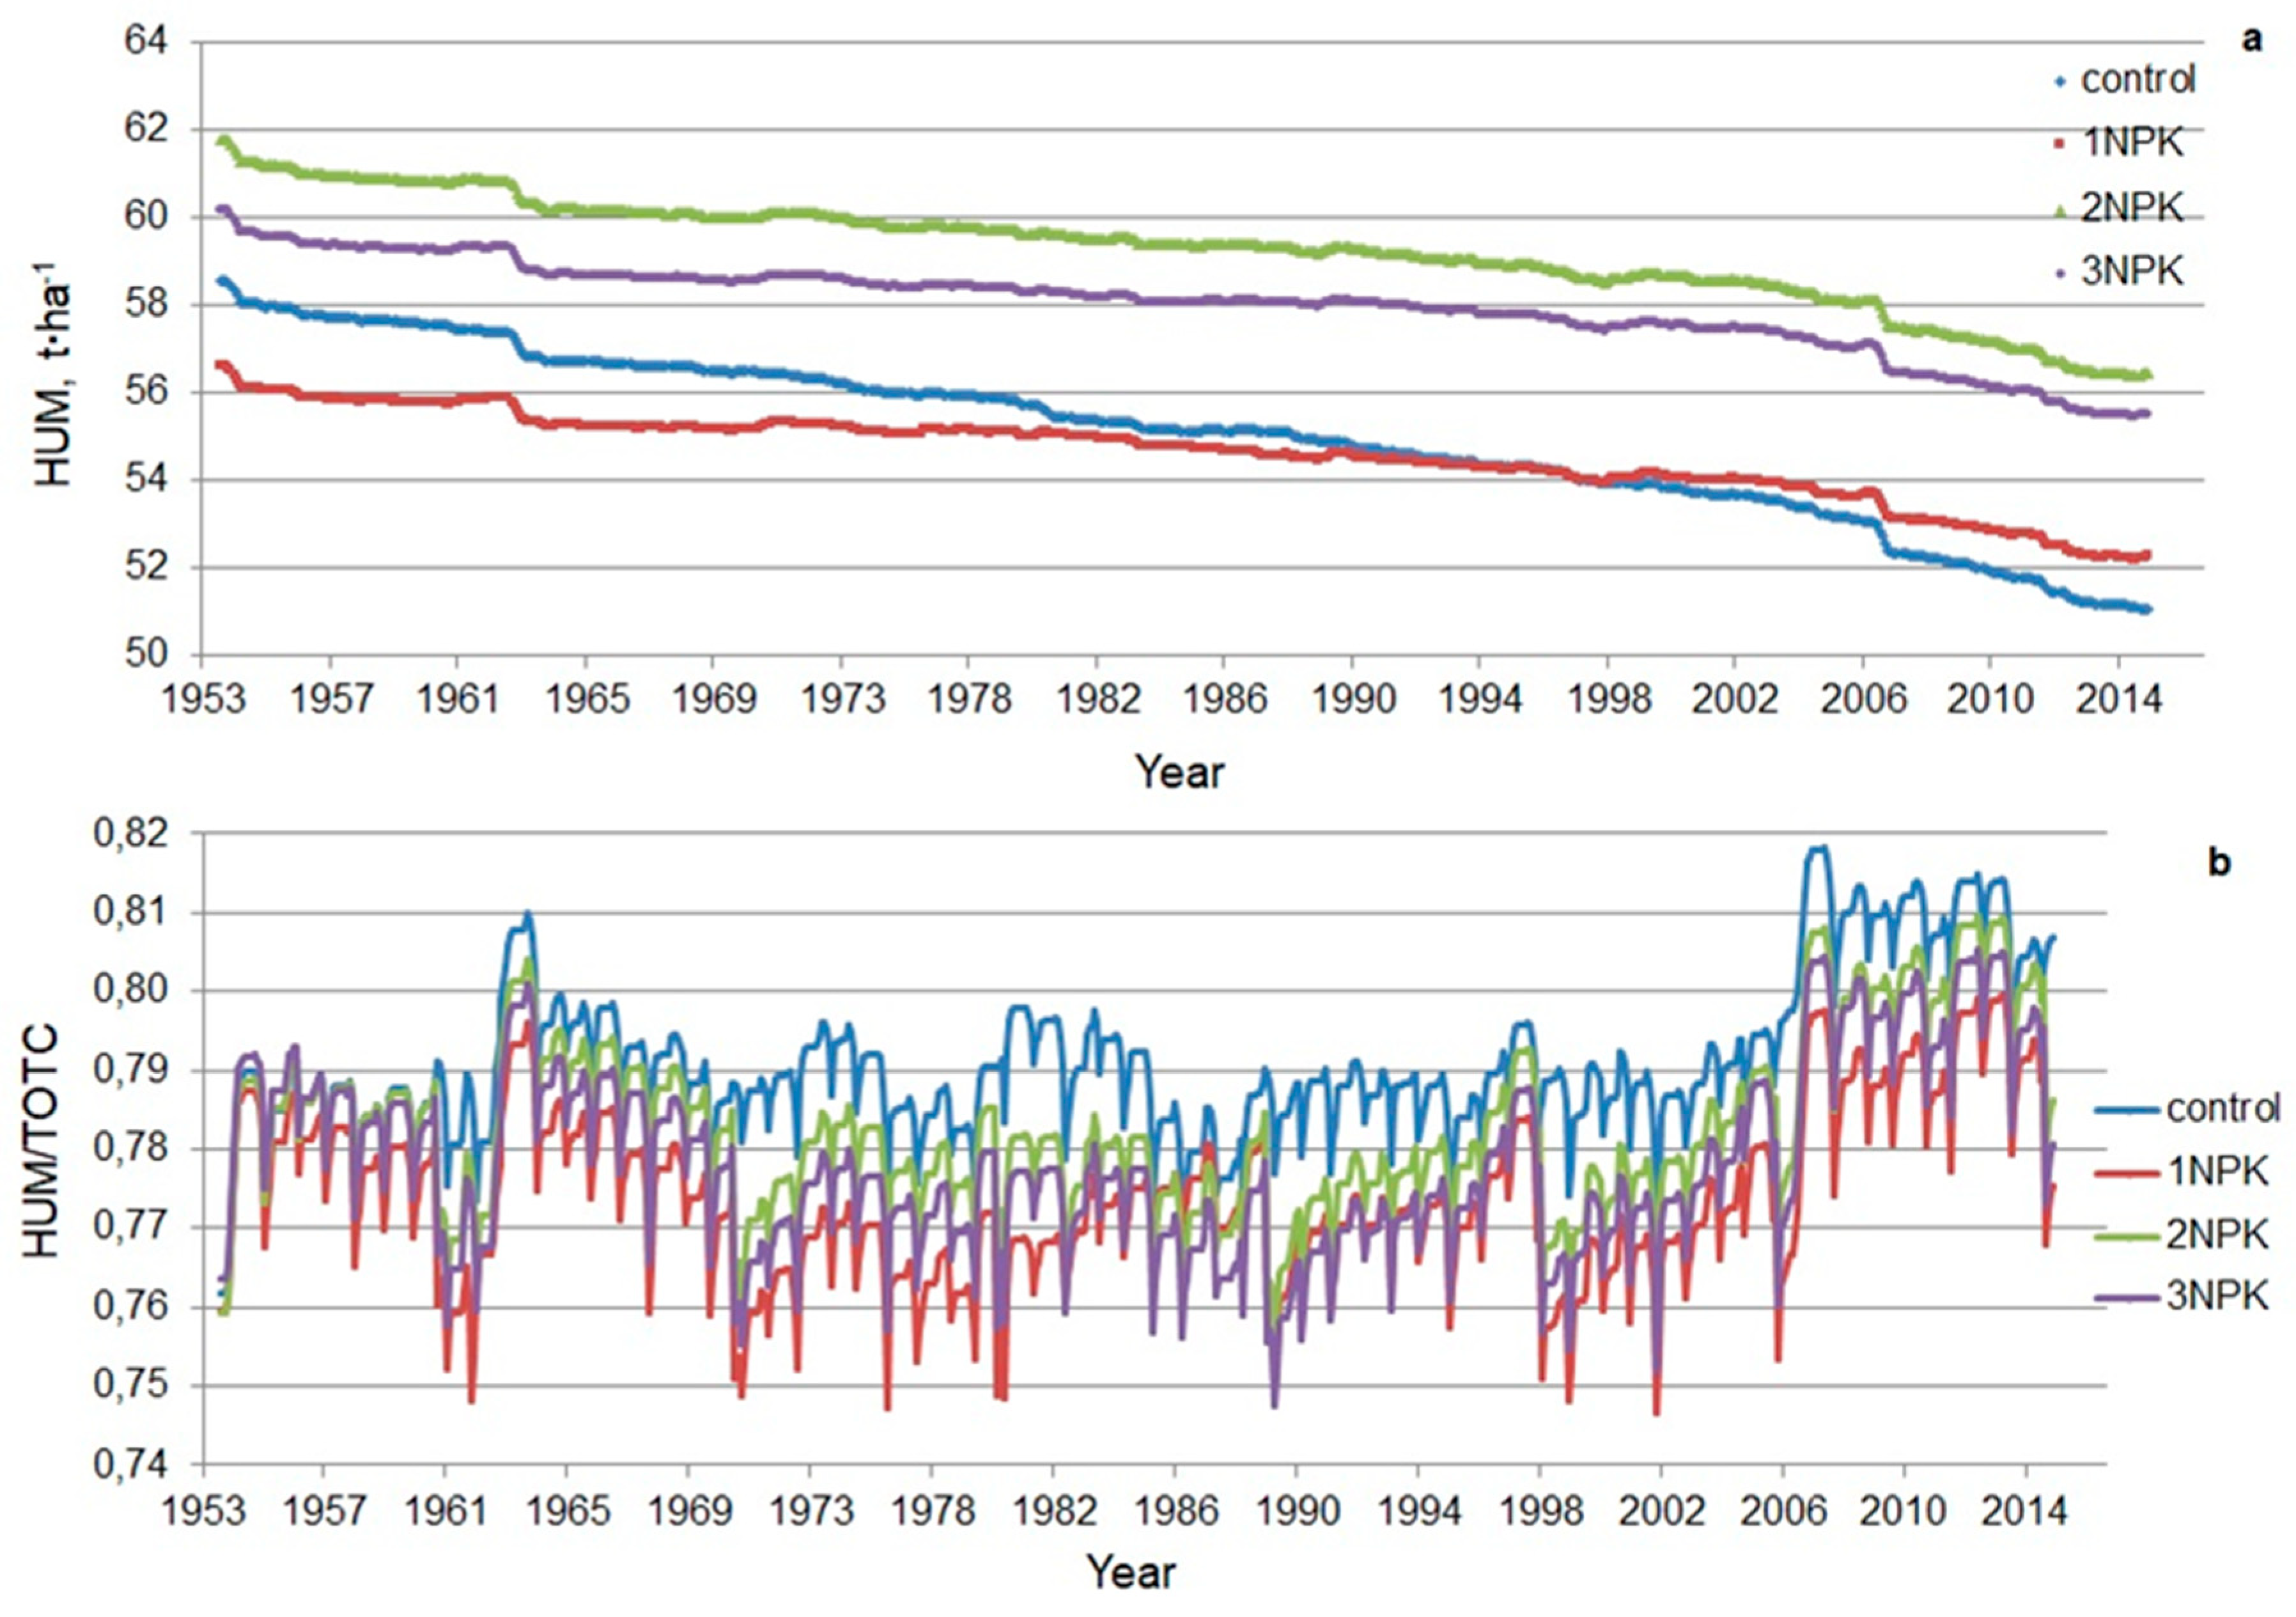
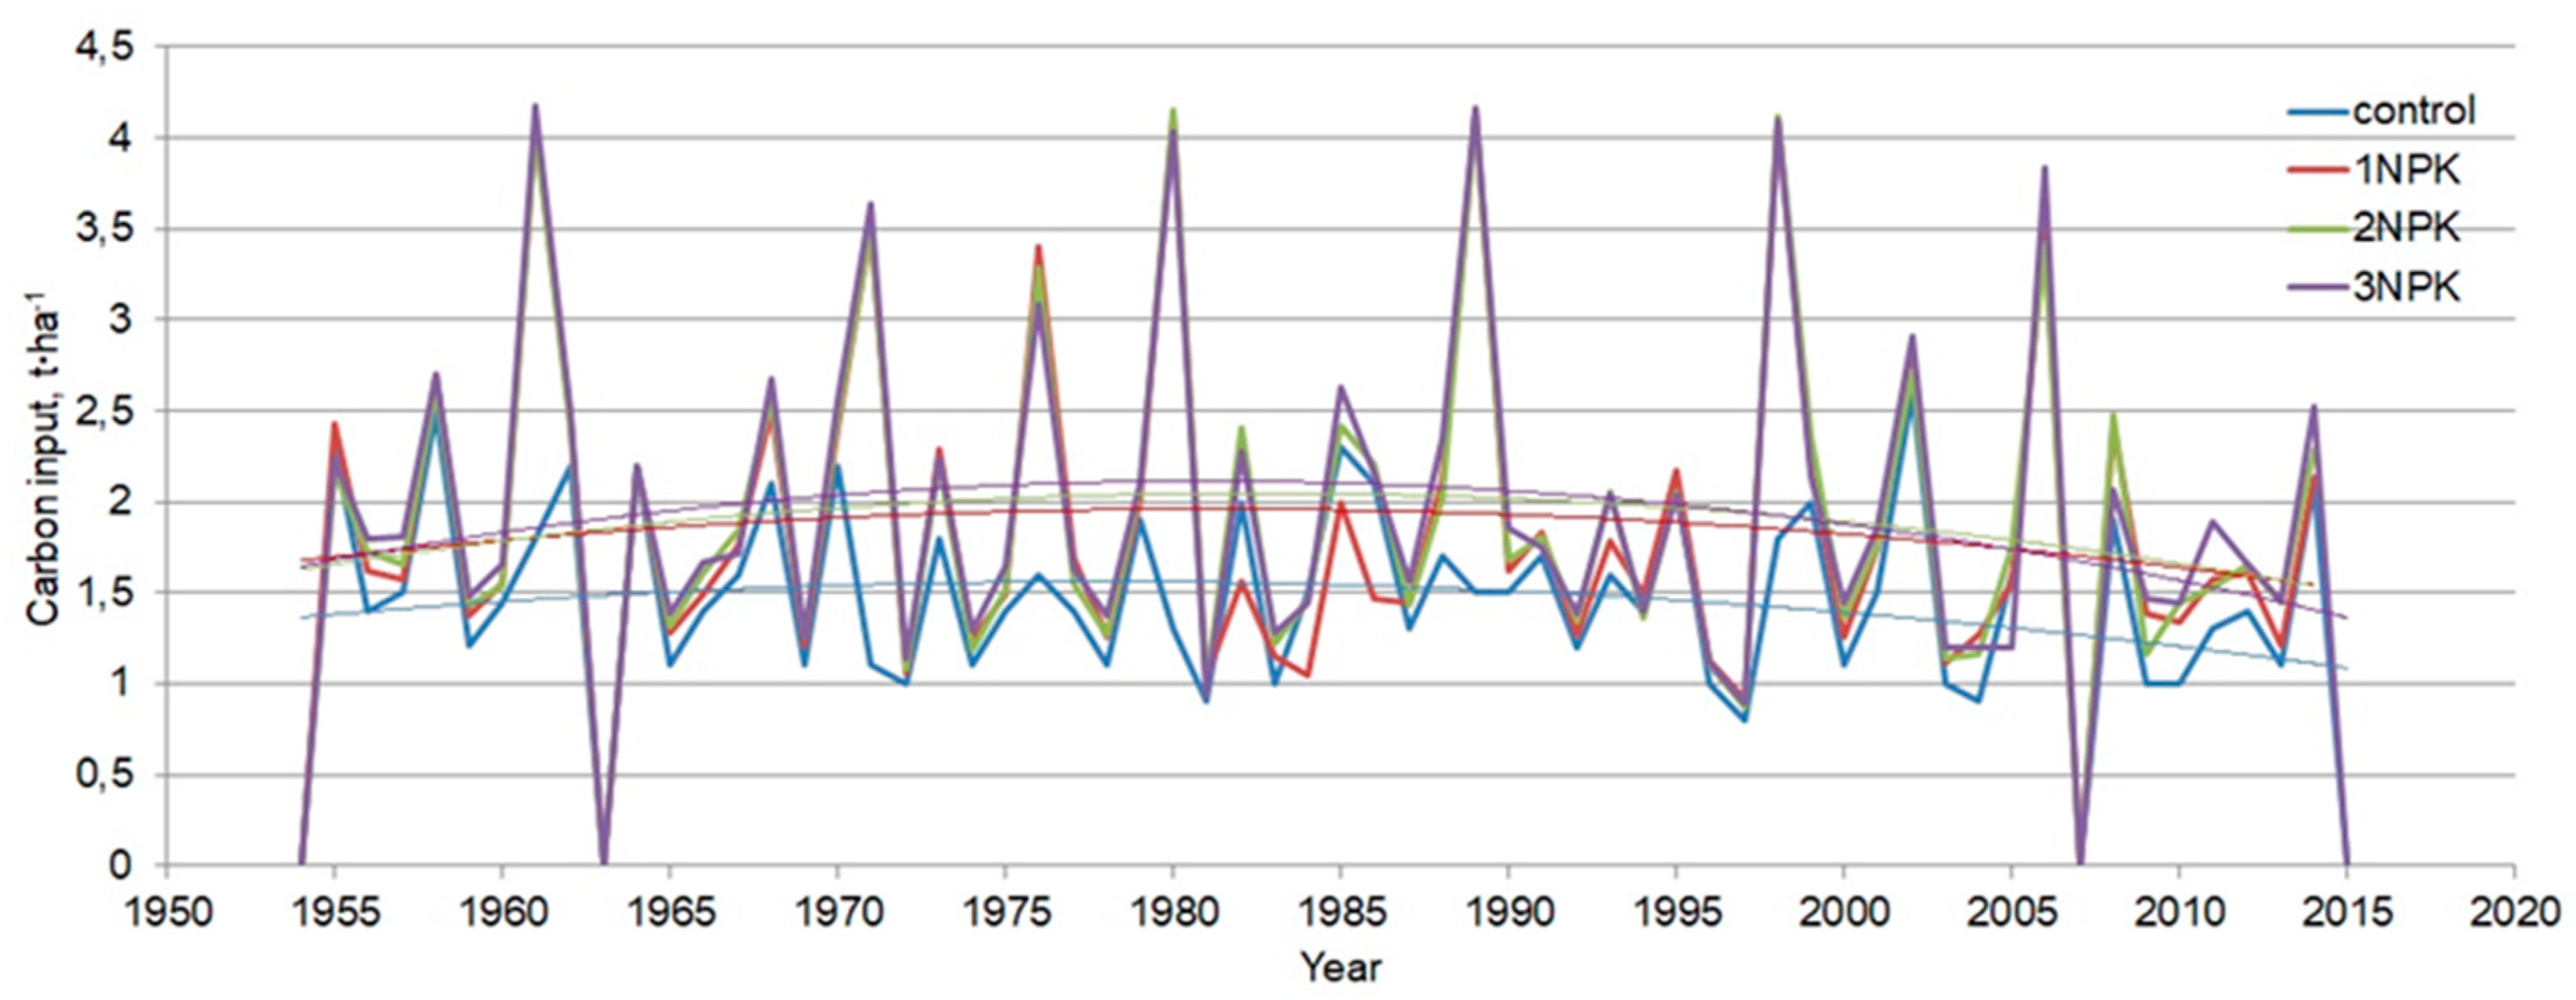
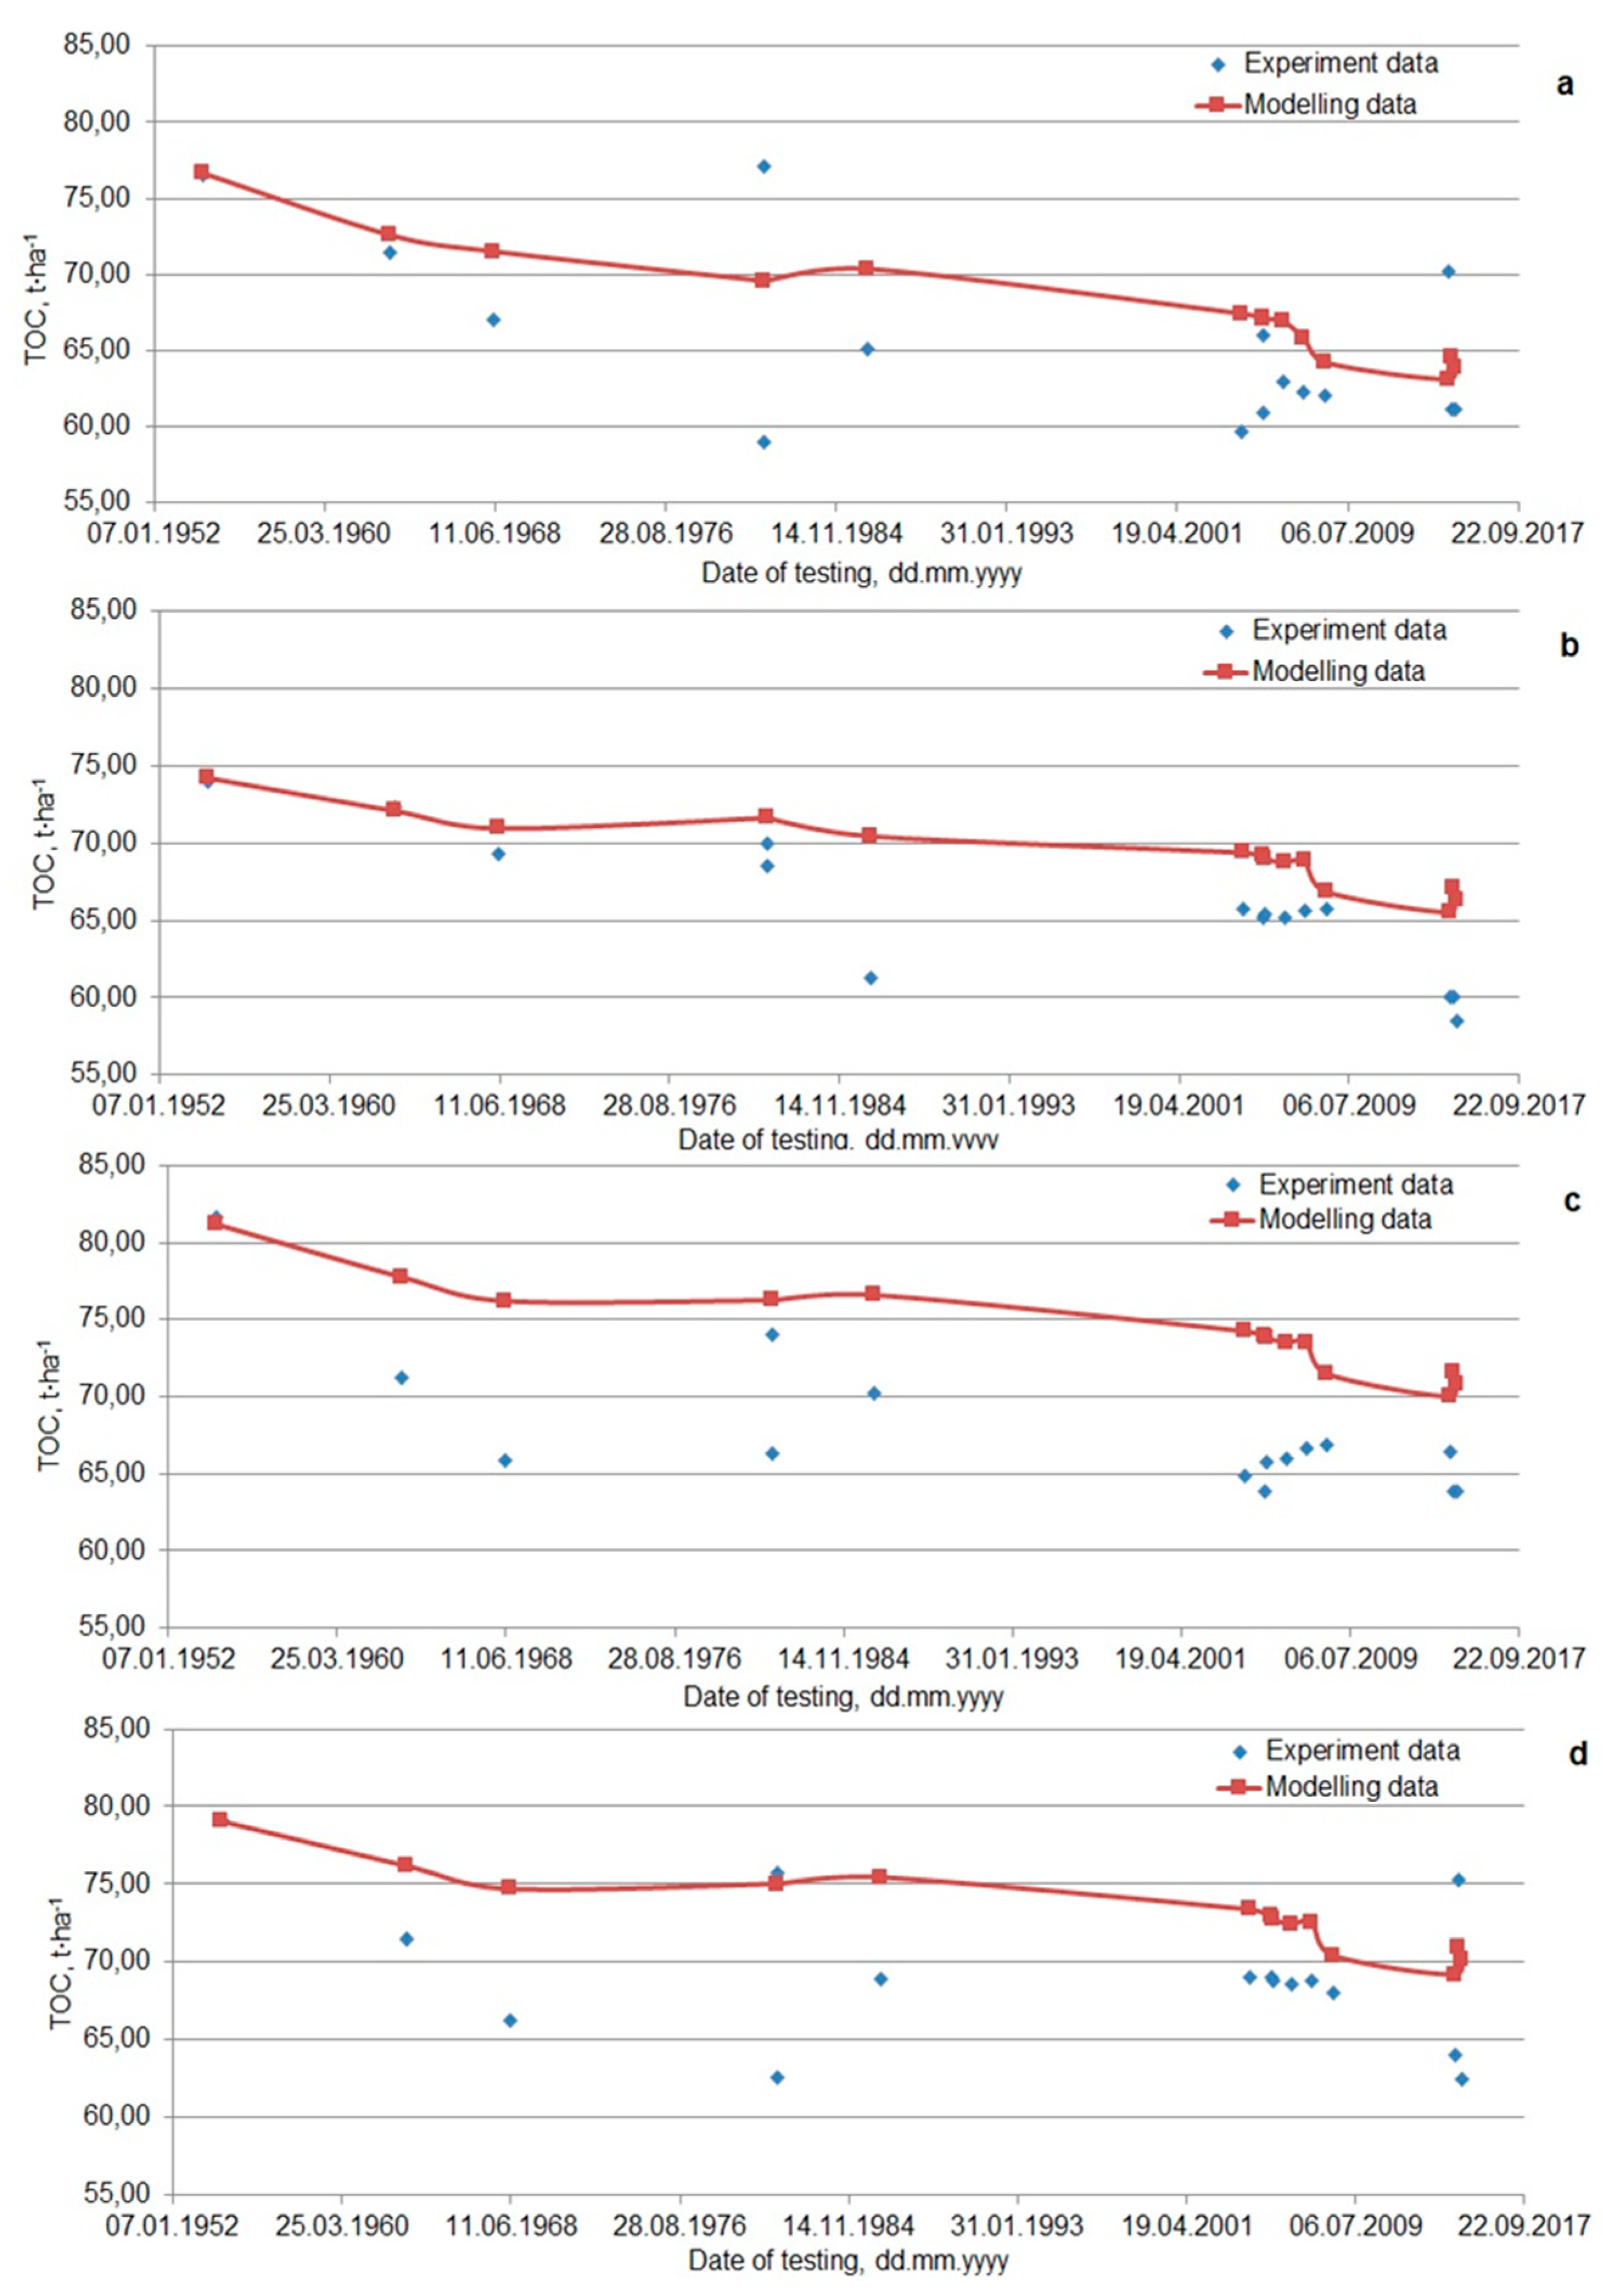
3.1. Modelling C Intake During the Long-Term Experiment

To assess the long-term dynamics of organic carbon stocks in the upper 20 cm of arable soils, the calculation of organic carbon input was performed. The following figures show the dynamics of organic carbon input with plant residues and manure (if any) during the simulation period for the treatments.
Figure 2 shows the distribution of organic C input with surface residues and underground biomass annually, and Figure 3 shows total C input with the amount of organic fertilizers taken into account. As can be seen from Figure 2, C input in the control treatment decreased, reaching a minimum by the end of the observation period; in the other NPK treatments, C input increased slightly until 1976, then also reduced by the end of the observation period. A similar relationship is observed in Figure 3, where the relationship is even more pronounced and can be estimated using a polynomial curve.
The study of the polynomial function shows that in all treatments, the initial annual C input with plant residues was on average 1600–1800 kg·ha1 of organic C, then reached the maximum values on average 1900–2100 kg·ha1 in the period from 1977 to 1987, and after 60 years, at the end of the observation period, decreased to 1300–1500 kg·ha1 of organic C. The dynamics of C input from plant residues differed insignificantly for all the treatments with fertilization. For the control treatment, the decline continued, reaching a level of about 1500 kg·ha−1 C per year 60 years after the start of the experiment. The difference in the behaviour of the control treatment and treatments with fertilizers can be due to both a relatively smaller amount of plant residues in the former case and a smaller ratio of underground and aboveground products in the total biomass, which is taken into account in the Levin equations [18]. Differences in crop rotation productivity between treatments with different rates of mineral fertilizers did not drastically change C input with plant residues, only slightly increasing their supply in direct dependence on the rate. The actual changes were caused by organic fertilizers regularly applied once per crop rotation, as can be seen from Figure 3. At the same time, the tendency to increase the average value of C input to the soil with an increase mineral fertilizers rate becomes more pronounced at the background of organic fertilizers.
In all treatments with fertilizer applications, there is a gradual decrease in organic carbon stocks (Figure 4). The lowest losses of soil organic carbon, both in absolute and relative terms, are observed in the treatment 39 of the experiment with the application of organic fertilizer and one rate of mineral fertilizers and reach the maximum values in control (Table 3).
The correspondence of the dynamics of total organic C stocks for each treatment, calculated from the model and experimental values is shown in Figure 5.
If we consider the rate of accumulation or loss of carbon in the soil for 62 years of the experiment (Table 3) and the annual C input into the soil with surface residues, underground biomass and organic fertilizers (Table 4), the model estimates the average annual amount of C input necessary to maintain initial stocks in the arable soil layer as on average 1900 kg.
If we aim to increase organic C stocks by 0.4% per year, then to achieve this goal, it is necessary to increase the input of carbon to the soil to an average of 2400 kg·ha−1. Figure 4 shows that the trend towards an increase in SOC stocks was observed only in the period 1964–1971. During this period, 20% of row crops and 80% of continuous crops were planted in crop rotation. Analyzing the dynamics of organic C stocks in this period (Table 5), we can observe an annual increase in SOC stocks of 0.4 per cent or more in three tested treatments of the experiment with NPK application, which indicates that the above goal can be achieved with crop rotation and agricultural technologies applied at this stage of the experiment.
The average annual loss of CO2 to the atmosphere during the mineralization of plant residues, organic matter and organic fertilizers, calculated according to the RothC model, averaged 1687 kg·ha−1 for the control treatment, 1947 kg·ha−1 for the treatment 1NPK, 2058 kg·ha1 for the treatment 2NPK, and 2071 kg·ha−1 for the treatment 3NPK. The total CO2 emission for the entire period of the experiment of 62 years was 104.6 t·ha−1 for the control treatment, 120.7 t·ha−1 for the treatment 1NPK, 127.6 t·ha−1 for the treatment 2NPK, and 128.4 t·ha−1 for the treatment 3NPK.
The RothC model allows us to track the dynamics of individual SOC pools. Figure 6 shows the dynamics of the fraction of humified organic matter carbon (HUM), which is characterized by the highest stability in comparison with other pools (except for the inert one, the content of which does not change during the experiment) in relation to the dynamics of the total C stock (MRT is 50 years).
As can be seen from Figure 6, in the stocks of humified organic matter, the same time periods of different rates are revealed as in the stocks of organic carbon (Figure 4). The dynamics of the ratio of the pool of humified C to its total stock in the soil is different. The percentage of humified C in all treatments at the beginning of the experiment was 76% of the total SOC stock. With a decrease in the input of fresh organic matter after the 1970s, the proportion of humified C tended to increase in all treatments, most intensively in the treatments with the application of organic and mineral fertilizers. This tendency is explained by the large losses of organic C from more dynamic pools—RPM and BIO. The maximum increase in the proportion of humified organic matter at the end of the experiment was observed in the control treatment—81%.
During the experiment, the HUM pool decreased by 12% in the control treatment, 7% in treatments 1NPK and 3NPK, and 8% in treatment 2NPK. Thus, all treatments showed a tendency to decrease the reserves of organic matter resistant to mineralization of the soil over the 62 years of the experiment.
Such dynamics of organic C reserves is characterized by the behavior of a system that does not reach an equilibrium state in the course of the experiment. Indeed, if we look at the dynamics of recalcitrant plant material pool (RPM, Figure 7b), the MRT of which is 3.3 years. All treatments demonstrate its decline after each fallowing year without recurrent trend during the next rotation.
Similar trends were detected by the dynamics of microbial biomass (BIO) pool (MRT of 1.5 years), with a smaller range of variation (Figure 7b). The content of decomposable plant material (DPM) changes most actively and does not reveal any regularities (Figure 7a). This fraction is the most dynamic since its MRT is minimal compared to other fractions (0.1 years). There are almost no differences between the treatments.
The same regularities are observed in the dynamics of humified organic matter carbon (HUM), recalcitrant plant material (RPM) and microbial biomass (BIO) pools as in the dynamics of total organic carbon reserves of the pilot site. The highest C losses were observed during the period of fallow, which primarily affected the control treatment.

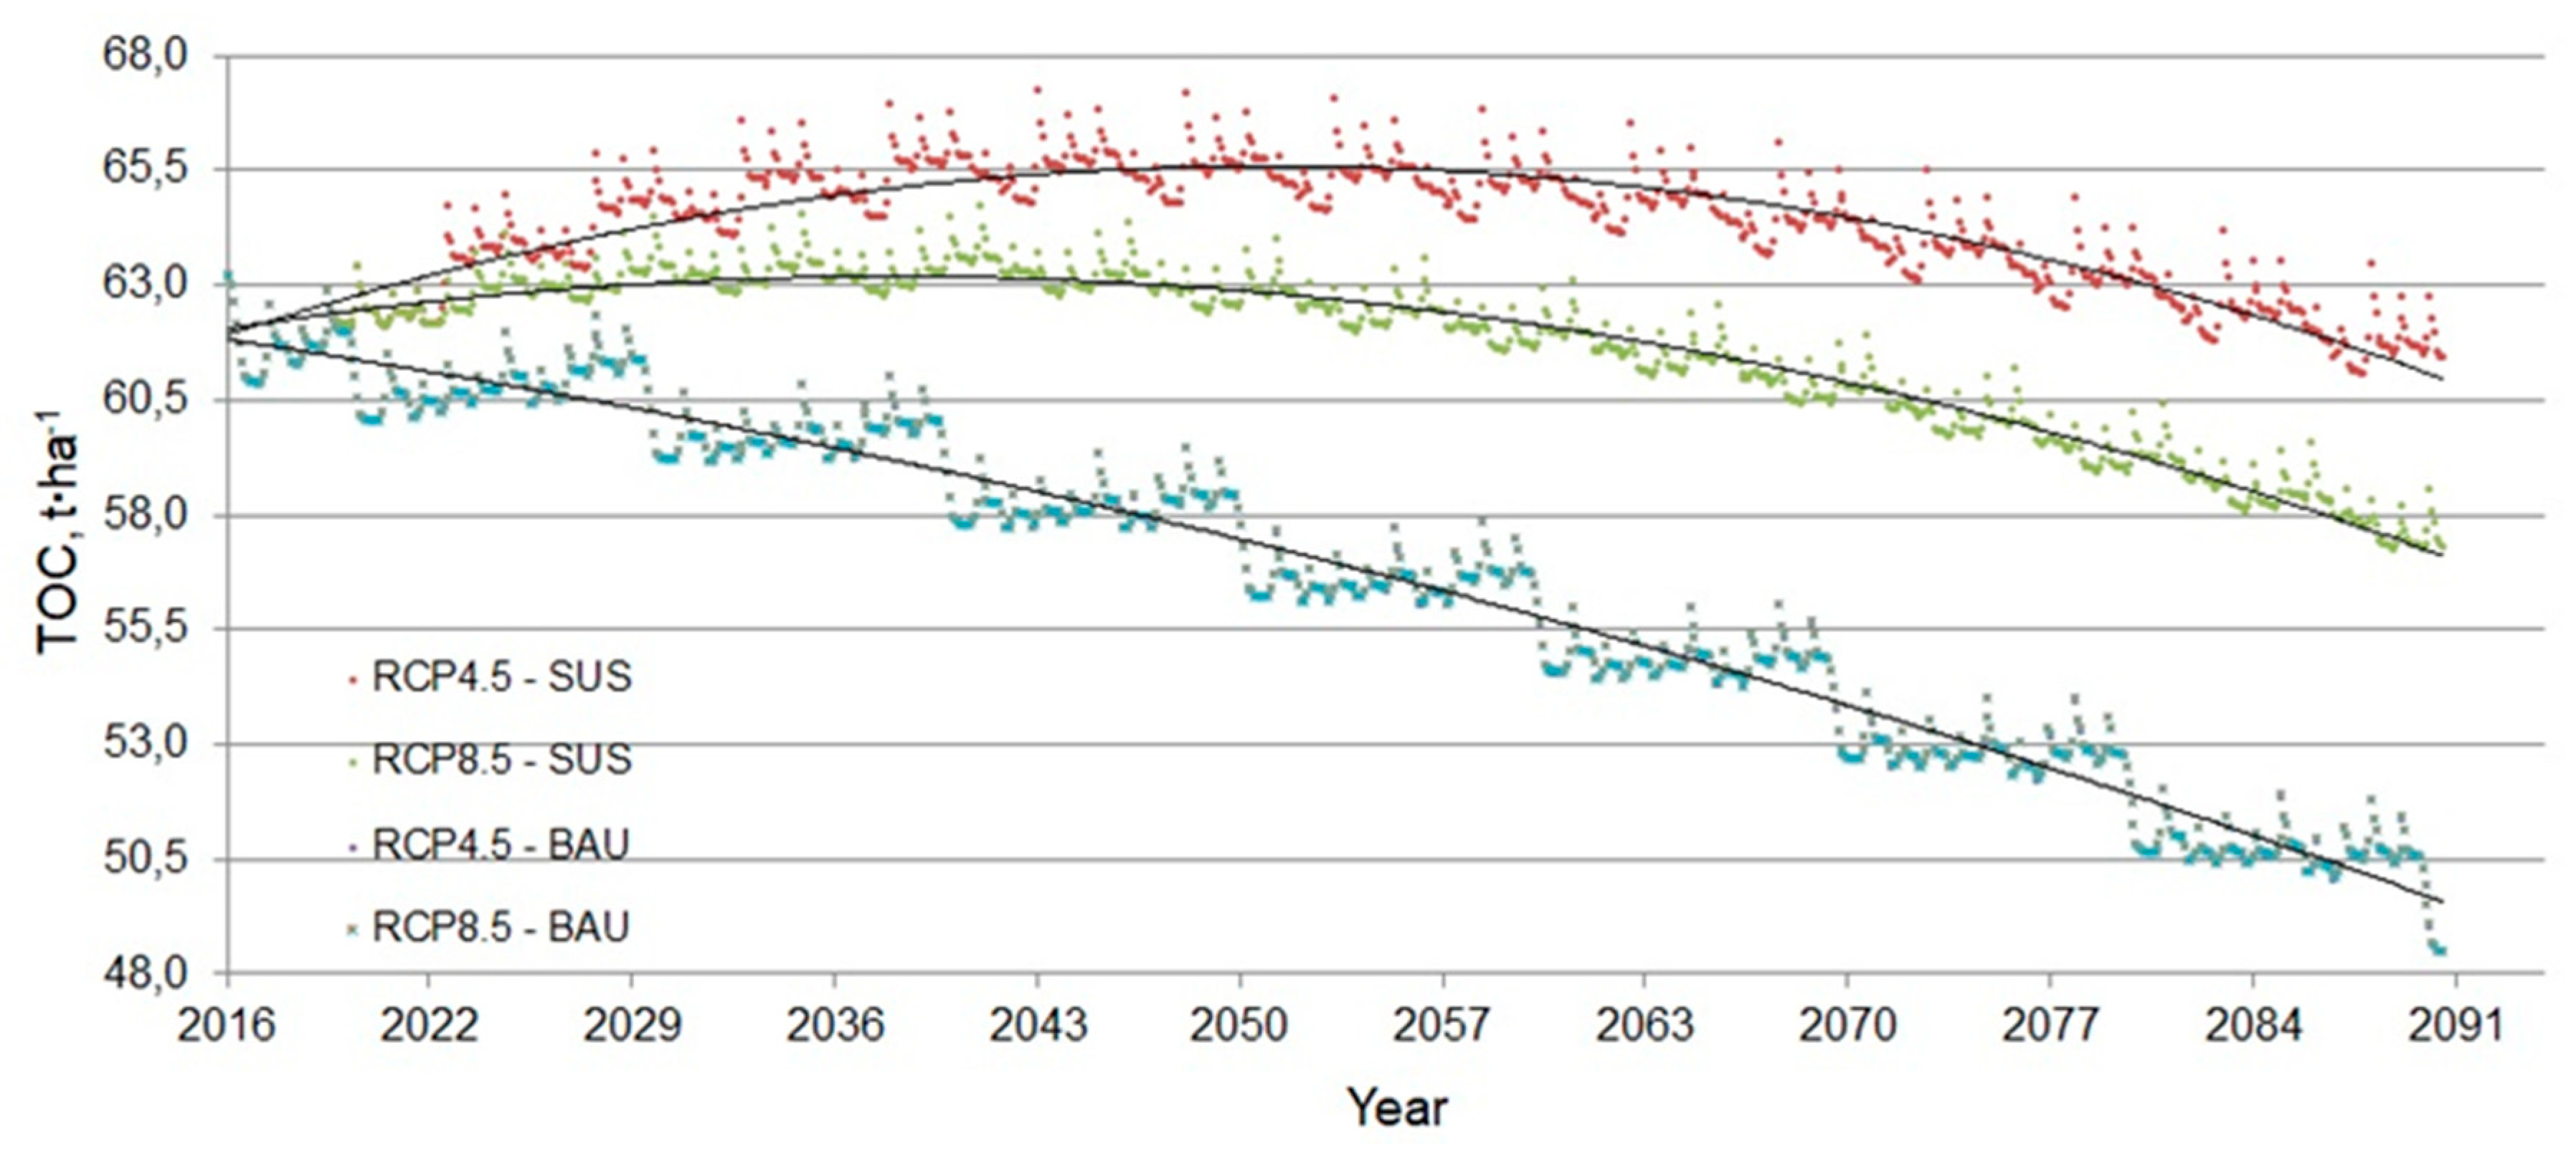
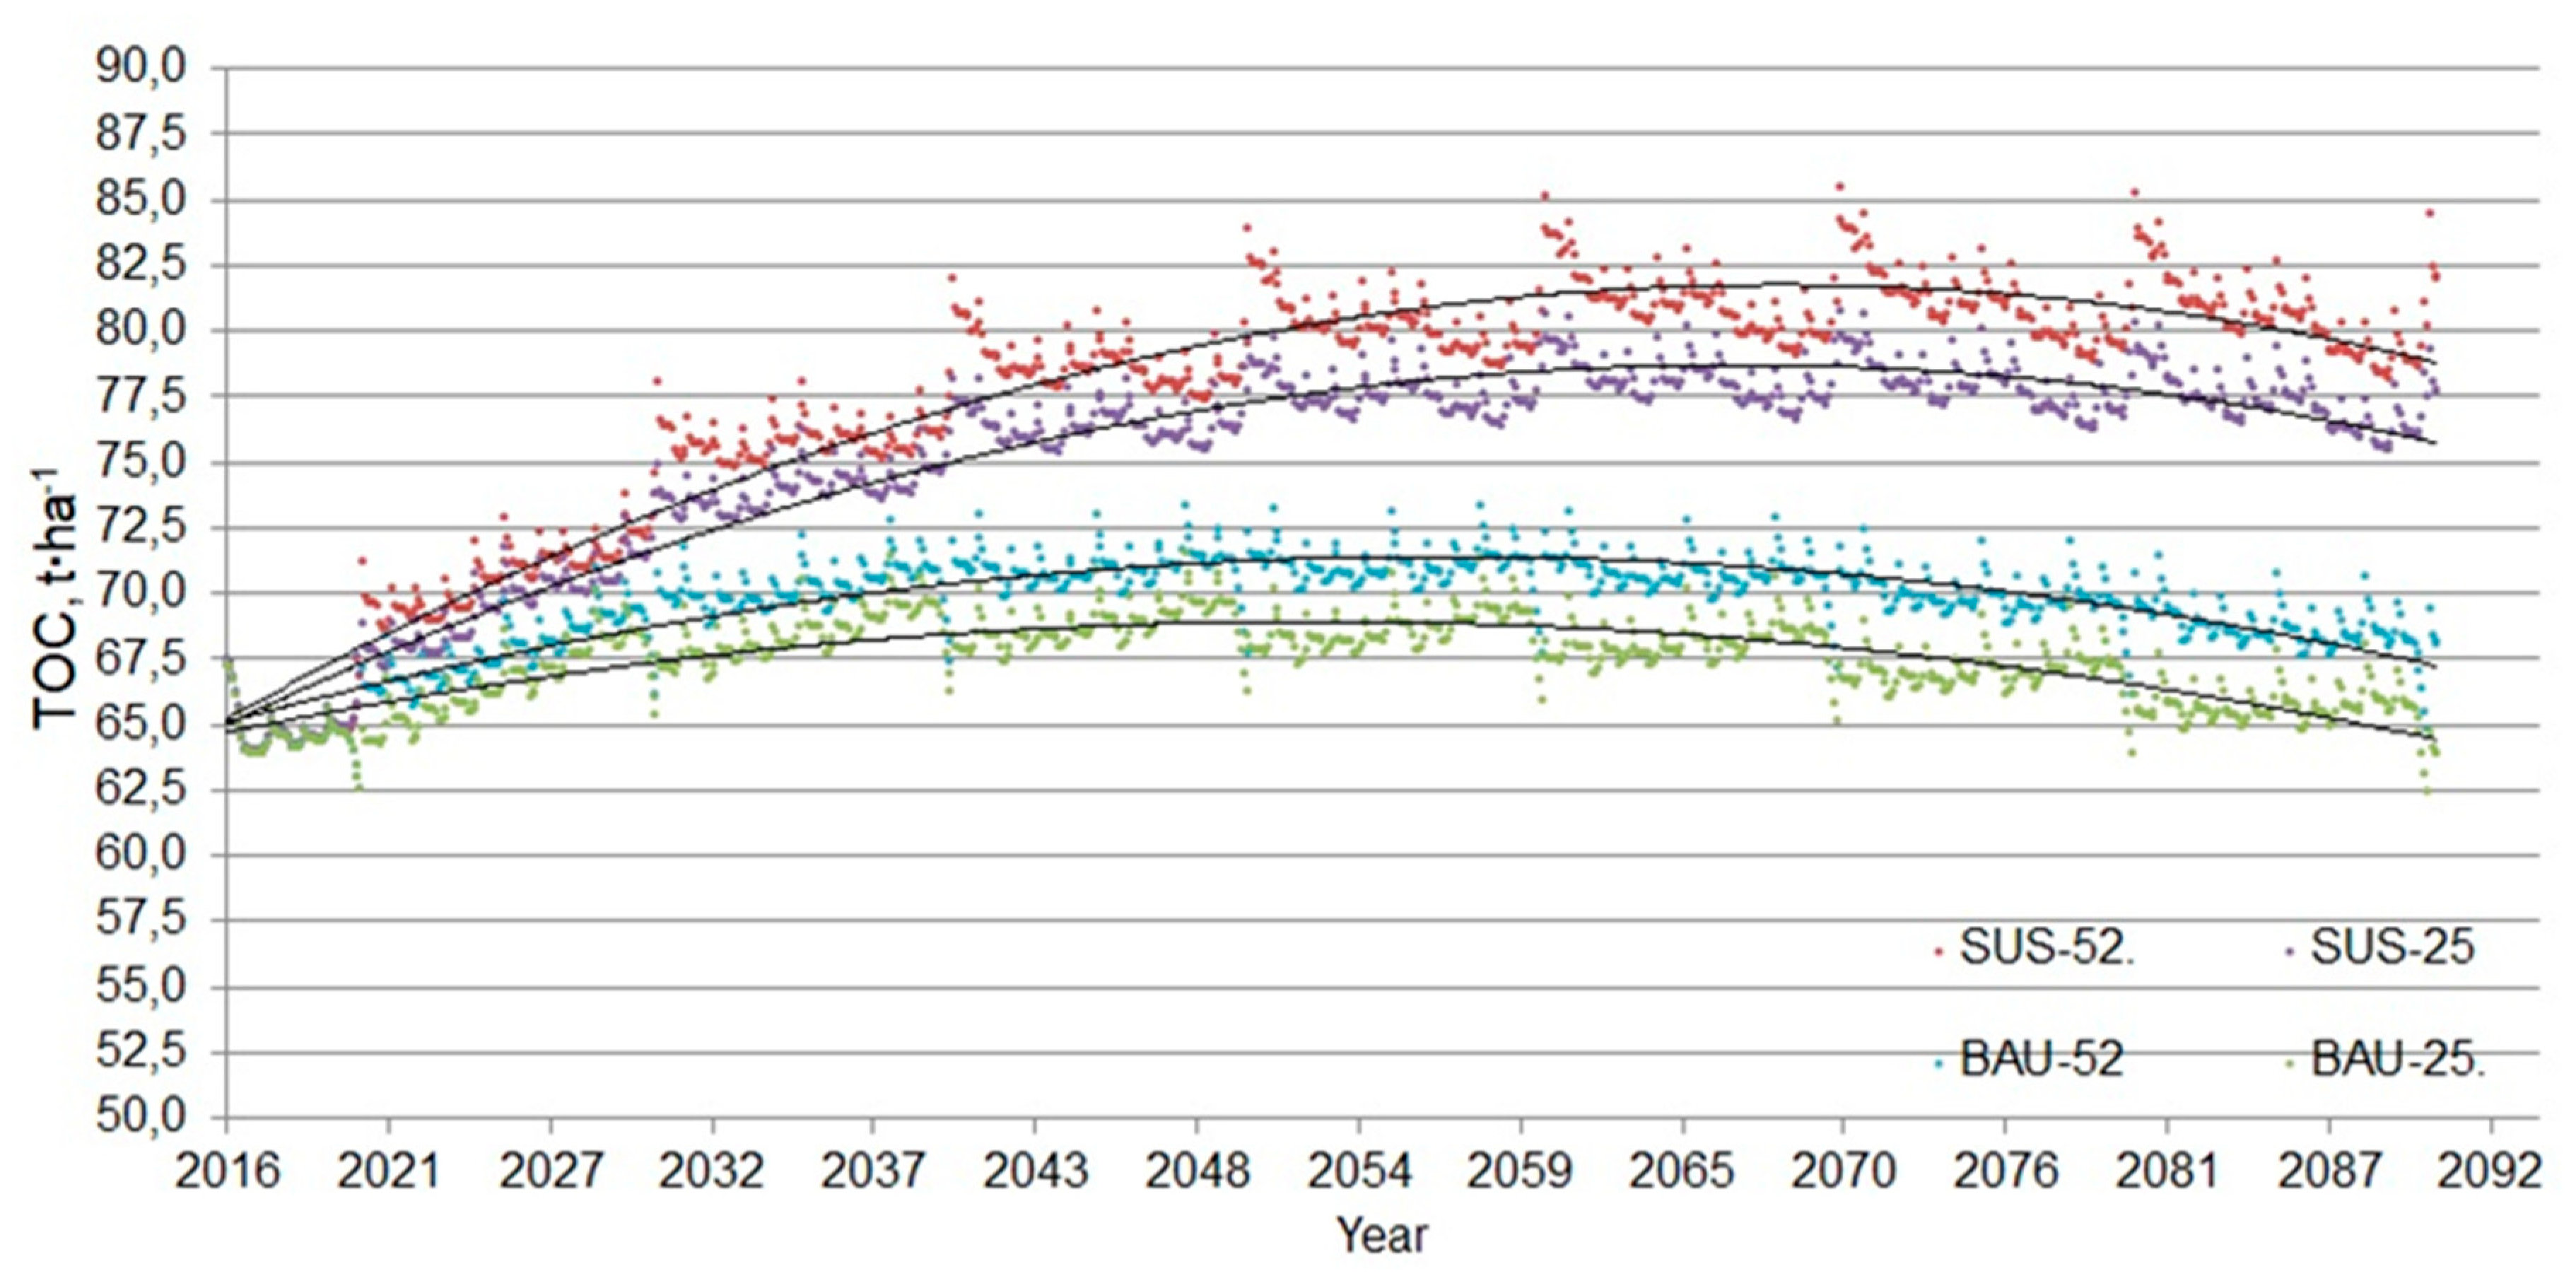
3.2. Forecast of C Fixation in the Soil for the Period 2016–2090

After identifying the model based on data from 62 years of research, forecast calculations for the period 2016–2090 were performed using simulation modelling. Two climate variability scenarios (RCP) were used for subsequent predictive modelling, namely RCP4.5 and RCP8.5, which correspond to the possible range of radiation exposure values in 2100 (4.5 and 8.5 W/m2, respectively). The convergence of the results of calculations based on the model and experimental data allows to set crop rotation options with different proportions of cereals and row crops and explore the possibility of ensuring a deficit-free C balance in alternative crop rotations. The simulation experiment for 2016–2090 conditions included the following crop rotations:
  • Business-as-usual (BAU) with the application of 25 t·ha−1 of FYM per crop rotation (20% row crops, 10% fallow);
  • BAU with the application of 52 t·ha−1 of FYM for crop rotation (20% row crops, 10% fallow);
  • Sustainable (SUS) grain-row crop rotation with the application of 25 t·ha−1 of FYM per crop rotation (20% row crops, 80% crops of continuous sowing);
  • SUS rotation with the application of 52 t·ha−1 of FYM for crop rotation (20% row crops, 80% crops of continuous sowing).
Thus, the analysis of the predicted OC stocks dynamics reveals the effect of such factors as climate, crop rotation and the rate of organic fertilizers on the ability of the studied soils to accumulate organic matter and the ability to achieve an annual increase of 0.4% from the initial values, which can potentially compensate greenhouse gas emissions associated with agricultural activities.
As can be seen from Figure 8, which shows the dynamics of SOC stocks under various climate scenarios and crop rotations for the control treatment, the actual crop rotation in both the RCP4.5 and RCP8.5 scenarios predict a gradual, uniform annual 3‰ decrease down to 49.5 t·ha1. Change in crop rotation to the treatment 1NPK provides a consistent annual increase of 3‰ of OC stocks from 2016 to 2041 under the RCP8.5 scenario, and rise of 6‰ of SOC stocks from 2016 to 2055 under the RCP4.5 scenario, and then, there is a tendency to gradually lose the accumulated C under both scenarios (Figure 9 and Figure 10).

4. Discussion

4.1. Long-Term Trends in SOC Stock in Soils under Intensive Farming

The results of OC dynamics simulation during more than 60 years allow linking periods of C loss with annual C inputs less than 1900 kg·ha1 (Figure 4). To maintain or increase SOC stock 70–80 t·ha1 in the upper 20 cm of the soil higher C inputs are necessary, which demonstrated by the increase of C stock during 1964–1971 and coincide with the highest C input 1900–2100 kg·ha1 during this experimentation period. One of the problems for effective management of C level in the experiment is a small increase of C input because of increasing fertilizer rates: in average 10, 13 and 16% growth for 1954–2015 with ordinary, double and triple fertilization rates compared to the control, respectively. With modest input of C from FYM application (11–12% from total C, Table 4), FYM addition did not prove effective in maintaining the C stock, at least at the rate applied. However, the rapid change of SOC trend and 2–5‰ annual OC increase in 1964–1971 demonstrates relevance in management crop yields and crop residues returned to the soil. The rate of OC accumulation increased 2–2.4 times under fertilization. The effect was most pronounced in the treatment with ordinary fertilization rate mainly as it has the smallest OC stock among fertilization treatments in 1964.
Körschens et al. [19] compared the results of 20 European long-term experiments that lasted from 10 to 61 years. They found that the differences in SOC between the plots that received combined mineral and organic fertilization and control plots ranged from 0.11 to 0.72% with an average of 0.3% OC, which corresponded to C stock of 15 t· ha1. Edmeades [20] in a meta-analysis compared the long-term effects of fertilizers and manures in 14 field trials (duration 20–120 years) and reported 15% to 81% relative increase in OC level after application of 4 to 22 t·ha1·yr1 manures and fertilizers at equivalent rates for soils with initial OC level of 1–2%. In our case, the relative increase was less than 10% or 7 t·ha1 (Figure 4), since the average FYM annual rate was several times less and SOC level 2.0–2.5 times higher than in the studies mentioned above. Maillard and Angers [21] analyzed 49 short-and long-term field experiments (duration 3–82 years) and discussed the variability of SOC stocks change after manure application. They proposed manure-C retention coefficient of 12% ± 4 for an average 18-years-long study. This result is consistent with our modelled OC stock increase in the last years of the field experiment, but not in the 20th century when the most significant difference was observed due to intensive mineral fertilization. Double NPK application in comparison with an ordinary rate provided the highest OC concentration increase. Han et al. [22] made a global meta-analysis of published data on the responses of OC to fertilizer managements in 1741 field experiments. They found the importance of combining mineral fertilization with manure application for improving or maintaining current OC stocks across various agroecosystems, especially in a cool temperate climate. At least 2.0 Mg·ha−1·yr−1 C input is needed to keep the SOC stocks; this value is consistent with our estimates for the long-term experiment. The same values were reported for calculations with the RothC model for maintaining current SOC in global wheat systems [23].
A tendency to decrease the reserves of OC resistant to mineralization of the soil over the 62 years of the experiment resulted in 8–15% OC decline which was coincided with 4–6% growth in the proportion of humified organic matter, mainly in the control treatment (Figure 6). Yang et al. [24] simulated OC dynamics in black soils in northeast China using the RothC model and assumed a 50% loss of initial C stock and steady-state at about 40 t·ha1 for 20 years; however, a continuous decline of OC stock was expected if fertilizer application was insufficient. This conclusion is entirely consistent with our experimental data, which demonstrate a slight decrease after 1971 and accelerated decline after 1990.
Tracing of losses during fallow periods shows that RPM pool decline was almost twice higher than that of HUM pool (Figure 6a and Figure 7b) which illustrates comparatively higher losses of more active pools. During 1954–2015 RPM and BIO pools reduced by almost half. The same figures demonstrate that during the period of OC increase, 1964–1971, HUM pool remains practically constant (treatments 1NPK and 3 NPK) or has a slight decline (treatments control and 2NPK). All SOC growth is connected with the increase of more active RPM and BIO pools, which indicates the viability to monitor active C fractions as indicators of maintaining OC stock in the studied soils. Lou et al. [25] assessed the dynamics of C fractions, such as water-soluble organic C, microbial biomass C (MBC), particulate organic C and KMnO4 oxidized organic C and concluded that these are more sensitive to the management practices than total organic C in a 22-year organic and inorganic fertilization trial. In a long-term field experiment, Giacometti et al. [26] found a strong relationship between microbiological parameters and OC level and composition.
In the next 60 years of simulation for the control treatment, a steady decline is expected, but the rate of OC loss is twice less than in the first 60-year period. Absolute annual loss during fallowing may be as high as 2.5 t·ha1, and this dynamic is practically the same under both climate scenarios. The omission of the fallow field is enough to maintain the current 61 t·ha1 OC stock. This measure can be more potentially attractive under the RCP4.5 scenario. In comparison with RCP8.5 scenario, it is twice more effective in increasing OC stock, the effect is sustainable during a more extended period, and even a decline of accumulated OC stock after 2055 allows to maintain in 2090 the same OC level as in 2015. Under RCP8.5 all accumulated SOC will be lost before 2060. This simulation is confirming the importance of fallowing factor on SOC dynamics, which is more pronouncing than the effect of climate change. Leifeeld et al. [27] simulated the data of a long-term field experiment in Switzerland with the RothC model discriminating possible impacts of climate change from those of management. They found no systematic trend in OC stock if management changes were not considered. Our findings demonstrate the similar effect of adaptation measures reproduced by RothC, which can be relevant under different climate change scenarios.
Investigating the effect of crop rotation on OC dynamics under fertilization is illustrated by Figure 9 and Figure 10 for treatment 1NPK at FYM background. Under both RCP4.5 and 8.5 scenarios accumulation of SOC is expected with >4‰ annually until 2050 and increasing FYM rate up to 52 t·ha1 can provide additional 2.5 t·ha1 OC accumulation after 35 years since increasing organic fertilization rates. Introduction of SUS instead BAU crop rotation without fallowing allows to accumulate additionally up to 10 t·ha1 OC in the next 45 years, initial 1954 OC level 74 t·ha1 can be reached within 25 and 20 years after crop rotation change for RCP4.5 and 8.5 scenarios, respectively. OC dynamics is close for both climate scenarios, but RCP 8.5 seems slightly more favourable for OC accumulation. Increasing FYM rate will have potentially the same effect in SUS rotation as in BAU. After 2060 in BAU rotation and 2070 in SUS rotation part of the previously accumulated OC will be lost under more unfavourable climate conditions. This loss can be as high as 4 t·ha1 SOC in BAU rotation and 2.5–3 t·ha1 OC in SUS rotation. It is worth to note that withdrawal of fallowing needs to be compensated by changes in management practices that allow sustaining high crop yields and additional chemicals load to prevent the spreading of weeds and pathogens. Important that the first half of the century, according to both climate scenarios is the most promising period for introduction adaptation measures for the additional accumulation of SOC in the studied soils.
The joint application of manure and mineral fertilizers can provide C sequestration during 72–117 years, according to [22], which falls into the range of our estimates until the end of this century (Figure 9 and Figure 10). For organic and mineral fertilization system, it is about 2.5–3 times longer than for the control treatment, when the only 15–20-year period of C sequestration duration is expected (Figure 8, Figure 9 and Figure 10).

4.2. SOM and Soil Health under Climatic Change

Soil health is believed to reflect its ability to contribute to the soil-related ecosystem services, and thus it may act as a measure of soil value [14]. The “4 per mile” initiative stresses the double benefit of carbon sequestration in agricultural soils: on the one hand, carbon fixation mitigates global warming, and on the other hand, it favors the improvement of soil health [8]. In this respect, we should consider the long-term variation in SOC pools as the temporal fluctuation of soil health and related ecosystem services. The soils in the Russian Federation suffer significant anthropogenic pressure, especially in the Chernozem zone, which has the most favorable agroclimatic and soil conditions for agriculture [11,28]. In this respect, maintenance of soil health under agricultural use is of significant importance for providing ecosystem services in agroecosystems. Thus, specific techniques should be developed for carbon sequestration in soils under intensive tillage. This challenge is especially crucial under climatic change, which seems to increase the loss of SOM in Chernozems, as our study shows.
This work allows quantifying the impact of changes in technology under intensive agriculture in the ability to control the carbon stocks of arable Chernozems in the forest-steppe zone, as well as evaluating the effect of optimization of mineral nutrition of plants during the processes for solving the above problems. The combined application of inorganic and organic fertilizers was considered as a compromise between food security and soil carbon sequestration. This management strategy was highly recommended for the Chinese Loess Plateau, based on the DNDC model simulation using the projected climate change of the HadCM3 model [29]. The shortage in FYM is an important obstacle for the application of required doses of organic fertilizers, especially in the south of European Russia, where plant breeding is more extensive than livestock breeding. The use of green manure and some alternative carbon-containing fertilizers such as sapropel, peat and especially biochar may be an option for the farms where manure is absent [30]. The role of biochar in OC stabilization was stressed in several papers [31] and deserved further study in combination with other organic and mineral fertilizers.

5. Conclusions

As shown by the results of the experiment, in most cases it was difficult to increase OC concentration in Chernozems that fits well with the general opinion that it is difficult to expect carbon sequestration in soils initially rich in OC. The application of high rates of organic fertilizers was a necessary component for the maintenance and increase of OC pools in soils. The effect of crop rotation on OC dynamics under fertilization, for example, withdrawal of fallowing was more pronounced in future climate conditions in comparison with increasing FYM rates. The first half of the century is considered as the most promising period for introduction adaptation measures for the additional accumulation of SOC on Chernozem before 2060–2070. The demand for manure may be a challenge in the future because even now, many farms in the south of Russia face a deficiency of organic fertilizers. In line with the existing data, the joint application of FYM with mineral fertilizers showed higher efficiency in OC sequestration than organic fertilizers alone. The exact doses of fertilizers required for providing accumulation of OC in soils may vary in a broad range depending on soil properties, bioclimatic conditions and crop rotations. Further research is required to find out if green manure, biochar and other alternative carbon sources may replace traditional manure-based soil amendments.

Author Contributions

Conceptualization, P.K. and V.R.; methodology, software, V.R.; investigation, O.M.; data curation, I.H.; writing—original draft preparation, I.H.; writing—review and editing, P.K. and V.R.; visualization, I.H.; supervision, project administration, funding acquisition, P.K. All authors have read and agreed to the published version of the manuscript.

Funding

The research was a part of the activities of the Horizon 2020 project Coordination of International Research Cooperation on soil CArbon Sequestration in Agriculture (CIRCASA). The financial support for the research was obtained from the project “Management of atmospheric carbon sequestration in arable soils of Russia” of the Federal Task Program “Research and development in priority areas of development of Russia’s scientific and technological complex for 2014–2020”, unique project identifier RFMEFI61618X0105.

Conflicts of Interest

The authors declare no conflict of interest. The funders had no role in the design of the study; in the collection, analyses, or interpretation of data; in the writing of the manuscript, or in the decision to publish the results.

References

  1. Smith, J.; Smith, P.; Wattenbach, M.; Gottschalk, P.; Romanenkov, V.; Shevtsova, L.K.; Sirotenko, O.D.; Rukhovich, D.I.; Koroleva, P.V.; Romanenko, I.A.; et al. Projected changes in the organic carbon stocks of cropland mineral soils of European Russia and the Ukraine, 1990–2070. Glob. Chang. Biol. 2007, 13, 342–356. [Google Scholar] [CrossRef]
  2. Rumpel, C. Soils linked to climate change. Nature 2019, 572, 442–443. [Google Scholar] [CrossRef]
  3. Vermeulen, S.; Bossio, D.; Lehmann, J.; Luu, P.; Paustian, K.; Webb, C.; Augé, F.; Bacudo, I.; Baedeker, T.; Havemann, T.; et al. A global agenda for collective action on soil carbon. Nat. Sustain. 2019, 2, 2–4. [Google Scholar] [CrossRef]
  4. Lajtha, K.; Bowden, R.D.; Crow, S.; Fekete, I.; Kotroczó, Z.; Plante, A.F.; Simpson, M.J.; Nadelhoffer, K.J. The detrital input and removal treatment (DIRT) network: Insights into soil carbon stabilization. Sci. Total Environ. 2018, 640, 1112–1120. [Google Scholar] [CrossRef] [PubMed]
  5. Fekete, I.; Lajtha, K.; Kotroczó, Z.; Várbíró, G.; Varga, C.; Tóth, J.A.; Demeter, I.; Veperdi, G.; Berki, I. Long-term effects of climate change on carbon storage and tree species composition in a dry deciduous forest. Glob. Chang. Biol. 2017, 23, 3154–3168. [Google Scholar] [CrossRef] [PubMed]
  6. Kibblewhite, M.; Ritz, K.; Swift, M. Soil health in agricultural systems. Philos. Trans. R. Soc. B Biol. Sci. 2007, 363, 685–701. [Google Scholar] [CrossRef] [Green Version]
  7. Montanarella, L.; Pennock, D.J.; McKenzie, N.; Badraou, M.; Chude, V.; Baptista, I.; Mamo, T.; Yemefack, M.; Aulakh, M.S.; Yagi, K.; et al. World’s soils are under threat. SOIL Discuss. 2016, 2, 79–82. [Google Scholar] [CrossRef] [Green Version]
  8. Soussana, J.-F.; Lutfalla, S.; Ehrhardt, F.; Rosenstock, T.; Lamanna, C.; Havlík, P.; Richards, M.; Wollenberg, E.; Chotte, J.-L.; Torquebiau, E.; et al. Matching policy and science: Rationale for the ‘4 per 1000—soils for food security and climate’ initiative. Soil Tillage Res. 2019, 188, 3–15. [Google Scholar] [CrossRef]
  9. Minasny, B.; Malone, B.P.; McBratney, A.B.; Angers, D.A.; Arrouays, D.; Chambers, A.; Chaplot, V.; Chen, Z.-S.; Cheng, K.; Das, B.S.; et al. Soil carbon 4 per mille. Geoderma 2017, 292, 59–86. [Google Scholar] [CrossRef]
  10. Poulton, P.; Johnston, J.; Macdonald, A.; White, R.; Powlson, D. Major limitations to achieving “4 per 1000” increases in soil organic carbon stock in temperate regions: Evidence from long-term experiments at Rothamsted Research, United Kingdom. Glob. Chang. Biol. 2018, 24, 2563–2584. [Google Scholar] [CrossRef] [Green Version]
  11. Krasilnikov, P.; Sorokin, A.; Golozubov, O.; Bezuglova, O. Managing Chernozems for Advancing SDGs. In Soil and Sustainable Development Goals; Lal, R., Horn, R., Kosaki, T., Eds.; GeoEcology Essays; Catena-Schweizerbart: Stuttgart, Germany, 2018; pp. 175–188. [Google Scholar]
  12. Sorokin, A.; Owens, P.; Láng, V.; Jiang, Z.-D.; Michéli, E.; Krasilnikov, P. “Black soils” in the Russian Soil Classification system, the US Soil Taxonomy and the WRB: Quantitative correlation and implications for pedodiversity assessment. Catena 2021, 196, 104824. [Google Scholar] [CrossRef]
  13. Romanenkov, V.; Belichenko, M.; Petrova, A.; Raskatova, T.; Jahn, G.; Krasilnikov, P. Soil organic carbon dynamics in long-term experiments with mineral and organic fertilizers in Russia. Geoderma Reg. 2019, 17, e00221. [Google Scholar] [CrossRef]
  14. Doran, J.W.; Zeiss, M.R. Soil health and sustainability: Managing the biotic component of soil quality. Appl. Soil Ecol. 2000, 15, 3–11. [Google Scholar] [CrossRef] [Green Version]
  15. Minakova, O.A.; Alexandrova, L.V.; Kunitsyn, D.A. Change of soil fertility and sugar beet yield under long-term application of fertilizers in grain-fallow-row crop rotation of the forest-steppe of Central Black earth region. Agrokhimia 2018, 1, 52–60. (In Russian) [Google Scholar]
  16. Tyurin, I.V. Soil Organic Matter and its Role in Pedogenesis and Soil Productivity. Study of Soil Humus; Seľskozgiz: Moscow, Russia, 1937; p. 322. (In Russian) [Google Scholar]
  17. Smith, P.; Smith, J.; Powlson, D.; McGill, W.; Arah, J.; Chertov, O.; Coleman, K.; Franko, U.; Frolking, S.; Jenkinson, D.; et al. A comparison of the performance of nine soil organic matter models using datasets from seven long-term experiments. Geoderma 1997, 81, 153–225. [Google Scholar] [CrossRef]
  18. Levin, F.I. Amount of plant residues of field crops and its determination according to the yield of the main product. Agrokhimiya 1977, 8, 36–42. (In Russian) [Google Scholar]
  19. Körschens, M.; Albert, E.; Armbruster, M.; Barkusky, D.; Baumecker, M.; Behle-Schalk, L.; Bischoff, R.; Čergan, Z.; Ellmer, F.; Herbst, F.; et al. Effect of mineral and organic fertilization on crop yield, nitrogen uptake, carbon and nitrogen balances, as well as soil organic carbon content and dynamics: Results from 20 European long-term field experiments of the twenty-first century. Arch. Agron. Soil Sci. 2013, 59, 1017–1040. [Google Scholar] [CrossRef]
  20. Edmeades, D.C. The long-term effects of manures and fertilisers on soil productivity and quality: A review. Nutr. Cycl. Agroecosyst. 2003, 66, 165–180. [Google Scholar] [CrossRef]
  21. Maillard, É.; Angers, D.A. Animal manure application and soil organic carbon stocks: A meta-analysis. Glob. Chang. Biol. 2013, 20, 666–679. [Google Scholar] [CrossRef]
  22. Han, P.; Zhang, W.; Wang, G.; Sun, W.; Huang, Y. Changes in soil organic carbon in croplands subjected to fertilizer management: A global meta-analysis. Sci. Rep. 2016, 6, 27199. [Google Scholar] [CrossRef] [PubMed] [Green Version]
  23. Wang, G.; Luo, Z.; Han, P.; Chen, H.; Xu, J. Critical carbon input to maintain current soil organic carbon stocks in global wheat systems. Sci. Rep. 2016, 6, 1–8. [Google Scholar] [CrossRef] [PubMed] [Green Version]
  24. Ren, J.; Wang, L.; Yang, X.; Zhang, X.; Fang, H.; Zhu, P. Long-Term Effects of Fertilization on Soil Organic Carbon Changes in Continuous Corn of Northeast China: RothC Model Simulations. Environ. Manag. 2003, 32, 459–465. [Google Scholar] [CrossRef] [PubMed]
  25. Lou, Y.; Wang, J.; Liang, W. Impacts of 22-year organic and inorganic N managements on soil organic C fractions in a maize field, northeast China. Catena 2011, 87, 386–390. [Google Scholar] [CrossRef]
  26. Giacometti, C.; Demyan, M.S.; Cavani, L.; Marzadori, C.; Ciavatta, C.; Kandeler, E. Chemical and microbiological soil quality indicators and their potential to differentiate fertilization regimes in temperate agroecosystems. Appl. Soil Ecol. 2013, 64, 32–48. [Google Scholar] [CrossRef]
  27. Leifeld, J.; Reiser, R.; Oberholzer, H.R. Consequences of Conventional versus Organic farming on Soil Carbon: Results from a 27-Year Field Experiment. Agron. J. 2009, 101, 1204–1218. [Google Scholar] [CrossRef]
  28. Krasilnikov, P.; Makarov, O.; Alyabina, I.; Nachtergaele, F. Assessing soil degradation in northern Eurasia. Geoderma Reg. 2016, 7, 1–10. [Google Scholar] [CrossRef]
  29. Chen, H.; Zhao, Y.; Feng, H.; Li, H.; Sun, B. Assessment of climate change impacts on soil organic carbon and crop yield based on long-term fertilization applications in Loess Plateau, China. Plant Soil 2014, 390, 401–417. [Google Scholar] [CrossRef]
  30. Peltre, C.; Christensen, B.T.; Dragon, S.; Icard, C.; Kätterer, T.; Houot, S. RothC simulation of carbon accumulation in soil after repeated application of widely different organic amendments. Soil Biol. Biochem. 2012, 52, 49–60. [Google Scholar] [CrossRef]
  31. Kocsis, T.; Biró, B.; Ulmer, Á.; Szántó, M.; Kotroczó, Z. Time-lapse effect of ancient plant coal biochar on some soil agrochemical parameters and soil characteristics. Environ. Sci. Pollut. Res. 2017, 25, 990–999. [Google Scholar] [CrossRef]
Figure 1. The location and a climatic diagram for the VNIISS experimental field. Ramon, Voronezh region, is the closest meteorological station to the field.
Agronomy 10 01607 g001
Figure 2. The annual C input in the long-term field experiment of VNIISS only with plant residues. On the axis of abscissas—the input according to crop-specific biomass allocation coefficients of organic C, t·ha−1 with stubble and belowground biomass, on the axis of ordinate—the year of input. Smoothing was performed using second-degree polynomials. Zero input corresponds to fallows.
Agronomy 10 01607 g002
Figure 3. The annual C input in the long-term field experience of VNIISS in total, taking into account the application of organic fertilizers. On the axis of abscissas—the input of organic C, t·ha−1 with crop biomass, as shown in Figure 2 and calculated based on the composition of FYM, on the axis of ordinate—the year of input. Smoothing was performed using second-degree polynomials.
Agronomy 10 01607 g003
Figure 4. Simulated changes in total organic C (TOC) stock at four treatments for the period from 1954 to 2015.
Agronomy 10 01607 g004
Figure 5. Dependence between experimentally determined and calculated by RothC SOC stocks in a layer of 0–20 cm of the soil of long-term experiment in the period 1954–2015 for four treatments: (a)—control, (b)—1NPK, (c)—2NPK, (d)—3NPK.
Agronomy 10 01607 g005
Figure 6. The dynamics of humified organic matter carbon HUM pool (a) and the proportion of humified C to its total soil stock (b), calculated using the RothC model with monthly data.
Agronomy 10 01607 g006
Figure 7. The dynamics of decomposable plant material (DPM) (a), recalcitrant plant material (RPM) (b) and microbial biomass (BIO) (c) pools calculated from the RothC model. The graph (a) uses annual model data for July, (b,c) use monthly model data.
Agronomy 10 01607 g007
Figure 8. The dynamics of total SOC stocks for various crop rotations calculated using the RothC model for 2016–2090 in the control treatment under the RCP4.5 and RCP8.5 climate scenarios. The trend line is a polynomial of the second degree.
Agronomy 10 01607 g008
Figure 9. The dynamics of total SOC stocks for various crop rotations calculated using the RothC model for 2016–2090 in treatment 1NPK under the RCP4.5 climate scenario. The trend line is a polynomial of the second degree.
Agronomy 10 01607 g009
Figure 10. The dynamics of total SOC stock for various crop rotations calculated by the RothC model for 2016–2090 in 1 NPK treatment under the RCP8.5 climate scenario. The trend line is a polynomial of the second degree.
Agronomy 10 01607 g010
Table 1. Effect of fertilization on selected soil properties in the VNIISS experiment (2013).
TreatmentpH-KClN-NO3, mg·kg−1Available P2O5 mg·kg−1Available K2O mg·kg−1Hydrolytic Acidity cmolc·kg−1
Control 5.2114.21061532.8
1 NPK 5.1515.11301973.4
2 NPK 5.2425.21801913.6
3 NPK5.0524.81881913.1
Table 2. Statistical evaluation of the results of modelling the dynamics of organic carbon reserves using the Roth-C model in the long-term experiment of VNIISS.
Treatmentr 1RMSE 2EF 3CD 4M 5
Control (36)0.883.92−2.151.37−1.31
1 NPK (39)0.805.20−3.591.62−2.24
2 NPK (31)0.925.43−4.611.10−3.04
3 NPK (32)0.942.75−2.251.02−1.53
1 Correlation coefficient; 2 Root mean square error of the model; 3 Modelling Efficiency; 4 Coefficient of Determination; 5 Mean Difference.
Table 3. Simulated changes in SOC stocks in the upper 20 cm of four treatments of the experiment for the period from 1954 to 2015.
Changes in SOC Stocks Between 1954 and 2015
TreatmentControl1NPK2NPK3NPK
Absolute losses, t·ha−111.516.258.436.62
Relative loss, %−15.35−8.59−10.63−8.61
Relative losses per annum, %−0.25−0.14−0.17−0.14
Table 4. Indicators of organic carbon balance in the long-term VNIISS experiment (1954–2015).
Mean Annual Value, t·ha−1Treatments
Control1NPK2NPK3NPK
C input with plant residues, experimental, 1954–20151.4431.590
(88%)
1.637
(88%)
1.680
(89%)
C input with organic fertilizers, experimental, 1954–2015-0.218
(12%)
0.218
(12%)
0.218
(11%)
ΔC, 0–20 cm, model, 1954–2015−0.186−0.101−0.136−0.107
CO2 flux to the atmosphere1.6871.9472.0582.071
Table 5. The simulated increase in SOC stocks in the VNIISS experiment for the period 1964–1971.
The Increase in SOC Stock for the Period 1964–1971
TreatmentControl1NPK2NPK3NPK
Absolute values, t·ha−11.12.62.32.5
Relative values, %1.53.73.03.3
Relative values per annum, %0.20.50.40.4
Publisher’s Note: MDPI stays neutral with regard to jurisdictional claims in published maps and institutional affiliations.

