Article

Impact of Drought Exerted during Spike Development on Tillering, Yield Parameters and Grain Chemical Composition in Semi-Dwarf Barley Mutants Deficient in the Brassinosteroid Metabolism

1
Institute of Biology, Biotechnology and Environmental Protection, Faculty of Natural Sciences, University of Silesia, Jagiellonska 28, 40-032 Katowice, Poland
2
The Franciszek Gorski Institute of Plant Physiology, Polish Academy of Sciences, Niezapominajek 21, 30-239 Krakow, Poland
3
Department of Agroecology and Plant Production, University of Agriculture in Krakow, Mickiewicza 21, 31-120 Krakow, Poland
4
Department of Plant Breeding, Physiology and Seed Science, University of Agriculture in Krakow, 30-239 Krakow, Poland
*
Author to whom correspondence should be addressed.
Agronomy 2020, 10(10), 1595; https://doi.org/10.3390/agronomy10101595
Submission received: 25 September 2020 / Revised: 14 October 2020 / Accepted: 16 October 2020 / Published: 18 October 2020
(This article belongs to the Special Issue The Role of Growth Regulators in Crop under Abiotic Stress)

Abstract

:
Drought is a major factor limiting plant development and negatively affecting crop yield. It was reported that mutants defective in the brassinosteroid (BR) metabolism from several species, including barley (Hordeum vulgare), show improved tolerance to drought during the vegetative phase of growth. Hence, semi-dwarf barley mutants defective in the BR metabolism may be regarded as an alternative in breeding programs. Occurrence of drought during spike development has a profound effect on yield. Thus, determining reaction of the semi-dwarf, BR-deficient barley mutants to drought during the reproductive phase is crucial. This study was conducted on barley Near-Isogenic Lines defective in the BR metabolism and the reference ‘Bowman’ cultivar. The experiments were performed under laboratory (optimal watering and drought) and field conditions. The following yield-related parameters were analyzed: total tillering, productive tillering, average grain weight per plant and per spike, as well as weight of 1000 seeds. Additionally, an analysis of chemical composition of grain was performed. The BR-insensitive BW312 line showed the highest values of the productive tillering and grain weight per plant under the drought conditions. Perturbations in the BR metabolism did not have any significant deteriorating effect on the contents of grain chemical ingredients.

1. Introduction

Drought is a major environmental stress factor limiting plant development and reproduction. Consequently, it negatively affects yield of crop species [1,2]. Moreover, it was predicted that in the near future crop cultivation will encounter even more severe environmental conditions due to the ongoing global climate change [3]. Taking the above issues into account, according to current strategies in breeding programs priority should be given to developing the stress tolerant crop cultivars [4,5,6,7]. However, it should be kept in mind that over-expression of drought-responsive genes often leads to defects of plant growth and yield loss [6]. It is known that plant height is an important character contributing to plant architecture and adaptability to environmental conditions, which are directly associated with the yield potential [8,9]. Brassinosteroids (BRs) are a class of phytohormones which regulate a broad range of developmental and physiological processes and play a crucial role as modulators of plant architecture, and as a consequence, reaction to the environmental conditions [10]. This function of BR is pivotal for maintaining a balance between the processes of plant growth and stress tolerance [11]. It was postulated that modifications of plant architecture by manipulating the BR biosynthesis or signaling may be a feasible approach for improving crop yield [12]. Importantly, recent reports in the dicot and monocot model species Arabidopsis thaliana (thale cress) and Brachypodium distachyon (purple false brome), as well as in the important crops Oryza sativa (rice) and Hordeum vulgare (barley) indicated that mutants defective in the BR metabolism show a various degree of plant height reduction and an enhanced tolerance to drought [13,14,15,16,17,18]. It is known that cereal crops adapt to drought by decreasing their leaf size and delaying flowering [19]. It is also known that canopy biomass correlates with transpiration rate which has a negative effect on water use efficiency and sustainability under conditions of water scarcity [7]. Thus, semi-dwarf mutants of cereal crops may be regarded as pre-adapted to drought based on the stress-avoidance strategy [20,21]. It is known that erect, semi-dwarf plant architecture of cereal crops is preferred, as it allows better distribution of light within the canopy, enhances photosynthetic efficiency, nitrogen storage for grain filling, enables dense planting, and consequently results in yield increase [22,23,24,25]. Hence, the semi-dwarf mutant cultivars defective in the BR metabolism may be considered as an ideal plant phenotype and alternative in the future breeding programs [26,27]. Noteworthily, semi-dwarf cultivars of cereal crops have already significantly contributed to the yield increase, known as the ‘Green Revolution’, which was mainly achieved thanks to an improved lodging-resistance of these semi-dwarf cultivars [28]. Importantly, lodging is expected to become an increasing problem as the global climate change is supposed to increase the occurrence of strong winds and torrential rains [29,30]. Thus, in the face of global climate change and the predicted, increased occurrence of unfavorable weather conditions, the semi-dwarf, cereal cultivars may have a significantly improved yield potential based on their enhanced lodging-resistance and drought tolerance. As stated above, it was recently reported that mutants defective in the BR metabolism from several species, including barley, show improved tolerance to drought exerted during the vegetative phase of growth. However, it should be kept in mind that transition from the vegetative to generative phase of crop plant development is the most sensitive stage, and any stress encountered during this period severely affects the quantity and quality of grain yield [6,31]. Barley belongs to the most stress-tolerant crops; however, mechanisms of genetic and environmental regulation of metabolic adaptation to the stress conditions remain largely unknown [3]. Thus, determining reaction of the semi-dwarf, BR-deficient barley mutants to the drought occurring during the reproductive phase was crucial, and therefore was analyzed in the presented study. Studies on impact of the semi-dwarfing genes on yield were conducted mostly in rice and Triticum aestivum (wheat) and focused mainly on the gibberellin-related genes (Sd1 and Rht) [32,33,34,35]. Currently, knowledge about role of the endogenous BRs in regulation of spikelet development and differentiation is still very limited, even in the monocot model species—rice, and particularly under the drought conditions [36,37]. The major obstacle in this research stems from difficulties in excluding non-specific regulation and secondary responses from severe vegetative phenotypes [38].
Therefore, the presented study was aimed at shedding light on this aspect of the cereal crop development by determining several yield-related parameters and chemical grain composition in the semi-dwarf barley mutants deficient in the BR metabolism and a reference cultivar. Moreover, another goal of this study was to compare values of the yield-related parameters and chemical grain composition between different conditions of plant vegetation—a pot experiment, in which an optimal watering and water scarcity were applied under laboratory conditions, and a field experiment during which plants were grown under natural conditions. Based on these experiments, the role of the endogenous BRs and their signaling in the regulation of barley yield and the chemical grain composition under the various conditions of plant vegetation could be determined.

2. Materials and Methods

2.1. Plant Material

The experiments were performed on a group of semi-dwarf barley Near-Isogenic Lines (NILs) and the reference cultivar ‘Bowman’. The NILs represent semi-dwarf mutants which have been characterized genetically and physiologically in our previous study as being defective in the BR biosynthesis or signaling [26]. The NILs were developed as a result of recurrent crossings of the original semi-dwarf mutants into the genetic background of the ‘Bowman’ cultivar [39]. Owing to this approach, each of the NILs harbors a specific and mapped genomic introgression region, derived from the original mutant, in the homogeneous genetic background of the ‘Bowman’ cultivar which is shared by all the NILs [16]. The same genetic background of all analyzed genotypes simplifies comparative physiological analyses and interpretations [40].
In the present study the plant material included NILs defective in the BR biosynthesis: BW084 (brh13.p) carrying a missense mutation in the HvCPD gene, BW091 (brh3.g) in which a nonsense mutation in the HvBRD gene was identified, and BW333 (ert-zd.159) which harbors a missense mutation in the HvDIM gene. The genes encode enzymes which catalyze reactions at various stages of the BR biosynthesis pathway. Additionally, the material included NILs characterized by defects in the BR perception: BW312 (ert-ii.79) and BW885 (uzu1.a) which carry missense mutations in different domains of the HvBRI1 receptor. A detailed characterization of the mutations identified in these NILs was published in our previous publication [26]. Noteworthily, the BW885 (uzu1.a) line represents the lodging-resistant uzu mutant which served as a source of semi-dwarfism in barley breeding in East Asia and was introduced into many barley cultivars [41]. In the analyzed NILs the abnormalities in BR metabolism result in phenotypic alterations only in the above-ground part of the mutants, resulting in the semi-dwarf stature. Importantly, the mutations have no significant effect on the root anatomy and architecture [26]. Owing to this phenotypic feature, the NILs constitute an ideal material for the research on reaction of the semi-dwarf barley BR mutants to drought [16].

2.2. Plant Growth Conditions and Experimental Designs

2.2.1. Plant Vegetation under Conditions of Optimal Watering and Water Scarcity in the Pot Experiment

In the present study, one of the experiments (the pot experiment) was conducted initially in a growth chamber and later on in a vegetation hall (construction with transparent plastic roof and without sidewalls). Plants of all genotypes were growing initially in the growth chamber and later on were moved to the vegetation hall. Under these conditions plants of the above-described genotypes were grown in pots filled with a soil mixture (the same weight of the soil mixture in every pot). A detailed description of preparation of the soil mixture for plant cultivation and calculations of the maximum (100%) soil water capacity were published in our previous study [17]. Conditions of seed germination on Petri dishes and transfer of the 4-day-old seedlings to pots containing the soil mixture were also described by us previously [16]. In this experiment 10 plants were grown in each pot (width: 15 cm, length: 40 cm, height: 15 cm). Pots with seedlings were transferred to the growth chamber in which the vegetation conditions were the following: 12-h photoperiod, light intensity (250 μmol m−2 s−1; HPS Philips SON-T AGRO 400 W lamps), whereas the temperature on Days 4–7 of the experiment was 23 °C (day and night), on Days 8–28 of the experiment it was 18 °C/15 °C (day/night), on Days 29–99 of the experiment it was 22 °C/18 °C (day/night). On the 100th day of the experiment pots with plants were moved outside to the vegetation hall where plants continued their growth under natural conditions of temperature and light characteristic for June/July (Eastern European region). All plants of each genotype (the ‘Bowman’ cultivar and NILs) were watered optimally (70% of soil water capacity) until the 77th day of vegetation when pots with plants of each genotype were divided into two groups. Further, the first group of plants was watered optimally until the end of the experiment (full maturity of plants), whereas plants of the second group were growing for three weeks under water deficit due to watering cessation. Due to the watering cessation, soil water content was quickly decreasing until reached 25% of the maximum soil water capacity and this level of drought was maintained to the end of drought period. The soil water content was monitored in every pot on each day of the experiment and the only water supplementation was performed to balance an uneven water loss between the particular pots, if one occurred. The pots were weighed every morning and water was added to individual pots only to even their weight. Additionally, the pots were rotated each day in order to minimize the possibility of edge effect (faster water evaporation from the pots at the edge than from the pots in the middle). In the second group of plants, heading (moment at which spikes emerged from the leaf sheath) and spike development occurred during the drought. Drought symptoms were first observed in the ‘Bowman’ cultivar after 3–4 days from the watering cessation and manifested as leaf wilting, whereas in the semi-dwarf NILs it was manifested mainly as rolling of leaf blades along the longitudinal axis. After the three-week drought period, plants from the second group were watered again to restore the optimal soil water content, and optimal watering of this group was further maintained to the end of experiment. Plants of both groups (optimally watered control and drought stressed plants) continued their development until they produced yield. Upon reaching the full maturity, in plants of both groups, grown under the optimal watering (control) and drought conditions, the following parameters were determined: total tillering (including sterile tillers), productive tillering (number of tillers with spikes), grain weight per plant, average grain weight per spike, and weight of 1000 seeds. For each genotype 10 plants per pot in three replicates were analyzed under each vegetation condition (optimal watering/water scarcity). Heading time at which spikes emerged from the leaf sheath under the control and drought conditions is shown in Figure 1.

2.2.2. Vegetation and Plant Yield Analysis under the Field Conditions

The second experiment of this study was conducted under the field (natural) conditions in experimental plots of the University of Agriculture in Krakow, Poland. In March, upon germination on Petri dishes in the darkness, the 3-day-old seedlings of the analyzed genotypes were planted in the field. Plants of each genotype were grown in the field plots 1 m × 1 m after forecrop of leguminous plants. Plants of each genotype were cultured on three plots (three replicates) randomly localized in the field. Inside each plot three rows of plants were designed and distance between the rows was 25 cm (distance between plants within each row was 10 cm). Plants of all genotypes were grown under the field conditions up to the full maturity stage. Next, whole plants were cut off and the productive tillering was estimated for individual plants within genotype. Grains were collected and the following grain parameters were analyzed: grain weight per plant, average grain weight per spike, and the weight of 1000 seeds. Data concerning precipitation and temperature reported during the growing season when the field experiment was conducted and their comparison with the long-term records conducted in the years 1961–1990 are included in Supplementary Materials: Table S1.

2.3. Analysis of the Grain Chemical Composition

Grains produced by plants of the analyzed genotypes under the conditions of optimal watering and the water shortage occurring during the stage of spike development (the pot experiment), as well as under the field conditions were material of the chemical composition analysis. In this analysis 100 grains of each genotype produced under each of the above-mentioned (optimal watering/drought/field) conditions were analyzed. The grain chemical composition analysis was performed based on the near-infrared spectroscopy using the InfraXact™ analyzer produced by the Foss company (Hillerod, Denmark). The analysis was conducted in three technical replications per sample. Each sample was scanned six times and compared with two internal standards (references) before calculation of mean value. The measurements were conducted in the following range of wave lengths: 570–1850 nm. The following parameters in the grains of the analyzed genotypes were analyzed: contents of dry mineral matter (ash), fiber, proteins, starch, and lipids.

2.4. Statistical Analysis

Representation of individual plants of each genotype in each replication and the number of replicates performed for each analysis/measurement were described above. Statistical differences were calculated based on the Duncan test (p ≤ 0.05) with use of the Statistica program. The statistical analyses were performed separately for the optimally watered plants (control) and the drought-stressed plants. The mean values are presented in the figures together with standard deviations and letters informing about the statistical significance of the reported differences. Comparison of the parameters’ values, which were obtained in each genotype, between the control and drought conditions was conducted using Student’s t-test.

3. Results

3.1. Total Tillering and Productive Tillering under the Conditions of Optimal Watering and Drought Exerted during Spike Development (the Pot Experiment)

The first of the analyzed yield-related parameters was total tillering (total number of tillers, including sterile tillers) of plants of the analyzed genotypes under the optimal watering conditions (control) and after the drought stress. Under the control conditions the highest mean value of this parameter was reported in the BR-insensitive line BW312, on average 10.7, which constituted ca. 141% of the value reported in the ‘Bowman’ cultivar and was significantly (p ≤ 0.05) higher than values reported in the other genotypes. Differences in the total tillering reported between the other genotypes were not statistically significant (Figure 2).
An analysis of impact of the water scarcity during the spike development allowed for an interesting observation: the drought stress resulted in a significant increase in the total tillering in almost all analyzed genotypes (except the BW312 line in which the total tillering under the drought conditions reached a value similar to the one reported in this line under the control conditions). Under the drought conditions in the majority of analyzed genotypes the values of total tillering were similar (Figure 2).
Analysis of the productive tillering parameter (number of tillers with spikes) under the control and drought stress conditions led to a few observations: under the control conditions in all the analyzed genotypes values of this parameter were very similar, and the observed differences were not statistically significant (Figure 3).
Under the drought conditions the highest mean values of the productive tillering were reported in the BR-insensitive line BW312 (7.75) and the BR-deficient line BW091 (7.09), however, the value reported in the BW312 line was significantly (p ≤ 0.05) higher than in the rest of genotypes and constituted ca. 145% of the value reported in the ‘Bowman’ cultivar. Interestingly, the lowest value of this parameter (5.33) was observed in the ‘Bowman’ cultivar (Figure 3).

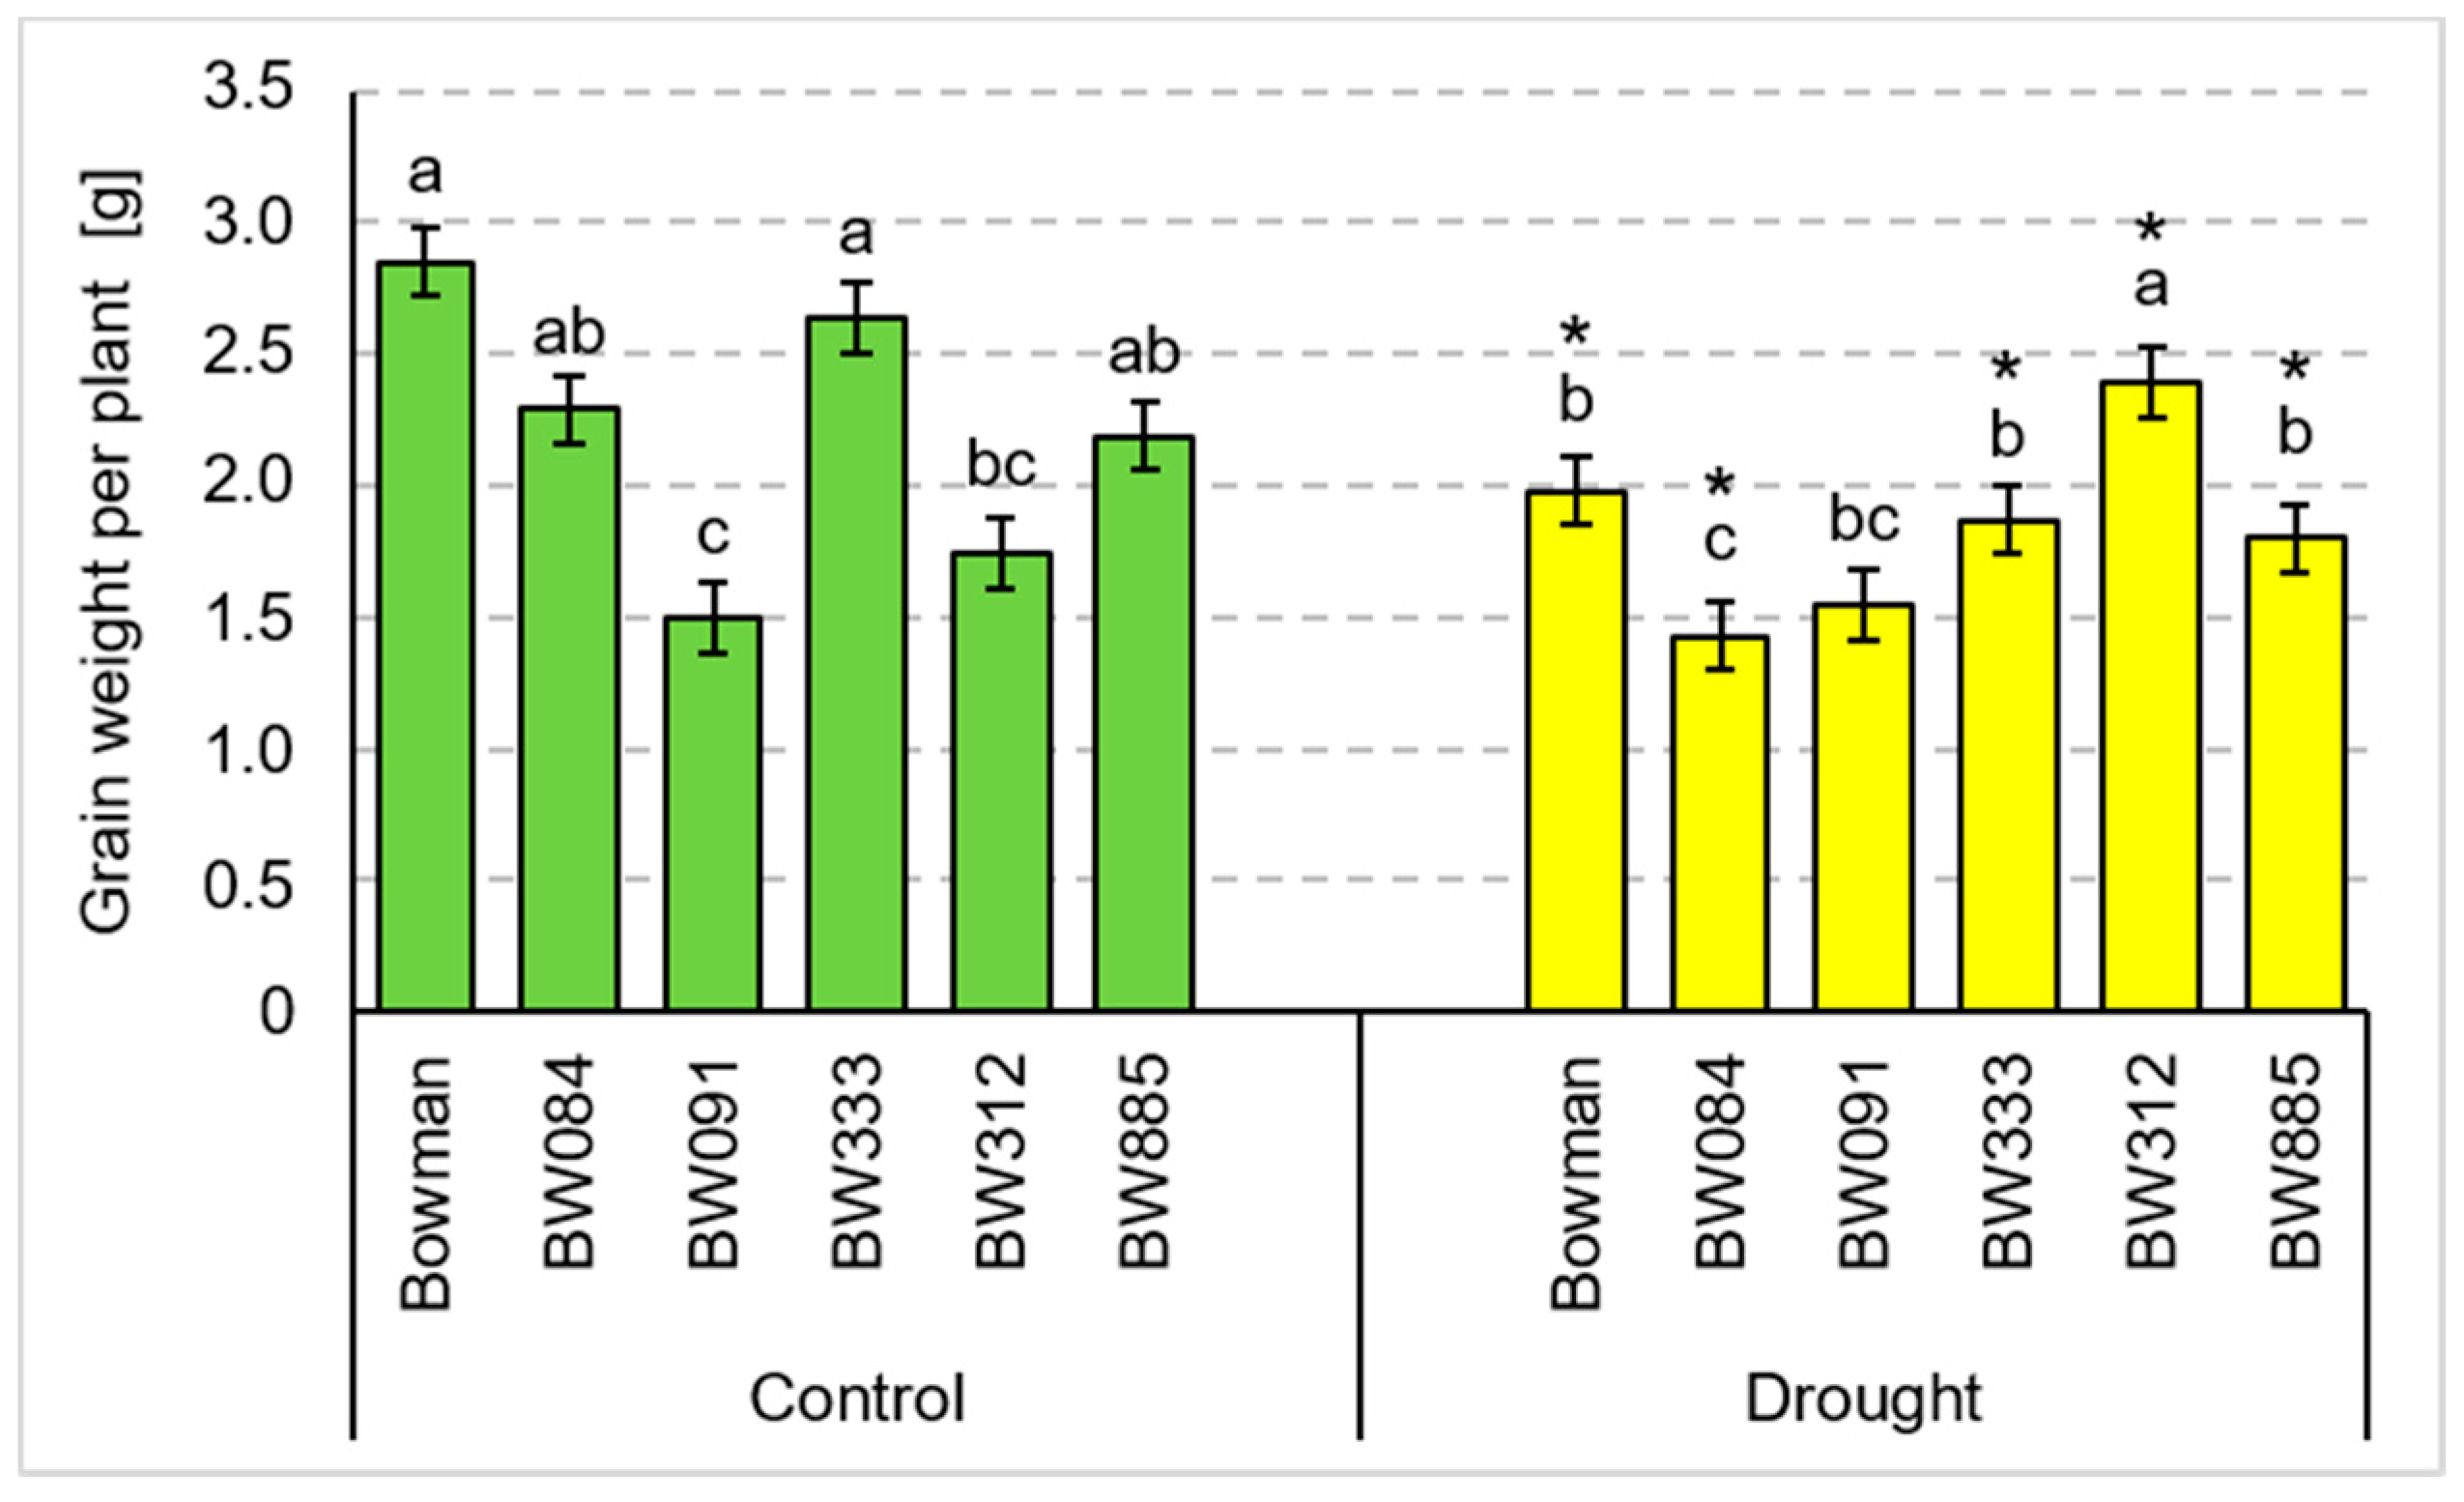
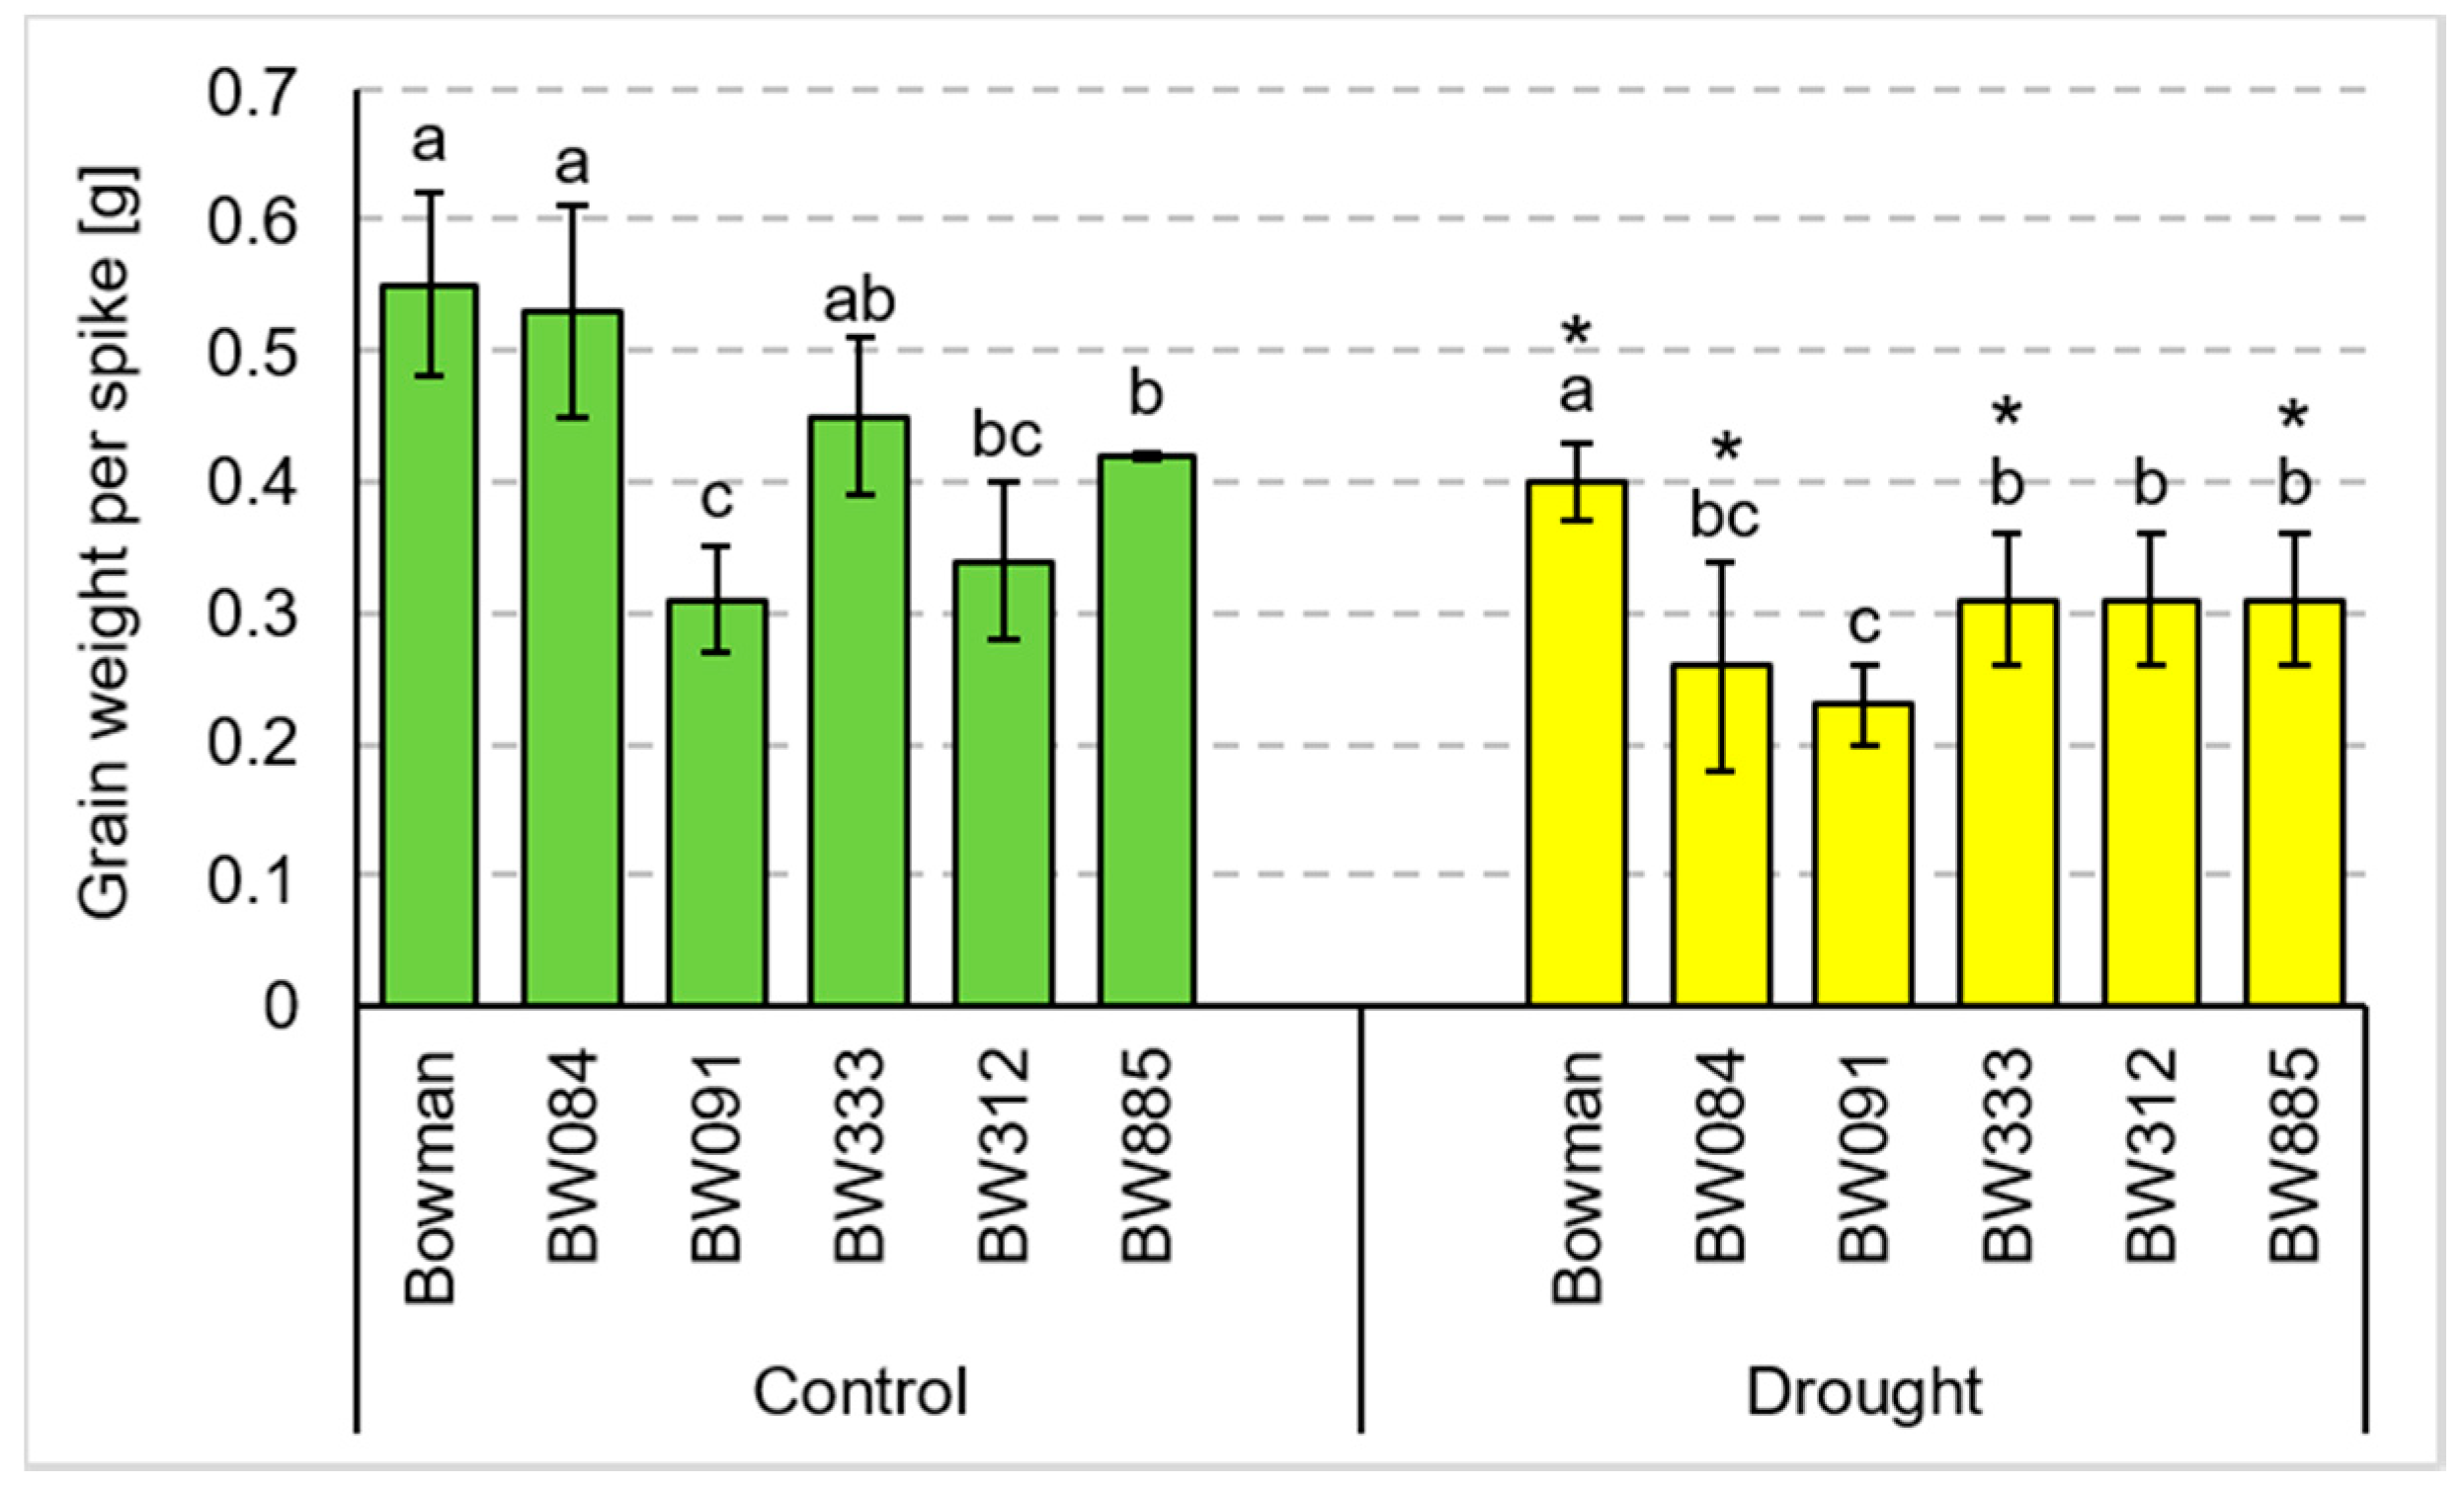
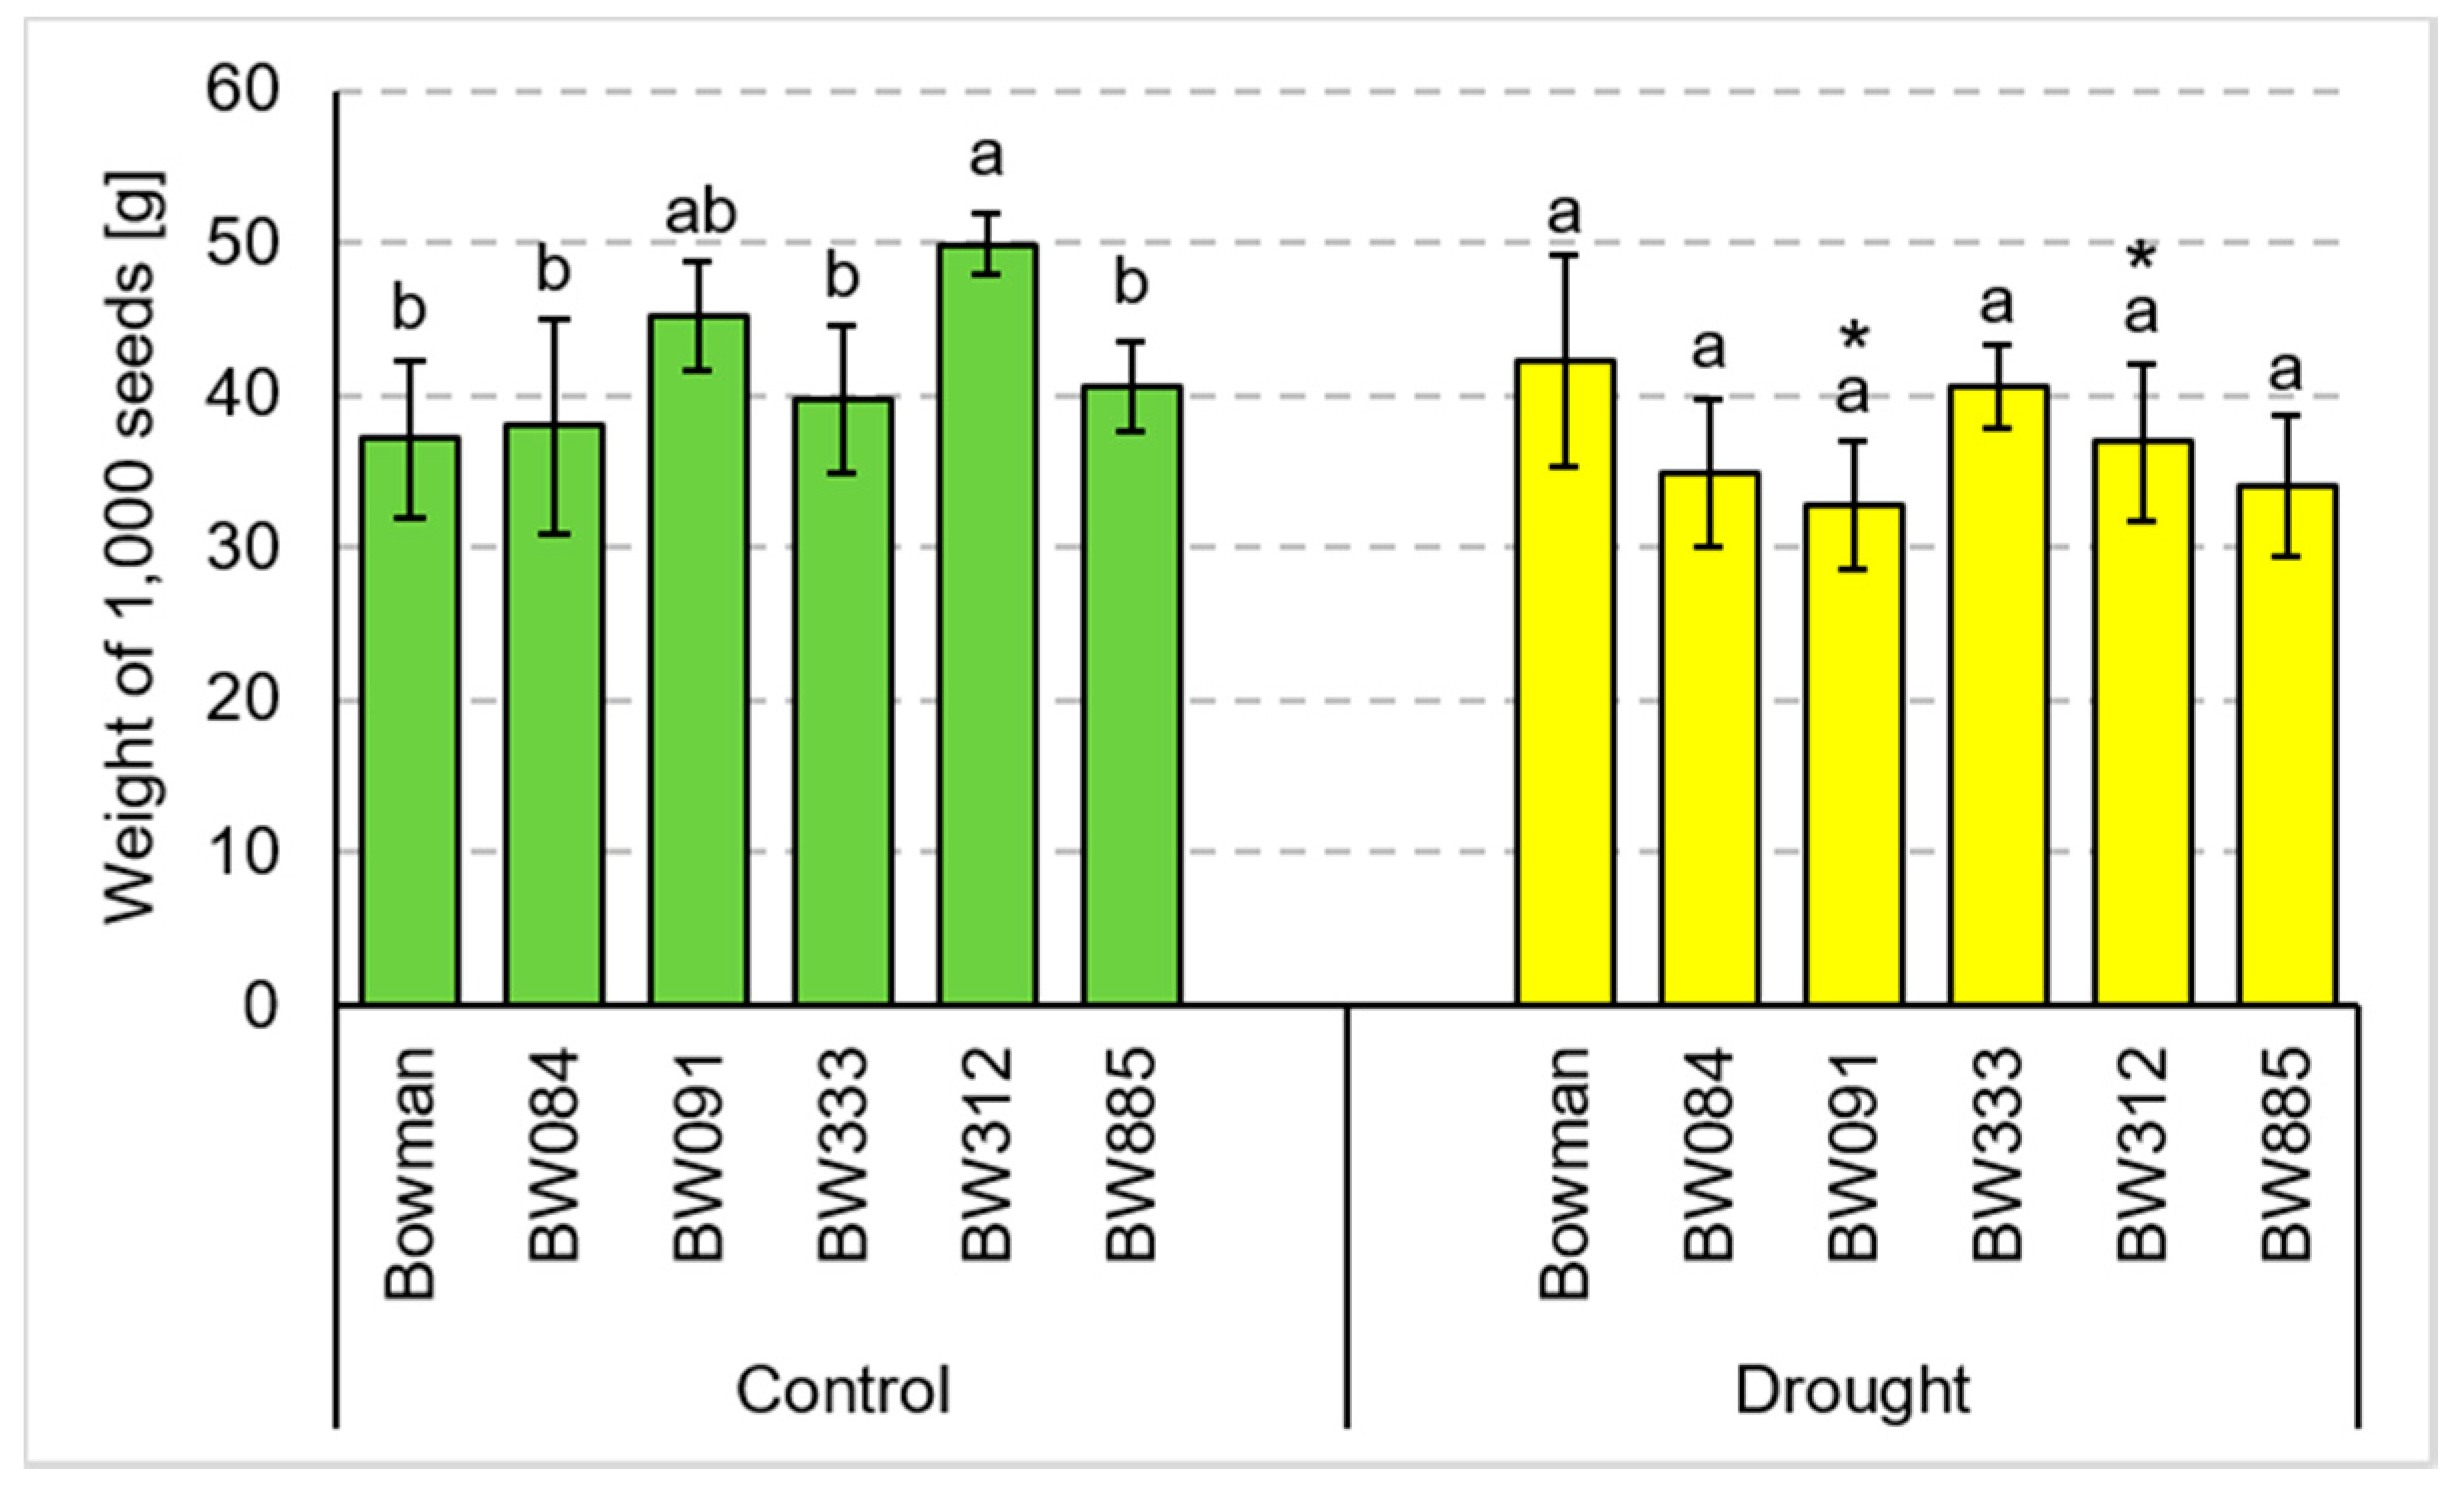
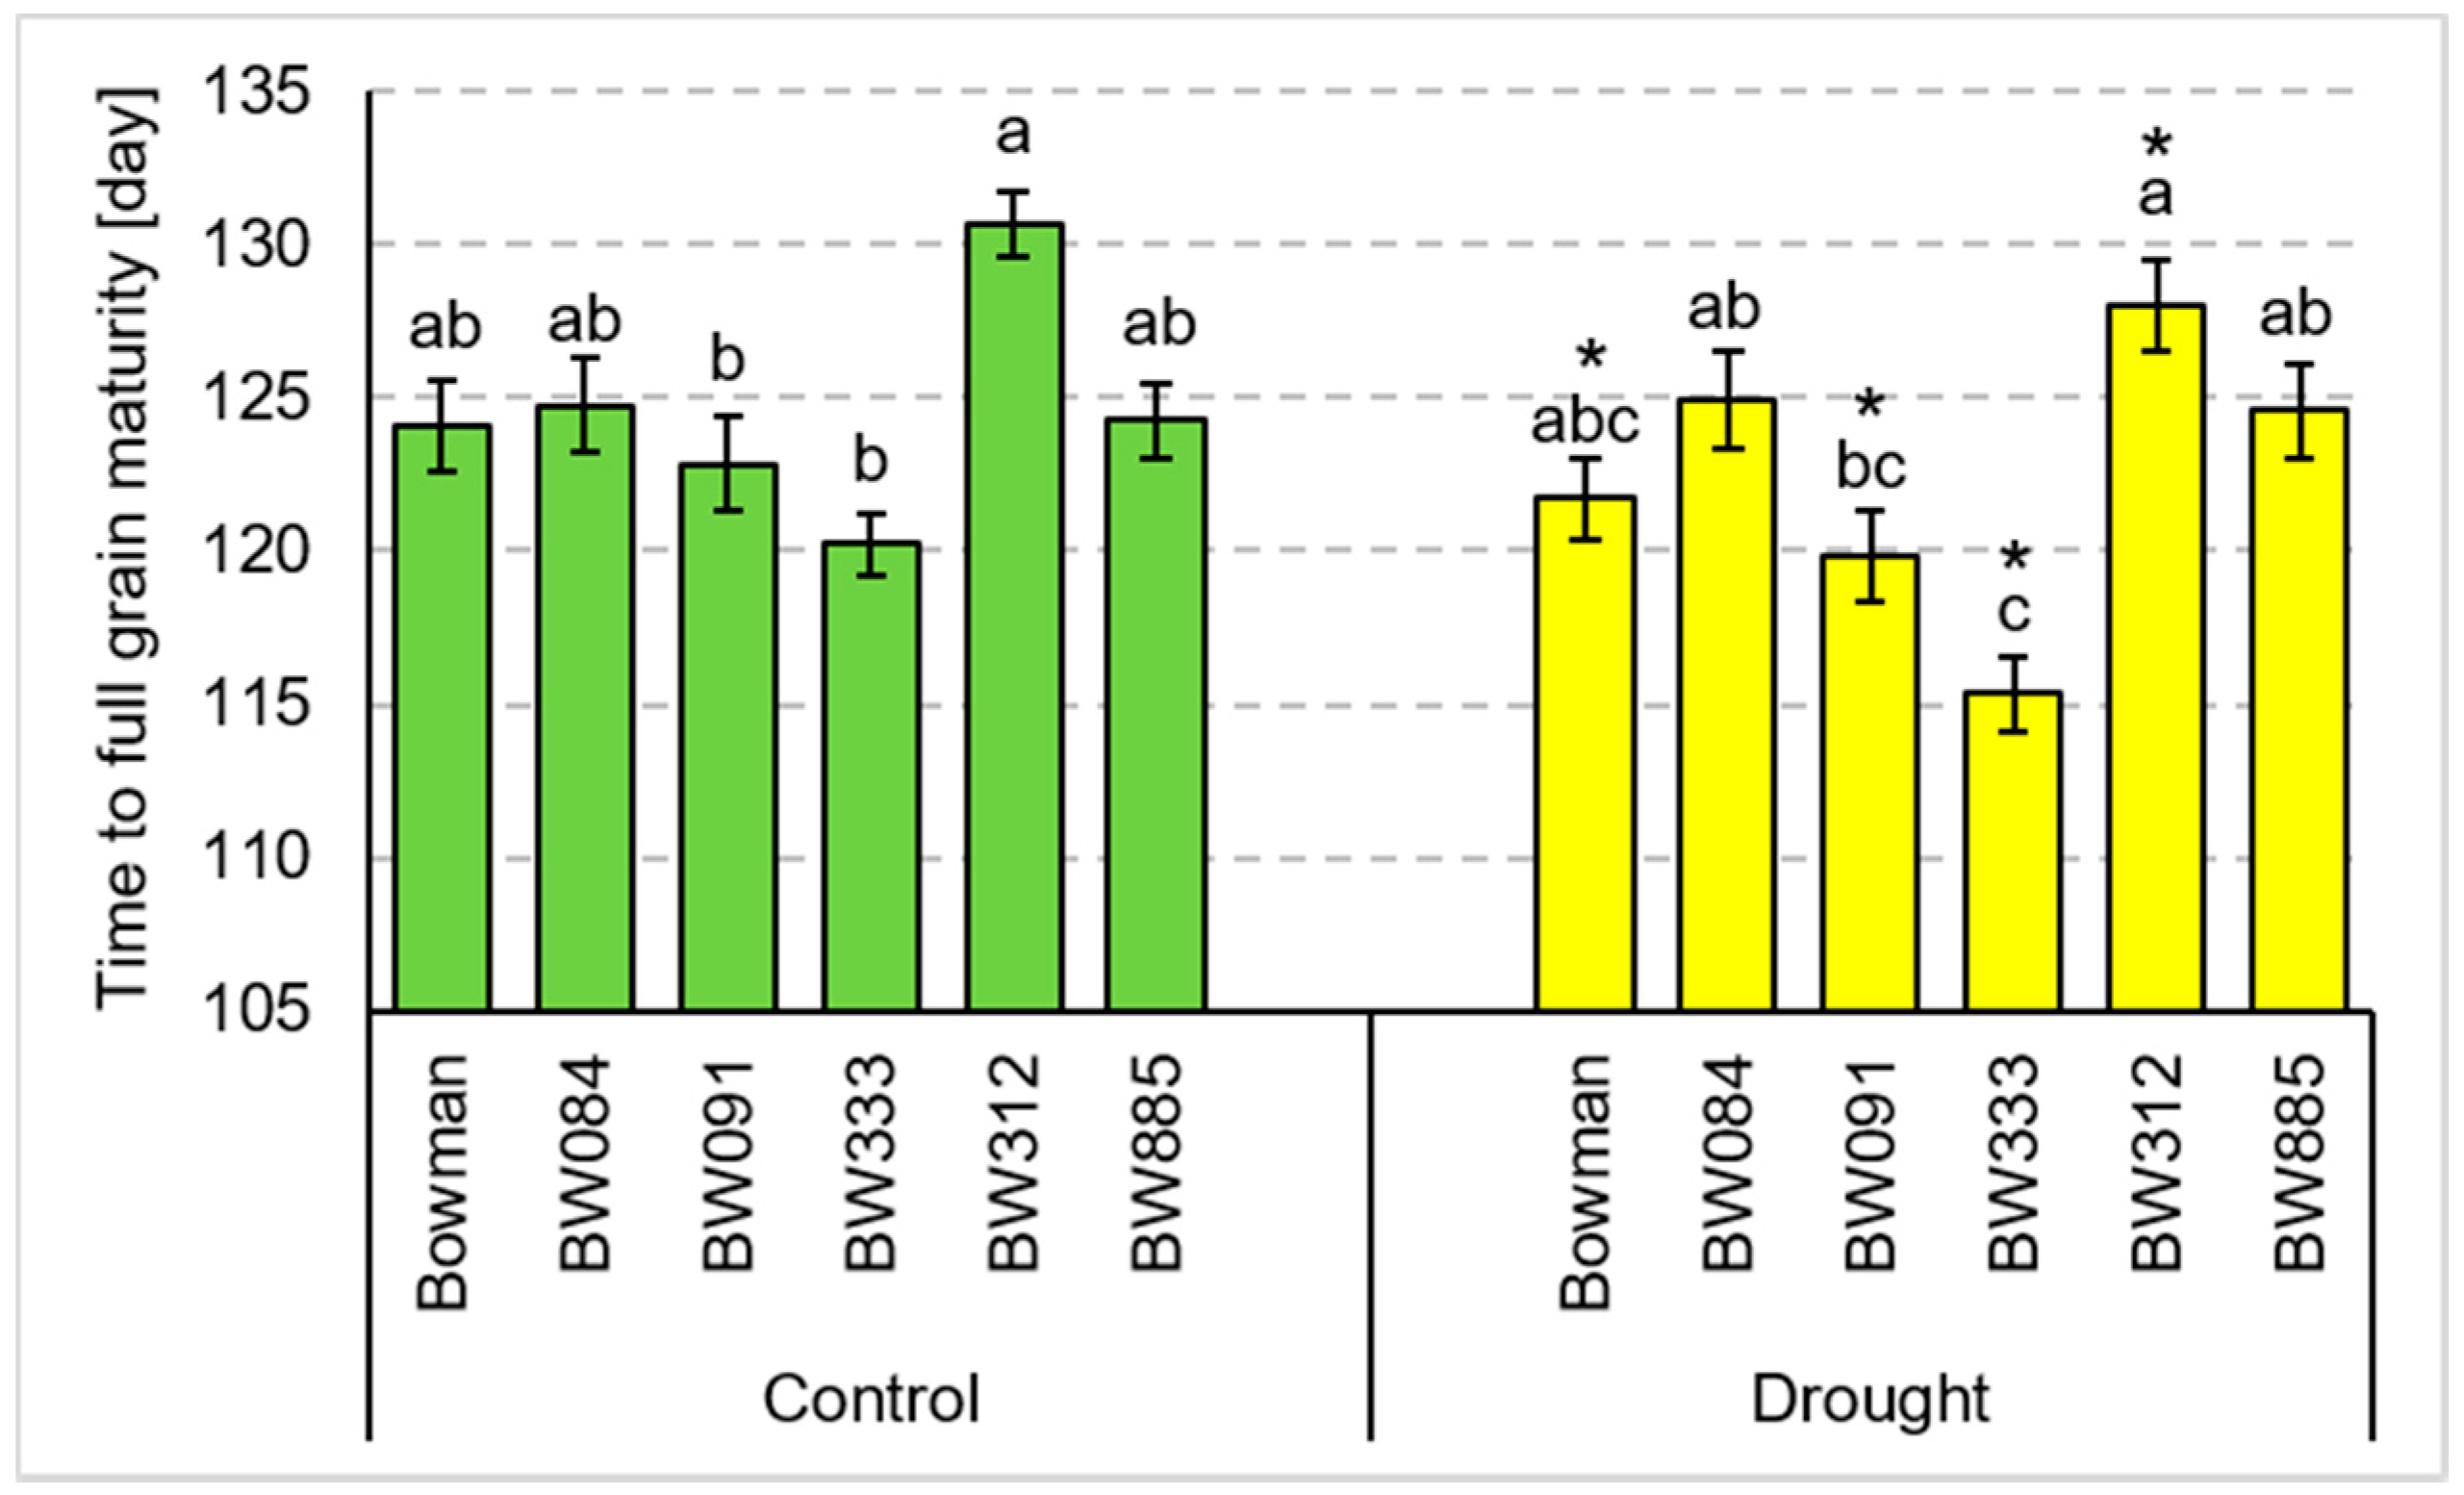
3.2. Yield Parameters under the Conditions of Optimal Watering and Drought Exerted during Spike Development (the Pot Experiment)

As far as an average grain weight per plant is concerned, under the control conditions the analyzed genotypes showed some diversity in values of this parameter. The highest mean values were reported in the ‘Bowman’ cultivar (2.85 g) and in the BR-deficient line BW333 (2.64 g), and difference between these values was not statistically significant. Under the drought conditions the highest value of the grain weight per plant (2.39 g) was observed in the BW312 line, and this value was significantly (p ≤ 0.05) higher than in the rest of genotypes (Figure 4). This result seems to correlate with the above-described productive tillering under the drought conditions which was the highest in the BW312 line.
Among the analyzed genotypes, diverse values of the average grain weight per spike were reported. However, under both control and drought conditions the highest values of this parameter were observed in the ‘Bowman’ cultivar (Figure 5).
As far as the weight of 1000 seeds is concerned, under the control conditions the majority of the analyzed genotypes (including the ‘Bowman’ cultivar) showed similar values of this parameter. Nevertheless, it should be mentioned that under the optimal watering conditions the highest values of this parameter were reported in the BW312 line (49.9 g) and the BW091 line (45.1 g). However, the value reported in the BW312 line was significantly (p ≤ 0.05) higher than in the rest of genotypes. Under the drought stress conditions in all analyzed genotypes similar values of this parameter were reported, and the observed differences were not statistically significant (Figure 6).
In order to fully describe the yield parameters of the analyzed genotypes under the control and drought conditions, an analysis of time required for full grain maturity was performed. Under the control conditions the highest value of this parameter (130.6) was observed in the BW312 line. Under these conditions another observation was also made: generally in the BR-deficient lines (BW084, BW091, and BW333), the time required for full grain maturity was similar or lower when compared with the ‘Bowman’ value, whereas in the BR-insensitive lines (BW312 and BW885) the values of this parameter were similar or higher than in the ‘Bowman’ cultivar (Figure 7).
Generally, drought resulted in shortening of the time required for full grain maturity (except the BW084 and BW885 lines in which the values reported under the stress conditions were very similar with the ones observed under the control conditions). However, a similar tendency was observed as under the control conditions: generally in the BR-deficient lines the time of full grain maturity was similar or lower when compared with the ‘Bowman’ value, whereas in the BR-insensitive lines the values of this parameter were similar or higher than in ‘Bowman’ cultivar (Figure 7).

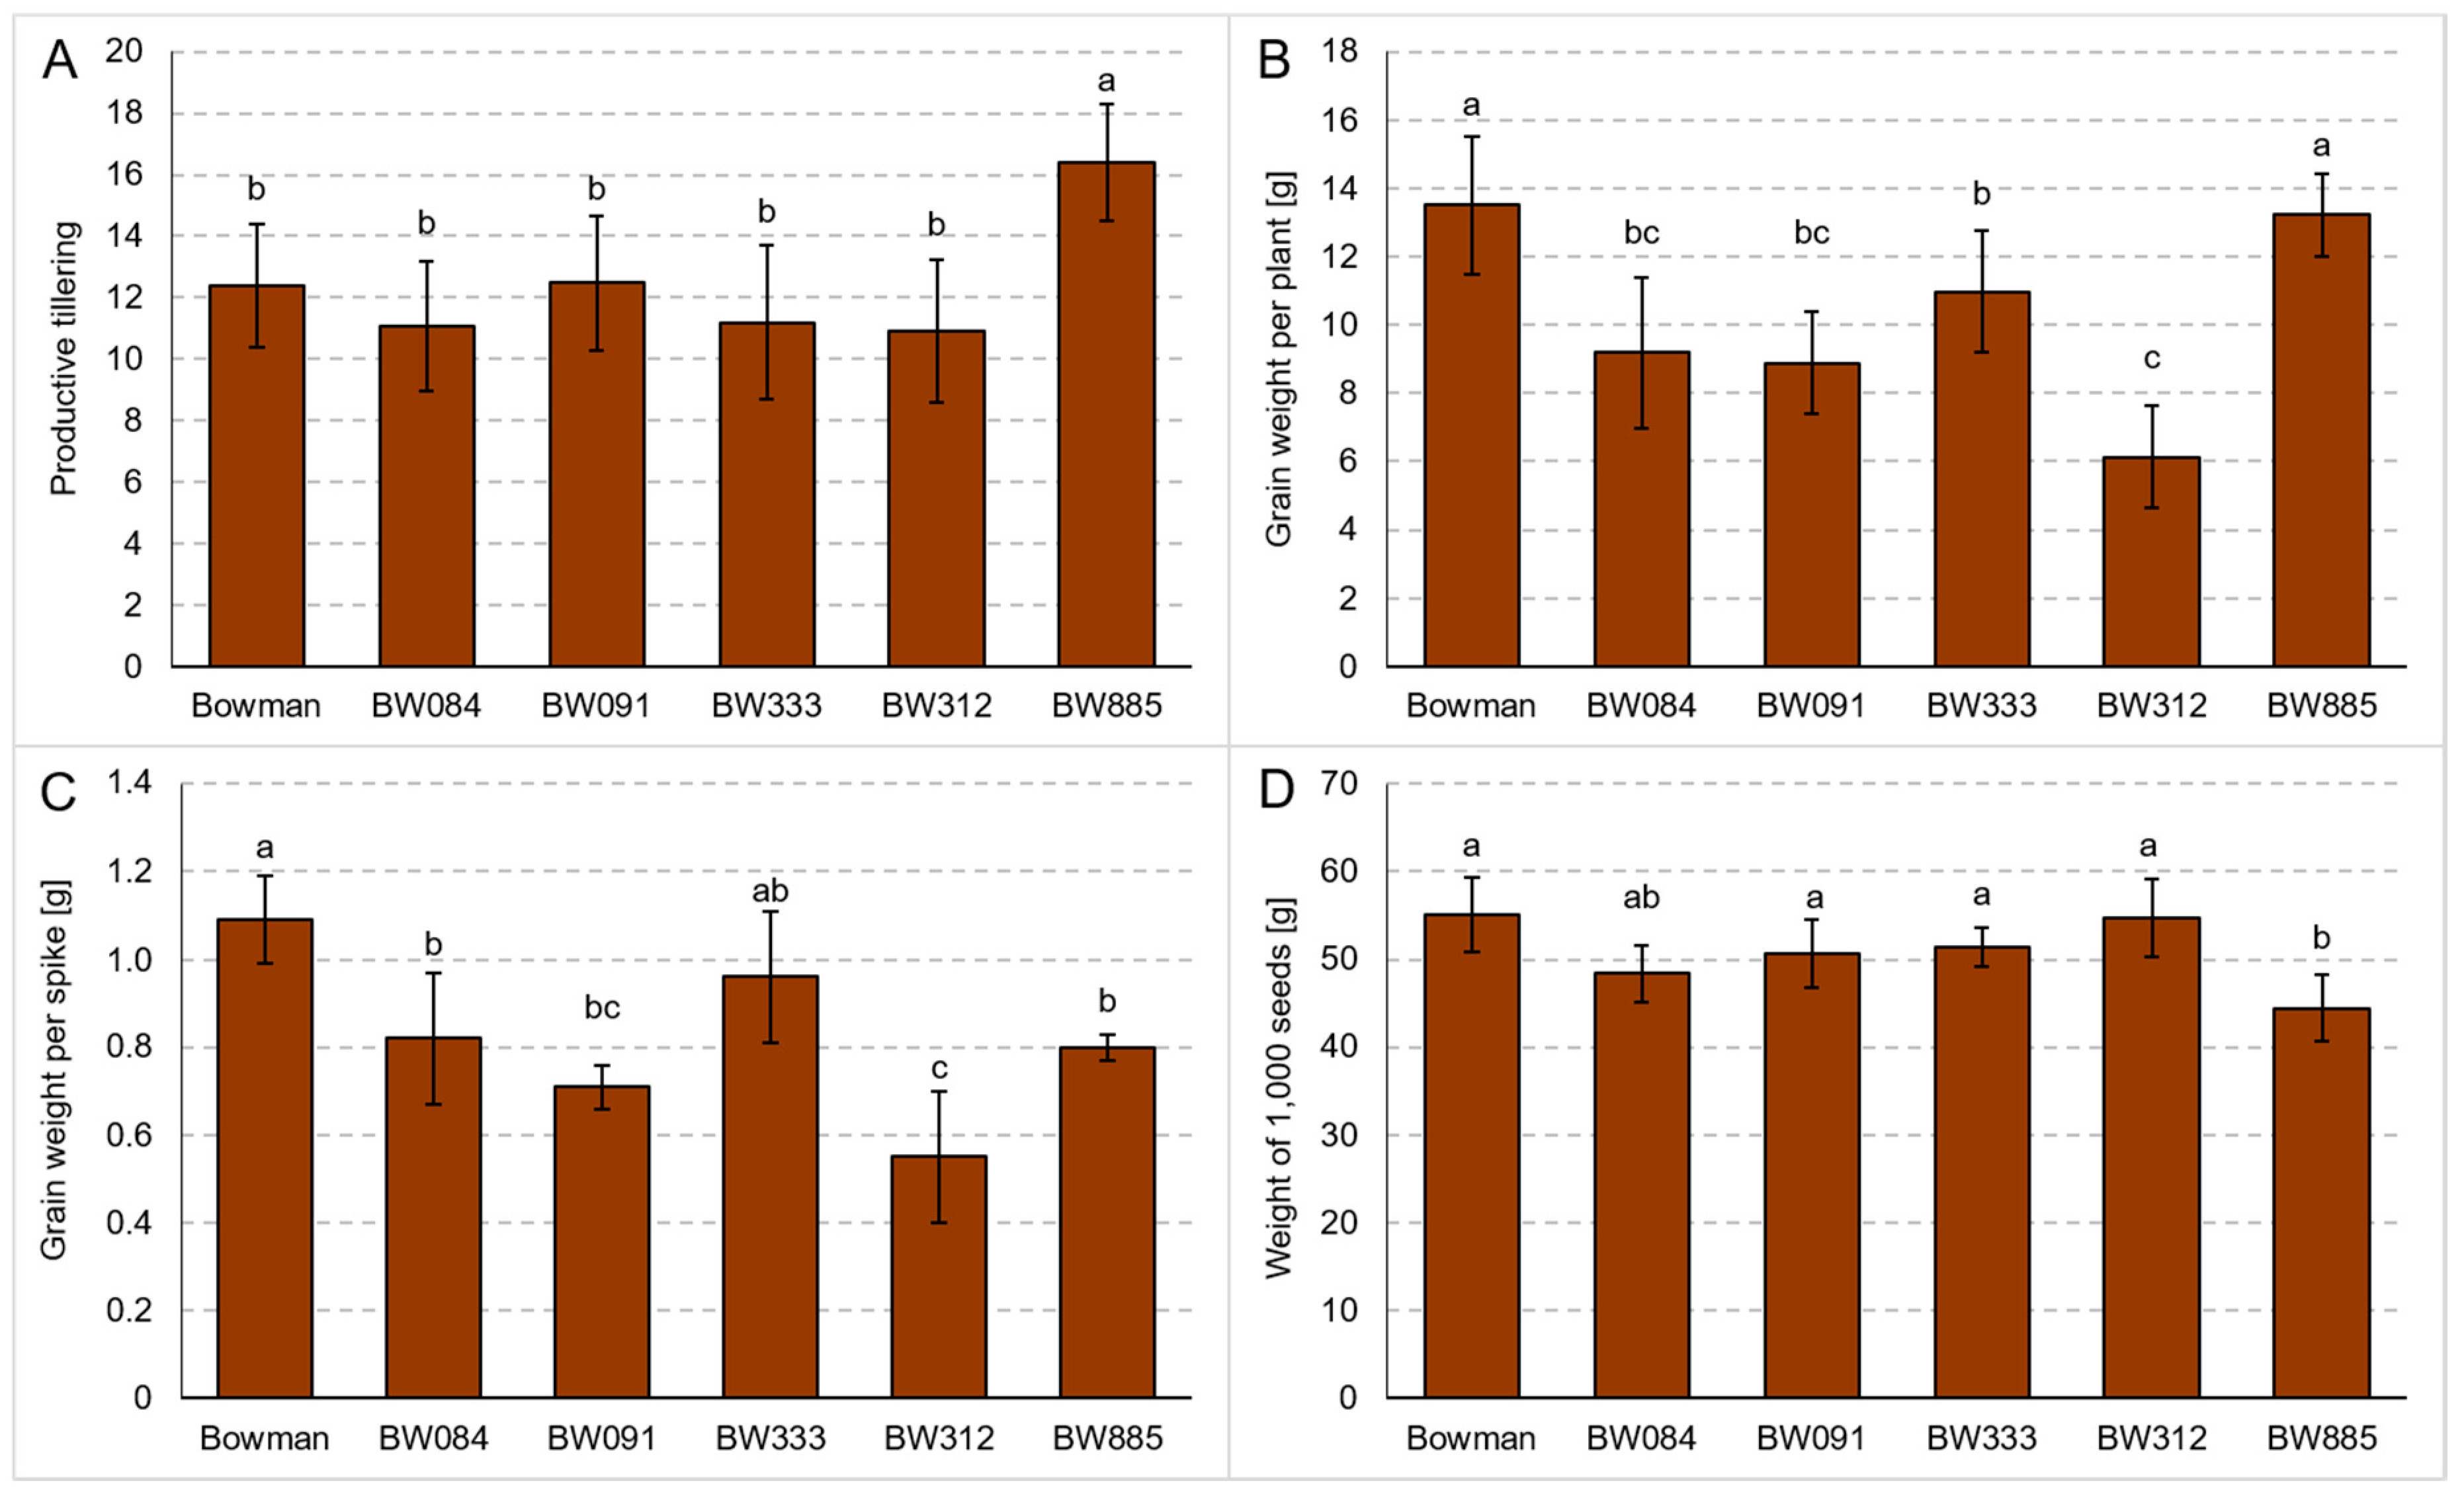
3.3. Tillering and Yield Parameters under the Field Conditions

Upon reaching the full maturity under the field conditions, plants of the analyzed NILs exhibited semi-dwarf, erect stature, and an average height of the mutant plants constituted from 62% (in BW091) to 84% (in BW333) of the average height of the ‘Bowman’ plants. Under the field conditions, the highest value of the productive tillering was reported in the BW885 line, and the value was significantly (p ≤ 0.05) higher than in the rest of genotypes. No statistically significant difference was observed between the other NILs and the ‘Bowman’ cultivar (Figure 8A).
As far as the average grain weight per plant is concerned, under the field conditions, the highest values of this parameter were reported in the ‘Bowman’ cultivar and the BW885 line (difference in the values of this parameter between the ‘Bowman’ cultivar and the BW885 line was not statistically significant) (Figure 8B). It may be hypothesized that the high value of this parameter in the BW885 line results from the highest value of the productive tillering which was reported in this line (described above).
Under the field conditions, the highest value of the average grain weight per spike was reported in the ‘Bowman’ cultivar, and in the analyzed NILs the observed values were diverse. In the analyzed NILs the average grain weight per spike constituted from ca. 50% (BW312) to 88% (BW333) of the value reported in the ‘Bowman’ cultivar (Figure 8C). Hence, the high value of the average grain weight per plant, which was observed in the BW885 line, seems to result mainly from the highest value of the productive tillering which was reported in this line.
The last of yield parameters analyzed under the field conditions was the weight of 1000 seeds. The highest values of this parameter were reported in the ‘Bowman’ cultivar and the BW312 line. The other genotypes showed similar values of this parameter, whereas the lowest weight of 1000 seeds was observed in the BW885 line (Figure 8D).

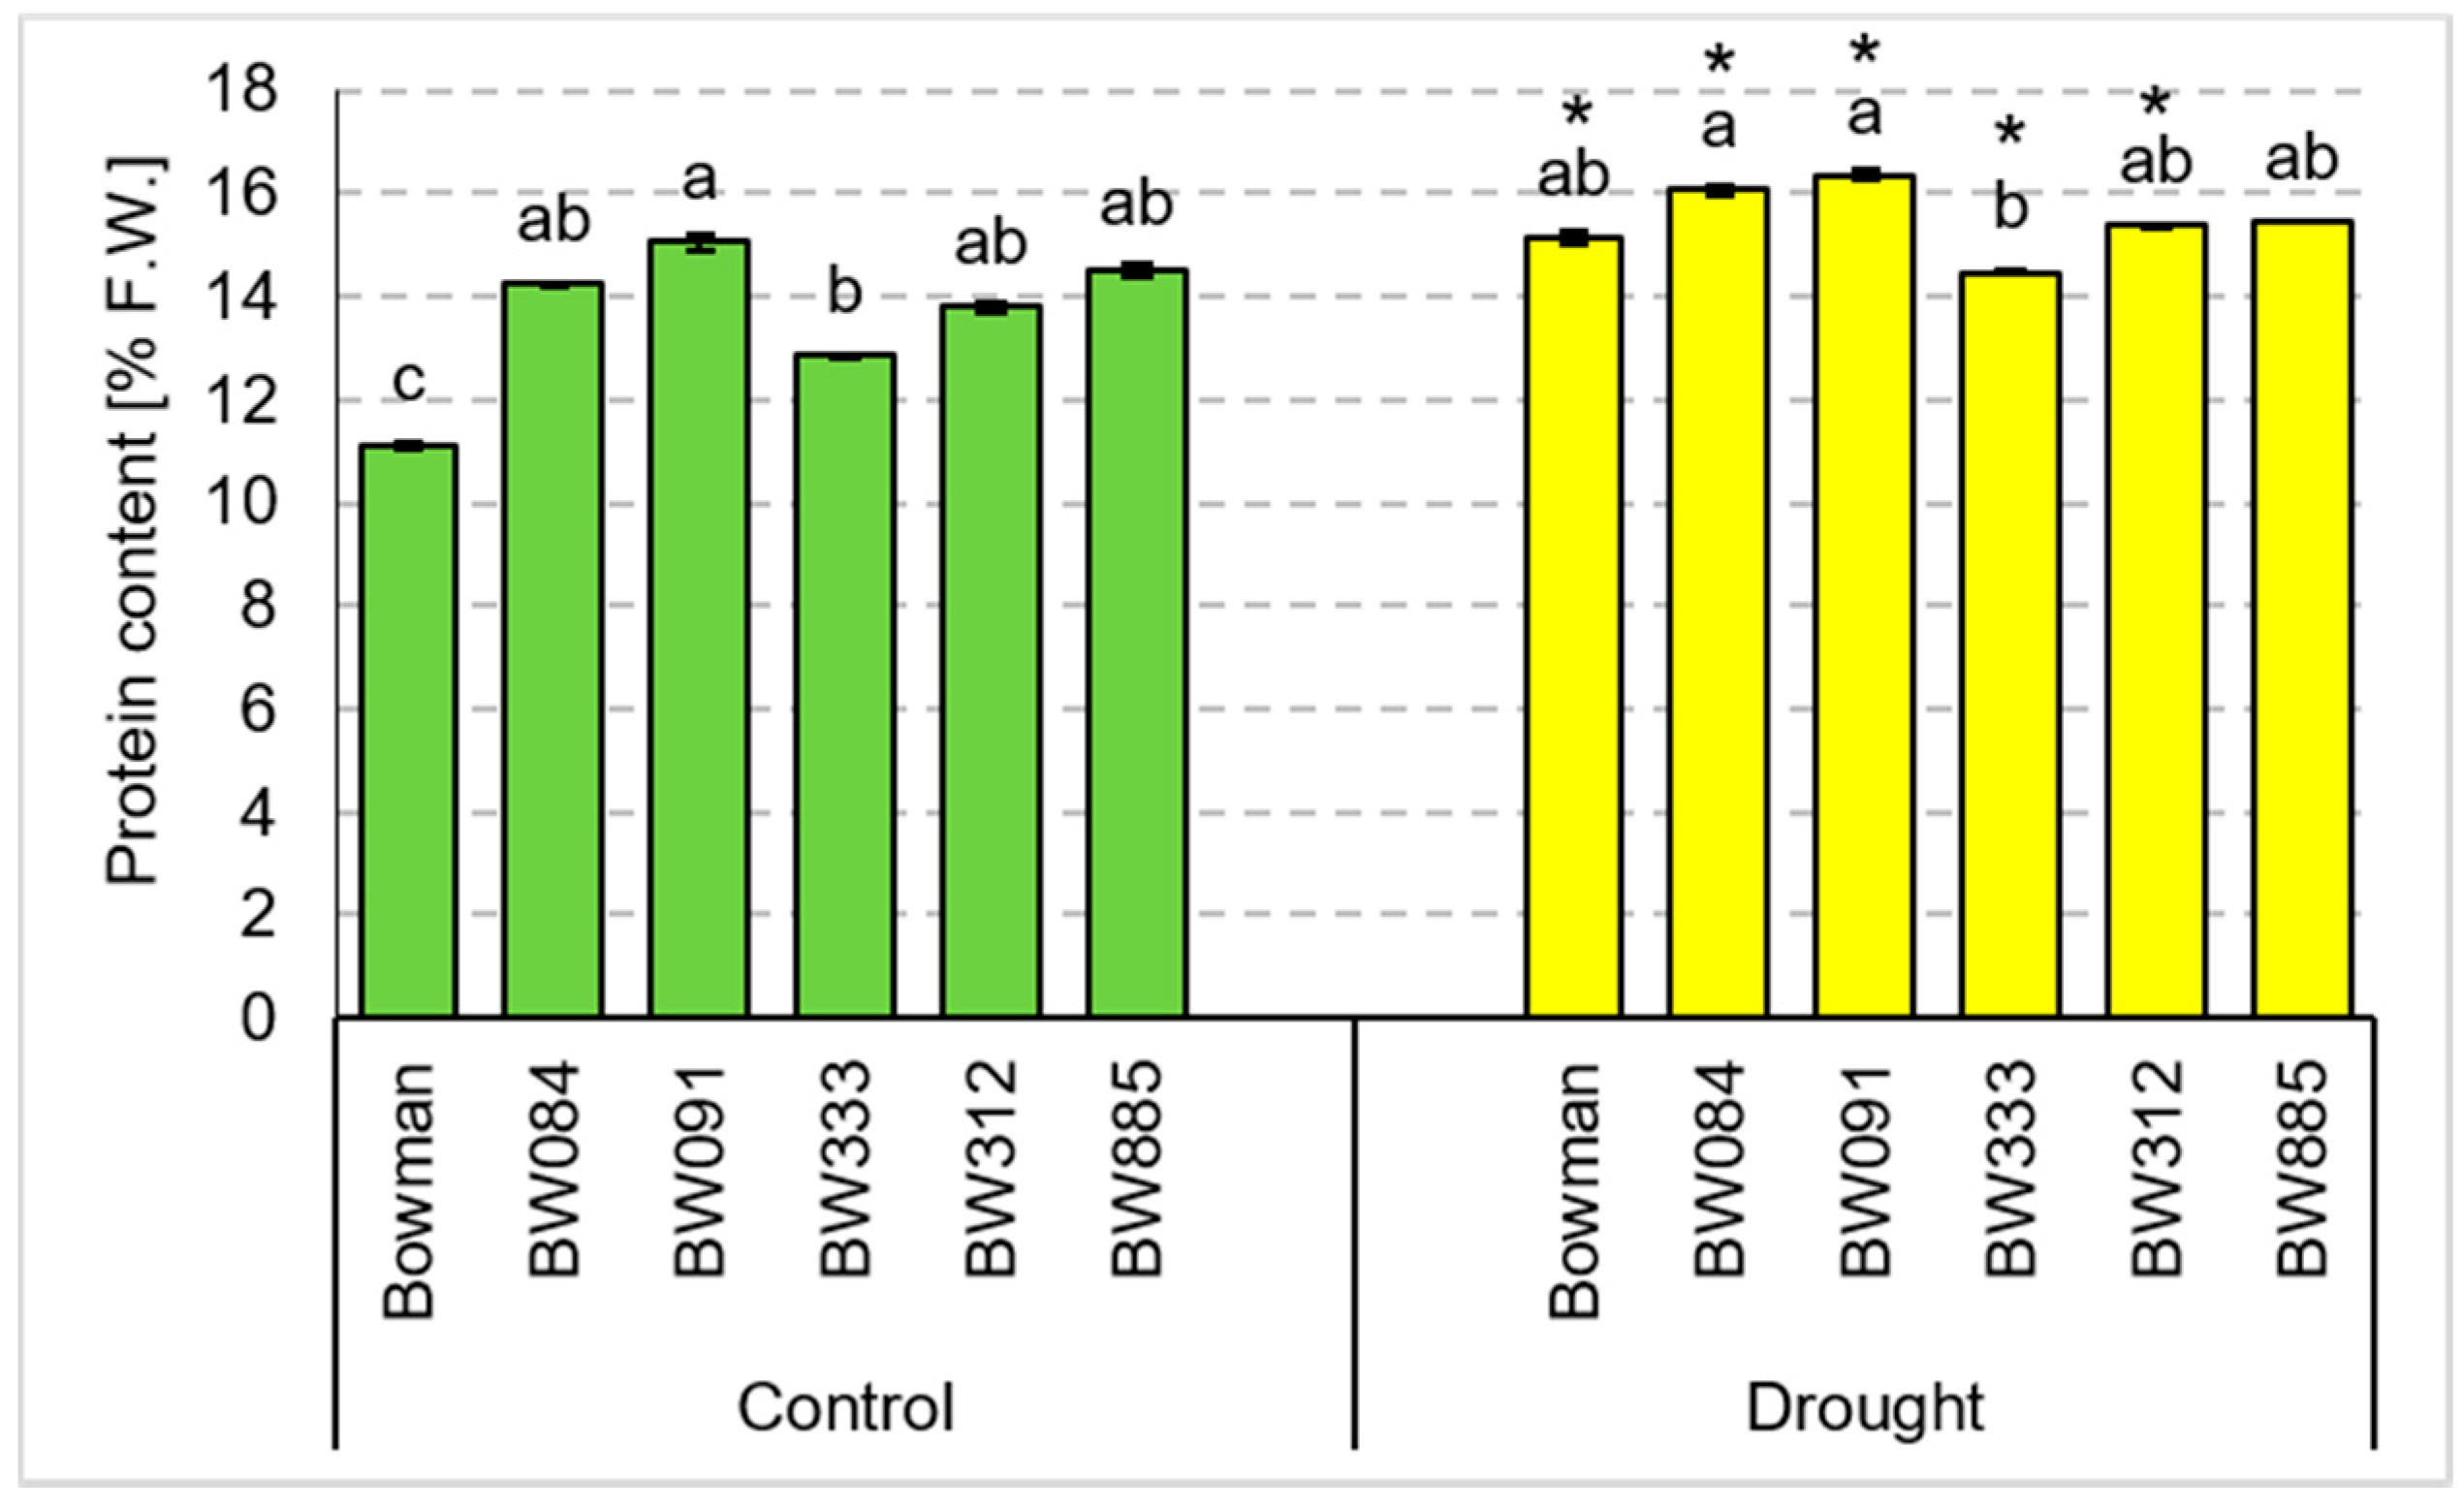
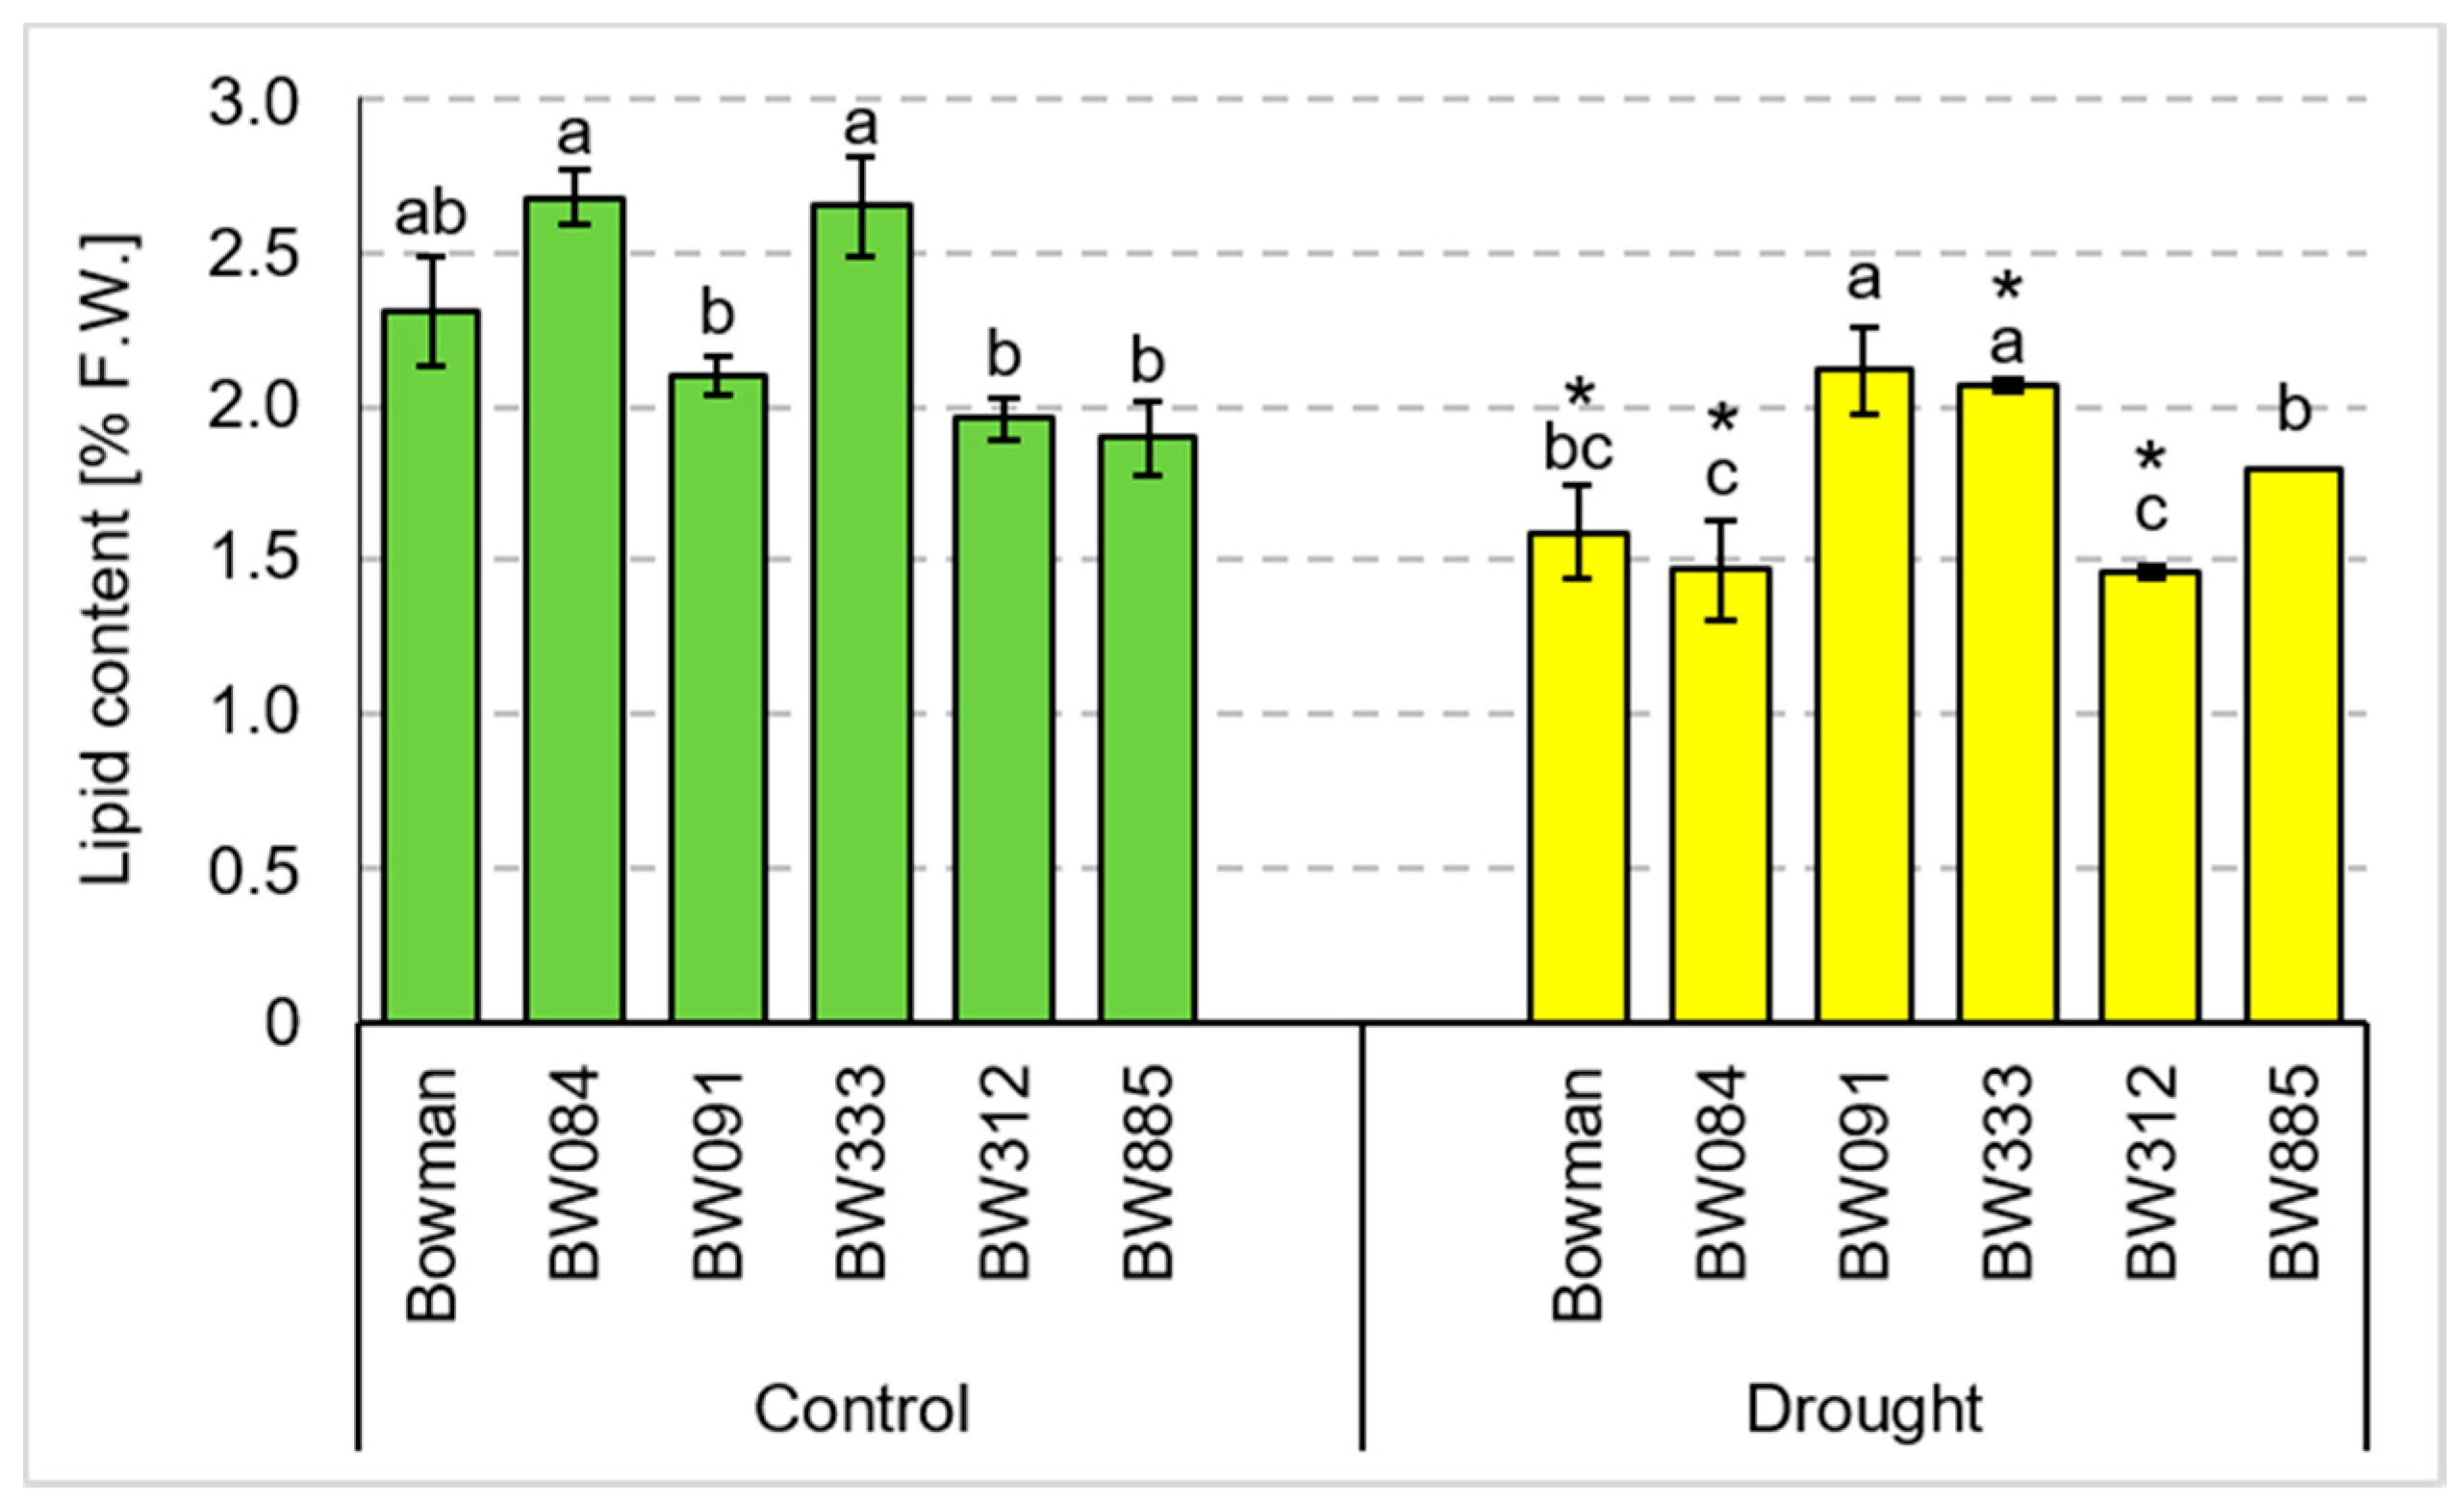
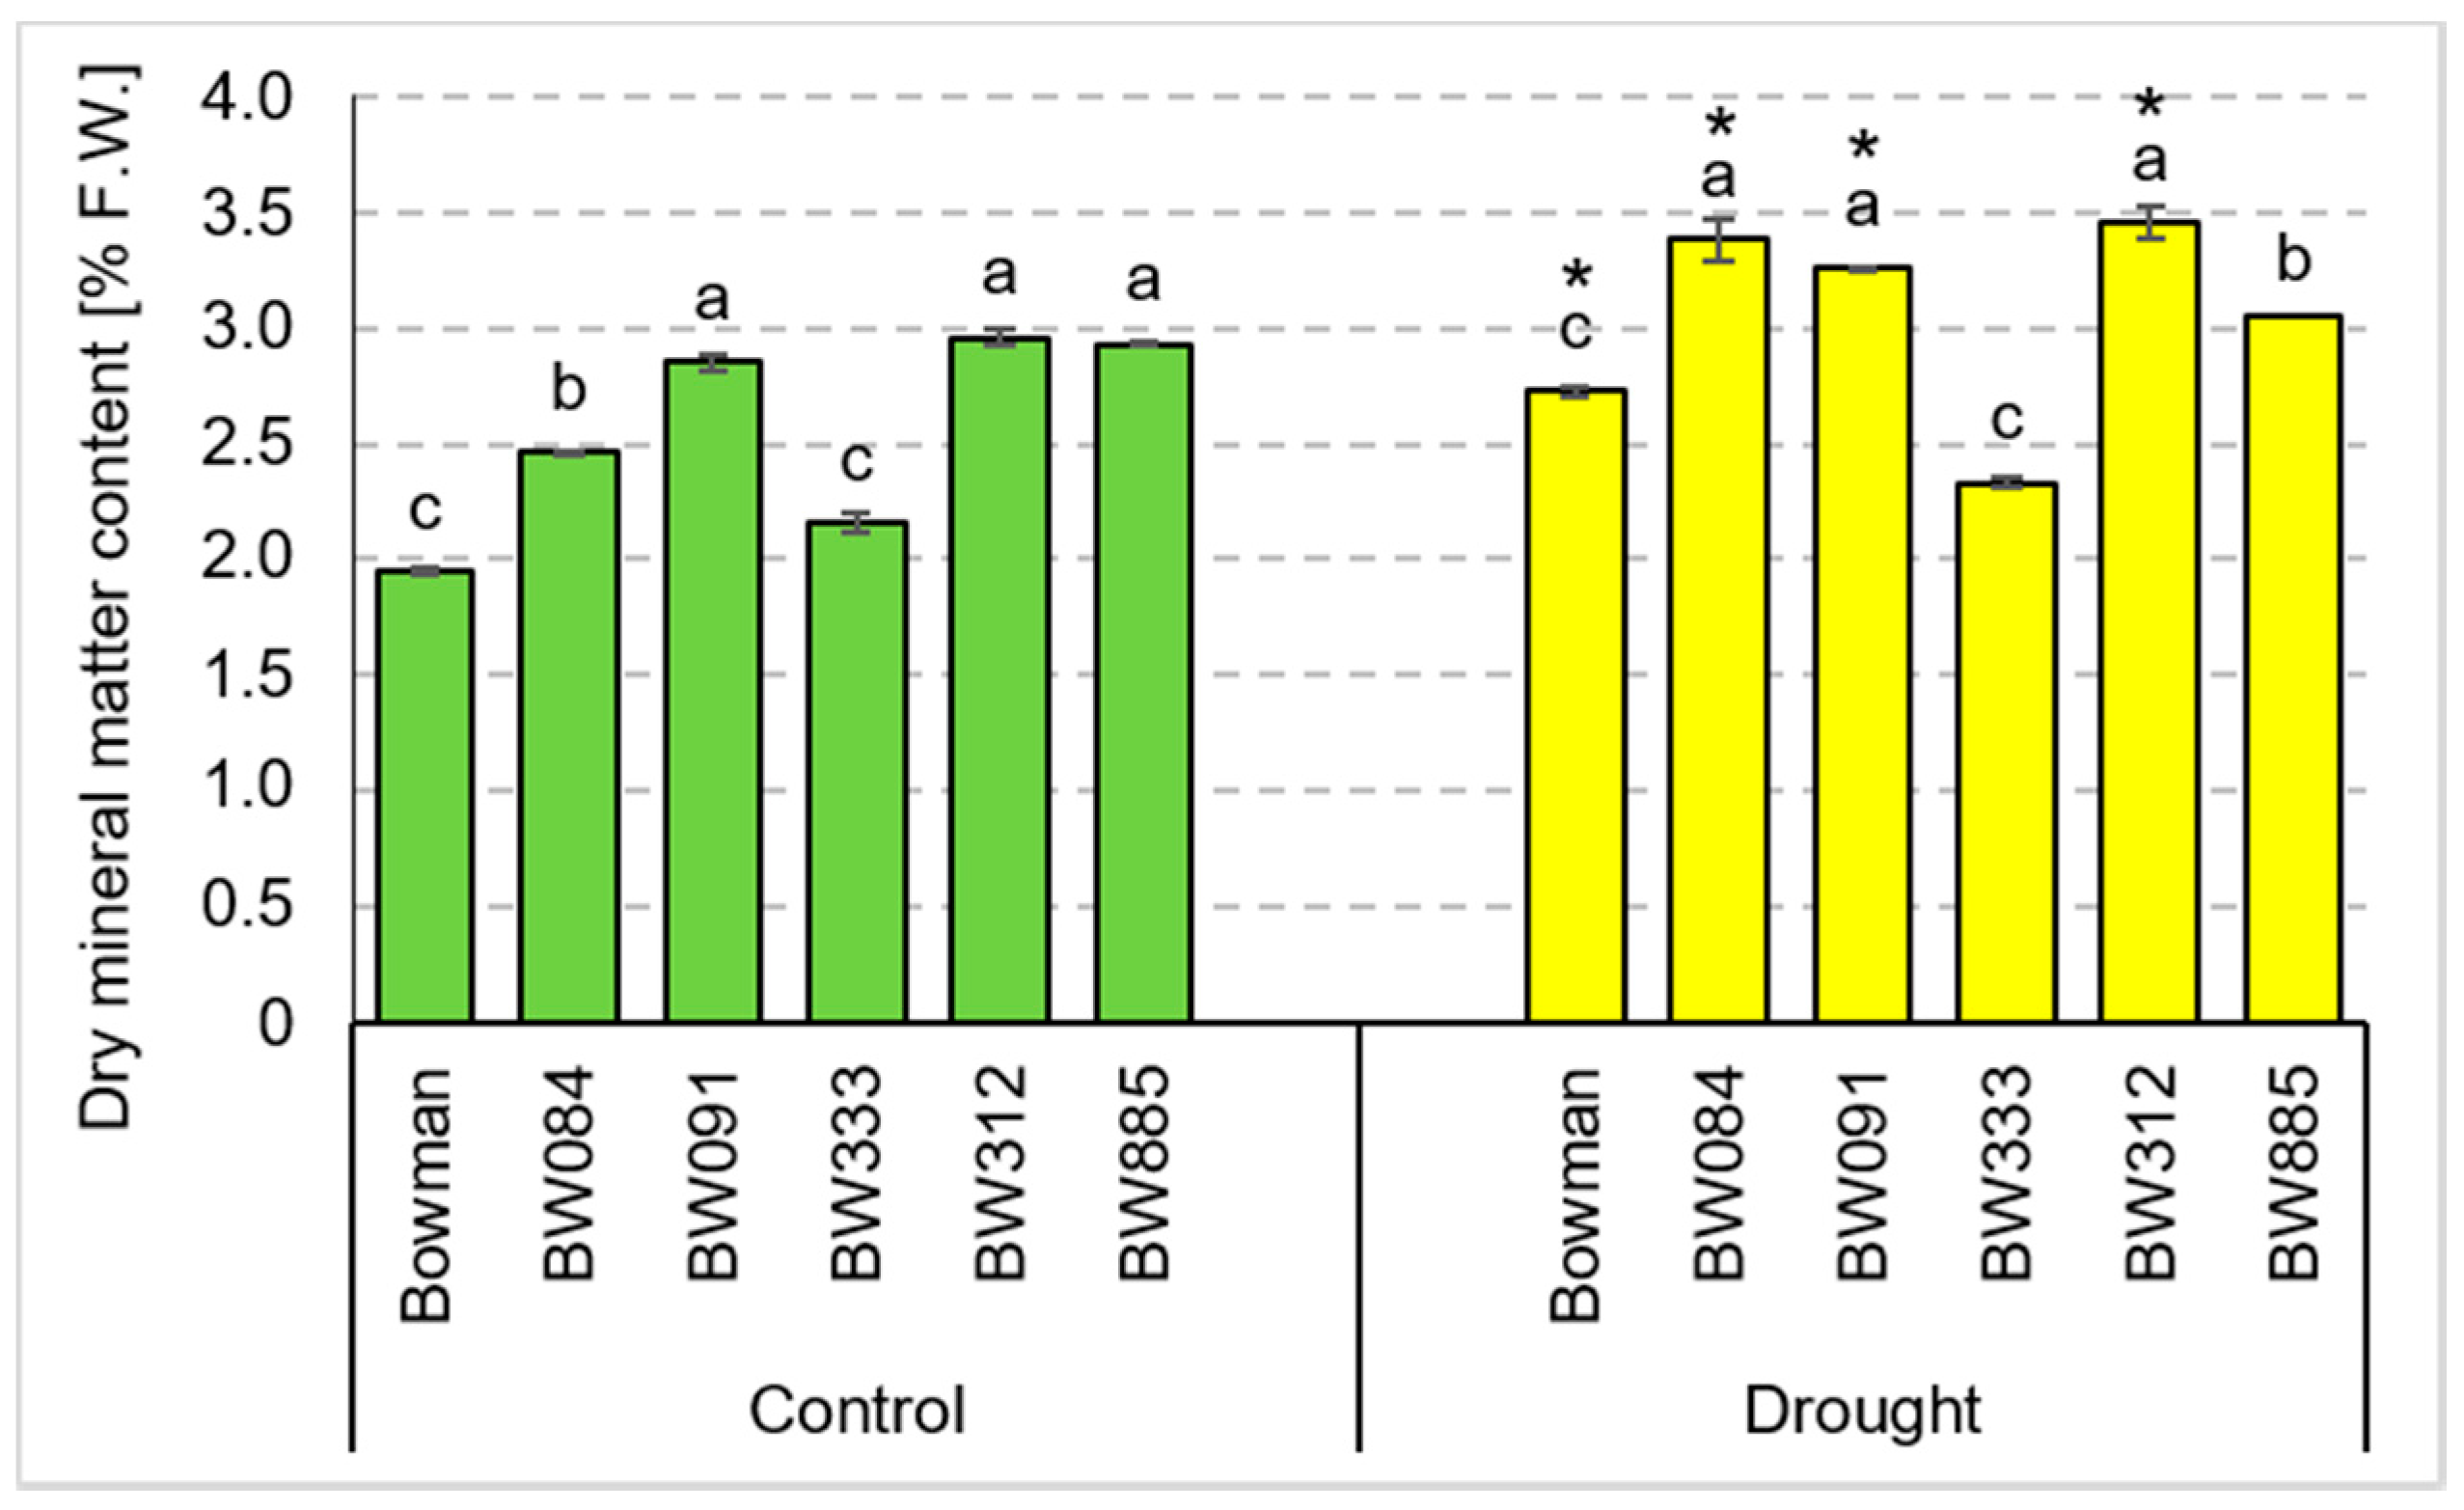
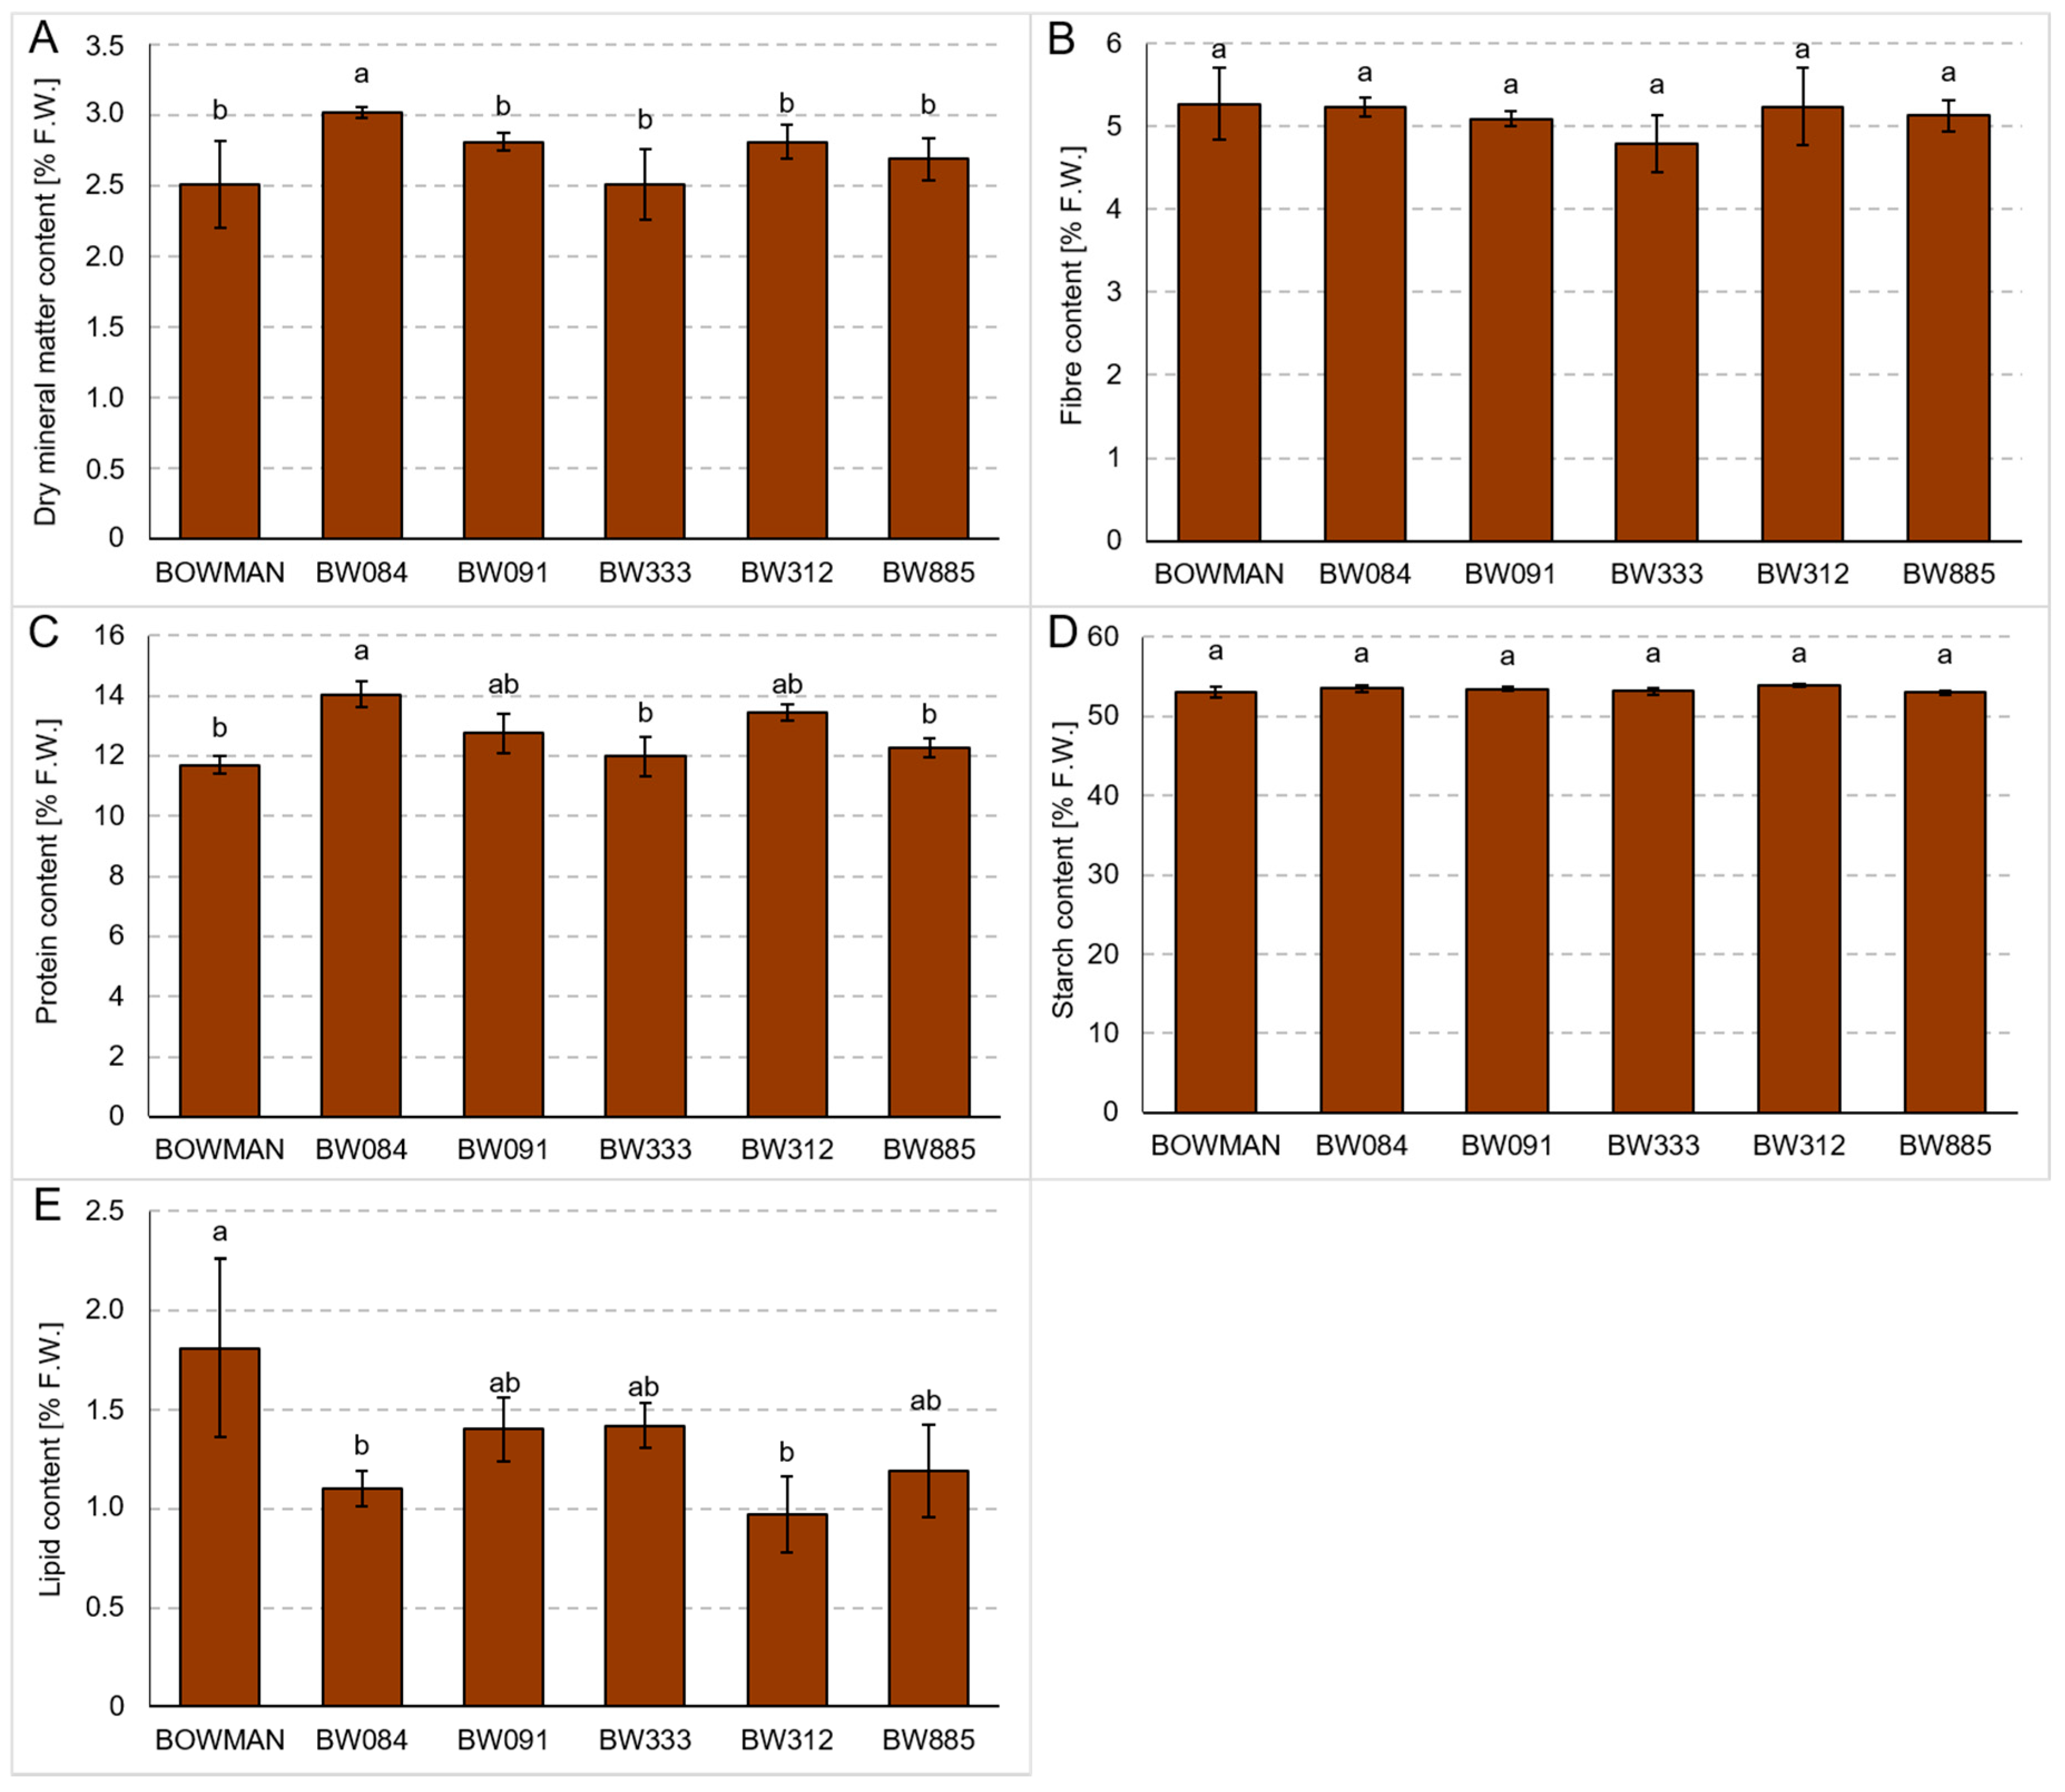
3.4. Chemical Composition of Grains Produced under the Conditions of Optimal Watering and Drought Exerted during Spike Development (the Pot Experiment)

As far as the grains produced under the optimal watering conditions are concerned, the lowest content of dry mineral matter was reported in grains of the ‘Bowman’ cultivar. In grains of the analyzed NILs the dry mineral matter content constituted from ca. 110% (BW333) to 151% (BW312) of the ‘Bowman’ value. The drought stress exerted during the spike development resulted in the 10-30% increase in the dry mineral matter content in grains of all analyzed genotypes. However, in the ‘Bowman’ cultivar and the BW333 line the values of this parameter were significantly lower than in the rest of genotypes (Figure 9).
Under the optimal watering conditions the highest fiber contents were observed in grains of the BR-insensitive NILs BW312 and BW885. The fiber contents reported in the BW312 and BW885 lines constituted ca. 116% and ca. 107% of the ‘Bowman’ value, respectively. The fiber contents in grains of the ‘Bowman’ cultivar and the rest of analyzed NILs (the BR-deficient mutants) were very similar. Upon the drought stress exerted during the spike development only slight alterations in the fiber contents were observed in grains of the analyzed genotypes (when compared with the respective control values). Generally, upon the drought stress the fiber contents in grains of the analyzed genotypes were similar (Figure 10).
Interestingly, under the control conditions the lowest content of proteins was reported in grains of the ‘Bowman’ cultivar. In the analyzed NILs the grain protein contents were significantly (p ≤ 0.05) higher than in the ‘Bowman’ cultivar, and constituted from ca. 116% (in BW333) to ca. 135% (in BW091) of the ‘Bowman’ value. As the result of drought exposure during the spike development the protein contents were increased in grains of all analyzed genotypes. The drought-induced increase in the grain protein content was most prominent in the ‘Bowman’ cultivar (136% of the respective control value). In the NILs the drought-stimulated increase in the grain protein content ranged between ca. 106% of the respective control value (in BW885) to ca. 113% of the respective control value in the BW084 line. Upon exposure to drought the protein contents in grains of all tested genotypes were comparable (Figure 11).
The starch content in grains of the analyzed genotypes was also determined. Under the control conditions values of the starch content were very similar in all analyzed genotypes (the reported differences were not statistically significant). The drought stress exerted during the spike development did not result in any significant alteration in the starch content in the analyzed genotypes. Consequently, the values remained very similar in all analyzed genotypes and the reported differences were not statistically significant (data not shown).
Under the control conditions the total lipid contents were diverse in grains of the analyzed genotypes. The highest lipid contents were observed in the BR-deficient NILs BW084 and BW333, and the lowest lipid contents were reported in the BR-insensitive NILs BW312 and BW885. The value reported in the ‘Bowman’ cultivar was intermediate. Generally, drought exerted during the spike development resulted in a decrease in the lipid contents in grains of almost all genotypes (except BW091). The extent of decrease (in relation to the respective control values) was in the range of 5% (in BW885) to 45% (in BW084). The decrease in the lipid content reported in the ‘Bowman’ cultivar was intermediate. Upon the drought stress, the lipid contents observed in grains of the BR mutant NILs were at the level similar to the ‘Bowman’ value or significantly higher (in BW091 and BW333) (Figure 12).

3.5. Chemical Composition of Grains Produced under the Field Conditions

Under the field conditions, the dry mineral matter content in grains of the NILs was at the level similar to the ‘Bowman’ value or higher. The highest value of the dry mineral matter content was reported in the BW084 grains in which 120% of the ‘Bowman’ value was observed. In the rest of genotypes (including the ‘Bowman’ cultivar) the reported values were similar, and differences were not statistically significant (Figure 13A). Briefly, in all the analyzed genotypes the fiber content values were very similar, and the observed differences were not statistically significant (Figure 13B). As far as the total protein content in grains is concerned, under the field conditions the lowest value of this parameter was reported in the ‘Bowman’ cultivar. In the majority of NILs the total protein contents were slightly higher than in the ‘Bowman’ cultivar. In the BW084 line the value of this parameter was significantly (p ≤ 0.05) higher than in ‘Bowman’ and constituted 120% of the ‘Bowman’ value (Figure 13C). The next grain chemical composition parameter was the starch content. Briefly, in all the analyzed genotypes the values of this parameter were very similar, and the observed differences were not statistically significant (Figure 13D). The last of the analyzed parameters of the grain chemical composition was the total lipid content. The highest value of this parameter (although with a considerable standard deviation) was reported in grains of the ‘Bowman’ cultivar. In grains of the analyzed NILs the total lipid contents were reduced to a various degree, and in the BW084 and BW312 lines the lipid contents were significantly (p ≤ 0.05) lower than in the ‘Bowman’ cultivar and constituted ca. 61% and 53% of the ‘Bowman’ value, respectively (Figure 13E).

4. Discussion

Up to now our knowledge about the relation between perturbations in the BR biosynthesis and signaling in cereal mutants and their yield-related parameters is still rather limited. In the present study difference in the productive tillering reported after drought exposure between the BW312 line and the rest of genotypes was reflected by the average grain weight per plant. Upon the drought stress exerted during the spike development the highest value of the grain weight per plant was observed in the BW312 line, and this value was significantly higher than in the rest of genotypes. It should be kept in mind that erect stature of the semi-dwarf mutants of cereal crops (including barley) is the important phenotypic trait influencing yield, as it enables an increased planting density, and consequently, the yield improvement even without application of extra fertilizer supply which under certain conditions and at surplus dosage may constitute a nuisance for the natural environment. The total crop yield depends on the yield of individual plants and the planting density [38]. An overall increase in the BR content frequently results in larger lamina joints and increased plant height which result in decreased lodging resistance and planting density [42]. These negative side-effects may preclude utility of exogenous BR application for agricultural production [38,43]. Interestingly, the biomass and grain yield in the semi-dwarf rice dwarf4-1 mutant, defective in the BR biosynthesis, are increased compared with those in reference cultivar under the high-density planting conditions even without extra fertilizer, as the mutant shows erect leaves and normal reproductive development [24]. A congruent conclusion was drawn from a study on wheat mutants carrying the gibberellin signaling-related Rht alleles. Grain yields in the irrigated field experiment showed higher yield of the semi-dwarf lines compared with tall lines. Generally, plant heights greater than ~95–100 cm resulted in a progressive and large yield penalty, even without significant lodging occurrence. The experiments provided confirmation of the negative relationship between long stems and grain yield [34]. In the analysis of wheat Rht mutants it was also reported that plant height was negatively correlated with grain yield, thousand kernel weight, and kernel number per spike. It indicated that shorter stature was favorable for grain yield which is in agreement with previous studies [35,44]. In our study the semi-dwarf phenotype of the BW312 line was positively correlated with the productive tillering (mainly after the drought exposure) and consequently with the grain weight per plant upon the drought exposure. As far as the weight of 1000 seeds is concerned, under the optimal watering conditions the highest value of this parameter was reported in the BW312 line, and the value was significantly higher than in the rest of genotypes. Under the drought conditions in all analyzed genotypes similar values of this parameter were reported. The semi-dwarf phenotype of the BW312 line did not have an advantageous effect on the average grain weight per spike. Thus, it may be concluded that effect of the semi-dwarf phenotype on the grain weight per spike seems to be dependent on the cereal species (wheat vs. barley) and metabolic phytohormone pathway (gibberellin vs. BR) which is defective in the analyzed semi-dwarf mutants. Nevertheless, it was recently postulated that two rice sd1 lines (defective in the gibberellin biosynthesis) which showed similar yields to the reference cultivar may be potential breeding materials, even though their grain number per panicle was lower when compared with the reference cultivar [45].
In the case of the semi-dwarf, erect line BW312 which along with other BR-related semi-dwarf NILs showed improved tolerance to drought in our previous studies [16,18], and in this study displayed the highest values of the productive tillering and the average grain weight per plant (under the drought conditions), there may be an additional opportunity for yield increase through higher planting density and improved drought tolerance. Therefore, the BW312 line, which represents the new allele of the HvBRI1 (Uzu1) gene—uzu1.b, may constitute an alternative in future barley breeding programs, taking into account the ongoing climate change and necessity of developing new drought-tolerant crop cultivars. The potential application of this semi-dwarf mutant as the material in breeding programs may be particularly beneficial in the arid and/or semi-arid regions, such as the Mediterranean area, where droughts occur frequently and on a regular basis during the vegetation seasons. Noteworthily, the semi-dwarf NILs analyzed in this study have also been exposed to the elevated temperature (26 °C) in our previous experiment. This experiment was aimed at phenotypic characterization of these NILs under conditions of prolonged temperature stress and indicated that under the stress conditions the stature of the BW885 line, representing the original uzu1.a allele which was widely used in the past breeding programs, was significantly stunted (29% of wild-type length) in contrast with the other NILs, including the BW312 line (65–91% of wild-type length). It was concluded that the temperature-sensitive phenotype is not associated with the BR-biosynthesis perturbations or mutations of the HvBRI1 receptor in general but is specific for the uzu1.a allele. Thus, the other NILs may constitute an alternative for the uzu1.a allele in future breeding programs, particularly in the face of global climate change [26]. It should be also kept in mind that high-yielding elite crop varieties were developed for optimal environmental conditions. However, taking into account the ongoing climate changes, currently priority should be given to developing and breeding the stress tolerant cultivars [4,5]. Thus, stress-tolerant alternatives for the current high-yielding cereal cultivars should be identified. It was also postulated for other cereals (wheat) that significance of other dwarfing alleles may rise with changing climatic scenario [46]. It was recently shown in barley that under optimal watering conditions the grain yield produced by drought-adapted landraces derived from the Mediterranean region was lower in comparison with the grain yield produced by elite, central European lines. However, under the drought conditions significantly higher grain yield was produced by the stress-adapted landraces [3]. This may indicate that under the optimal watering conditions the stress pre-adaptation occurs at the expense of yield. It was recently reported that spikelet differentiation and degeneration in young rice panicles are closely associated with the BR concentrations and the expression levels of genes involved in the BR biosynthesis and signaling [36]. Moreover, another report indicated that the relationship between drought conditions and the BR-dependent spike development may be complicated, as in rice moderate drought conditions promoted the BR biosynthesis in young panicles, stimulated spikelet differentiation and reduced spikelet degeneration, whereas severe drought conditions led to the opposite effect [37]. Thus, grain yield is a complex trait controlled by genetic and environmental factors. Hence, a holistic view that incorporates various experimental approaches is required to enable the yield improvement [35].
Generally, in our study the results of yield-related parameters and chemical grain composition were congruent between the optimal watering conditions (in the pot experiment) and the field experiment (during the vegetation period of this field experiment plants were not exposed to drought). For instance, values of the key parameter, grain weight per plant, showed very similar profiles of diversity among the analyzed genotypes under these conditions—the values reported in the analyzed NILs were similar to the ‘Bowman’ value or lower. Under these conditions, the value of this parameter reported in the BW312 line was relatively low (in contrast to the conditions of drought exerted during the spike development when the highest value of the grain weight per plant was observed in the BW312 line). Taking the above results into account, it may be inferred that the yield produced per plant by genotypes pre-adapted to the drought conditions may be lower under optimal watering conditions. Thus, the conclusion is in line with the hypothesis that under the optimal watering conditions the stress pre-adaptation occurs at the expense of yield [3].
One of the major conclusions which may be drawn from this study is that the perturbations in the BR biosynthesis or signaling did not have any significant negative (deteriorating) effect on the contents of grain chemical ingredients. This is an important issue taking into account the potential application of the semi-dwarf barley BR mutants as materials in the future breeding programs. Both under the optimal watering conditions and upon the exposure to drought the grains of the analyzed NILs contained similar or higher contents of the analyzed chemical components, i.e., dry mineral matter, fiber, proteins, starch, and lipids in comparison with the ‘Bowman’ grains. Generally, this observation was validated in the analysis of chemical composition of grains produced under the field conditions.
Importantly, in our study it was reported that under the control conditions the protein contents in grains of the analyzed NILs were significantly higher than in the ‘Bowman’ cultivar, and constituted from ca. 116% (in BW333) to ca. 135% (in BW091) of the ‘Bowman’ value. It may indicate that perturbations in the BR biosynthesis or signaling in the semi-dwarf barley mutants may result in higher grain protein content. As a result of the drought exposure during the spike development the protein contents were increased in grains of all analyzed genotypes and the protein contents in grains of all the genotypes were comparable. An increased level of protein content in wheat grains under drought stress conditions has also been reported [47]. This suggests that the drought-induced increase in the grain protein contents may be a more general phenomenon in cereals and that the semi-dwarf, barley BR mutants retain the ability for this physiological reaction.
In a previous experiment conducted in wheat with exogenous application of BR (24-epi-brassinolide), it was reported that the BR application changed the grain chemical composition. As a result of the BR application, the content of soluble sugars was increased, whereas the content of total fats was lowered. Contents of starch and soluble proteins were not affected [48]. However, the effect of exogenous BR application on the starch content seems to be species- and/or treatment method-dependent, as it was reported that another BR (brassinolide) increases the starch content in rice grains [49]. Under the field conditions the exogenous BR effect on the above grain chemical composition parameters was negligible [48]. This dependence on the BR application and plant vegetation methods was in line with the previous reports [50].
It should be kept in mind that, according to the best of our knowledge, no information about a potential influence of the endogenous BRs (and abnormalities in their biosynthesis or signaling) on the chemical composition of cereal grains is currently available. This study is the first report of this kind. Therefore, the results obtained in this study may be of significant interest, taking into account the potential application of the semi-dwarf barley mutants, defective in the BR metabolism, in future breeding programs. However, a further few-years study conducted on these semi-dwarf lines under field conditions is recommended to fully verify any impact of naturally-occurring adverse conditions, such as spring frosts, flooding or high temperature on the yield parameters of these mutants. In this context, a promising result was reported in our recent study on physiological reaction of the semi-dwarf, barley BR mutants to the high-temperature stress which frequently accompanies the water scarcity during the spike development phase. In this study several semi-dwarf BR mutants (including the BW312 line), which represented different genetic backgrounds (cultivars), were analyzed. Importantly, it was concluded that all of the mutants showed a higher tolerance to the high temperatures than their respective cultivars [51]. Thus, the results obtained in these studies should be a premise for further research on the yield-related parameters and chemical grain composition in these semi-dwarf BR mutants upon exposure to various environmental stresses.

5. Conclusions

In our study the semi-dwarf phenotype of the BW312 line was positively correlated with the productive tillering (mainly after the drought exposure) and consequently with the grain weight per plant upon the drought stress. Noteworthy, the BW312 line along with other BR-related semi-dwarf NILs showed improved tolerance to drought. It may give an opportunity for the yield increase through the higher planting density and improved drought tolerance. Therefore, the BW312 line may constitute an alternative in future barley breeding programs, taking into account the ongoing climate change and necessity of developing new drought-tolerant crop cultivars. The potential application of this semi-dwarf mutant as the material in breeding programs may be particularly beneficial in the arid and/or semi-arid regions where droughts occur frequently and on a regular basis during the vegetation seasons. The results of our study also indicated that the perturbations in the BR biosynthesis or signaling did not have any significant deteriorating effect on the contents of grain chemical ingredients. This is an important issue taking into account the potential application of the semi-dwarf barley BR mutants as materials in the future breeding programs. Moreover, in our study it was reported that under the control conditions the protein contents in grains of the analyzed barley BR mutants were significantly higher than in the ‘Bowman’ cultivar. It indicated that perturbations in the BR biosynthesis or signaling in the semi-dwarf barley mutants may result in higher grain protein content.

Supplementary Materials

The following are available online at https://www.mdpi.com/2073-4395/10/10/1595/s1, Table S1: Precipitation and temperature reported during the growing season of 2017 when the field experiment was conducted. The data are compared with the long-term records conducted in the years 1961–1990. The data were recorded at the experimental station of the Department of Agroecology and Plant Production, University of Agriculture in Krakow, Poland.

Author Contributions

D.G. conceived and supervised the project; D.G. and A.J. planned the research; D.G., A.J., J.P., A.L. and E.P. collected and analyzed the data; D.G. interpreted the data and wrote the manuscript. All authors have read and agreed to the published version of the manuscript.

Funding

This research was funded by the National Science Centre, Poland (grant No. 2019/35/B/NZ2/00382). In addition, the APC was funded by National Science Centre, Poland (grant No. 2019/35/B/NZ2/00382).

Conflicts of Interest

The authors declare no conflict of interest. The funders had no role in the design of the study; in the collection, analyses, or interpretation of data; in the writing of the manuscript, or in the decision to publish the results.

References

  1. Yordanov, I.; Velikova, V.; Tsonev, T. Plant Responses to Drought, Acclimation, and Stress Tolerance. Photosynthetica 2000, 38, 171–186. [Google Scholar] [CrossRef]
  2. Osakabe, Y.; Osakabe, K.; Shinozaki, K.; Tran, L.-S.P. Response of plants to water stress. Front. Plant Sci. 2014, 5, 86. [Google Scholar] [CrossRef] [PubMed] [Green Version]
  3. Templer, S.E.; Ammon, A.; Pscheidt, D.; Ciobotea, O.; Schuy, C.; Mccollum, C.; Sonnewald, U.; Hanemann, A.; Förster, J.; Ordon, F.; et al. Metabolite profiling of barley flag leaves under drought and combined heat and drought stress reveals metabolic QTLs for metabolites associated with antioxidant defense. J. Exp. Bot. 2017, 68, 1697–1713. [Google Scholar] [CrossRef] [Green Version]
  4. Rao, D.E.; Chaitanya, K.V. Photosynthesis and antioxidative defense mechanisms in deciphering drought stress tolerance of crop plants. Biol. Plant. 2016, 60, 201–218. [Google Scholar] [CrossRef]
  5. Fahad, S.; Bajwa, A.A.; Nazir, U.; Anjum, S.A.; Farooq, A.; Zohaib, A.; Sadia, S.; Nasim, W.; Adkins, S.; Saud, S.; et al. Crop Production under Drought and Heat Stress: Plant Responses and Management Options. Front. Plant Sci. 2017, 8, 1147. [Google Scholar] [CrossRef] [PubMed] [Green Version]
  6. Gupta, A.; Rico-Medina, A.; Caño-Delgado, A.I. The physiology of plant responses to drought. Science 2020, 368, 266–269. [Google Scholar] [CrossRef]
  7. Reddy, S.H.; Singhal, R.K.; Dacosta, M.; Kambalimath, S.K.; Rajanna, M.P.; Muthurajan, R.; Sevanthi, A.M.; Mohapatra, T.; Sarla, N.; Chinnusamy, V.; et al. Leaf mass area determines water use efficiency through its influence on carbon gain in rice mutants. Physiol. Plant. 2020, 169, 194–213. [Google Scholar] [CrossRef] [PubMed]
  8. Fischer, R.A.; Stapper, M. Lodging effects on high-yielding crops of irrigated semidwarf wheat. Field Crop. Res. 1987, 17, 245–258. [Google Scholar] [CrossRef]
  9. Zhou, L.; Liu, S.; Wu, W.; Chen, D.; Zhan, X.; Zhu, A.; Zhang, Y.; Cheng, S.; Cao, L.; Lou, X.; et al. Dissection of genetic architecture of rice plant height and heading date by multiple-strategy-based association studies. Sci. Rep. 2016, 6, 29718. [Google Scholar] [CrossRef] [Green Version]
  10. Gruszka, D. Exploring the Brassinosteroid Signaling in Monocots Reveals Novel Components of the Pathway and Implications for Plant Breeding. Int. J. Mol. Sci. 2020, 21, 354. [Google Scholar] [CrossRef] [Green Version]
  11. Gruszka, D. Crosstalk of the Brassinosteroid Signalosome with Phytohormonal and Stress Signaling Components Maintains a Balance between the Processes of Growth and Stress Tolerance. Int. J. Mol. Sci. 2018, 19, 2675. [Google Scholar] [CrossRef] [PubMed] [Green Version]
  12. Li, D.; Wang, L.; Wang, M.; Xu, Y.Y.; Luo, W.; Liu, Y.J.; Xu, Z.H.; Li, J.; Chong, K. Engineering OsBAK1 gene as a molecular tool to improve rice architecture for high yield. Plant Biotechnol. J. 2009, 7, 791–806. [Google Scholar] [CrossRef] [PubMed]
  13. Northey, J.G.B.; Liang, S.; Jamshed, M.; Deb, S.; Foo, E.; Reid, J.B.; McCourt, P.; Samuel, M.A. Farnesylation mediates brassinosteroid biosynthesis to regulate abscisic acid responses. Nat. Plants 2016, 2, 16114. [Google Scholar] [CrossRef]
  14. Feng, Y.; Yin, Y.; Fei, S. Down-regulation of BdBRI1, a putative brassinosteroid receptor gene produces a dwarf phenotype with enhanced drought tolerance in Brachypodium distachyon. Plant Sci. 2015, 234, 163–173. [Google Scholar] [CrossRef] [PubMed]
  15. Ferrero-Serrano, A.; Assmann, S.M. The α-subunit of the rice heterotrimeric G protein, RGA1, regulates drought tolerance during the vegetative phase in the dwarf rice mutantd1. J. Exp. Bot. 2016, 67, 3433–3443. [Google Scholar] [CrossRef] [PubMed] [Green Version]
  16. Gruszka, D.; Janeczko, A.; Dziurka, M.; Pociecha, E.; Oklestkova, J.; Szarejko, I. Barley Brassinosteroid Mutants Provide an Insight into Phytohormonal Homeostasis in Plant Reaction to Drought Stress. Front. Plant Sci. 2016, 7, 1824. [Google Scholar] [CrossRef] [PubMed] [Green Version]
  17. Janeczko, A.; Gruszka, D.; Pociecha, E.; Dziurka, M.; Filek, M.; Jurczyk, B.; Kalaji, H.M.; Kocurek, M.; Waligorski, P. Physiological and biochemical characterisation of watered and drought-stressed barley mutants in the HvDWARF gene encoding C6-oxidase involved in brassinosteroid biosynthesis. Plant Physiol. Biochem. 2016, 99, 126–141. [Google Scholar] [CrossRef]
  18. Gruszka, D.; Pociecha, E.; Jurczyk, B.; Dziurka, M.; Oliwa, J.; Sadura, I.; Janeczko, A. Insights into Metabolic Reactions of Semi-Dwarf, Barley Brassinosteroid Mutants to Drought. Int. J. Mol. Sci. 2020, 21, 5096. [Google Scholar] [CrossRef]
  19. Bhargava, S.; Sawant, K. Drought stress adaptation: Metabolic adjustment and regulation of gene expression. Plant Breed. 2013, 132, 21–32. [Google Scholar] [CrossRef]
  20. Reddy, A.R.; Chaitanya, K.V.; Vivekanandan, M. Drought-induced responses of photosynthesis and antioxidant metabolism in higher plants. J. Plant Physiol. 2004, 161, 1189–1202. [Google Scholar] [CrossRef]
  21. Muller, B.; Pantin, F.; Genard, M.; Turc, O.; Freixes, S.; Piques, M.; Gibon, Y. Water deficits uncouple growth from photosynthesis, increase C content, and modify the relationships between C and growth in sink organs. J. Exp. Bot. 2011, 62, 1715–1729. [Google Scholar] [CrossRef] [PubMed] [Green Version]
  22. Sinclair, T.R.; Sheehy, J. EErect Leaves and Photosynthesis in Rice. Science 1999, 283, 1455. [Google Scholar] [CrossRef]
  23. Morinaka, Y.; Sakamoto, T.; Inukai, Y.; Agetsuma, M.; Kitano, H.; Ashikari, M.; Matsuoka, M. Morphological Alteration Caused by Brassinosteroid Insensitivity Increases the Biomass and Grain Production of Rice. Plant Physiol. 2006, 141, 924–931. [Google Scholar] [CrossRef] [PubMed] [Green Version]
  24. Sakamoto, T.; Morinaka, Y.; Ohnishi, T.; Sunohara, H.; Fujioka, S.; Ueguchi-Tanaka, M.; Mizutani, M.; Sakata, K.; Takatsuto, S.; Yoshida, S.; et al. Erect leaves caused by brassinosteroid deficiency increase biomass production and grain yield in rice. Nat. Biotechnol. 2006, 24, 105–109. [Google Scholar] [CrossRef] [PubMed]
  25. Perez, M.M.B.; Fernandez, S.M.G. Differential manipulation of leaf angle throughout the canopy: Current status and prospects. J. Exp. Bot. 2017, 68, 5699–5717. [Google Scholar] [CrossRef] [Green Version]
  26. Dockter, C.; Gruszka, D.; Braumann, I.; Druka, A.; Druka, I.; Franckowiak, J.; Gough, S.P.; Janeczko, A.; Kurowska, M.; Lundqvist, J.; et al. Induced Variations in Brassinosteroid Genes Define Barley Height and Sturdiness, and Expand the Green Revolution Genetic Toolkit. Plant Physiol. 2014, 166, 1912–1927. [Google Scholar] [CrossRef] [Green Version]
  27. Feng, Z.; Wu, C.; Wang, C.; Roh, J.; Zhang, L.; Chen, J.; Zhang, S.; Zhang, H.; Yang, C.; Hu, J.; et al. SLG controls grain size and leaf angle by modulating brassinosteroid homeostasis in rice. J. Exp. Bot. 2016, 67, 4241–4253. [Google Scholar] [CrossRef] [Green Version]
  28. Dockter, C.; Hansson, M. Improving barley culm robustness for secured crop yield in a changing climate. J. Exp. Bot. 2015, 66, 3499–3509. [Google Scholar] [CrossRef] [Green Version]
  29. Porter, J.R.; Semenov, M.A. Crop responses to climatic variation. Philos. Trans. R. Soc. Lond. B Biol. Sci. 2005, 360, 2021–2035. [Google Scholar] [CrossRef]
  30. Braumann, I.; Urban, W.; Preuß, A.; Dockter, C.; Zakhrabekova, S.; Hansson, M. Semi-dwarf barley (Hordeum vulgare L.) brh2 and ari-l mutants are deficient in a U-box E3 ubiquitin ligase. Plant Growth Regul. 2018, 86, 223–234. [Google Scholar] [CrossRef] [Green Version]
  31. Barnabás, B.; Jäger, K.; Fehér, A. The effect of drought and heat stress on reproductive processes in cereals. Plant Cell Environ. 2008, 31, 11–38. [Google Scholar] [CrossRef]
  32. Zhang, J.; Dell, B.; Biddulph, B.; Drake-Brockman, F.; Walker, E.; Khan, N.; Wong, D.; Hayden, M.; Appels, R. Wild-type alleles of Rht-B1 and Rht-D1 as independent determinants of thousand-grain weight and kernel number per spike in wheat. Mol. Breed. 2013, 32, 771–783. [Google Scholar] [CrossRef]
  33. Terao, T.; Hirose, T. Control of grain protein contents through SEMIDWARF1 mutant alleles: sd1 increases the grain protein content in Dee-geo-woo-gen but not in Reimei. Mol. Genet. Genom. 2014, 290, 939–954. [Google Scholar] [CrossRef]
  34. Derkx, A.P.; Harding, C.A.; Miraghazadeh, A.; Chandler, P.M. Overgrowth (Della) mutants of wheat: Development, growth and yield of intragenic suppressors of the Rht-B1c dwarfing gene. Funct. Plant Biol. 2017, 44, 525–537. [Google Scholar] [CrossRef] [PubMed] [Green Version]
  35. Hayat, H.; Mason, R.E.; Lozada, D.N.; Acuna, A.; Holder, A.; Larkin, D.; Winn, Z.; Murray, J.; Murphy, J.P.; Moon, D.E.; et al. Effects of allelic variation at Rht-B1 and Rht-D1 on grain yield and agronomic traits of southern US soft red winter wheat. Euphytica 2019, 215, 172. [Google Scholar] [CrossRef]
  36. Zhang, W.; Zhu, K.; Wang, Z.; Zhang, H.; Gu, J.; Liu, L.; Yang, J.; Zhang, J. Brassinosteroids function in spikelet differentiation and degeneration in rice. J. Integr. Plant Biol. 2019, 61, 943–963. [Google Scholar] [CrossRef] [Green Version]
  37. Zhang, W.; Sheng, J.; Xu, Y.; Xiong, F.; Wu, Y.; Wang, W.; Wang, Z.; Yang, J.; Zhang, J. Role of brassinosteroids in rice spikelet differentiation and degeneration under soil-drying during panicle development. BMC Plant Biol. 2019, 19, 409. [Google Scholar] [CrossRef]
  38. Zu, S.-H.; Jiang, Y.-T.; Hu, L.-Q.; Zhang, Y.-J.; Chang, J.-H.; Hue, H.-W.; Lin, W.-H. Effective Modulating Brassinosteroids Signal to Study Their Specific Regulation of Reproductive Development and Enhance Yield. Front. Plant Sci. 2019, 10, 980. [Google Scholar] [CrossRef] [Green Version]
  39. Druka, A.; Franckowiak, J.; Lundqvist, U.; Bonar, N.; Alexander, J.; Houston, K.; Radovic, S.; Shahinnia, F.; Vendramin, V.; Morgante, M.; et al. Genetic Dissection of Barley Morphology and Development. Plant Physiol. 2011, 155, 617–627. [Google Scholar] [CrossRef] [Green Version]
  40. Salvi, S.; Druka, A.; Milner, S.G.; Gruszka, D. Induced Genetic Variation, TILLING and NGS-Based Cloning. In Biotechnological Approaches to Barley Improvement. Biotechnology in Agriculture and Forestry; Kumlehn, J., Stein, N., Eds.; Springer: Berlin/Heidelberg, Germany, 2014; Volume 69, pp. 287–310. [Google Scholar]
  41. Chono, M.; Honda, I.; Zeniya, H.; Yoneyama, K.; Saisho, D.; Takeda, K.; Takatsuto, S.; Hoshino, T.; Watanabe, Y. A Semidwarf Phenotype of Barley uzu Results from a Nucleotide Substitution in the Gene Encoding a Putative Brassinosteroid Receptor. Plant Physiol. 2003, 133, 1209–1219. [Google Scholar] [CrossRef] [Green Version]
  42. Wu, C.-Y.; Trieu, A.; Radhakrishnan, P.; Kwok, S.F.; Harris, S.; Zhang, K.; Wang, J.; Wan, J.; Zhai, H.; Takatsuto, S.; et al. Brassinosteroids Regulate Grain Filling in Rice. Plant Cell 2008, 20, 2130–2145. [Google Scholar] [CrossRef] [PubMed] [Green Version]
  43. Lin, W.-H. Designed Manipulation of the Brassinosteroid Signal to Enhance Crop Yield. Front. Plant Sci. 2020, 11, 854. [Google Scholar] [CrossRef]
  44. Rebetzke, G.; Richards, R. Gibberellic acid-sensitive dwarfing genes reduce plant height to increase kernel number and grain yield of wheat. Crop Pasture Sci. 2000, 51, 235–246. [Google Scholar] [CrossRef]
  45. Hu, X.; Cui, Y.; Dong, G.; Feng, A.; Wang, D.; Zhao, C.; Zhang, Y.; Hu, J.; Zeng, D.; Guo, L.; et al. Using CRISPR-Cas9 to generate semi-dwarf rice lines in elite landraces. Sci. Rep. 2019, 9, 19096. [Google Scholar] [CrossRef] [PubMed] [Green Version]
  46. Alghabari, F.; Ihsan, M.Z.; Khaliq, A.; Hussain, S.; Daur, I.; Fahad, S.; Nasim, W. Gibberellin-sensitive Rht alleles confer tolerance to heat and drought stresses in wheat at booting stage. J. Cereal Sci. 2016, 70, 72–78. [Google Scholar] [CrossRef]
  47. Gooding, M.J. The effects of growth environment and agronomy on grain quality. In Cereal Grains: Assessing and Managing Quality; Wrigley, C.W., Batey, I.L., Eds.; Woodhead Publishing Series in Food Science, Technology and Nutrition; Woodhead: Oxford, UK, 2010; Volume 190, pp. 393–412. [Google Scholar]
  48. Janeczko, A.; Biesaga-Kościelniak, J.; Oklestkova, J.; Filek, M.; Dziurka, M.; Szarek-Łukaszewska, G.; Kościelniak, J. Role of 24-Epibrassinolide in Wheat Production: Physiological Effects and Uptake. J. Agron. Crop. Sci. 2010, 196, 311–321. [Google Scholar] [CrossRef]
  49. Fujii, S.; Saka, H. Distribution of Assimilates to Each Organ in Rice Plants Exposed to a Low Temperature at the Ripening Stage, and the Effect of Brassinolide on the Distribution. Plant Prod. Sci. 2001, 4, 136. [Google Scholar] [CrossRef]
  50. Divi, U.K.; Krishna, P. Brassinosteroid: A biotechnological target for enhancing crop yield and stress tolerance. New Biotechnol. 2009, 26, 131–136. [Google Scholar] [CrossRef]
  51. Sadura, I.; Pociecha, E.; Dziurka, M.; Oklestkova, J.; Novak, O.; Gruszka, D.; Janeczko, A. Mutations in the HvDWARF, HvCPD and HvBRI1 Genes-Involved in Brassinosteroid Biosynthesis/Signalling: Altered Photosynthetic Efficiency, Hormonal Homeostasis and Tolerance to High/Low Temperatures in Barley. J. Plant Growth Regul. 2019, 38, 1062–1081. [Google Scholar] [CrossRef] [Green Version]
Figure 1. Heading time at which spikes emerged from the leaf sheath under the control and drought conditions. The mean values ± (SD) marked with the same letters (separately for the control and drought-stressed plants) are not significantly different, according to Duncan’s test (p 0.05). Details are given in the text.
Agronomy 10 01595 g001
Figure 2. Total tillering (total number of tillers, including sterile tillers) of the analyzed genotypes under the optimal watering (control) conditions and after the drought stress (the pot experiment). The mean values ± (SD) marked with the same letters (separately for the control and drought-stressed plants) are not significantly different, according to Duncan’s test (p ≤ 0.05). Asterisks denote significant difference in comparison of values reported in each genotype between the control and drought conditions according to Student’s t-test. Details are given in the text.
Agronomy 10 01595 g002
Figure 3. Productive tillering (number of tillers with spikes) of the analyzed genotypes under the optimal watering (control) conditions and after the drought stress (the pot experiment). The mean values ± (SD) marked with the same letters (separately for the control and drought-stressed plants) are not significantly different, according to Duncan’s test (p ≤ 0.05). Asterisks denote significant difference in comparison of values reported in each genotype between the control and drought conditions according to Student’s t-test. Details are given in the text.
Agronomy 10 01595 g003
Figure 4. Average grain weight per plant of the analyzed genotypes under the optimal watering (control) conditions and after the drought stress (the pot experiment). The mean values ± (SD) marked with the same letters (separately for the control and drought-stressed plants) are not significantly different, according to Duncan’s test (p ≤ 0.05). Asterisks denote significant difference in comparison of values reported in each genotype between the control and drought conditions according to Student’s t-test. Details are given in the text.
Agronomy 10 01595 g004
Figure 5. Average grain weight per spike of the analyzed genotypes under the optimal watering (control) conditions and after the drought stress (the pot experiment). The mean values ± (SD) marked with the same letters (separately for the control and drought-stressed plants) are not significantly different, according to Duncan’s test (p ≤ 0.05). Asterisks denote significant difference in comparison of values reported in each genotype between the control and drought conditions according to Student’s t-test. Details are given in the text.
Agronomy 10 01595 g005
Figure 6. Weight of 1000 seeds of the analyzed genotypes under the optimal watering (control) conditions and after the drought stress (the pot experiment). The mean values ± (SD) marked with the same letters (separately for the control and drought-stressed plants) are not significantly different, according to Duncan’s test (p ≤ 0.05). Asterisks denote significant difference in comparison of values reported in each genotype between the control and drought conditions according to Student’s t-test. Details are given in the text.
Agronomy 10 01595 g006
Figure 7. Time required for full grain maturity in the analyzed genotypes under the optimal watering (control) conditions and after the drought stress (the pot experiment). The mean values ± (SD) marked with the same letters (separately for the control and drought-stressed plants) are not significantly different, according to Duncan’s test (p ≤ 0.05). Asterisks denote significant difference in comparison of values reported in each genotype between the control and drought conditions according to Student’s t-test. Details are given in the text.
Agronomy 10 01595 g007
Figure 8. Productive tillering and yield parameters of the analyzed genotypes under the field conditions: productive tillering (A), average grain weight per plant (B), average grain weight per spike (C), and weight of 1000 seeds (D). The mean values ± (SD) marked with the same letters are not significantly different, according to Duncan’s test (p ≤ 0.05). Details are given in the text.
Agronomy 10 01595 g008
Figure 9. Contents of the dry mineral matter in grains of the analyzed genotypes under the optimal watering (control) conditions and after the drought stress (the pot experiment). The mean values ± (SD) marked with the same letters (separately for the control and drought-stressed plants) are not significantly different, according to Duncan’s test (p ≤ 0.05). Asterisks denote significant difference in comparison of values reported in each genotype between the control and drought conditions according to Student’s t-test. Details are given in the text.
Agronomy 10 01595 g009
Figure 10. Contents of fiber in grains of the analyzed genotypes under the optimal watering (control) conditions and after the drought stress (the pot experiment). The mean values ± (SD) marked with the same letters (separately for the control and drought-stressed plants) are not significantly different, according to Duncan’s test (p ≤ 0.05). Details are given in the text.
Agronomy 10 01595 g010
Figure 11. Total protein contents in grains of the analyzed genotypes under the optimal watering (control) conditions and after the drought stress (the pot experiment). The mean values ± (SD) marked with the same letters (separately for the control and drought-stressed plants) are not significantly different, according to Duncan’s test (p ≤ 0.05). Asterisks denote significant difference in comparison of values reported in each genotype between the control and drought conditions according to Student’s t-test. Details are given in the text.
Agronomy 10 01595 g011
Figure 12. Total lipid contents in grains of the analyzed genotypes under the optimal watering (control) conditions and after the drought stress (the pot experiment). The mean values ± (SD) marked with the same letters (separately for the control and drought-stressed plants) are not significantly different, according to Duncan’s test (p ≤ 0.05). Asterisks denote significant difference in comparison of values reported in each genotype between the control and drought conditions according to Student’s t-test. Details are given in the text.
Agronomy 10 01595 g012
Figure 13. Chemical composition of grains produced under the field conditions: dry mineral matter content (A), fiber content (B), total protein content (C), starch content (D), and total lipid content (E). The mean values ± (SD) marked with the same letters are not significantly different, according to Duncan’s test (p ≤ 0.05). Details are given in the text.
Agronomy 10 01595 g013
Publisher’s Note: MDPI stays neutral with regard to jurisdictional claims in published maps and institutional affiliations.

