Zinc-Induced Effects on Productivity, Zinc Use Efficiency, and Grain Biofortification of Bread Wheat under Different Tillage Permutations

 ,
,  ,
,  ,
,
Abstract
:1. Introduction
2. Materials and Methods
2.1. Experimental Site, Climate, and Soil
2.2. Plant Material
2.3. Experimentation
2.4. Data Recording
2.4.1. Soil Properties
2.4.2. Yield Attributes
2.4.3. Grain and Straw Zn Concentration
2.4.4. Estimation of Phytate Contents and Bioavailable Zn
2.4.5. Estimation of Zn Use Efficiency
2.4.6. Economic Analysis
2.4.7. Statistical Analysis
3. Results
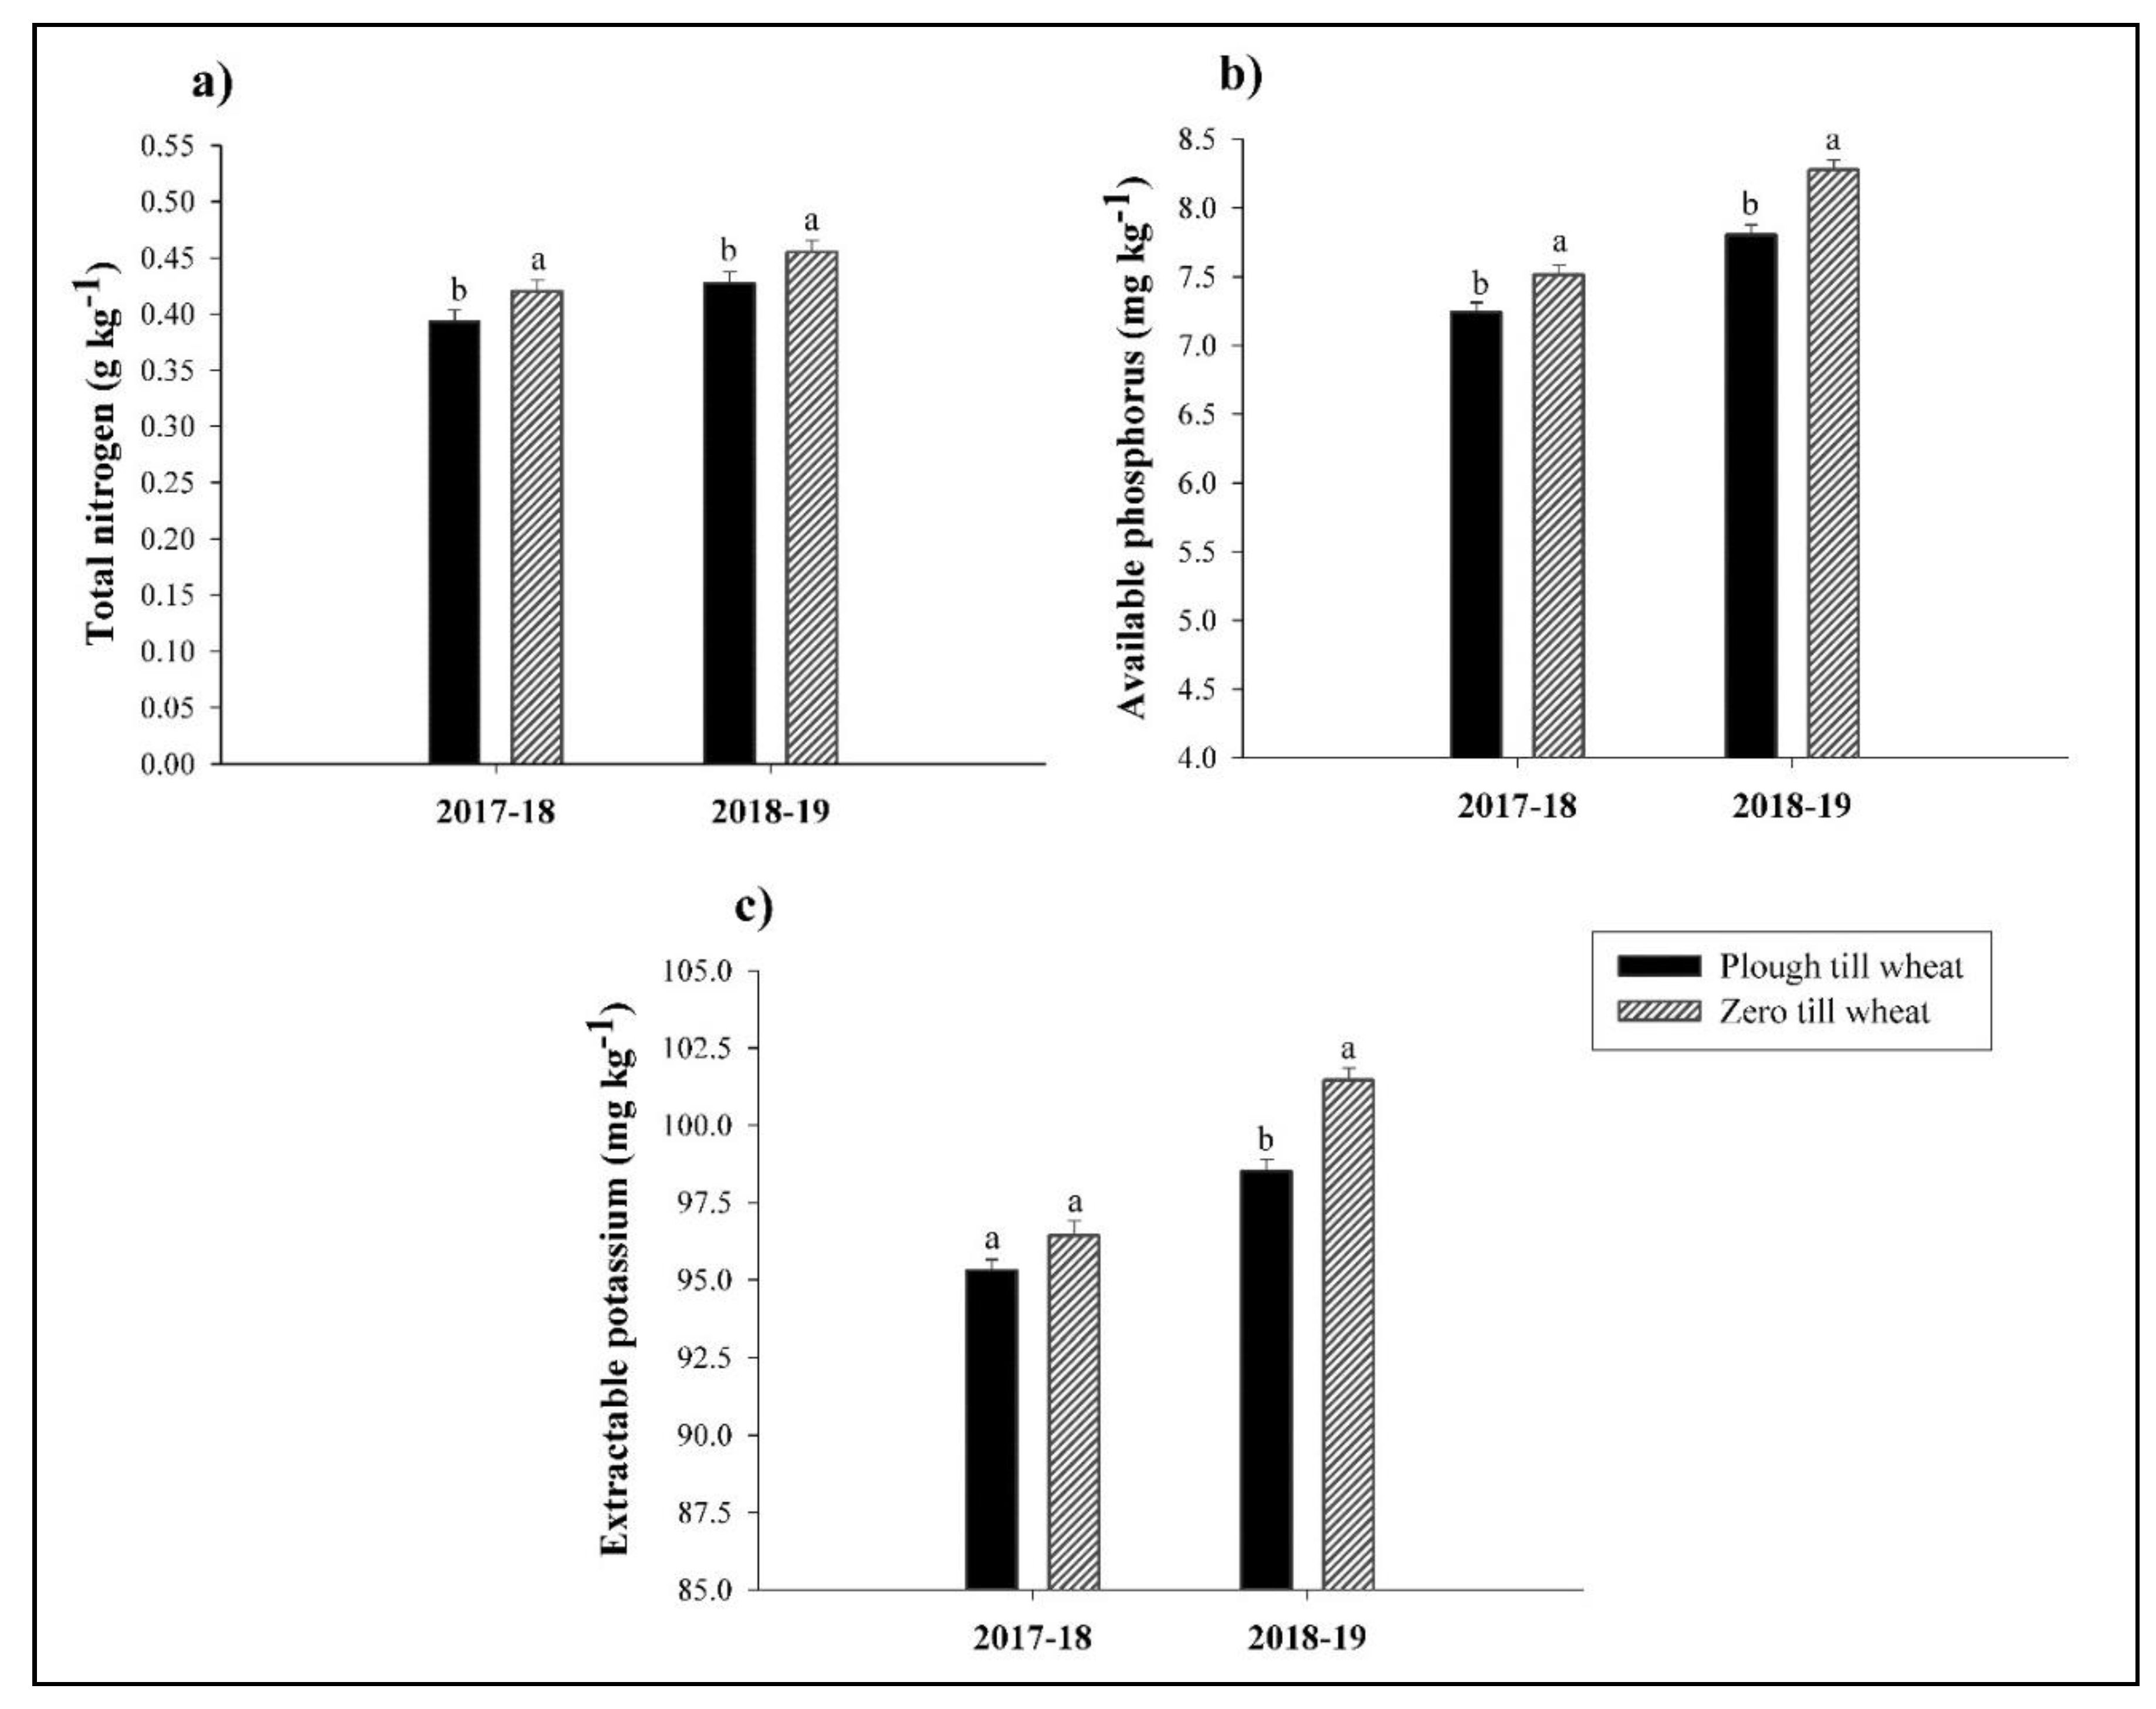
3.1. Soil Properties
3.2. Yield Attributes
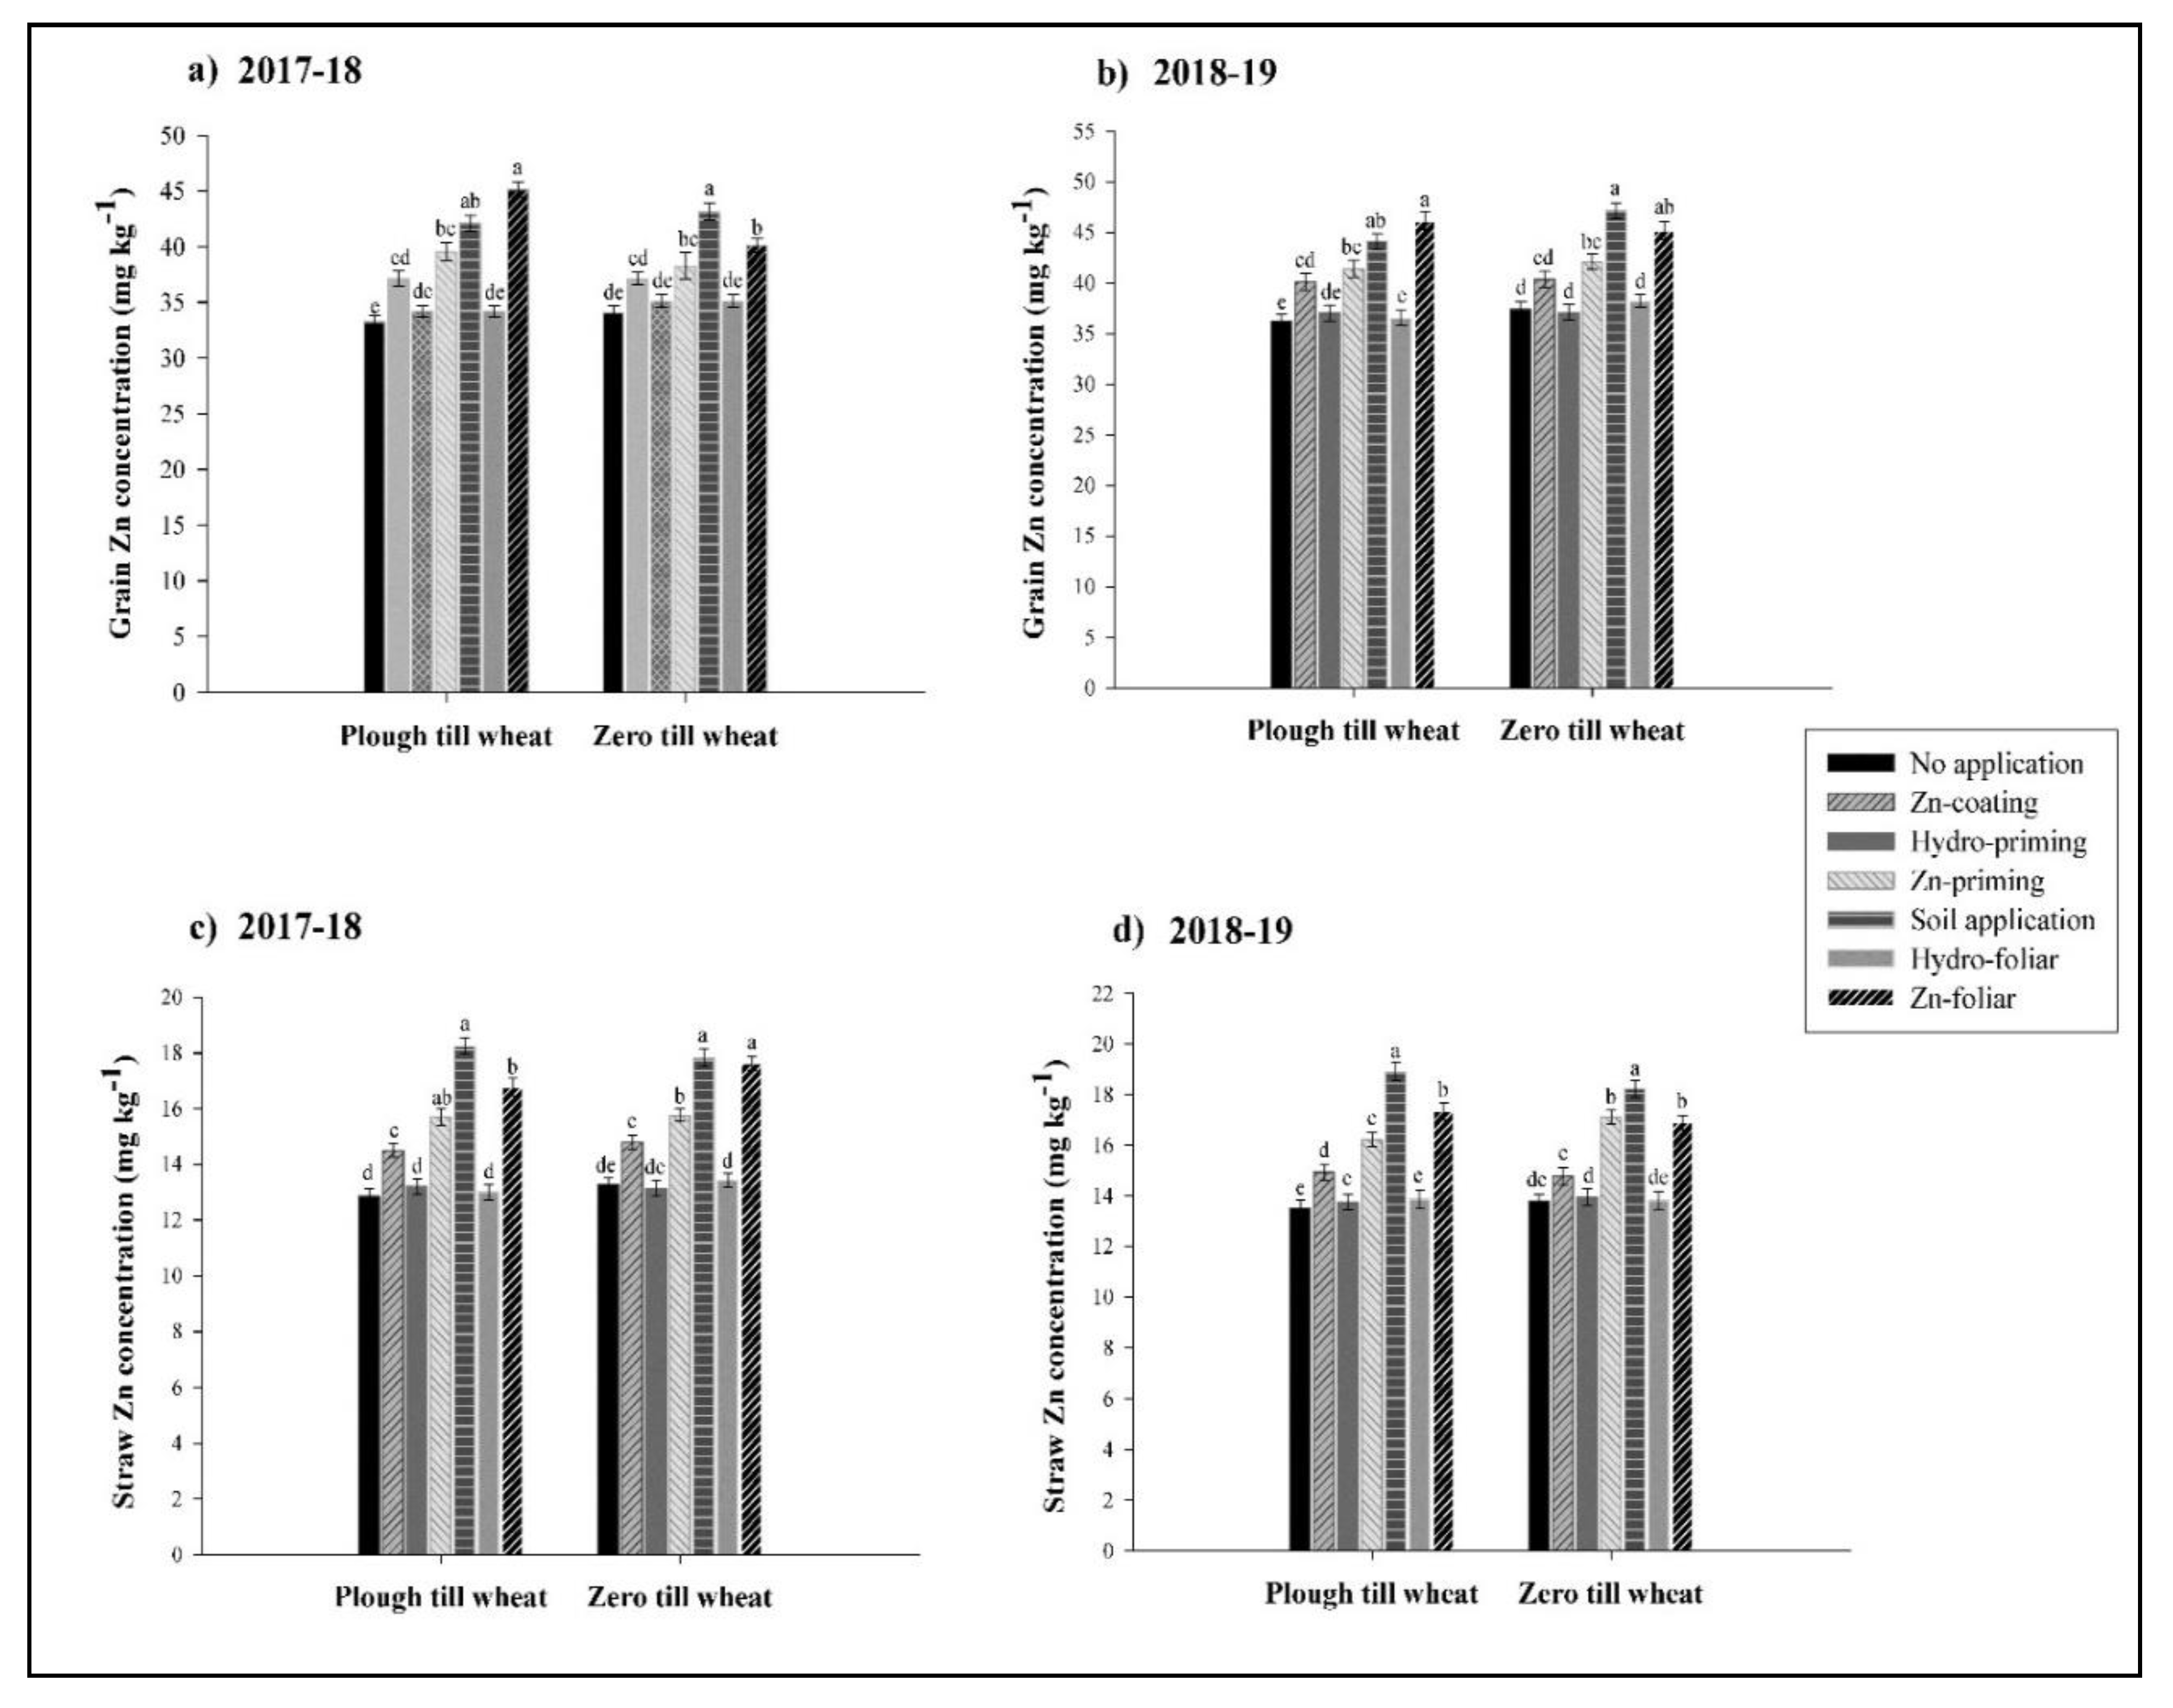
3.3. Grain and Straw Zn Concentration
3.4. Bioavailable Zn Contents in Bread Wheat Grains
3.5. Zinc Use Efficiency Indices
3.6. Economic Analysis
4. Discussion
5. Conclusions
Supplementary Materials
Author Contributions
Funding
Acknowledgments
Conflicts of Interest
References
- Nadeem, F.; Farooq, M. Application of micronutrients in rice-wheat cropping systems of South Asia: A review. Rice Sci. 2019, 26, 356–371. [Google Scholar] [CrossRef]
- Erdal, I.; Yilmaz, A.; Taban, S.; Eker, S.; Torun, B.; Cakmak, I. Phytic acid and phosphorus concentrations in seeds of wheat cultivars grown with and without zinc fertilization. J. Plant Nutr. 2002, 25, 113–127. [Google Scholar] [CrossRef]
- Cakmak, I. Enrichment of cereal grains with zinc: Agronomic or genetic biofortification? Plant Soil. 2008, 302, 1–17. [Google Scholar] [CrossRef]
- Shewry, P.R. Wheat. J. Exp. Bot. 2009, 60, 1537–1553. [Google Scholar] [CrossRef] [PubMed]
- Cakmak, I. Zinc Plays Critical Role in Plant Growth. 2011. Available online: http://www.zinc.org/crops/resourceserve/zinc_plays_critical_role_in_plant_growth (accessed on 17 April 2011).
- Hussain, S.; Maqsood, M.A.; Rahmatullah. Zinc release characteristics from calcareous soils using di-ethylenetri-aminepentaacetic acid and other organic acids. Commun. Soil Sci. Plant Anal. 2011, 42, 1870–1881. [Google Scholar] [CrossRef]
- Alloway, B.J. Soil factors associated with zinc deficiency in crops and humans. Environ. Geochem. Health 2009, 31, 537–548. [Google Scholar] [CrossRef]
- Kumssa, D.B.; Joy, E.J.M.; Ander, E.L.; Watts, M.J.L.; Young, S.D.; Rosanoff, A.; White, P.J.; Walker, S.; Broadley, M.R. Global magnesium supply in the food chain. Crop Pasture Sci. 2015, 66, 1278–1289. [Google Scholar] [CrossRef]
- Kumssa, D.B.; Joy, E.J.; Ander, E.L.; Watts, M.J.; Young, S.D.; Walker, S.; Broadley, M.R. Dietary calcium and zinc deficiency risks are decreasing but remain prevalent. Sci. Rep. 2015, 5, 10974. [Google Scholar] [CrossRef] [Green Version]
- Ministry of Health. National health policy 2009. In Stepping Towards Better Health; Ministry of Health: Islamabad, Pakistan, 2009. [Google Scholar]
- Sillanpaa, M. Micronutrient Assessment at Country Level: An International Study; Soils Bulletin No. 63; FAO: Rome, Italy, 1990; p. 208. [Google Scholar]
- Hussain, A.; Zahir, Z.A.; Asghar, H.N.; Ahmad, M.; Jamil, M.; Naveed, M.; Akhtar, M.F.U.Z. Zinc solubilizing bacteria for zinc biofortification in cereals: A step toward sustainable nutritional security. In Role of Rhizospheric Microbes in Soil; Springer: Singapore, 2018; pp. 203–227. [Google Scholar]
- Lopez-Millan, A.F.; Ellis, D.R.; Grusak, M.A. Effect of zinc and manganese supply on the activities of superoxide dismutase and carbonic anhydrase in Medicago truncatula wild type and raz mutant plants. Plant Sci. 2005, 168, 1015–1022. [Google Scholar] [CrossRef]
- Sinclair, S.A.; Krämer, U. The zinc homeostasis network of land plants. Biochim. Biophys. Acta (BBA) Mol. Cell Res. 2012, 1823, 1553–1567. [Google Scholar] [CrossRef]
- Bhatt, R.; Kukal, S.S.; Busari, M.A.; Arora, S.; Yadav, M. Sustainability issues on rice–wheat cropping system. Int. Soil Water Conserv. Res. 2016, 4, 64–74. [Google Scholar] [CrossRef] [Green Version]
- Jat, H.S.; Datta, A.; Sharma, P.C.; Kumar, V.; Yadav, A.K.; Choudhary, M.; Choudhary, V.; Gathala, M.K.; Sharma, D.K.; Jat, M.L.; et al. Assessing soil properties and nutrient availability under conservation agriculture practices in a reclaimed sodic soil in cereal-based systems of North-West India. Arch. Agron. Soil Sci. 2018, 64, 531–545. [Google Scholar] [CrossRef]
- Nawaz, A.; Farooq, M.; Lal, R.; Rehman, A.; Rehman, H. Comparison of conventional and conservation rice-wheat systems in Punjab. Pakistan. Soil Tillage Res. 2017, 169, 35–43. [Google Scholar] [CrossRef]
- Nawaz, A.; Farooq, M.; Lal, R.; Rehman, A.; Hussain, T.; Nadeem, A. Influence of sesbania brown manuring and rice residue mulch on soil health, weeds and system productivity of conservation rice–wheat systems. Land Degrad. Develop. 2017, 28, 1078–1090. [Google Scholar] [CrossRef]
- Zulfiqar, U.; Maqsood, M.; Hussain, S.; Anwar-ul-Haq, M. Iron nutrition improves productivity, profitability and biofortification of bread wheat under conventional and conservation tillage systems. J. Soil Sci. Plant Nutr. 2020. [Google Scholar] [CrossRef]
- Kumar, D. Effect of Conservation Agriculture on Vertical Distribution of Organic Carbon and Zinc Transformations under Alluvial Soil. Ph.D. Thesis, Department of Soil Science and Agricultural Chemistry, BAU, Sabour, India, 2017. [Google Scholar]
- Loke, P.F.; Kotzé, E.; Du Preez, C.C. Impact of long-term wheat production management practices on soil acidity, phosphorus and some micronutrients in a semi-arid Plinthosol. Soil Res. 2013, 51, 415–426. [Google Scholar] [CrossRef]
- Nawaz, A.; Farooq, M.; Nadeem, F.; Siddique, K.H.M.; Lal, R. Rice–wheat cropping systems in South Asia: Issues, options and opportunities. Crop Pasture Sci. 2019, 70, 395–427. [Google Scholar] [CrossRef]
- Dixit, A.K.; Agrawal, R.K.; Das, S.K.; Sahay, C.S.; Choudhary, M.; Rai, A.K.; Palsaniya, D.R. Soil properties, crop productivity and energetics under different tillage practices in fodder sorghum + cowpea–wheat cropping system. Arch. Agron. Soil Sci. 2019, 65, 492–506. [Google Scholar] [CrossRef]
- Naresh, R.K.; Timsina, J.; Bhaskar, S.; Gupta, R.K.; Singh, A.K.; Dhaliwal, S.S.; Rathore, R.S.; Kumar, V.; Singh, P.; Singh, S.P.; et al. Effects of tillage, residue and nutrient management on soil organic carbon dynamics and its fractions, soil aggregate stability and soil carbon sequestration: A review. EC Nutr. 2017, 12, 53–80. [Google Scholar]
- Dasappagol, A.; Bellakki, M.A.; Ravi, M.V.; Kuchanur, P.H.; Jat, M.L. Distribution of zinc fractions in surface alfisol after five years of conservation agriculture practices in rainfed Pigeonpea. Int. J. Chem. Stud. 2017, 5, 227–232. [Google Scholar]
- Dubock, A. An overview of agriculture, nutrition and fortification, supplementation and biofortification: Golden Rice as an example for enhancing micronutrient intake. Agric. Food Secur. 2017, 6, 1–20. [Google Scholar] [CrossRef] [Green Version]
- Zulfiqar, U.; Maqsood, M.; Hussain, S. Biofortification of Rice with Iron and Zinc: Progress and Prospects. In Rice Research for Quality Improvement: Genomics and Genetic Engineering; Springer: Singapore, 2020; pp. 605–627. [Google Scholar]
- Jaffe, G. Regulating transgenic crops: A comparative analysis of different regulatory processes. Transgenic Res. 2004, 13, 5–19. [Google Scholar] [CrossRef] [PubMed]
- Saha, S.; Mandal, B.; Hazra, G.C.; Dey, A.; Chakraborty, M.; Adhikari, B.; Mukhopadhyay, S.K.; Sadhukhan, R. Can agronomic biofortification of zinc be benign for iron in cereals? J. Cereal Sci. 2015, 65, 186–191. [Google Scholar] [CrossRef]
- Zulfiqar, U.; Hussain, S.; Ishfaq, M.; Ali, N.; Yasin, M.U.; Ali, M.A. Foliar manganese supply enhances crop productivity, net benefits, and grain manganese accumulation in direct-seeded and puddled transplanted rice. J. Plant Growth Regul. 2020, 1–18. [Google Scholar] [CrossRef]
- Chattha, M.U.; Hassan, M.U.; Khan, I.; Chattha, M.B.; Mahmood, A.; Nawaz, M.; Subhani, M.N.; Kharal, M.; Khan, S. Biofortification of wheat cultivars to combat zinc deficiency. Front. Plant Sci. 2017, 8, 281. [Google Scholar] [CrossRef] [Green Version]
- Dhaliwal, S.S.; Ram, H.; Shukla, A.K.; Mavi, G.S. Zinc biofortification of bread wheat, triticale, and durum wheat cultivars by foliar zinc fertilization. J. Plant Nutr. 2019, 42, 813–822. [Google Scholar] [CrossRef]
- Hassan, M.U.; Chattha, M.U.; Ullah, A.; Khan, I.; Qadeer, A.; Aamer, M.; Khan, A.U.; Nadeem, F.; Khan, T.A. Agronomic biofortification to improve productivity and grain Zn concentration of bread wheat. Int. J. Agric. Biol. 2019, 21, 615–620. [Google Scholar]
- FAO (Food and Agriculture Organization). World reference base for soil resources 2014. In International Soil Classification System for Naming Soils and Creating Legends for Soil Maps; FAO (Food and Agriculture Organization): Rome, Italy, 2014. [Google Scholar]
- USDA (United State Department of Agriculture). Keys to soil taxonomy. In Natural Resources Conservation Service, 12th ed.; USDA (United State Department of Agriculture): Kansas City, MO, USA, 2014. [Google Scholar]
- ISTA. International Rules for Seed Testing; International Seed Testing Association: Zürich, Switzerland, 2015. [Google Scholar]
- Meier, U. Growth Stages of Mono-And Dicotyledonous Plants; Federal Biological Research Centre for Agriculture and Forestry: Berlin, Germany, 2001. [Google Scholar]
- Blake, G.H.; Hartge, K.H. Bulk density. In Methods of Soil Analysis, 2nd ed.; Klute, A., Ed.; Agron. No. 9, Part; American Society of Agronomy: Madison, WI, USA, 1986; pp. 363–375. [Google Scholar]
- Vomocil, J.A. Porosity. In Methods of Soil Analysis; Blake, C.A., Ed.; American Society of Agronomy: Madison, WI, USA, 1965; pp. 299–314. [Google Scholar]
- Bremner, J.M.; Mulvaney, C.S. Total nitrogen. In Methods of Soil Analysis; Page, A.L., Miller, R.H., Keeny, D.R., Eds.; American Society of Agronomy: Madison, WI, USA, 1982; pp. 1119–1123. [Google Scholar]
- Olsen, S.R. Estimation of Available Phosphorus in Soils by Extraction with Sodium Bicarbonate (No. 939); US Department of Agriculture: Madison, WI, USA, 1954. [Google Scholar]
- Richards, L.A. Diagnosis and Improvement of Saline and Alkali Soils; LWW: New York, NY, USA, 1954; p. 154. [Google Scholar]
- Walkley, A.; Black, I.A. An examination of the Degtjareff method for determining soil organic matter, and a proposed modification of the chromic acid titration method. Soil Sci. 1934, 37, 29–38. [Google Scholar] [CrossRef]
- Brookes, P.C.; Landman, A.; Pruden, G.; Jenkinson, D.S. Chloroform fumigation and the release of soil nitrogen: A rapid direct extraction method to measure microbial biomass nitrogen in soil. Soil Biol. Biochem. 1985, 17, 837–842. [Google Scholar] [CrossRef]
- Anderson, J.M.; Ingram, J.S.I. Tropical Soil Biology and Fertility. In A Handbook of Methods, 2nd ed.; CAB International: Wallingford, UK, 1993. [Google Scholar]
- Rashid, A. Mapping Zinc Fertility of Soils Using Indicator Plants and Soil Analyses. Ph.D. Thesis, University of Hawaii at Manoa, Monoa, HI, USA, 1986. [Google Scholar]
- Haug, W.; Lantzsch, H. Sensitive method for the rapid determination of phytate in cereals and cereal products. J. Sci. Food Agric. 1983, 34, 1423–1424. [Google Scholar] [CrossRef]
- Rehman, A.; Farooq, M.; Naveed, M.; Nawaz, A.; Shahzad, B. Seed priming of Zn with endophytic bacteria improves the productivity and grain biofortification of bread wheat. Eur. J. Agron. 2018, 94, 98–107. [Google Scholar] [CrossRef]
- Rehman, A.; Farooq, M.; Naveed, M.; Ozturk, L.; Nawaz, A. Pseudomonas-aided zinc application improves the productivity and biofortification of bread wheat. Crop Pasture Sci. 2018, 69, 659–672. [Google Scholar] [CrossRef]
- Miller, L.V.; Krebs, N.F.; Hambidge, K.M. A mathematical model of zinc absorption in humans as a function of dietary zinc and phytate. J. Nutr. 2007, 137, 135–141. [Google Scholar] [CrossRef] [PubMed]
- Hambidge, K.M.; Miller, L.V.; Westcott, J.E.; Sheng, X.; Krebs, N.F. Zinc bioavailability and homeostasis. Am. J. Clin. Nutr. 2010, 91, 1478–1483. [Google Scholar] [CrossRef] [PubMed] [Green Version]
- FAO (Food and Agriculture Organization). Food supply database 2007. In Food and Agriculture Organization; FAO (Food and Agriculture Organization): Rome, Italy, 2014; Available online: http://faostat.fao.org/site/609/default.aspx# (accessed on 18 April 2018).
- Fageria, N.K. The Use of Nutrients in Crop Plants; CRC Press: Boca Raton, FL, USA, 2009. [Google Scholar]
- Shivay, Y.S.; Prasad, R. Zinc-coated urea improves productivity and quality of basmati rice (Oryza sativa L.) under zinc stress condition. J. Plant Nutr. 2012, 35, 928–951. [Google Scholar] [CrossRef]
- CIMMYT Economics Program, International Maize, & Wheat Improvement Center. From Agronomic Data to Farmer Recommendations: An Economics Training Manual (No. 27); CIMMYT: Texcoco, Mexico, 1988; pp. 31–33. [Google Scholar]
- Steel, R.G.D.; Torrie, J.H.; Dickey, D.A. Principles and Procedures of Statistics a Biometrical Approach (No. 519.5 S8); McGraw-Hill: New York, NY, USA, 1997. [Google Scholar]
- Shah, A.N.; Tanveer, M.; Shahzad, B.; Yang, G.; Fahad, S.; Ali, S.; Bukhari, M.A.; Tung, S.A.; Hafeez, A.; Souliyanonh, B. Soil compaction effects on soil health and crop productivity: An overview. Environ. Sci. Pollut. Res. 2017, 24, 10056–10067. [Google Scholar] [CrossRef] [PubMed]
- Hobbs, P.R. Conservation agriculture: What is it and why is it important for future sustainable food production? J. Agric. Sci. 2007, 145, 127–137. [Google Scholar] [CrossRef] [Green Version]
- Meena, J.R.; Behera, U.K.; Chakraborty, D.; Sharma, A.R. Tillage and residue management effect on soil properties, crop performance and energy relations in green gram (Vigna radiata L.) under maize-based cropping systems. Int. Soil Water Cons. Res. 2015, 3, 261–272. [Google Scholar] [CrossRef] [Green Version]
- Busari, M.A.; Kukal, S.; Kaur, A.; Bhatt, R.; Dulazi, A.A. Conservation tillage impacts on soil, crop and the environment. Int. Soil Water Cons. Res. 2015, 3, 119–129. [Google Scholar] [CrossRef] [Green Version]
- Nandan, R.; Singh, V.; Singh, S.S.; Kumar, V.; Hazra, K.K.; Nath, C.P.; Pooniad, S.; Malikd, R.K.; Bhattacharyyae, R.; McDonald, A. Impact of conservation tillage in rice-based cropping systems on soil aggregation, carbon pools and nutrients. Geoderma 2019, 340, 104–114. [Google Scholar] [CrossRef]
- Chen, H.; Hou, R.; Gong, Y.; Li, H.; Fan, M.; Kuzyakov, Y. Effects of 11 years of conservation tillage on soil organic matter fractions in wheat monoculture in Loess Plateau of China. Soil Tillage Res. 2009, 106, 85–94. [Google Scholar] [CrossRef]
- Lupwayi, N.; Hanson, K.; Harker, K.; Clayton, G.; Blackshaw, R.; O’Donovan, J.; Johnson, E.; Gan, Y.; Irvine, R.; Monreal, M. Soil microbial biomass, functional diversity and enzyme activity in glyphosate-resistant wheat–canola rotations under low-disturbance direct seeding and conventional tillage. Soil Biol. Biochem. 2007, 39, 1418–1427. [Google Scholar] [CrossRef]
- Balota, E.L.; Colozzi-Filho, A.; Andrade, D.S.; Dick, R.P. Microbial biomass in soils under different tillage and crop rotation systems. Biol. Fert. Soils. 2003, 38, 15–20. [Google Scholar] [CrossRef]
- Haddaway, N.R.; Hedlund, K.; Jackson, L.E.; Kätterer, T.; Lugato, E.; Thomsen, I.K.; Jørgensen, H.B.; Isberg, P.E. How does tillage intensity affect soil organic carbon? A systematic review. Environ. Evid. 2016, 6, 30. [Google Scholar] [CrossRef] [Green Version]
- Zikeli, S.; Gruber, S.; Teufel, C.F.; Hartung, K.; Claupein, W. Effects of reduced tillage on crop yield, plant available nutrients and soil organic matter in a 12-year long-term trial under organic management. Sustainability 2013, 5, 3876–3894. [Google Scholar] [CrossRef] [Green Version]
- Roscoe, R.; Burman, P. Tillage effects on soil organic matter in the density fractions of a Cerrado Oxisol. Soil Tillage Res. 2003, 70, 107–119. [Google Scholar] [CrossRef]
- Paul, B.K.; Vanlauwe, B.; Ayuke, F.; Gassner, A.; Hoogmoed, M.; Hurisso, T.T.; Koala, S.; Lelei, D.; Ndabamenye, T.; Six, J.; et al. Medium-term impact of tillage and residue management on soil aggregate stability, soil carbon, and crop productivity. Agric. Ecosyst. Environ. 2013, 164, 14–22. [Google Scholar] [CrossRef]
- Das, A.; Lyngdoh, D.; Ghosh, P.K.; Lal, R.; Layek, J.; Idapuganti, R.G. Tillage and cropping sequence effect on physico-chemical and biological properties of soil in Eastern Himalayas, India. Soil Tillage Res. 2018, 180, 182–193. [Google Scholar] [CrossRef]
- Meisinger, J.J.; Palmer, R.E.; Timlin, D.J. Effects of tillage practices on drainage and nitrate leaching from winter wheat in the Northern Atlantic Coastal-Plain USA. Soil Tillage Res. 2015, 151, 18–27. [Google Scholar] [CrossRef]
- Ali, M.A.; Ladha, J.K.; Rickman, J.; Lales, J.S. Comparison of different methods of rice establishment and nitrogen management strategies for lowland rice. J. Crop Improv. 2006, 16, 173–189. [Google Scholar] [CrossRef]
- Vincent, A.G.; Turner, B.L.; Tanner, E.V.J. Soil organic phosphorus dynamics following perturbation of litter cycling in a tropical moist forest. Eur. J. Soil Sci. 2010, 61, 48–57. [Google Scholar] [CrossRef]
- Martin-Rueda, I.; Munoz-Guerra, L.M.; Yunta, F.; Esteban, E.; Tenorio, J.L.; Lucena, J.J. Tillage and crop rotation effects on barley yield and soil nutrients on a Calciortidic Haploxeralf. Soil Tillage Res. 2007, 92, 1–9. [Google Scholar] [CrossRef]
- Bam, R.K.; Kumaga, F.K.; Ori, K.; Asiedu, E.A. Germination, vigour and dehydrogenase activity of naturally aged rice (Oryza sativa L.) seeds soaked in potassium and phosphorus. Asian J. Plant Sci. 2006, 5, 948–955. [Google Scholar]
- Singh, H.; Jassal, R.K.; Kang, J.S.; Sandhu, S.S.; Kang, H.; Grewal, K. Seed priming techniques in field crops—A review. Agric. Rev. 2015, 36, 251–264. [Google Scholar] [CrossRef] [Green Version]
- Farooq, M.; Usman, M.; Nadeem, F.; Rehman, H.; Wahid, A.; Basra, S.M.A.; Siddique, K.H.M. Seed priming in field crops: Potential benefits, adoption and challenges. Crop Pasture Sci. 2019, 70, 731. [Google Scholar] [CrossRef]
- Rehman, A.; Farooq, M.; Ozturk, L.; Asif, M.; Siddique, K.H.M. Zinc nutrition in wheat-based cropping systems. Plant Soil 2018, 422, 283–315. [Google Scholar] [CrossRef]
- Reis, S.; Pavia, I.; Carvalho, A.; Moutinho-Pereira, J.; Correia, C.; Lima-Brito, J. Seed priming with iron and zinc in bread wheat: Effects in germination, mitosis and grain yield. Protoplasma 2018, 255, 1179–1194. [Google Scholar] [CrossRef]
- Bityutskii, N.P.; Davydovskaya, E.N.; Malyuga, E.A.; Yakkonen, K.L. Mechanisms underlying iron and zinc transport to axis organs in grain during early seedling development of maize. J. Plant Nutr. 2004, 27, 1525–1541. [Google Scholar] [CrossRef]
- Cakmak, I.; Marschner, H. Effect of zinc nutritional status on activities of superoxide radical and hydrogen peroxide scavenging enzymes in bean leaves. Plant Soil 1993, 155, 127–130. [Google Scholar] [CrossRef]
- Mabesa, R.L.; Impa, S.M.; Grewal, D.; Johnson-Beebout, S.E. Contrasting grain-Zn response of biofortification rice (Oryza sativa L.) breeding lines to foliar Zn application. Field Crop. Res. 2013, 149, 223–233. [Google Scholar] [CrossRef]
- Wu, C.Y.; Lu, L.L.; Yang, X.E.; Feng, Y.; Wei, Y.Y.; Hao, H.L.; Stoffella, P.J.; He, Z.L. Uptake, translocation, and remobilization of zinc absorbed at different growth stages by rice genotypes of different Zn densities. J. Agric. Food Chem. 2010, 58, 6767–6773. [Google Scholar] [CrossRef] [PubMed]
- Li, M.; Yang, X.W.; Tian, X.H.; Wang, S.X.; Chen, Y.L. Effect of nitrogen fertilizer and foliar zinc application at different growth stages on zinc translocation and utilization efficiency in winter wheat. Cereal Res. Commun. 2014, 42, 81–90. [Google Scholar] [CrossRef]
- Farooq, M.; Ullah, A.; Rehman, A.; Nawaz, A.; Nadeem, A.; Wakeel, A.; Nadeem, F.; Siddique, K.H.M. Application of zinc improves the productivity and biofortification of fine grain aromatic rice grown in dry seeded and puddled transplanted production systems. Field Crop. Res. 2018, 216, 53–62. [Google Scholar] [CrossRef]
- Dimkpa, C.O.; White, J.C.; Elmer, W.H.; Gardea-Torresdey, J. Nanoparticle and ionic Zn promote nutrient loading of sorghum grain under low NPK fertilization. J. Agric. Food Chem. 2017, 65, 8552–8559. [Google Scholar] [CrossRef] [PubMed]
- Gupta, R.K.; Gangoliya, S.S.; Singh, N.K. Reduction of phytic acid and enhancement of bioavailable micronutrients in food grains. J. Food Sci. Technol. 2015, 52, 676–684. [Google Scholar] [CrossRef] [Green Version]
- Huang, C.; Barker, S.J.; Langridge, P.; Smith, F.W.; Graham, R.D. Zinc deficiency up-regulates expression of high-affinity phosphate transporter genes in both phosphate- sufficient and—Deficient barley roots. Plant Physiol. 2000, 124, 415–422. [Google Scholar] [CrossRef] [Green Version]
- Cakmak, I.; Pfeiffer, W.H.; McClafferty, B. Biofortification of durum wheat with zinc and iron. Cereal Chem. 2010, 87, 10–20. [Google Scholar] [CrossRef] [Green Version]
- Cakmak, I.; Kalayci, M.; Kaya, Y.; Torun, A.A.; Aydin, N.; Wang, Y.; Arisoy, Z.; Erdem, H.; Yazici, A.; Gokmen, O.; et al. Biofortification and localization of zinc in wheat grain. J. Agric. Food Chem. 2010, 58, 9092–9102. [Google Scholar] [CrossRef]
Publisher’s Note: MDPI stays neutral with regard to jurisdictional claims in published maps and institutional affiliations. |

| Months | Rainfall | Relative Humidity | Temperature (°C) | Sunshine (h) | ||||||||
|---|---|---|---|---|---|---|---|---|---|---|---|---|
| (mm) | (%) | Monthly Maximum | Monthly Minimum | Monthly Mean | ||||||||
| 2017–2018 | 2018–2019 | 2017–2018 | 2018–2019 | 2017–2018 | 2018–2019 | 2017–2018 | 2018–2019 | 2017–2018 | 2018–2019 | 2017–2018 | 2018–2019 | |
| November | 01.50 | 00.6 | 84.6 | 74.6 | 24.1 | 27.0 | 11.8 | 12.4 | 18.0 | 19.7 | 3.7 | 6.9 |
| December | 04.20 | 00.7 | 69.3 | 81.7 | 22.0 | 21.7 | 6.7 | 6.5 | 14.4 | 14.1 | 6.0 | 6.9 |
| January | 00.00 | 18.0 | 75.9 | 81.0 | 21.5 | 19.2 | 5.5 | 7.0 | 13.5 | 13.2 | 6.4 | 5.4 |
| February | 09.50 | 73.2 | 73.3 | 79.0 | 24.0 | 20.3 | 9.5 | 9.1 | 16.7 | 14.7 | 6.5 | 6.7 |
| March | 12.50 | 55.7 | 61.6 | 68.8 | 31.2 | 26.0 | 16.4 | 13.8 | 23.8 | 19.9 | 8.6 | 8.9 |
| April | 07.90 | 31.2 | 47.3 | 57.4 | 36.8 | 35.0 | 20.8 | 20.6 | 28.8 | 27.8 | 9.1 | 9.0 |
| Treatments | 2017–2018 | 2018–2019 | ||
|---|---|---|---|---|
| 0–10 cm | 10–20 cm | 0–10 cm | 10–20 cm | |
| Soil bulk density (g cm−3) | ||||
| Plough tillage | 1.67 A | 1.63 A | 1.65 A | 1.66 A |
| Zero tillage | 1.60 B | 1.57 B | 1.58 B | 1.59 B |
| HSD (p ≤ 0.05) | 0.04 | 0.03 | 0.03 | 0.02 |
| Total Soil Porosity (%) | ||||
| Plough tillage | 37.75 B | 39.00 B | 36.67 B | 38.00 B |
| Zero tillage | 43.57 A | 41.85 A | 42.00 A | 40.76 A |
| HSD (p ≤ 0.05) | 0.90 | 0.63 | 0.70 | 0.38 |
| Penetration Resistance (kPa) | ||||
| Plough tillage | 513.1 A | 580.1 B | 520.4 B | 575.4 B |
| Zero tillage | 530.9 A | 640.9 A | 599.1 A | 691.1 A |
| HSD (p ≤ 0.05) | NS | 13.61 | 19.51 | 11.63 |
| Soil Microbial Biomass Carbon (μg g−1) | ||||
| Plough tillage | 160.8 B | 163.4 B | 168.4 B | 164.9 B |
| Zero tillage | 168.9 A | 169.5 A | 177.3 A | 173.3 A |
| HSD (p ≤ 0.05) | 1.41 | 2.92 | 3.41 | 1.68 |
| Soil Microbial Biomass Nitrogen (μg g−1) | ||||
| Plough tillage | 574.9 B | 562.0 B | 578.0 B | 561.1 B |
| Zero tillage | 607.6 A | 587.3 A | 598.4 A | 593.3 A |
| HSD (p ≤ 0.05) | 11.96 | 2.21 | 8.69 | 5.32 |
| Soil Organic Carbon (g kg−1) | ||||
| Plough tillage | 6.09 B | 5.62 B | 6.58 B | 5.73 B |
| Zero tillage | 7.21 A | 6.55 A | 7.55 A | 6.68 A |
| HSD (p ≤ 0.05) | 0.11 | 0.50 | 0.18 | 0.05 |
| Table | 2017–2018 | 2018–2019 | ||||
|---|---|---|---|---|---|---|
| PTW | ZTW | Mean (Zn) | PTW | ZTW | Mean (Zn) | |
| Productive Tillers (m−2) | ||||||
| No application | 319 d | 320 d | 320 F | 316 fg | 319 efg | 318 D |
| Zn-coating | 340 b | 336 bc | 338 C | 335 cd | 333 cd | 334 BC |
| Hydro-priming | 325 cd | 328 cd | 327 DE | 317 efg | 313 g | 315 D |
| Zn-priming | 365 a | 364 a | 365 A | 354 ab | 360 a | 357 A |
| Soil application | 355 a | 354 a | 355 B | 344 bc | 330 de | 337 B |
| Hydro-foliar | 320 d | 325 cd | 323 EF | 317 efg | 315 fg | 316 D |
| Zn-foliar | 327 cd | 329 bcd | 328 D | 327 def | 322 defg | 325 CD |
| Mean (WTs) | 336 A | 337 A | 330 A | 327 A | ||
| HSD (p ≤ 0.05) | Zn = 4.48 | Zn = 9.68 | ||||
| Grains per Spike | ||||||
| No application | 33 g | 35 ef | 34 F | 35 e | 36 e | 36 C |
| Zn-coating | 41 d | 41 d | 41 D | 41 d | 41 d | 41 C |
| Hydro-priming | 34 fg | 35 ef | 35 EF | 36 e | 36 e | 36 C |
| Zn-priming | 47 a | 47 a | 47 A | 45 b | 47 a | 46 A |
| Soil application | 43 c | 44 bc | 44 C | 43 c | 43 c | 43 B |
| Hydro-foliar | 35 ef | 36 e | 36 E | 36 e | 35 e | 36 C |
| Zn-foliar | 45 b | 45 b | 45 B | 47 a | 45 b | 46 A |
| Mean (WTs) | 39.7 B | 40.4 A | 40.4 A | 40.4 A | ||
| HSD (p ≤ 0.05) | WTs = 0.7; Zn = 0.61 | Zn = 0.93; WTs × Zn = 1.32 | ||||
| 1000-grain Weight (g) | ||||||
| No application | 35.17 f | 35.36 f | 35.26 D | 36.07 d | 35.97 d | 36.02 D |
| Zn-coating | 38.00 ef | 38.92 de | 38.46 C | 38.37 c | 38.35 c | 38.36 C |
| Hydro-priming | 35.97 f | 35.78 f | 35.87 D | 35.97 d | 36.84 d | 36.41 D |
| Zn-priming | 44.89 a | 44.30 ab | 44.59 A | 43.98 a | 44.97 a | 44.47 A |
| Soil application | 41.16 cd | 41.83 bcd | 41.49 B | 41.16 b | 42.36 b | 41.76 B |
| Hydro-foliar | 35.15 f | 36.32 ef | 35.73 D | 36.15 d | 36.12 d | 36.13 D |
| Zn-foliar | 42.70 abc | 42.24 abc | 42.47 B | 44.04 a | 44.41 a | 44.22 A |
| Mean (WTs) | 39.00 A | 39.25 A | 39.39 A | 39.86 A | ||
| HSD (p ≤ 0.05) | Zn = 1.68 | Zn = 1.24 | ||||
| Treatments | 2017–2018 | 2018–2019 | ||||
|---|---|---|---|---|---|---|
| PTW | ZTW | Mean (Zn) | PTW | ZTW | Mean (Zn) | |
| Biological Yield (Mg ha−1) | ||||||
| No application | 7.39 g | 7.57 f | 7.48 E | 6.93 j | 6.86 j | 6.89 G |
| Zn-coating | 8.11 de | 7.98 ef | 8.04 C | 7.79 e | 7.51 f | 7.65 D |
| Hydro-priming | 7.77 fgi | 7.78 fg | 7.77 D | 7.41 fg | 7.32 gh | 7.36 E |
| Zn-priming | 8.77 ab | 8.81 a | 8.79 A | 8.49 b | 8.21 c | 8.35 B |
| Soil application | 8.86 a | 8.88 a | 8.87 A | 8.74 a | 8.31 bc | 8.52 A |
| Hydro-foliar | 7.45 fg | 7.60 ef | 7.52 E | 7.19 hi | 7.15 i | 7.17 F |
| Zn-foliar | 8.49 b | 8.35 b | 8.42 B | 8.29 c | 7.98 d | 8.14 C |
| Mean (WTs) | 8.12 A | 8.14 A | 7.83 A | 7.62 A | ||
| HSD (p ≤ 0.05) | Zn = 0.12 | Zn = 0.08; WTs × Zn = 0.12 | ||||
| Grain Yield (Mg ha−1) | ||||||
| No application | 3.13 f | 3.26 f | 3.19 F | 3.23 hi | 3.35 fg | 3.29 E |
| Zn-coating | 3.85 c | 3.87 c | 3.86 C | 3.53 e | 3.64 d | 3.59 D |
| Hydro-priming | 3.26 ef | 3.40 e | 3.33 E | 3.18 i | 3.37 f | 3.28 E |
| Zn-priming | 4.42 a | 4.45 a | 4.43 A | 4.35 a | 4.39 a | 4.37 A |
| Soil application | 4.13 b | 4.15 b | 4.14 B | 3.98 b | 4.10 b | 4.06 B |
| Hydro-foliar | 3.22 f | 3.23 f | 3.22 F | 3.28 gh | 3.32 fgh | 3.30 E |
| Zn-foliar | 3.58 d | 3.80 c | 3.69 D | 3.76 c | 3.62 d | 3.69 C |
| Mean (WTs) | 3.65 B | 3.74 A | 3.58 B | 3.64 A | ||
| HSD (p ≤ 0.05) | WTs = 0.015; Zn = 0.09; WTs × Zn = 0.15 | WTs = 0.03; Zn = 0.097 | ||||
| Harvest Index (%) | ||||||
| No application | 42.36 ef | 43.05 ef | 42.71 E | 46.71 a | 48.84 a | 47.77 B |
| Zn-coating | 47.47 bc | 48.50 b | 47.98 B | 45.32 a | 48.47 a | 46.90 BC |
| Hydro-priming | 41.96 f | 43.70 e | 42.83 DE | 42.91 a | 46.04 a | 44.47 D |
| Zn-priming | 50.40 a | 50.51 a | 50.45 A | 51.24 a | 53.47 a | 52.35 A |
| Soil application | 46.61 cd | 46.73 bcd | 46.67 C | 45.99 a | 49.33 a | 47.66 B |
| Hydro-foliar | 43.22 ef | 42.50 ef | 42.86 DE | 45.62 a | 46.44 a | 46.03 BCD |
| Zn-foliar | 42.16 ef | 45.51 d | 43.83 D | 45.36 a | 45.45 a | 45.40 CD |
| Mean (WTs) | 44.9 A | 45.8 A | 46.16 B | 48.29 A | ||
| HSD (p ≤ 0.05) | Zn = 1.09; WTs × Zn = 1.78 | WTs = 1.30; Zn = 1.75 | ||||
| Treatments | 2017–2018 | 2018–2019 | ||||
|---|---|---|---|---|---|---|
| PTW | ZTW | Mean (Zn) | PTW | ZTW | Mean (Zn) | |
| Phytic Acid (mg g−1) | ||||||
| No application | 12.46 a | 12.39 a | 12.42 A | 13.05 ab | 13.13 a | 13.09 A |
| Zn-coating | 11.06 a | 11.39 a | 11.22 B | 12.10 cd | 12.48 bc | 12.29 B |
| Hydro-priming | 12.49 a | 12.53 a | 12.51 A | 13.08 ab | 13.02 ab | 13.05 A |
| Zn-priming | 10.71 a | 10.85 a | 10.78 C | 11.60 de | 11.74 de | 11.67 C |
| Soil application | 9.89 a | 10.32 a | 10.10 D | 10.78 fg | 11.21 ef | 10.99 D |
| Hydro-foliar | 12.44 a | 12.46 a | 12.45 A | 13.03 ab | 13.13 a | 13.08 A |
| Zn-foliar | 9.98 a | 9.62 a | 9.80 D | 10.87 fg | 10.51 g | 10.69 D |
| Mean (WTs) | 11.29 A | 11.36 A | 12.07 A | 12.17 A | ||
| HSD (p ≤ 0.05) | Zn = 0.32 | Zn = 0.35; WTs × Zn = 0.56 | ||||
| [Phytate]:[Zn] | ||||||
| No application | 37.13 a | 35.99 ab | 36.56 A | 35.68 a | 34.78 a | 35.23 A |
| Zn-coating | 29.50 cd | 30.40 c | 29.95 B | 29.92 a | 30.66 a | 30.29 B |
| Hydro-priming | 36.17 ab | 35.37 ab | 35.77 A | 34.99 a | 34.76 a | 34.87 A |
| Zn-priming | 26.84 e | 28.10 de | 27.47 C | 27.76 a | 27.64 a | 27.70 C |
| Soil application | 23.28 f | 23.68 f | 23.48 D | 24.21 a | 23.57 a | 23.89 D |
| Hydro-foliar | 36.03 ab | 35.15 b | 35.59 A | 35.33 a | 34.04 a | 34.68 A |
| Zn-foliar | 21.89 f | 23.78 f | 22.83 D | 23.34 a | 23.05 a | 23.19 D |
| Mean (WTs) | 30.12 A | 30.35 A | 30.17 A | 29.78 A | ||
| HSD (p ≤ 0.05) | Zn = 1.49; WTs × Zn = 1.49 | Zn = 1.25 | ||||
| Estimated Bioavailable Zinc (mg 300 g−1 flour) | ||||||
| No application | 1.99 e | 2.03 e | 2.01 E | 2.05 f | 2.09 ef | 2.07 D |
| Zn-coating | 2.30 c | 2.26 cd | 2.28 CD | 2.29 cd | 2.26 cde | 2.27 C |
| Hydro-priming | 2.03 e | 2.06 de | 2.04 DE | 2.08 ef | 2.09 ef | 2.08 D |
| Zn-priming | 2.43 bc | 2.37 c | 2.40 BC | 2.39 c | 2.40 bc | 2.39 B |
| Soil application | 2.63 ab | 2.61 ab | 2.62 AB | 2.59 ab | 2.63 a | 2.61 A |
| Hydro-foliar | 2.03 e | 2.07 de | 2.05 DE | 2.07 ef | 2.12 def | 2.09 D |
| Zn-foliar | 2.73 a | 2.60 ab | 2.66 A | 2.64 a | 2.66 a | 2.65 A |
| Mean (WTs) | 2.30 A | 2.28 A | 2.30 A | 2.32 A | ||
| HSD (p ≤ 0.05) | Zn = 0.23 | Zn = 0.112 | ||||
| Treatments | 2017–2018 | 2018–2019 | ||||
|---|---|---|---|---|---|---|
| PTW | ZTW | Mean (Zn) | PTW | ZTW | Mean (Zn) | |
| Agronomic Efficiency (kg kg−1) | ||||||
| Zn-coating | 4615.4 a | 3910.3 b | 4262.8 A | 1880.3 a | 1859.0 a | 1869.7 A |
| Zn-priming | 970.00 c | 900.00 c | 935.00 B | 750.00 bc | 750.00 bc | 750.00 B |
| Soil application | 108.00 d | 96.000 d | 102.00 C | 91.300 c | 75.000 c | 83.200 C |
| Zn-Foliar | 937.50 c | 1125.0 c | 1031.2 B | 1090.3 ab | 576.40 bc | 833.30 B |
| Mean (WTs) | 1657.7 A | 1507.8 A | 952.99 A | 815.09 A | ||
| HSD (p ≤ 0.05) | Zn = 233.0; WTs × Zn = 241.7 | Zn = 501.90; WTs × Zn = 775.21 | ||||
| Physiological efficiency (kg kg−1) | ||||||
| Zn-coating | 130.85 a | 95.810 a | 113.33 B | 170.28 a | 242.15 a | 206.21 A |
| Zn-priming | 163.75 a | 198.22 a | 180.98 A | 202.32 a | 173.76 a | 188.04 A |
| Soil application | 122.48 a | 104.70 a | 113.59 B | 152.26 a | 118.98 a | 135.62 A |
| Zn-Foliar | 70.140 a | 76.220 a | 73.18 C | 99.750 a | 106.25 a | 103.00 A |
| Mean (WTs) | 121.81 A | 118.74 A | 156.15 A | 160.28 A | ||
| HSD (p ≤ 0.05) | Zn = 28.06 | |||||
| Agro-Physiological Efficiency (kg kg−1) | ||||||
| Zn-coating | 133.4 a | 151.6 a | 142.5 A | 54.80 abc | 95.05 ab | 74.92 AB |
| Zn-priming | 107.2 a | 146.1 a | 126.6 A | 96.42 ab | 98.04 a | 97.23 A |
| Soil application | 75.83 a | 70.78 a | 73.31 A | 69.50 abc | 53.95 bc | 61.72 BC |
| Zn-Foliar | 28.89 a | 52.88 a | 40.89 A | 38.48 c | 25.34 c | 31.91 C |
| Mean (WTs) | 86.33 A | 105.33 A | 64.80 A | 68.09 a | ||
| HSD (p ≤ 0.05) | Zn = 30.43 | |||||
| Apparent Recovery Efficiency (%) | ||||||
| Zn-coating | 35.55 a | 29.03 ab | 32.29 A | 33.61 a | 24.96 a | 29.28 A |
| Zn-priming | 9.120 c | 6.650 c | 7.890 B | 7.870 a | 7.990 a | 7.930 B |
| Soil application | 1.420 c | 1.350 c | 1.390 B | 1.320 a | 1.410 a | 1.260 B |
| Zn-Foliar | 32.96 a | 21.53 b | 27.25 A | 28.59 a | 22.64 a | 25.62 A |
| Mean (WTs) | 19.76 A | 14.64 B | 17.85 A | 14.25 A | ||
| HSD (p ≤ 0.05) | WTs = 4.85; Zn = 10.11 | Zn = 10.44 | ||||
| Utilization Efficiency (kg kg−1) | ||||||
| Zn-coating | 4615.4 a | 2628.2 a | 3621.8 A | 5512.8 a | 4166.7 b | 4839.7 A |
| Zn-priming | 1480.0 a | 1240.0 a | 1360.0 B | 1560.0 de | 1350.0 e | 1455.0 C |
| Soil application | 174.00 a | 142.00 a | 158.00 C | 201.00 f | 163.00 f | 182.00 D |
| Zn-Foliar | 2291.7 a | 1625.0 a | 1958.3 B | 2833.3 c | 2333.3 cd | 2583.3 B |
| Mean (WTs) | 2140.3 A | 1408.8 A | 2626.8 A | 2003.3 A | ||
| HSD (p ≤ 0.05) | Zn = 739.27 | Zn = 504.28; WTs × Zn = 713.59 | ||||
| Partial Factor Productivity (kg kg−1) | ||||||
| Zn-coating | 20,064 b | 24,808 a | 22,436 A | 23,333 b | 22,628 a | 22,981 A |
| Zn-priming | 4100.0 e | 4160.0 e | 4130.0 C | 4100.0 d | 3987.0 d | 4043.0 C |
| Soil application | 421.00 f | 422.00 f | 422.00 D | 410.00 e | 415.00 e | 412.00 D |
| Zn-Foliar | 7458.0 d | 7917.0 c | 7688.0 B | 7556.0 c | 7833.0 c | 7694.0 B |
| Mean (WTs) | 8010.9 B | 9326.6 A | 8849.7 A | 8715.8 A | ||
| HSD (p ≤ 0.05) | WTs = 285.48; Zn = 139.49; WTs × Zn = 197.27 | WTs = 68.66; Zn = 279.5; WTs × Zn = 481.7 | ||||
| Treatments | Grain Yield (t ha−1) | Straw Yield (t ha−1) | Adjusted Grain Yield (t ha−1) | Adjusted Straw Yield (t ha−1) | Gross Income ($ ha−1) | Total Fixed Cost ($ ha−1) | Total Variable Cost ($ ha−1) | Total Cost ($ ha−1) | Net Benefits ($ ha−1) | Benefit Cost Ratio | |
|---|---|---|---|---|---|---|---|---|---|---|---|
| 2017–2018 | |||||||||||
| PTW | No application | 3.13 | 4.26 | 2.82 | 3.83 | 894.97 | 471.55 | 56.25 | 527.80 | 367.17 | 1.70 |
| Zn-coating | 3.85 | 4.26 | 3.47 | 3.83 | 1059.50 | 471.55 | 82.42 | 553.98 | 505.53 | 1.91 | |
| Hydro-priming | 3.26 | 4.51 | 2.93 | 4.06 | 935.23 | 471.55 | 57.81 | 529.37 | 405.86 | 1.77 | |
| Zn-priming | 4.42 | 4.35 | 3.98 | 3.92 | 1193.55 | 471.55 | 125.39 | 596.95 | 596.61 | 2.00 | |
| Soil application | 4.13 | 4.73 | 3.72 | 4.26 | 1143.32 | 471.55 | 103.13 | 574.68 | 568.64 | 1.99 | |
| Hydro foliar | 3.22 | 4.23 | 2.90 | 3.81 | 914.27 | 471.55 | 57.81 | 529.37 | 384.91 | 1.73 | |
| Zn-foliar | 3.58 | 4.91 | 3.22 | 4.42 | 1025.23 | 471.55 | 83.20 | 554.76 | 470.47 | 1.85 | |
| ZTW | No application | 3.26 | 4.31 | 2.93 | 3.88 | 926.79 | 437.27 | 56.25 | 493.52 | 433.27 | 1.88 |
| Zn-coating | 3.87 | 4.11 | 3.48 | 3.70 | 1057.75 | 437.27 | 82.42 | 519.69 | 538.06 | 2.04 | |
| Hydro-priming | 3.40 | 4.38 | 3.06 | 3.94 | 961.73 | 437.27 | 57.81 | 495.08 | 466.66 | 1.94 | |
| Zn-priming | 4.45 | 4.36 | 4.01 | 3.92 | 1200.83 | 437.27 | 125.39 | 562.66 | 638.18 | 2.13 | |
| Soil application | 4.15 | 4.73 | 3.74 | 4.26 | 1147.89 | 437.27 | 103.13 | 540.39 | 607.50 | 2.12 | |
| Hydro foliar | 3.23 | 4.37 | 2.91 | 3.93 | 922.46 | 437.27 | 57.81 | 495.08 | 427.39 | 1.86 | |
| Zn-foliar | 3.80 | 4.55 | 3.42 | 4.10 | 1060.31 | 437.27 | 83.20 | 520.47 | 539.84 | 2.04 | |
| 2018–2019 | |||||||||||
| PTW | No application | 3.24 | 3.69 | 2.91 | 3.32 | 895.44 | 568.17 | 56.25 | 624.42 | 271.02 | 1.43 |
| Zn-coating | 3.53 | 4.26 | 3.18 | 3.83 | 986.38 | 568.17 | 82.42 | 650.59 | 335.79 | 1.52 | |
| Hydro-priming | 3.18 | 4.23 | 2.86 | 3.81 | 905.13 | 568.17 | 57.81 | 625.98 | 279.15 | 1.45 | |
| Zn-priming | 4.35 | 4.14 | 3.92 | 3.73 | 1168.70 | 568.17 | 125.39 | 693.56 | 475.14 | 1.69 | |
| Soil application | 4.02 | 4.72 | 3.62 | 4.25 | 1117.76 | 568.17 | 103.13 | 671.30 | 446.46 | 1.67 | |
| Hydro foliar | 3.28 | 3.91 | 2.95 | 3.52 | 914.48 | 568.17 | 57.81 | 625.98 | 288.50 | 1.46 | |
| Zn-foliar | 3.76 | 4.53 | 3.38 | 4.08 | 1050.33 | 568.17 | 83.20 | 651.38 | 398.95 | 1.61 | |
| ZTW | No application | 3.35 | 3.51 | 3.02 | 3.16 | 913.61 | 526.80 | 56.25 | 583.05 | 330.55 | 1.57 |
| Zn-coating | 3.64 | 3.87 | 3.28 | 3.48 | 995.06 | 526.80 | 82.42 | 609.23 | 385.84 | 1.63 | |
| Hydro-priming | 3.37 | 3.95 | 3.03 | 3.56 | 936.74 | 526.80 | 57.81 | 584.62 | 352.12 | 1.60 | |
| Zn-priming | 4.39 | 3.82 | 3.95 | 3.44 | 1164.34 | 526.80 | 125.39 | 652.20 | 512.14 | 1.79 | |
| Soil application | 4.10 | 4.21 | 3.69 | 3.79 | 1114.52 | 526.80 | 103.13 | 629.93 | 484.59 | 1.77 | |
| Hydro foliar | 3.32 | 3.83 | 2.99 | 3.45 | 920.25 | 526.80 | 57.81 | 584.62 | 335.63 | 1.57 | |
| Zn-foliar | 3.63 | 4.35 | 3.26 | 3.92 | 1012.41 | 526.80 | 83.20 | 610.01 | 402.40 | 1.66 | |
© 2020 by the authors. Licensee MDPI, Basel, Switzerland. This article is an open access article distributed under the terms and conditions of the Creative Commons Attribution (CC BY) license (http://creativecommons.org/licenses/by/4.0/).
Share and Cite
Zulfiqar, U.; Hussain, S.; Ishfaq, M.; Matloob, A.; Ali, N.; Ahmad, M.; Alyemeni, M.N.; Ahmad, P. Zinc-Induced Effects on Productivity, Zinc Use Efficiency, and Grain Biofortification of Bread Wheat under Different Tillage Permutations. Agronomy 2020, 10, 1566. https://doi.org/10.3390/agronomy10101566
Zulfiqar U, Hussain S, Ishfaq M, Matloob A, Ali N, Ahmad M, Alyemeni MN, Ahmad P. Zinc-Induced Effects on Productivity, Zinc Use Efficiency, and Grain Biofortification of Bread Wheat under Different Tillage Permutations. Agronomy. 2020; 10(10):1566. https://doi.org/10.3390/agronomy10101566
Chicago/Turabian StyleZulfiqar, Usman, Saddam Hussain, Muhammad Ishfaq, Amar Matloob, Nauman Ali, Muhammad Ahmad, Mohammed Nasser Alyemeni, and Parvaiz Ahmad. 2020. "Zinc-Induced Effects on Productivity, Zinc Use Efficiency, and Grain Biofortification of Bread Wheat under Different Tillage Permutations" Agronomy 10, no. 10: 1566. https://doi.org/10.3390/agronomy10101566
APA StyleZulfiqar, U., Hussain, S., Ishfaq, M., Matloob, A., Ali, N., Ahmad, M., Alyemeni, M. N., & Ahmad, P. (2020). Zinc-Induced Effects on Productivity, Zinc Use Efficiency, and Grain Biofortification of Bread Wheat under Different Tillage Permutations. Agronomy, 10(10), 1566. https://doi.org/10.3390/agronomy10101566