Article

Deacclimation of Winter Oilseed Rape—Insight into Physiological Changes

1
Polish Academy of Sciences, The Franciszek Górski Institute of Plant Physiology, Niezapominajek 21, 30-239 Kraków, Poland
2
Department of Plant Physiology, University of Agriculture in Kraków, Podłużna 3, 30-239 Kraków, Poland
3
Department of Chemistry and Biochemistry, Institute of Basic Sciences, University of Physical Education in Krakow, al. Jana Pawła II 78, 31-571 Kraków, Poland
*
Author to whom correspondence should be addressed.
Agronomy 2020, 10(10), 1565; https://doi.org/10.3390/agronomy10101565
Submission received: 2 September 2020 / Revised: 9 October 2020 / Accepted: 10 October 2020 / Published: 14 October 2020
(This article belongs to the Special Issue Frost Tolerance and Cold Acclimation of Crops)

Abstract

:
Climate changes, which result in the occurrence of periods with relatively high temperatures during the winter, can lead to the deacclimation of cold-hardened plants and cause problems with their winter survival. The aim of these studies was to investigate the physiological changes (photosynthesis and water relations including aquaporin expression) that accompany deacclimation process in the economically important winter oilseed rape plants. The effect of deacclimation on frost tolerance was also estimated for two tested cultivars: semi-dwarf and plants of a normal height. After cold acclimation at 4 °C (compared to the unacclimated control) the typical changes that accompany cold acclimation such as an increase in the content of water-soluble sugars or a lower water content in the leaves, which lead to an increased frost tolerance, were observed. Deacclimation partially or completely reversed these changes, which resulted in a decreased frost tolerance that was accompanied by a decrease in the content of sugars and an increase of the osmotic potential. The chemical composition of the leaves, which was measured using FT-Raman spectroscopy also clearly confirmed the metabolic differences between the cold-acclimated and deacclimated plants. The plants were significantly different in regard to the content of the various pigments as well as fatty acids and polysaccharides. The phenomenon of a deacclimation-induced decrease in aquaporin PIP1 accumulation, which was accompanied by unchanged PIP1 transcript accumulation, will be discussed in the aspects of the water relations and decreased frost tolerance in deacclimated plants.

1. Introduction

Oilseed rape (Brassica napus ssp. oleifera L.), which is grown for its oilseeds, is one of the major crops and is also one of the most important sources of vegetable oil in the world. In Poland, it is one of the winter crops that is cultivated most often. The winter cultivars of this species produce a higher yield than the spring cultivars. However, the growth of winter plants during winter, especially in Eastern European regions, entails a greater risk of frost injuries. Heavy frost damage to winter oilseed rape including their inability to regrow, which often requires farmers to plough entire fields, which results in significant economic losses [1]. Plants have created defence mechanisms that enable them to deal with sub-zero temperatures. Long-term exposure (three to six weeks) of winter plants to low but non-freezing temperatures results in a phenomenon that is called cold acclimation (cold hardening), which increases their frost tolerance. This is the natural ability of winter plants to survive in winter conditions [2]. Cold acclimation at temperatures that usually are in the range of +1 to +5 °C (often preceded by prehardening) induce biochemical and physiological changes, in the content and composition of carbohydrates, growth regulators, antioxidants, phospholipids, fatty acids, and water content, among others [3,4,5,6,7,8]. Plants with a rosette with seven to eight leaves, an apical bud that was located no higher than 3 cm above the soil surface, a root neck more than 5 mm thick and a pile root more than 15 cm long guarantee a good wintering [9]. In recent years, however, due to climate changes and global warming, there are more frequent situations during winter in which the temperature suddenly increases to more than 9 °C (and sometimes even up to 20 °C), and this temperature remains high for several days. This phenomenon leads to deacclimation of previously cold-acclimated plants. This problem has become more and more serious for winter crops, especially in light of the fact that climate projections indicate that the temperature will continue to increase in the northern hemisphere in the 21st century [10]. Such a period of warming during winter disturbs the natural/metabolic ‘adaptations’ that have been shaped by cold acclimation and lowers plant tolerance to frost. According to current knowledge, the deacclimation process may result in a decrease in the content of some compounds such as carbohydrates, amino acids or proteins, which are accumulated in plants during cold acclimation [11,12,13]. In extreme situations, this phenomenon may lead to the resumption of plant growth [12,14]. In winter oilseed rape, this could even stimulate development such stem elongation and the appearance of buds, which definitely lowers frost tolerance. As was reported by Rapacz [15], the deacclimation of oilseed rape is only reversible when it is not accompanied by the induction of elongation growth and that the rate of a decrease in freezing tolerance depends on the mean temperature of the deacclimation. In addition, our latest research on barley shows that cold acclimation and deacclimation take independent pathways and that deacclimation is not simply a reversal of cold acclimation [16]. Furthermore, according to [17], the effect of rising global temperatures on deacclimation makes it a crucial factor for winter survival.
The deacclimation process has been quite well studied for woody plants [18], herbaceous plants, grasses, and monocotyledonous crops [17,19,20,21,22]. For the dicot plants, most of the research on deacclimation has been done on Arabidopsis, which is a model plant [23,24,25]. Although the knowledge about the metabolic adjustments during prehardening and cold hardening/acclimation of winter oilseed rape has been quite well characterised, the physiological/biochemical changes that occur during deacclimation (and their connection to a disturbed/lowered frost tolerance) have been explored less.
In recent years, semi-dwarf cultivars of oilseed rape have become increasingly popular among farmers and have been promoted by breeding companies as cultivars that are more resistant to lodging, which makes characterising their tolerance to abiotic stress particularly important. For this reason, these studies were performed on two winter oilseed rape cultivars (cv.) that have different growth rates, cv. Kuga and the semi-dwarf cv. Thure. Since the growth rate depends on tissue hydration and because above a certain level of tissue hydration, the process of deacclimation is irreversible and surviving frost is drastically reduced, we analysed the fluctuations in the widely understood water relations in not acclimated, cold-acclimated, and deacclimated plants. Additionally, we measured the net photosynthesis and, generally, gas exchange because stomatal conductance not only determines CO2 uptake but also transpiration. Analysis of the products of photosynthesis was also part of the work since carbohydrates decrease the osmotic potential of cells, which may prevent intracellular ice formation. Altogether, the main aim of our study was to (1) characterize physiological changes in winter oilseed rape exposed especially to deacclimation and (2) try to answer the question of whether the changes in above-mentioned parameters can explain the altered level of frost tolerance in deacclimated plants in comparison to cold acclimated.

2. Materials and Methods

2.1. Plant Material, Growth Conditions, Experimental Design and Sampling

The study was conducted on winter rapeseed (Brassica napus ssp. oleifera L.). Two cultivars of oilseed rape that are cultivated in Poland (Kuga and Thure derived by Rapool, Poland) were used. The cv. Thure is a semi-dwarf cultivar whose plants grow about 126 cm tall. The plants of the cv. Kuga are characterised by taller plants that grow about 143 cm tall. The plant heights are given according to data from COBORU (Development of Polish Official Variety Testing). According to COBORU, both cultivars also differ slightly in trait described as ‘percent of dead plants after winter 2015/16 and 2016/17′. Percentage of dead plants after winter 2015/16 and 2016/17 for Kuga is 14% and 17%, respectively, while for Thure it is 28% and 20%.
Seeds were sown in Petri dishes on moist filter paper (10 cm diameter, 50 seeds per dish) for germination in the dark (25 °C, two days). Next, the seedlings were transferred to 11 pots (40 cm × 15 cm × 15 cm; 15 plants/pot) that contained a prepared soil mixture—the universal soil “Eco-Ziem Universal soil” (Eko-Ziem s.c., Jurków, Poland) pH = 5.5–7, the soil from the cultivation plots at the University of Agriculture (Kraków) and sand (2:1:1). The plants were grown under controlled-environment conditions in a growth chamber for three weeks (17 °C day/night (d/n); 12 h photoperiod). Then, the plants were pre-acclimated for one week—first two days: 14 °C d/n, 12 h photoperiod; next three days: 12 °C d/n, 8 h photoperiod and last two days: 10 °C d/n, 8 h photoperiod. The plants were then cold acclimated for three weeks at 4 °C d/n, (8 h photoperiod) and finally deacclimated at 16/9 °C (d/n) and under 8 h photoperiod for one week. The light intensity on the plant canopy level in the growth chamber was the same during the entire experiment, 350 μmol m−1·s−1, which was emitted by LED lamps, type HORTI A, modified to emit light of constant intensity (PERFAND LED, Trzebnica, Poland). The lamp spectrum is optimized for growth of oilseed rape in rosette stage where visible light is enriched in higher intensity in blue and red range; blue: red ratio is 46%:54%). The pots in the growth chamber were rotated every day. The experiment was performed in autumn/winter-time.
All of the non-invasive measurements (PSII efficiency, gas exchange, leaf reflectance) were taken at three time-points: (1) after three weeks of growth at 17 °C (not acclimated plants, which were the control), (2) after pre-acclimation and cold acclimation at 4 °C and (3) for the deacclimated plants. The samples for the Raman spectroscopy and for all of the biochemical analyses were taken at the same three time-points. Moreover, at every time-point, one pot with 15 plants was taken and exposed to frost (details in Section 2.2) in order to evaluate any changes in frost tolerance.

2.2. Testing Frost Tolerance

Frost tolerance tests for each cultivar were conducted in freezing chamber for the three groups of plants: the not acclimated (control) plants, the cold-acclimated plants, and deacclimated plants. The temperatures for the tests were selected based on the experience of the authors and adjusted to the predicted level of the frost tolerance of a specific group of plants. For the not acclimated plants, the temperatures were −1, −4, −6, and −8 °C; for the cold-acclimated plants, they were −8, −10, −12, and −18 °C and for the deacclimated plants, they were −6, −8, and −11 °C. The plants were placed into a freezing chamber at a temperature of 2 °C (darkness). Then, the temperature was lowered by 3 °C/h until the required frost level was reached, and then the plants were kept at this temperature for a period of 6 h. Subsequently, the temperature was raised to 2 °C at a rate of 3 °C/h, after which, the plants were transferred to the growth chamber in order to observe their regrowth at 12 °C (8 h photoperiod) and 150 μmol m−2·s−1 PPFD.
After 14 days, the plant survival rate was estimated using a visual score, where: 0—a completely dead plant with no signs of leaf growth; 1—a dead plant without leaves (dead leaves have dropped). Some small elongation of leaves growing from the apical bud occurred before it died; 2—a plant that may not survive, the leaves from the apical bud occurred but they are small, discoloured, or deformed; 3—a plant that has a chance to survive but is badly injured (75% of the leaves are dead). Leaf elongation occurred, new leaves are green but thin and small; 4—a plant that has survived but shows severe injuries. About 50% of its leaves are dead (brown and shrivelled) or with necrosis spots; Leaf elongation occurred, new leaves are green and healthy; 5—a plant that is alive but some symptoms of freezing injuries are visible. About 25% of the leaves have visible damage such as drying around their edges, yellowing or with necrosis spots; 6—a plant where only 5% to 10% of the leaves show minor symptoms of freezing injuries such as small necrosis spots or dried leaves edges; 7—a plant with no symptoms of injury.
Based on the frost injuries, the expected temperature at which the regrowth was reduced by 50% (RT50) was determined for each group of plants (cultivars and treatments). The RT50 value was estimated from a linear regression fitted to the sigmoid relationship between the freezing temperatures and the regrowth score using the three/four tested temperatures.

2.3. Chlorophyll a Fluorescence Measurements

Chlorophyll a fluorescence was measured using a Plant Efficiency Analyser (PEA, Hansatech Ltd., King’s Lynn, UK) to describe the efficiency of photosystem II (PSII). The leaves for the measurements were adapted to the dark for 30 min using special clips. The technical details of the procedure were given in the paper [26]. The following parameters of the energy flow were calculated from the fluorescence curve: the energy absorption by the antenna pigments (ABS/CSm), the amount of energy that was trapped in the reaction center (TRo/CSm), the energy flux for the electron transport (ETo/CSm) and the dissipation of energy as heat (DIo/CSm) where CS is the sample cross section [27]. These parameters belong to phenomenological energy flues. The same parameters were also calculated for the reaction centre (RC) and named specific energy fluxes. Further, the number of reactive centers for each leaf cross section (RC/CSm) was calculated as well as the Fv/Fm ratio—the maximum quantum yield of the photosystem II primary photochemistry. The detailed equations for the specific parameters are given in work [27]. The PSII efficiency was measured in 15 replicates for each cultivar and treatment. A biological replicate represented one leaf of an individual plant (selected randomly from 10 pots). The measurements were taken on first or second leaf (first leaf means the oldest, appearing after the cotyledons, well-developed).

2.4. Analysis of the Photosynthetic Pigment (Chlorophyll a, b and Carotenoid) Content

Plants leaves (first or second) were lyophilised in a high vacuum at 100 μbar, coil temperature of 40 °C (lyophiliser: Freezone 4.5; Labconco, Kansas City, MO, USA) and then pulverised for 2 min at maximum frequency (30 Hz) using a ball mill (MM400, Retsch, Germany). Samples of about 10 mg of dry weight were extracted into 1.5 mL of 96% ethanol and centrifuged at 22,000× g (Universal 32R, Hettich, Germany) for 15 min at 10 °C. An aliquot of the ethanolic extract (100 μL) was added to a 96-well microplate and the absorbance was measured spectrophotometrically at 470, 648, and 664 nm using a Synergy II Microplate Reader (Bio-Tek Instruments, Winooski, VT, USA). The concentrations of Chl a, Chl b, total Chl (a + b) and carotenoids (Car) were calculated according to the extinction coefficient given in [28] using the following equations and taking into account the path length of the microwells, which were filled to a quarter of their depth:
Chl a (µg/mL) = 13.36 A664 − 5.19 A648
Chl b (µg/mL) = 27.43 A648 − 8.12 A664
Chl a + b (µg/mL) = 5.24 A664 + 22.24 A648
Car (µg/mL) = (1000 A470 − 2.13 Chl a − 97.64 Chl b)/209
where A470 was the absorbance at 470 nm, A664 was the absorbance at 664 nm and A648 was the absorbance at 648 nm. Five biological replications representing five leaves from different plants (from five different pots) (cultivars and treatments), each consisting of three analytical replications, were analysed.

2.5. Measurements of Leaf Reflectance

The reflectance spectrum of the light radiation in the range 400–1000 nm was measured on the upper side of the first or second well-developed leaf (the same as for Chl a FL) at 22 °C using a CID Bio-Science CI-710 spectrometer with SpectraSnap software (CID Bio-Science, Camas, WA, USA). Based on the spectra, the reflectance parameters were calculated, which enabled the following to be estimated: the anthocyanin content—ARI = (R550−1 − R700−1) R800 [29]; the flavonoid cont—FRI = (R410−1 − R460−1) R800 [30] and the hydration of the leaf tissue − WBI = R900 (R970)−1 [31]. In the equations, Rx means the intensity of the reflectance at a specific wavelength x. The presented values are the average of 10 independent replicates for each cultivar and treatment (one leaf from one individual plant from different 10 pots represented one replicate).

2.6. Leaf Gaseous Exchange

The photosynthetic rate (PN), transpiration (E), stomatal conductance (gs) and intercellular concentration of CO2 (Ci) were measured using an LCpro-SD infrared gas analyser (ADC BioScientific Ltd., Hoddesdon, Herts EN11 0NT, UK). The water use efficiency index (WUE) was determined based on the quotient of the photosynthetic rate and transpiration (PN/E). The conditions in the measurement chamber were as follows: carbon dioxide concentration 370 µmol CO2 mol−1 air, air humidity equal to the ambient humidity and PAR intensity 450 µmol photons m−2·s−1. The first or second well-developed leaf was measured between 10:30 a.m. and 12:00 p.m. The measurements were performed in 10 replicates for each cultivar and treatment (one leaf from one individual plant from different 10 pots represented one replicate).

2.7. Relative Water Content (RWC)

The leaf disc was cut from the central portion of the first or second well-developed leaf and its fresh mass (FM) was determined. Then, the disc was placed in a separate vial with 30 cm3 of water and shaken (WL-972, JW Electronic, Warsaw, Poland) at 20 °C for 24 h. Next, it was weighed (turgid mass), dried for 24 h at 105 °C and weighed again (dry mass). The RWC was determined using the following equation [32]: RWC [%] = [(FM − DM)/(TM − DM)] × 100 where FM—fresh mass, DM—dry mass, and TM—turgid mass. Samples were collected from 10 independent plants from different 10 pots for each cultivar and treatment and the mean value was calculated.

2.8. Content of Total Soluble Sugars

The sugars were analysed spectrophotometrically, accordingly [33,34]. Twenty-five μL of the ethanolic extract (the supernatant that had been obtained as described for the chlorophyll and carotenoid analyses, as described in Section 2.4) was diluted with 175 μL of water; next, 200 μL of a 5% water phenol solution and 1 mL of concentrated sulphuric acid were added. The samples were incubated for 20 min and then transferred to a 96-well microplate and the absorbance at 490 nm was read in a Synergy II Microplate Reader (Bio-Tek Instruments, Winooski, VT, USA). The sugar content was calculated based on the standard curve that was prepared for glucose. The results are presented as the mean value of five biological replicates, which represent five leaves from different plants from different five pots, each consisting of two analytical replicates and are expressed as the total soluble sugar content per gram of the dry weight of the leaves.

2.9. Osmotic Potential

The osmotic potential of leaf cells was measured using a dewpoint microvoltmeter (HR 33T, Wescor Inc., Logan, UT, USA), which was equipped with a C-52 Sample Chamber. The cell sap was extracted from a leaf fragment (1 cm of diameter) that had been collected from the middle part of the youngest fully expanded leaf at a fixed force and frozen in liquid nitrogen. Each assay was performed in seven replicates that represented seven leaves from different plants, from seven different pots for each cultivar/treatment.

2.10. Accumulation of the BnPIP1 Transcript: RNA Isolation, cDNA Synthesis, and Real-Time PCR Reaction

Quantitative PCR analysis was performed to calculate any changes in the plasma membrane intrinsic protein (PIP1) transcript level using QuantStudio 3 (ThermoFisher Scientific, Waltham, MA, USA). Approximately 0.05 g of the leaf tissue (central part of the first or second leaf) was used to extract RNA using a RNeasy Plant Mini Kit (Qiagen, Hilden, Germany) according to the manufacturer’s protocol. The quality and quantity of the RNA were determined using a UV-Vis Spectrophotometer Q5000 (Quawell, San Jose, CA, USA). Approximately 800 ng of an RNA template was used for each Reverse Transcription reaction combined with genomic DNA enzymatic elimination. The PCR reactions were run in three technical replicates, as described in [35]. The PCR primers and probes (Table 1) were designed using Primer Express Software v 3.0.1 (Applied Biosystems by Life Technologies, Foster City, CA, USA) to amplify separately the PIP1 and Actin gene [36] as an endogenous reference gene. QuantStudio Design and Analysis Software v. 1.5.0 was used to analyse the data. The gene expression was calculated using the relative standard curve method (Applied Biosystems). The PIP-1 expression level was determined relative to the Actin level. The results are presented as the mean value of five biological replicates, which represent five leaves from different plants from five different pots.

2.11. Protein Concentration in the Crude Leaf Extracts

Leaf discs were cut from the central portion of the first or second leaf of 12 independent plants and collected as one biological replicates (1 g of each sample was prepared). The samples were homogenised at 4 °C in 2.5 mL of a Tricine buffer based on the procedure in [37] and then centrifuged for 10 min at 18,000 rpm (Hettich, Tuttingen, Germany) after which the supernatant was collected. The concentration of the proteins in the obtained crude extract was measured spectrophotometrically according to [38]. There were three biological replicates per cultivar/treatment and each of these biological replicates were analysed in six technical repetitions. The average value was then calculated.

2.12. Analysis of the Accumulation of the BnPIP1 Aquaporins Using Immunoblotting

Based on the total amount of protein calculated by the Bradford method (Section 2.11), CBB staining was performed. For this purpose, a quantity of the crude extract containing 20 µg of protein was applied to each well corresponding to cultivar and treatments on 12% polyacrylamide gels and separated using electrophoresis SDS-PAGE for 1.5 h at a current of 46 mA in the upper gel and 38 mA in the lower gel, as described in [39] (Bio-Rad Laboratories, Inc., Hercules, CA, USA) and then the gel was stained in CBB. The photo of the gel was added in Supplementary Materials as S3A.
Forty µg of the proteins that had been extracted from the analysed samples were loaded on gels and the electrophoresis was performed under the same conditions as described in the visualization of the total amount of protein—CBB staining. The separated proteins were blotted onto a nitrocellulose membrane for 1 h 20 min at 45 mA using a BioRad semi-dry transfer cell (Bio-Rad Laboratories, Inc., Hercules, CA, USA). The membranes were blocked with low-fat milk powder that had been diluted in a TBS-T buffer (containing 0.9% NaCl and 10 mM Tris) overnight. Then, the membranes were washed three times for 5 min with a TBS-T buffer and were incubated for 1 h 30 min in the appropriate primary antibody (anti-PIP1, 1:1000, Agrisera, catalog number AS09 487). Afterwards, the membranes were washed again with the TBS-T buffer (three times for 5 min) and incubated in anti-rabbit antibody for 1 h 20 min (1:2000, Sigma-Aldrich). Subsequently, the membranes were washed once again with the TBS-T buffer (two times for 5 min) and then with Alkaline Phosphatase (three times for 5 min). For each cultivar and treatment, six replicates were performed (three biological replicate analysed in two technical repetitions). The quantitative protein content was determined based on the intensity of the staining for the PIP1 bands using ImageJ software (NIH, Bethesda, MD, USA). The averages are expressed as the arbitrary units (A.U.) that correlated with the area under the densitometric curves. Representative membranes for both cultivar are presented in Supplementary Materials as S3B (cv. Kuga) and S3C (cv. Thure).

2.13. FT-Raman Spectroscopy Measurements

Raman measurements were taken on the first or second fresh leaf. The spectra were recorded using a Nicolet NXR 9600 spectrometer, which was equipped with an Nd:YAG laser emitting at 1064 nm and a germanium detector. Measurements were performed at a spectral resolution of 4 cm−1 in the range of 600 to 1800 cm−1. All of the spectra were accumulated from 512 scans and then measured at a laser power of 450 mW using an unfocused laser beam approximately 100 μm in diameter. The Raman spectra were registered using the Omnic/Thermo Scientific software program. For each group of plants (cultivar and treatment), 10 spectra from 10 different plants were collected and then averaged.

2.14. Statistical Analysis

The data were analysed using Statistica 13.3 software (StatSoft, Tulsa, OK, USA) with the multifactorial analysis of variance (ANOVA) and Duncan’s test at a significance level of p ≤ 0.05. The statistical analyses were performed in two variants: (1) Separately for each cultivar (Kuga or Thure) where differences are marked with lowercase letters, (2) together for both cultivars where differences are marked with uppercase letters. Values that are marked with the same letters did not significantly differ according to the Duncan test (p ≤ 0.05). The mean values together with the standard deviations are presented in the figures. Information about repetitions in particular analysis is given in details in chapters with description of the respective methods.
For the Raman spectra, a hierarchical cluster analysis was performed using Statistica 13.3 software. The spectra were baseline corrected. The spectral distances were calculated using Ward’s algorithm.

3. Results

3.1. Frost Tolerance of the Not Acclimated, Cold-Acclimated, and Deacclimated Oilseed Rape Plants

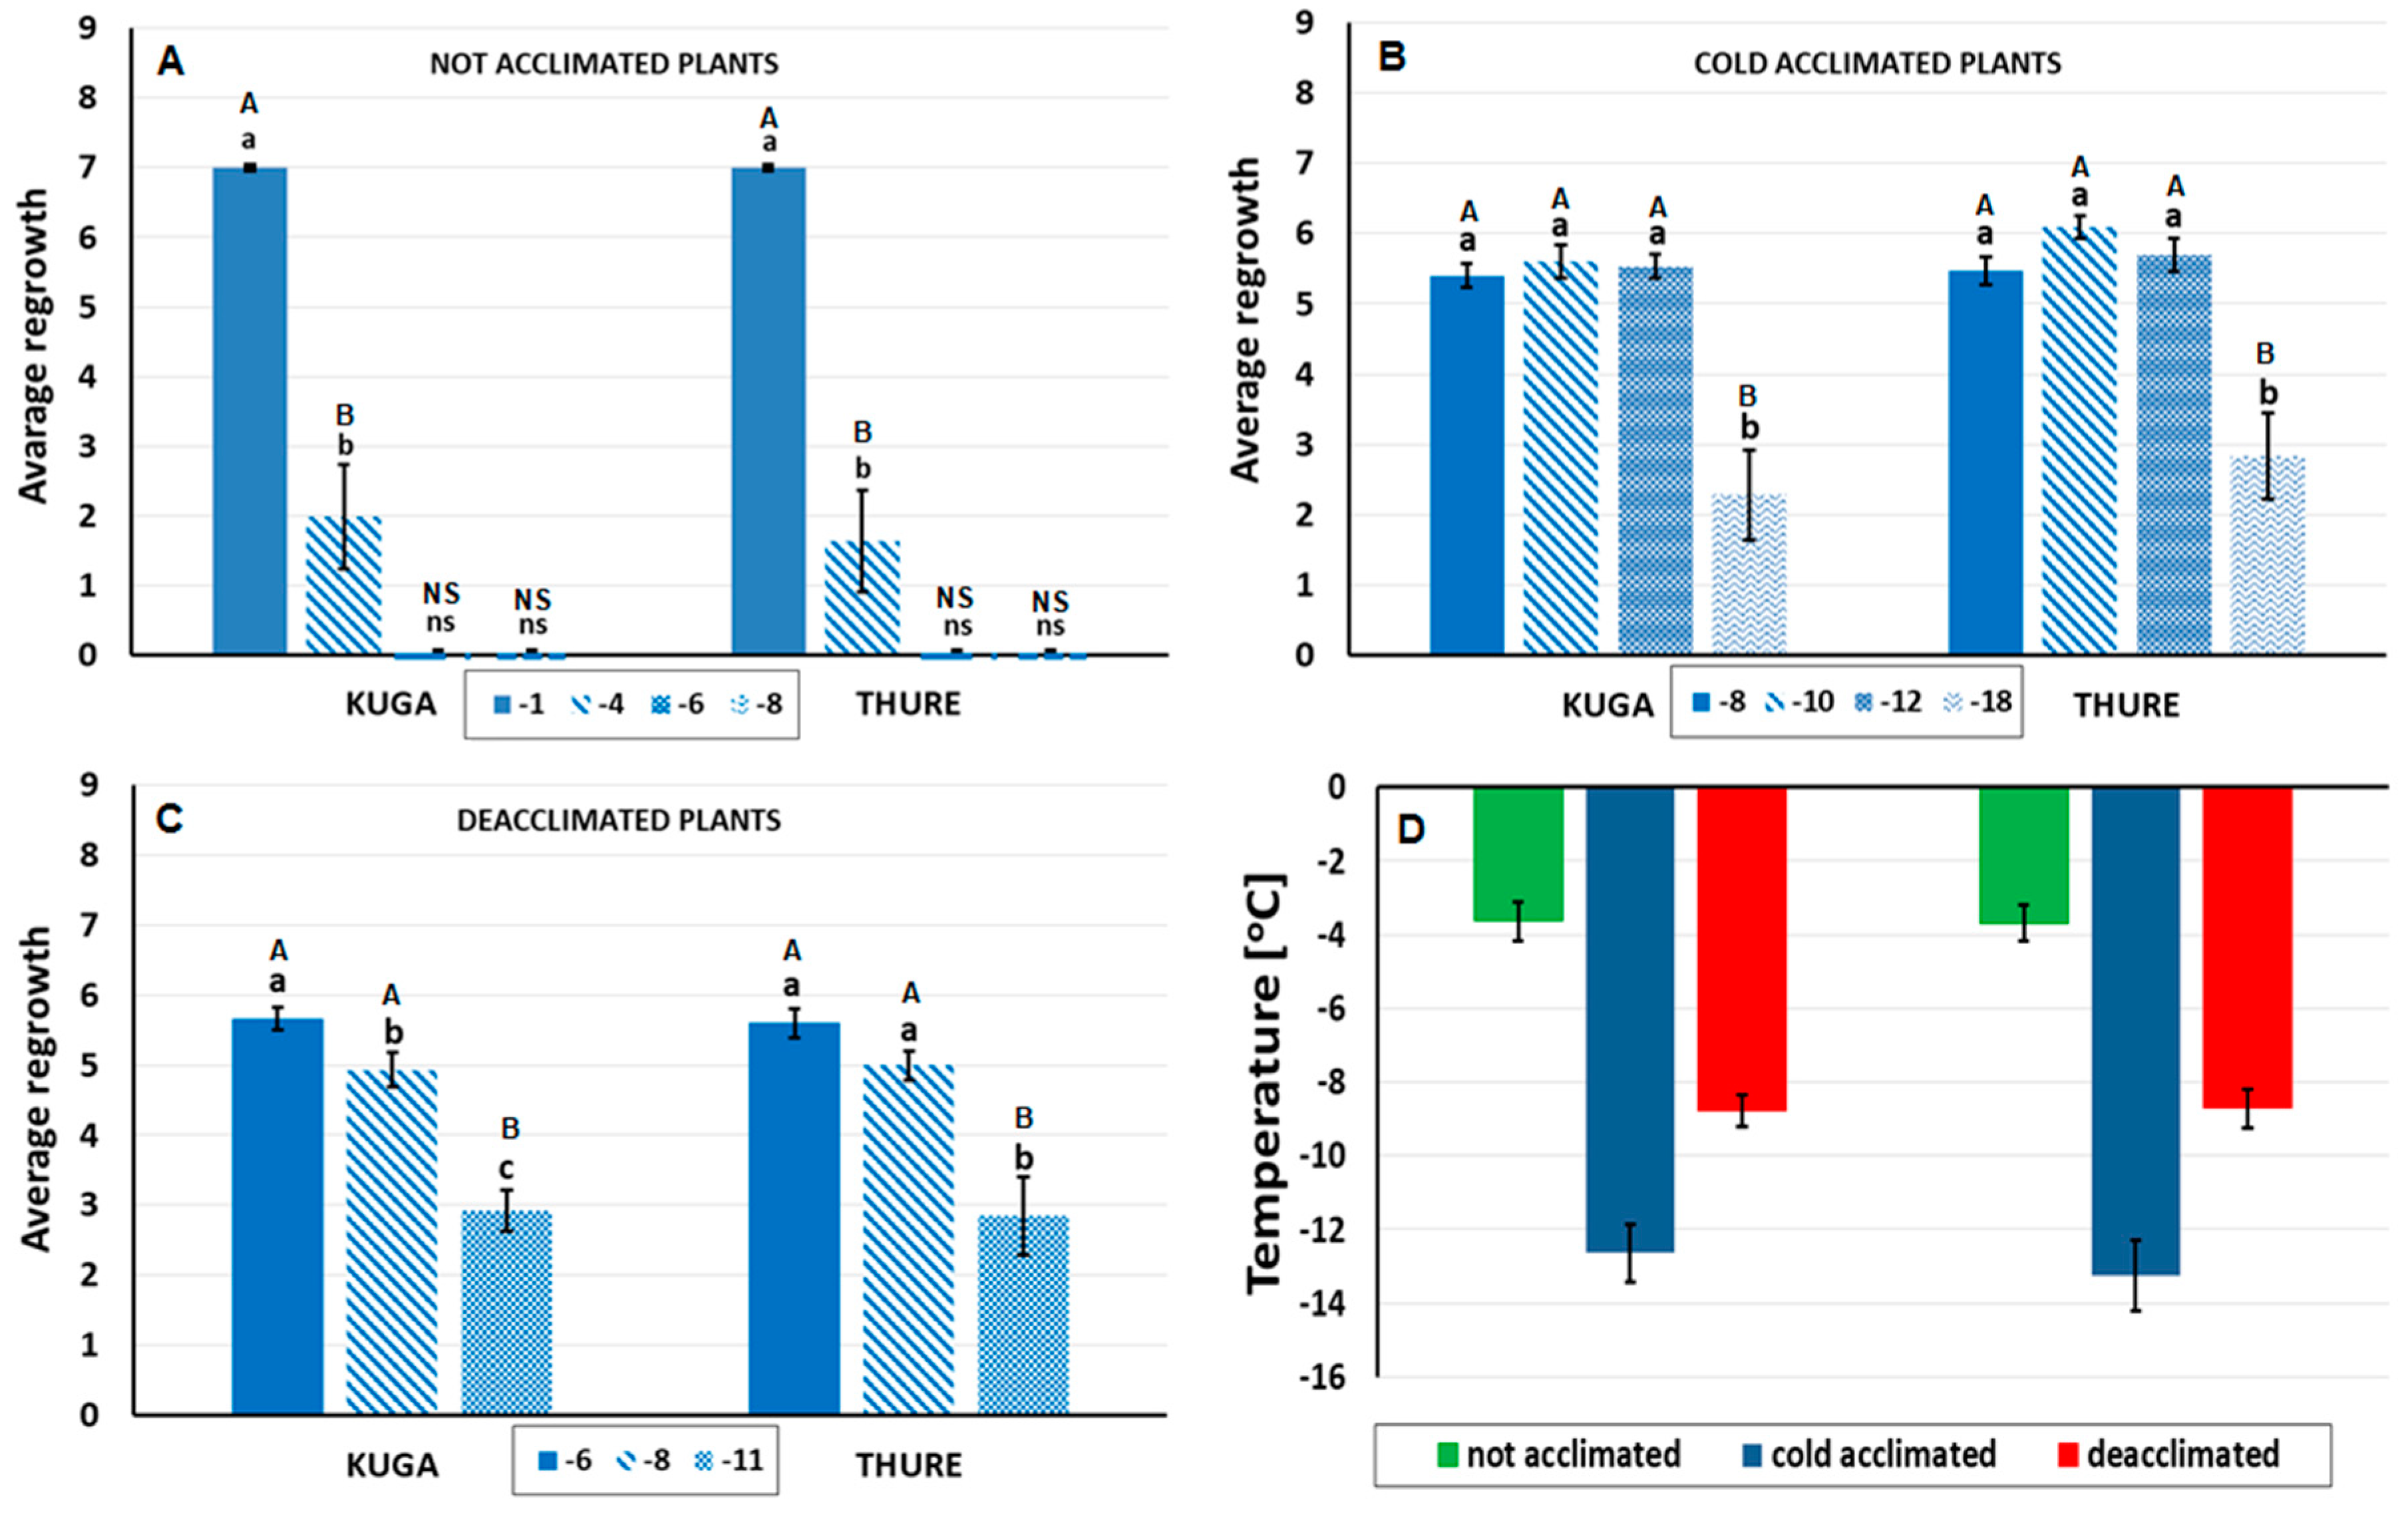
Regrowth (resuming growth after freezing, including the appearance of new leaves) of oilseed rape plants after frost tolerance test provides information about their frost tolerance. Regrowth was dependent on their growth conditions before the frost exposure but independent of the cultivar (Figure 1A–D). The not acclimated plants, which were not able to survive at a temperature of less than −4 °C, had the lowest frost tolerance (basal frost tolerance) (Figure 1A). As was expected, cold acclimation significantly increased the frost tolerance and the plants were able to survive temperatures as low as −18 °C, although they suffered serious injuries (regrowth at a level of two to three points; Figure 1B).
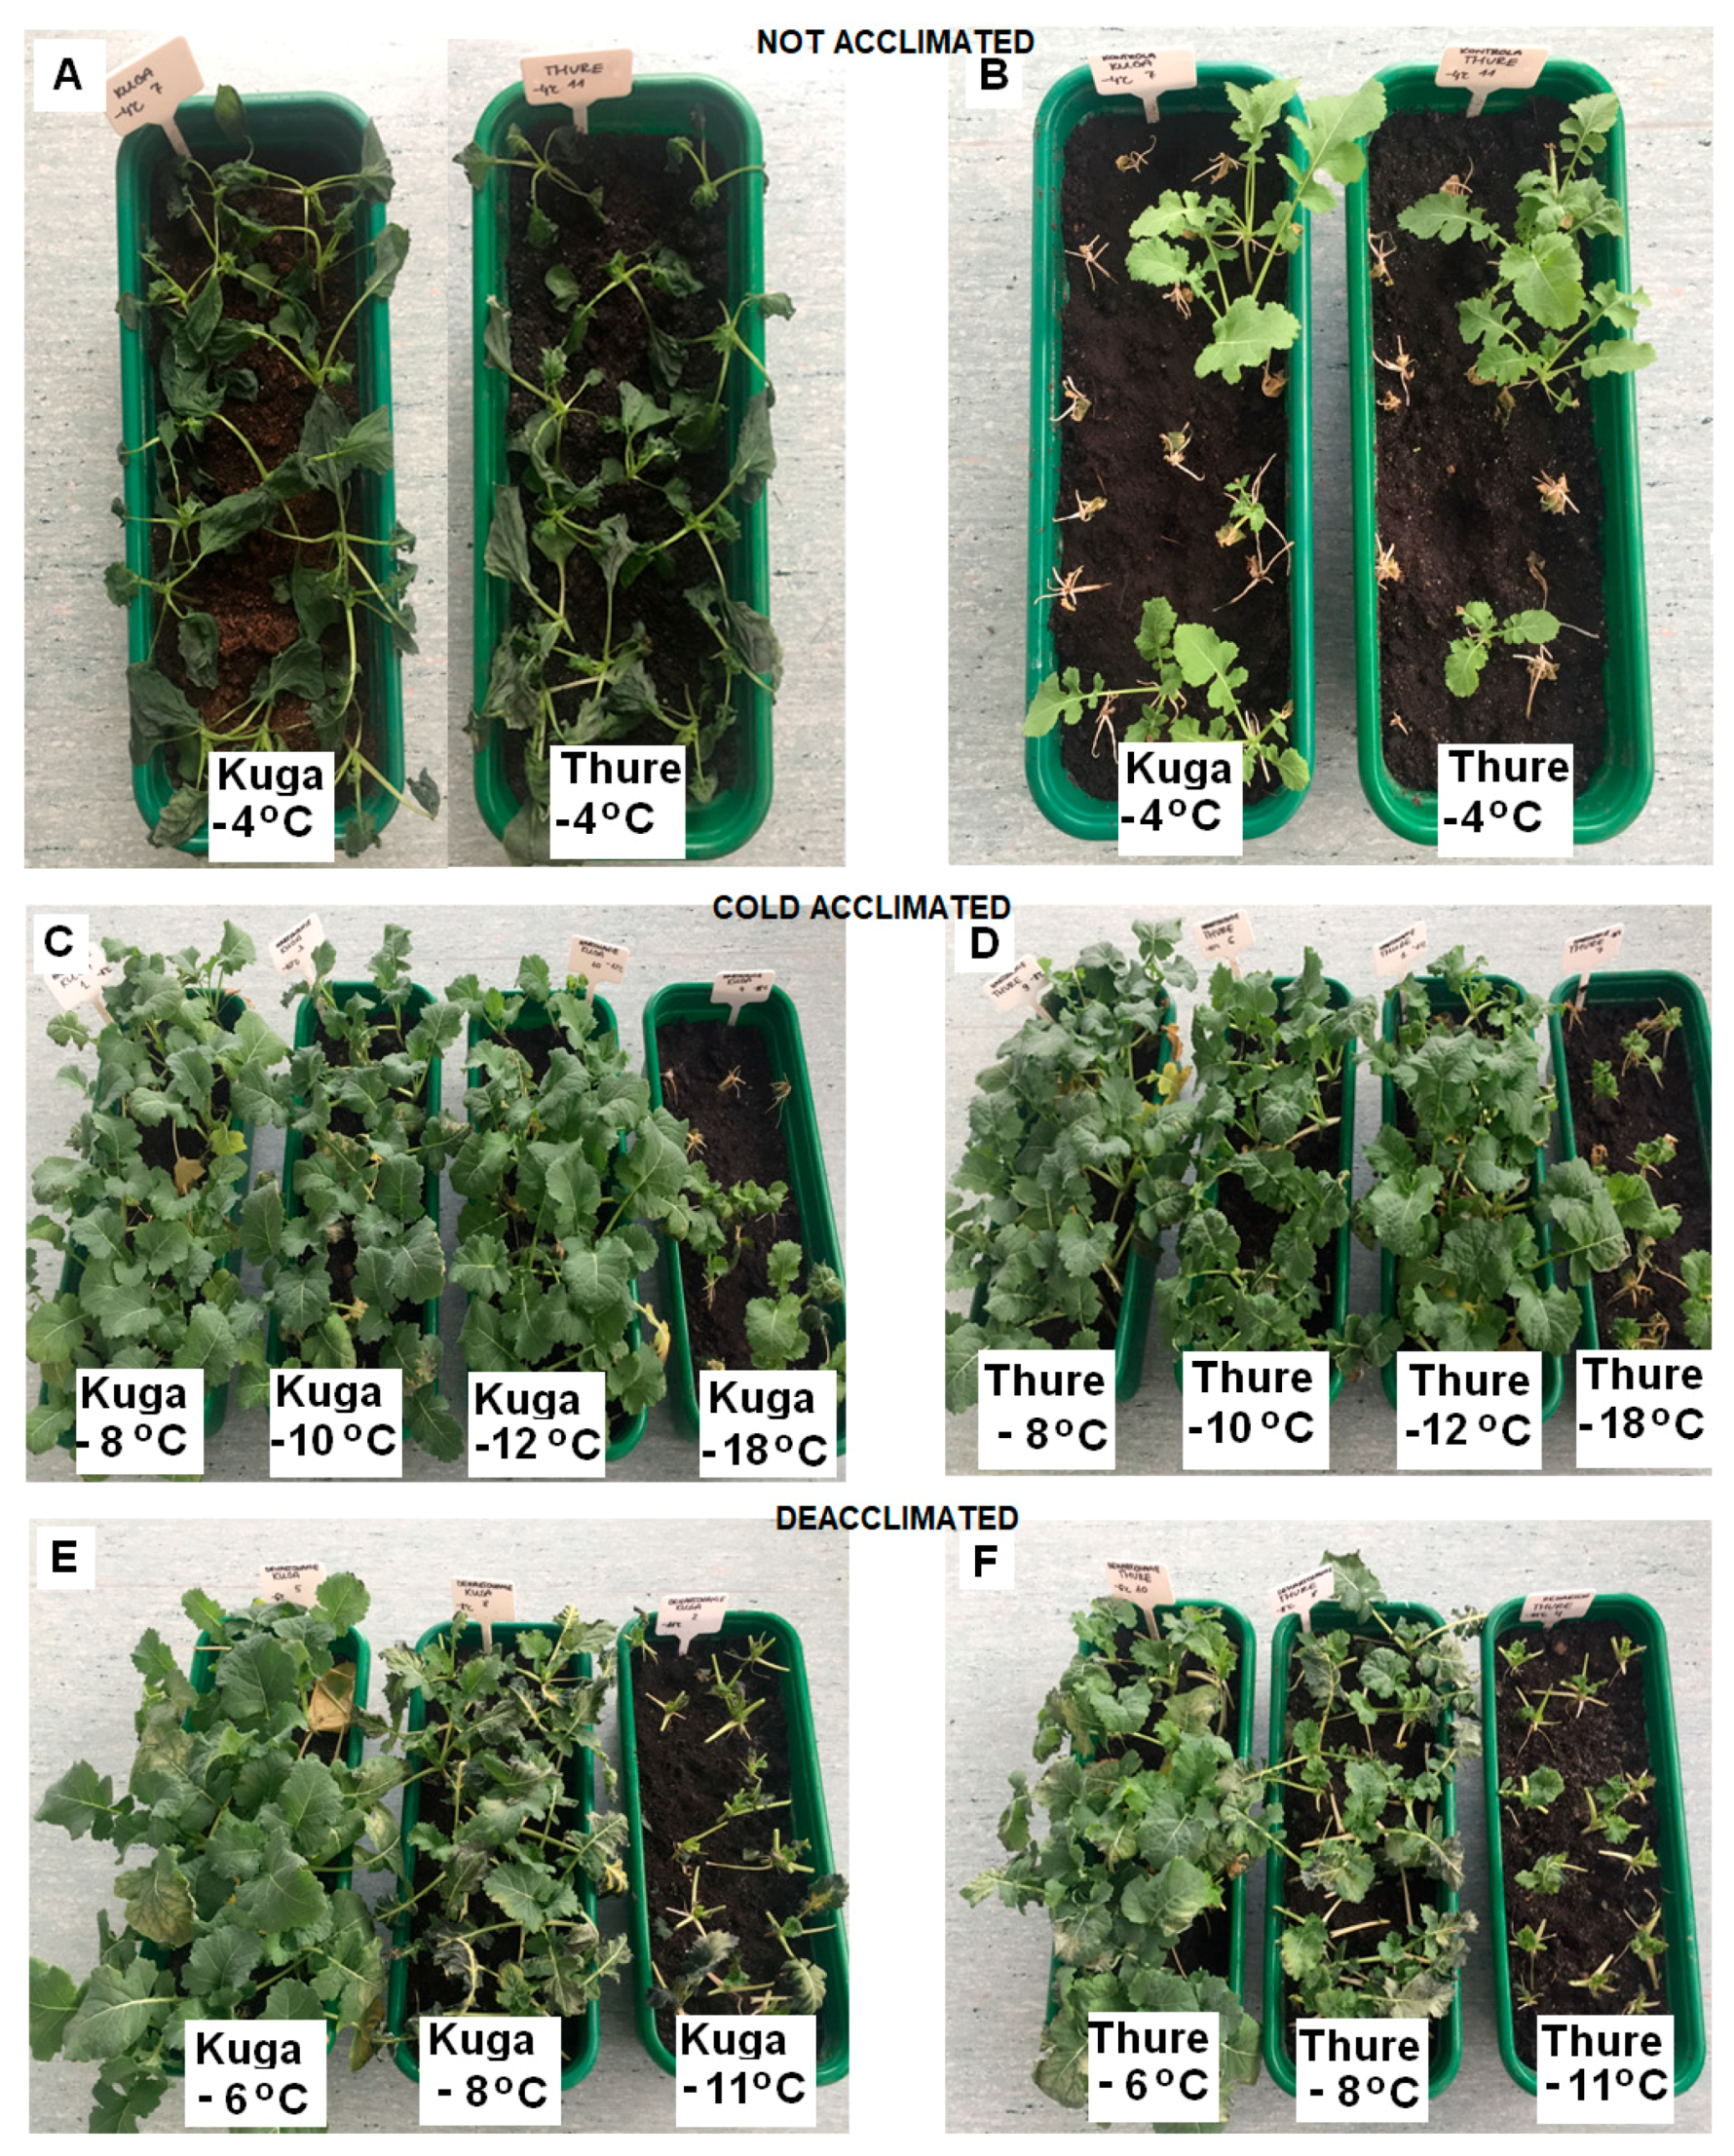
The deacclimated plants were more susceptible to frost than the plants that had been cold acclimated (Figure 1C). Freezing at a temperature of −11 °C allowed for the regrowth in the deacclimated plants at a level below three points (plants that had very little chance of surviving), while a similar temperature (−12 °C) in the cold-acclimated plants caused regrowth at a level of about six points (see scale in Section 2.2). Moreover, the frost tolerance of the deacclimated plants was not reduced to the basal frost tolerance that was characteristic for the not acclimated plants (Figure 1C). All of the described results are well summarised and illustrated by the estimated temperature that was required to reduce plant regrowth after frost exposure by 50% (RT50) (Figure 1D). In both cultivars, the temperature that was required to reduce regrowth by 50% (RT50) for the not acclimated plants was about −4 °C, for the cold-acclimated plants about −13 °C, and for the deacclimated plants about −8 °C (Figure 1D). Photographs of the oilseed rape plants that had been exposed to frost are presented in Figure 2.

3.2. Physiological/Biochemical Characteristic of Not Acclimated, Cold Acclimated and Deacclimated Oilseed Rape Plants

3.2.1. Photosystem II Efficiency

The PSII efficiency is described based on the fast-kinetic chlorophyll a fluorescence and is shown in Table 2 and on the spider graphs (Supplementary Material Figure S1) where the values that were measured for the not acclimated plants are presented as 100%.
After cold acclimation, the Fv/Fm were clearly reduced, while after deacclimation they were significantly higher than in the not acclimated plants of both cultivars (Table 2).
In the deacclimated plants of the cv. Kuga cultivar, there was a decrease in the value of the parameters that described the specific energy fluxes that were calculated per reactive center (RC) such as the energy that was absorbed by the antennas (ABS/RC)—~10%, the energy that dissipated as heat (DIo/RC)—~19% and the energy that was transferred to the RC (TRo/RC)—~9% compared with values in the not acclimated plant. The deacclimated plants also had lower values of the aforementioned parameters compared to the cold-acclimated plants. Interestingly, the energy flow to the electron-transport chain (ETo/RC) was maintained at the same level in the deacclimated Kuga plants as in the not acclimated or cold-acclimated plants (Table 2). The situation was different for the Thure cultivar where the not acclimated and deacclimated plants were characterised by similar values of the parameters ABS/RC, TRo/RC and ETo/RC while the values of these parameters were significantly lower in the cold-acclimated plants (Table 2).
In both cultivars, deacclimation resulted in a decrease of the values of the parameters that are connected with the phenomenological fluxes per cross section (CS) such as the energy absorption by the antenna system (ABS/CSm), the energy trapped in the reaction centre (TRo/CSm), the energy flux to the electron-transport chain (ETo/CSm) and the energy that dissipated as heat (DIo/CSm) compared to the not acclimated and to the cold-acclimated plants (Table 2). For example, the ABS/CSm and TRo/CSm similarly decreased (about 49% and 47%, respectively, for cv. Kuga and 48% and 47%, respectively, for cv. Thure) in the deacclimated plants compared to the cold-acclimated plants. The DIo/CSm and ETo/CSm decreased in the deacclimated cv. Kuga by 57% and 40% and in the deacclimated cv. Thure by 56% and 40% compared to the cold-acclimated plants.
The same strong trend was observed when deacclimated and not acclimated plants of both cultivars. Deacclimated plants were characterized by decreased concentration of reactive centers per excited cross section of samples (RC/CSm) in comparison to both the not acclimated and cold-acclimated plants (Table 2).

3.2.2. Leaf Pigments

Chlorophyll and Carotenoids

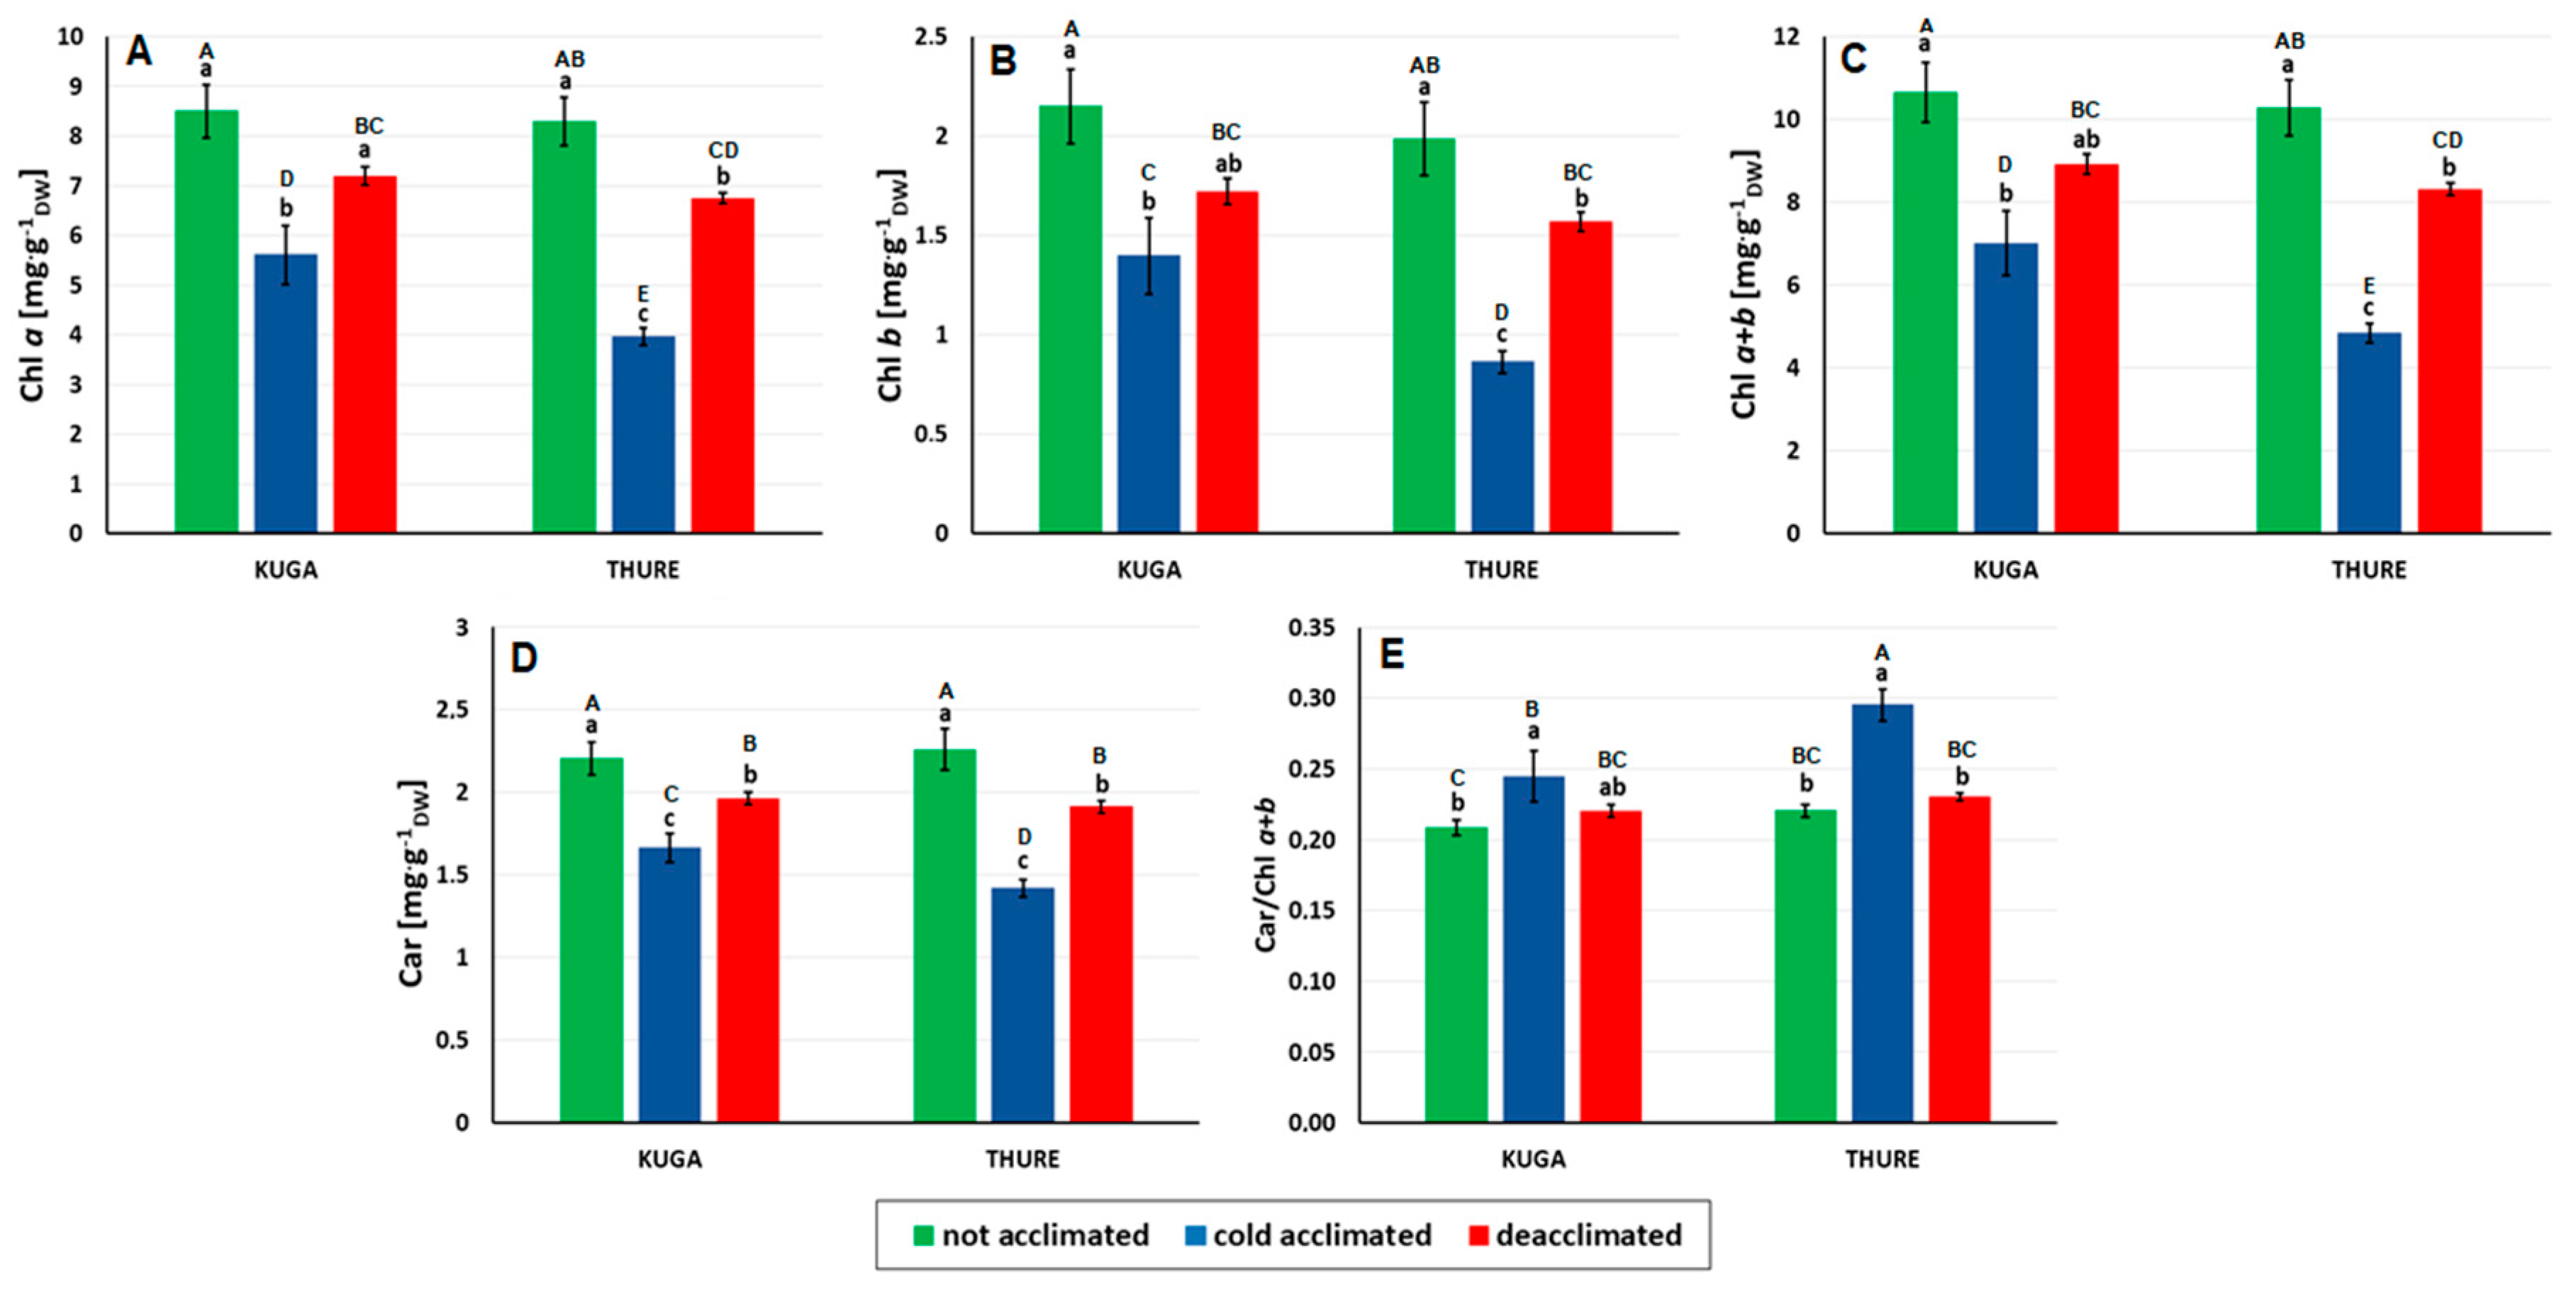
The trend in the changes in all of the spectrophotometrically measured pigments (Chl a, Chl b, Chl a + b and carotenoids) for both cultivars was the same (Figure 3A–D). Regardless of the cultivar, the pigment content was the highest in the leaves of the not acclimated plants and the lowest in the cold-acclimated plants, and therefore, the accumulation of pigments in the deacclimated plants generally had intermediate values. Additionally, the ratio of the carotenoids/chlorophyll a + b was calculated (Figure 3E). In both cultivars, the highest value was observed for the cold-acclimated plants and the lowest for the not acclimated plants.

Anthocyanins and Flavonols

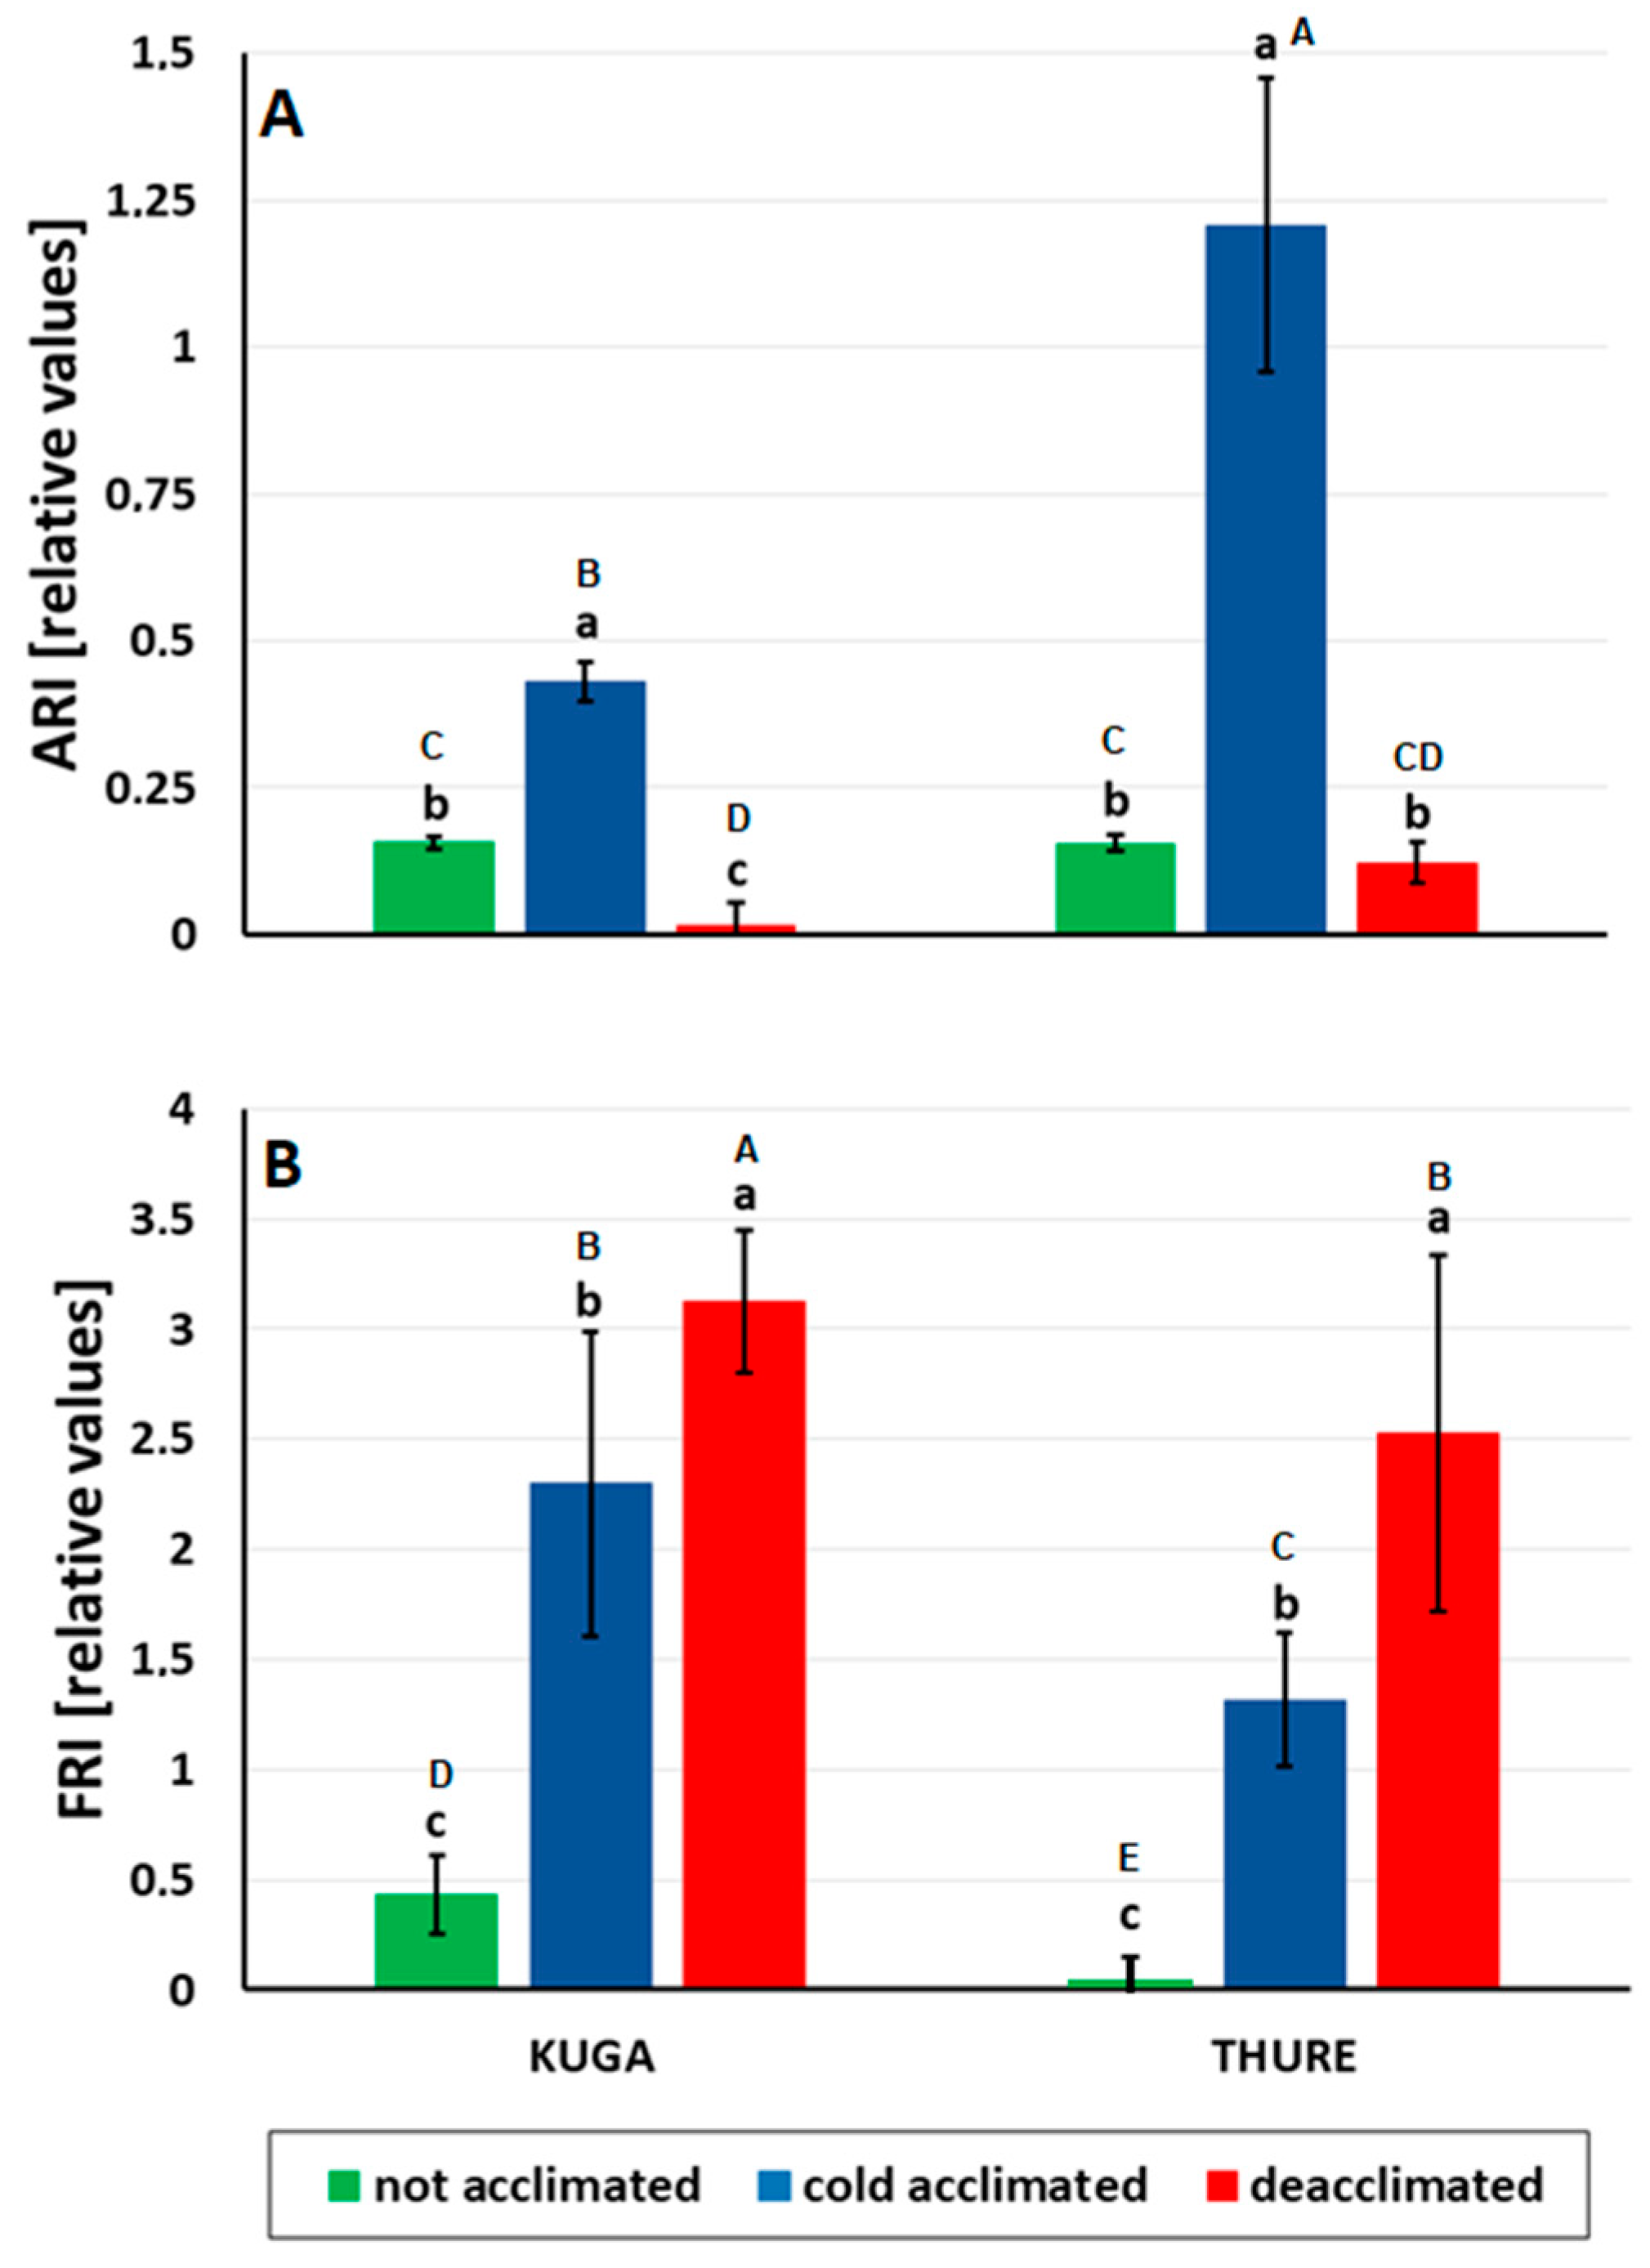
Measurements of the leaf reflectance enabled the parameters related to the anthocyanin and flavonol content to be calculated (ARI and FRI, Figure 4). The light reflectance curves that were used to calculate these parameters (the 400 to 1000 nm range) are presented in Figure S2. After cold acclimation, there was a significant increase in the total anthocyanin pool in both cultivars, as was evidenced by the increase in the ARI values (Figure 4A). In the Thure cultivar, the anthocyanin content increased almost six-fold, while in cv. Kuga, it increased about two-fold compared to the not acclimated plants. In turn, after deacclimation, the ARI values returned to the level of the not acclimated plants (cv. Thure) while it fell even below the value noted for the not acclimated plants in cv. Kuga. The flavonol pool significantly increased under cold conditions in both of the analysed cultivars (increased FRI values, Figure 4B). Interestingly, in contrast to the anthocyanins, the flavonol levels increased further in both cultivars after deacclimation.

3.2.3. Leaf Gas Exchange

Cold acclimation and then deacclimation changed the gas exchange intensity in both of the tested oilseed rape cultivars compared to the control conditions (not acclimated plants) (Figure 5).
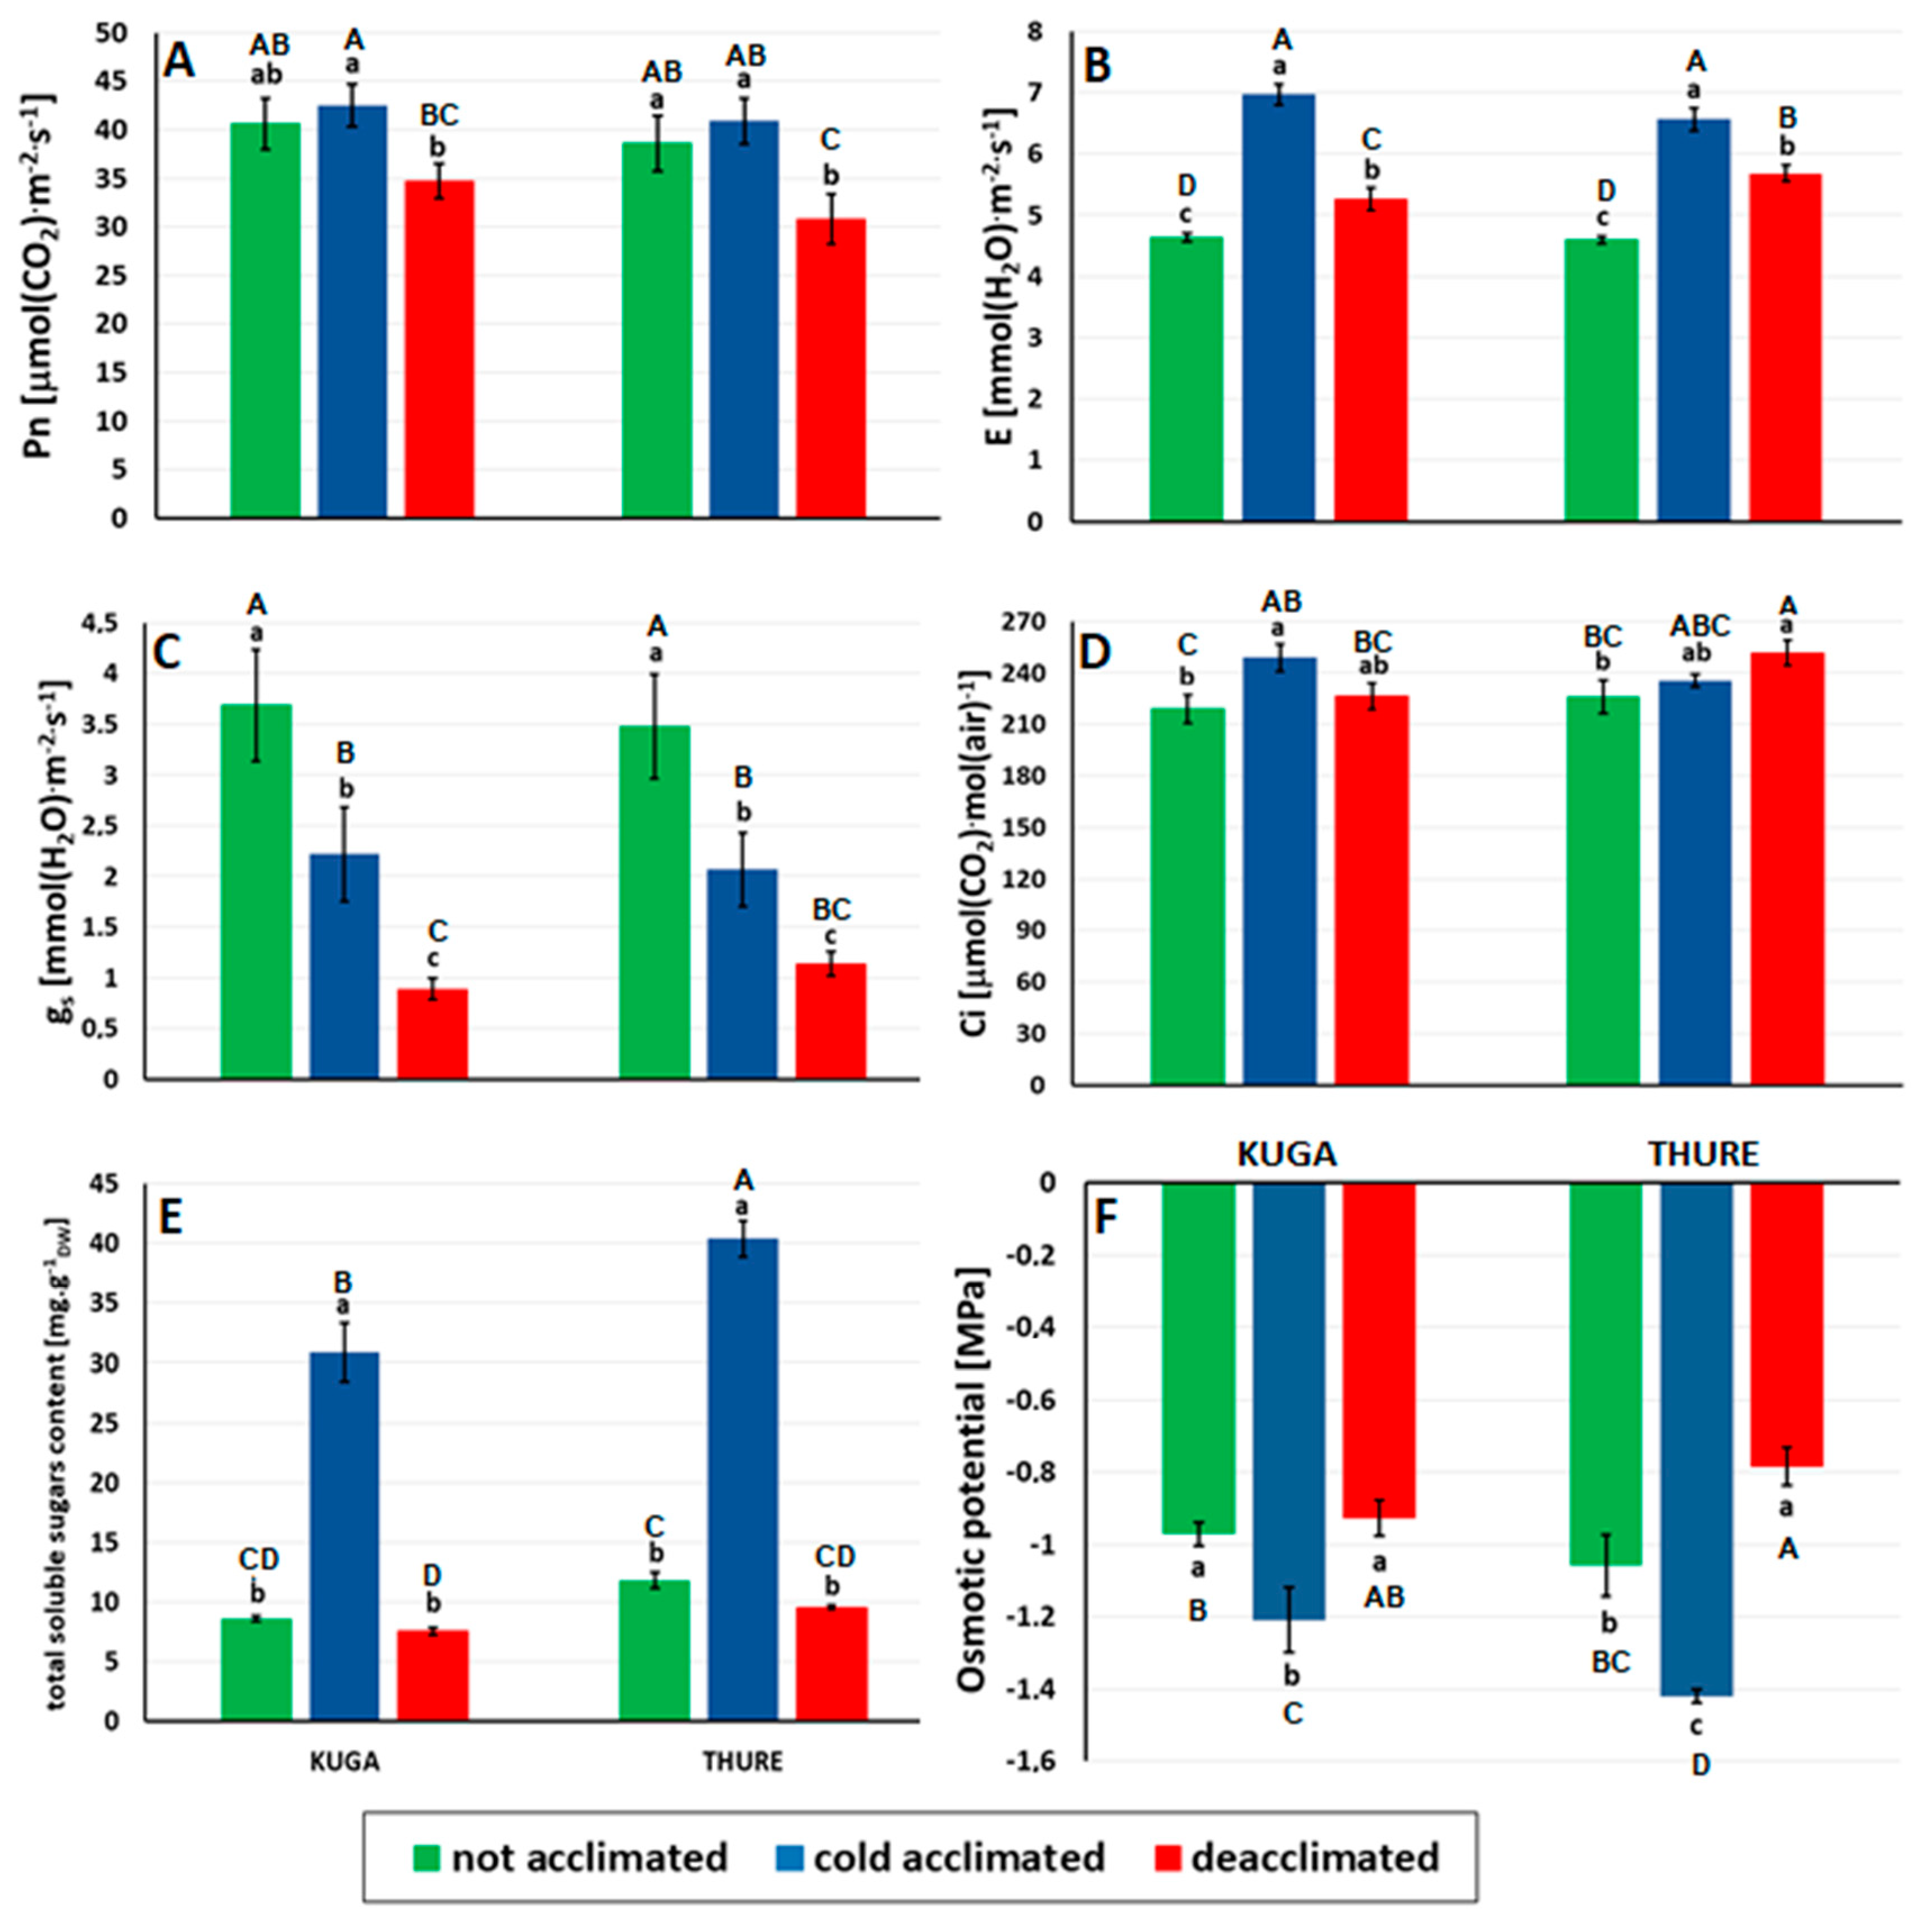
In both cultivars, the intensity of photosynthesis (PN) for the not acclimated and cold-acclimated plants was at a similar level (Figure 5A). After deacclimation, PN decreased significantly for the Kuga cultivar by about 18% and for the Thure cultivar by about 25% compared to the plants that had been cold acclimated.
The not acclimated plants of both cultivars had the lowest transpiration intensity (E) (Figure 5B). After cold acclimation, it increased by about 33% for cv. Kuga and more than 30% for cv. Thure. This parameter had intermediate values for the deacclimated plants.
The highest values of the stomata conductance (gs) were observed for the not acclimated plants (Figure 5C). After cold acclimation, gs decreased by about 40% (both cultivars). The deacclimated plants of both cultivars were characterised by the lowest values of this parameter.
The value of the intercellular CO2 concentration (Ci) was the lowest for the not acclimated plants regardless of the cultivar (Figure 5D). For the Kuga cultivar, this parameter increased by ~12% after cold acclimation compared to the not acclimated plants. However, after deacclimation, it decreased by about 9%. For the Thure cultivar, the Ci value increased slightly statistically insignificantly (by about 4%) after cold acclimation and reached its highest level for the deacclimated plants (a change of another 7%).

3.2.4. Sugar Accumulation and Osmotic Potential

Cold acclimation significantly increased the total sugar content in the leaves of both cultivars (almost 3.5-fold compared to the not acclimated plants (Figure 5E)). After deacclimation, the values decreased to the level of the not acclimated control in both cultivars.
Cold acclimation and deacclimation changed the osmotic potential in both cultivars (Figure 5F). There was a significant decrease for the cold-acclimated plants (20% for cv. Kuga and more than 25% for cv. Thure) compared to the not acclimated plants. After deacclimation, the osmotic potential increased by about 23% for cv. Kuga compared to the cold-acclimated plants and reached a similar level as that in the not acclimated plants. For cv. Thure, the increase was greater and amounted to almost 45%.

3.2.5. Leaf Water Relations and Aquaporin Expression

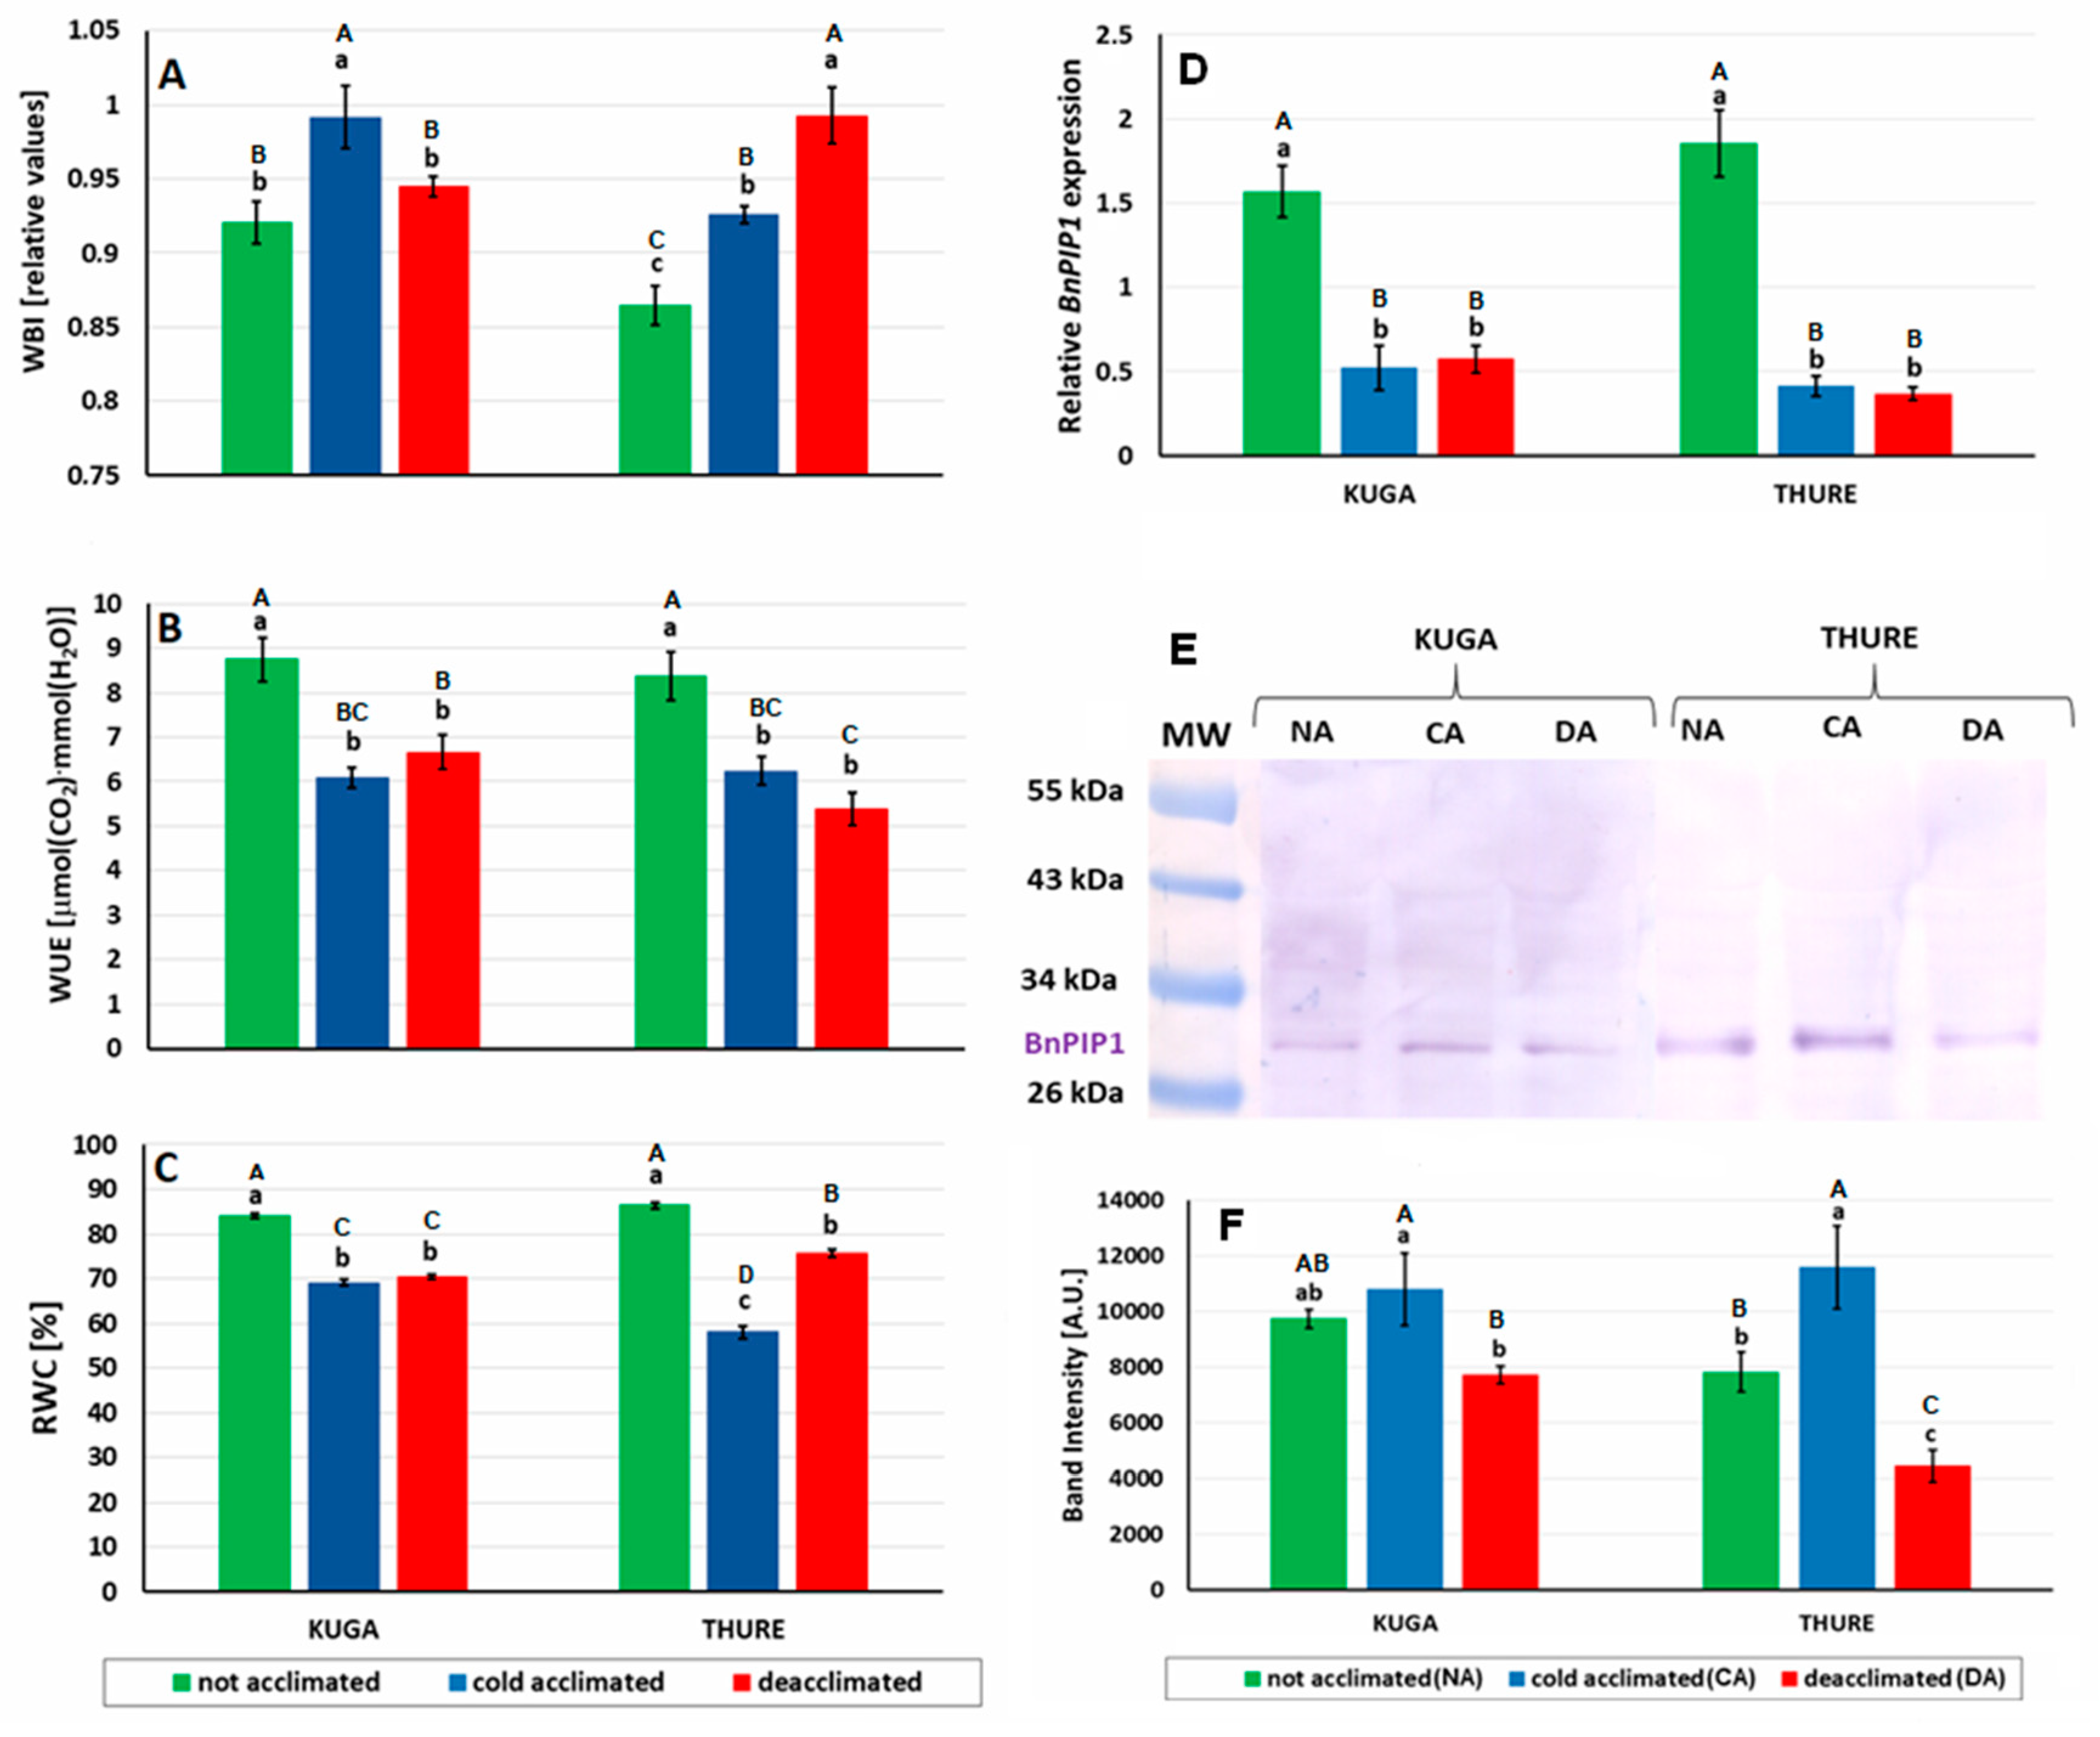
The changes in the water relations that resulted from the cold acclimation and then deacclimation were analysed using different methods. First, the leaf reflectance measurements at 970 nm enabled the water band index (WBI) to be defined. The WBI parameter was significantly higher (about 7%) for the cold-acclimated plants of both cultivars compared to the not acclimated plants (Figure 6A). After deacclimation, the values of the WBI decreased for cv. Kuga but increased for cv. Thure compared to cold-acclimated plants.
After the coefficient of water use efficiency (WUE) was calculated as the ratio PN/E, it was proven that the not acclimated plants were characterised by the most efficient use of water for photosynthesis (Figure 6B). In both cultivars, the WUE was significantly higher in the not acclimated plants than in the plants after cold acclimation and deacclimation. For cv. Kuga, there was a 30% decrease of the WUE after cold acclimation and almost 24% for the deacclimated plants. This parameter decreased by over 25% after cold acclimation and achieved the lowest value for the deacclimated plants (a decrease of another 13%) for the Thure cultivar.
A decrease in the RWC (relative water content) in the leaves was observed in the plants after cold acclimation (15% for cv. Kuga and almost 29% for cv. Thure) compared to the not acclimated plants (Figure 6C). Deacclimation did not change the RWC in the cv. Kuga plants. There was a significant increase in the RWC (17.5%) for the deacclimated cv. Thure plants compared to the cold-acclimated plants.
The highest BnPIP1 transcript levels were detected in the not acclimated cv. Kuga and cv. Thure plants (Figure 6D). Both cold acclimation and deacclimation decreased the BnPIP1 transcript level in the two analysed cultivars.
The aquaporin protein BnPIP1 was also revealed in the analysed material, and the differences in its accumulation were dependent on the growth conditions. Compared to the not acclimated control, there was an increase in the accumulation of BnPIP1 in the leaves of both cultivars during cold acclimation, however, the differences were only statistically significant for cv. Thure (Figure 6E,F). The deacclimation process caused a significant decrease in the BnPIP1 protein in both cultivars, even to the level that was lower than in the not acclimated control. As for cv. Kuga, the BnPIP1 content was more than 20% lower compared to the not acclimated plants and almost 29% compared to the cold-acclimated plants. The accumulation of BnPIP1 in the leaves of cv. Thure decreased about 43% compared to the not acclimated plants and more than 61% compared to the cold-acclimated plants.

3.2.6. FT-Raman Spectroscopy Measurements

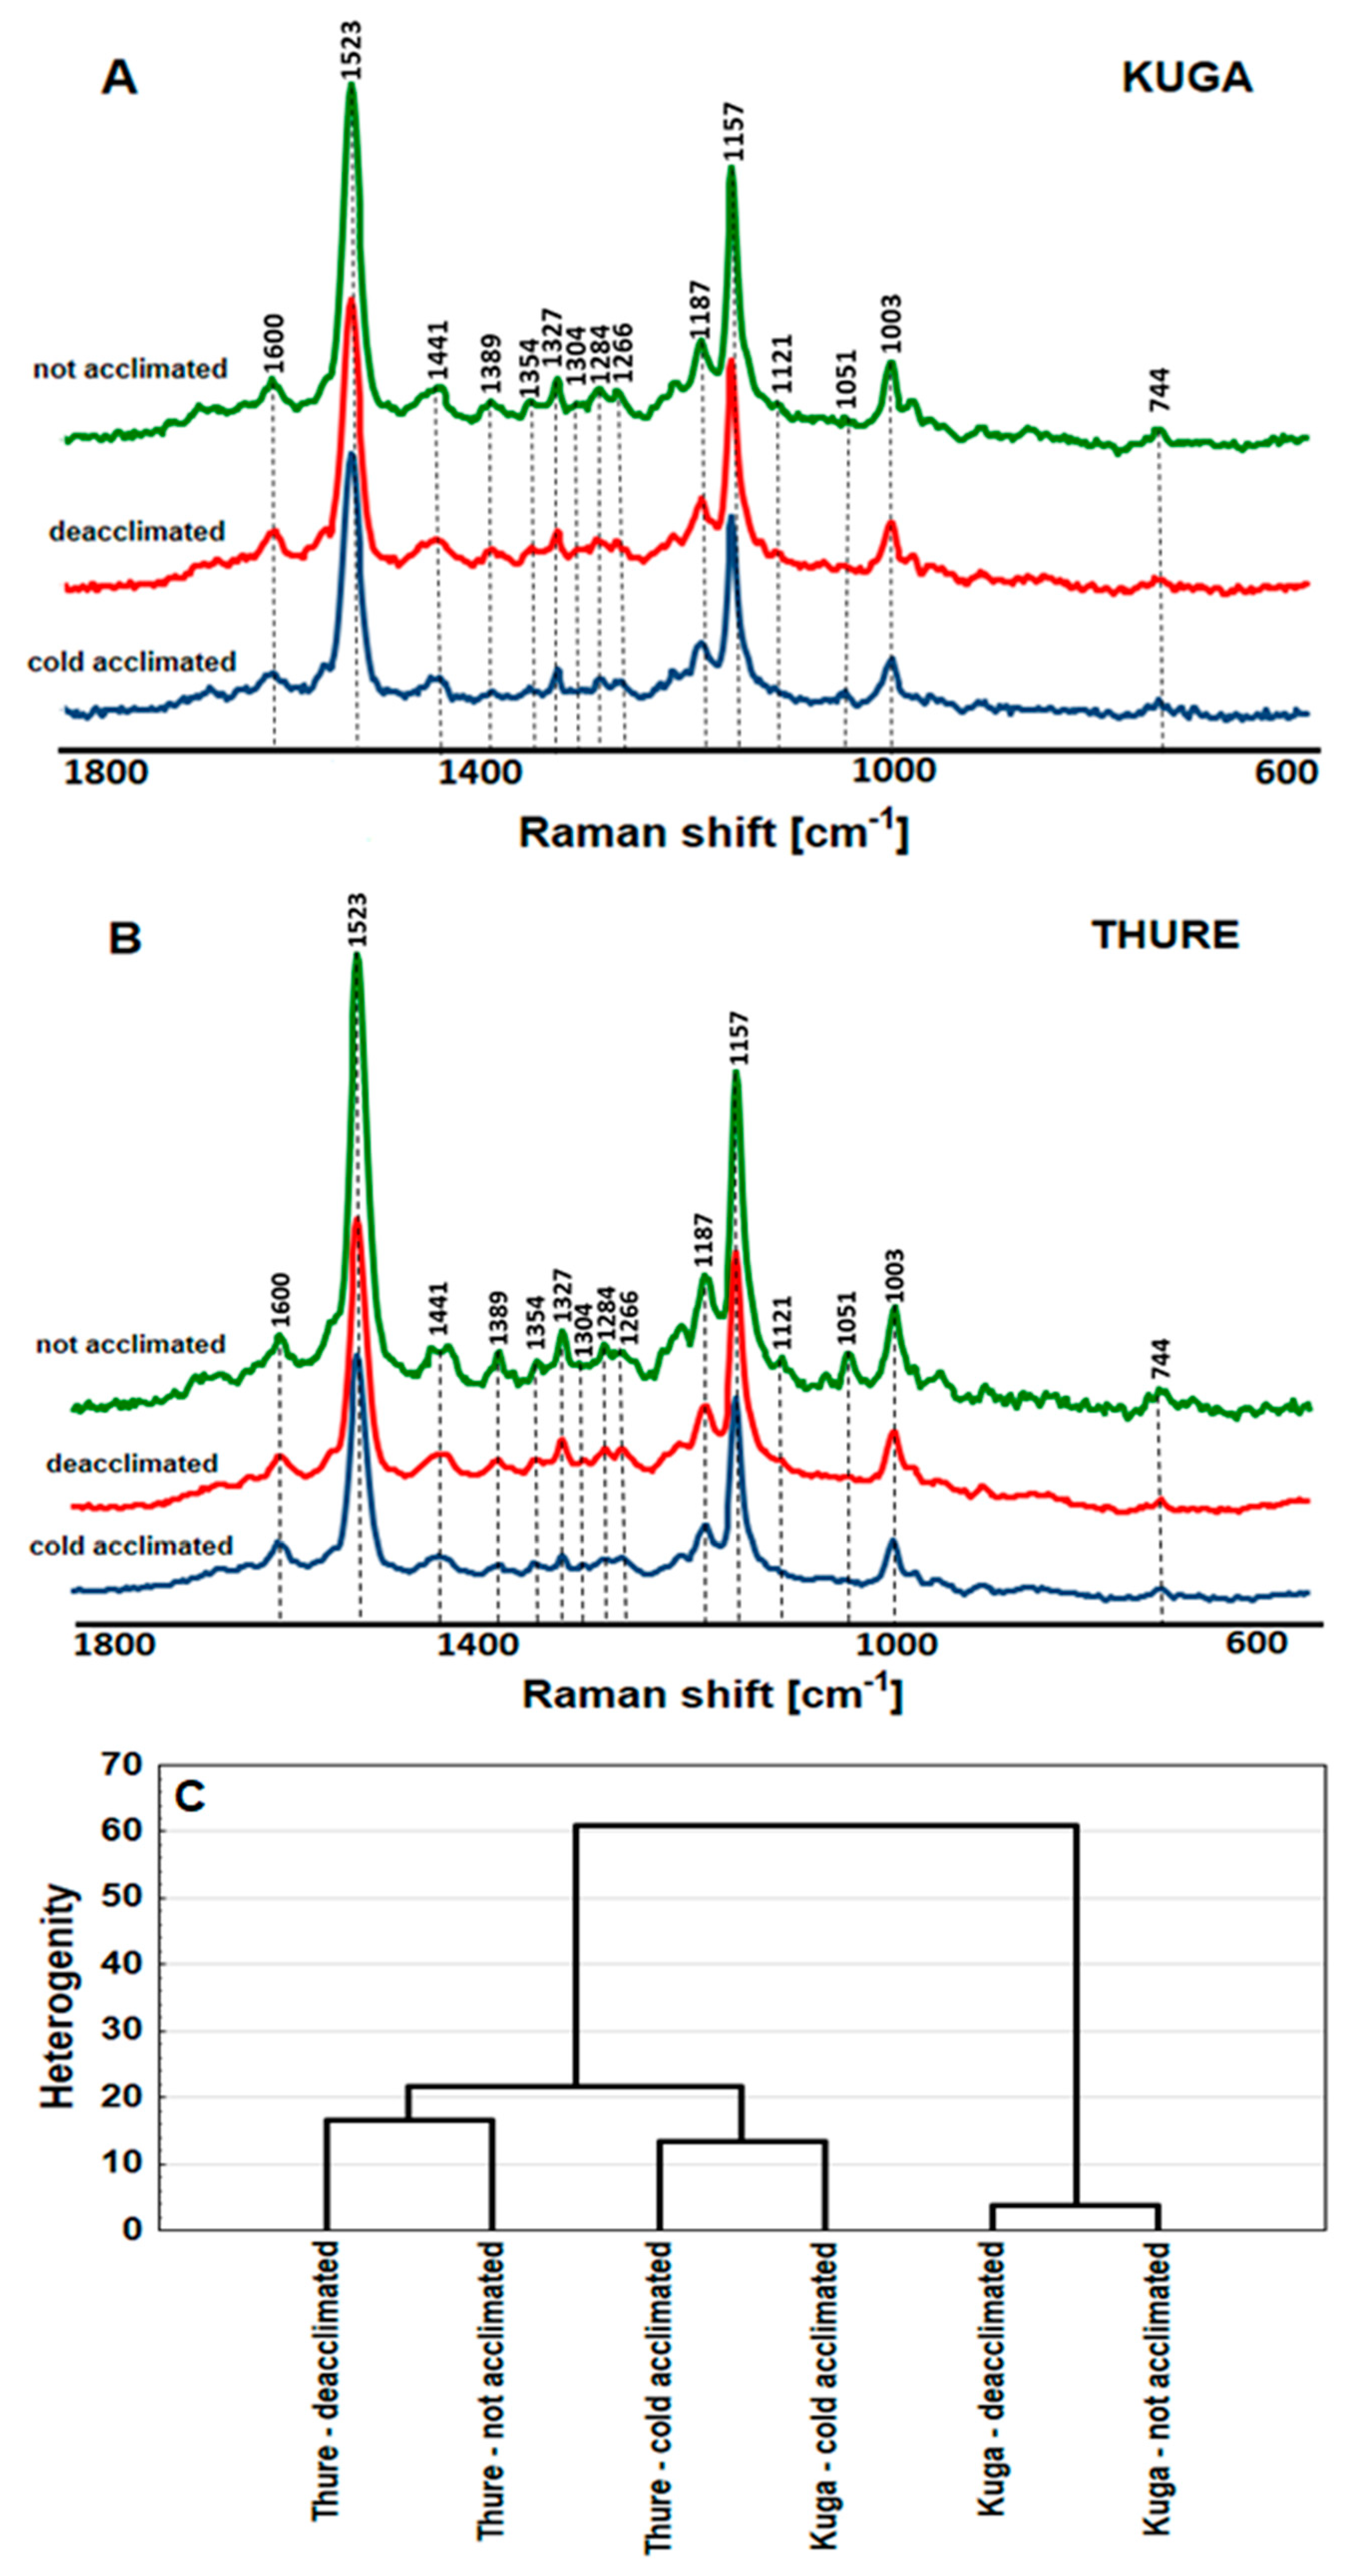
There were three characteristic bands of carotenoids at: 1523, 1157, and 1003 cm−1 on the Raman spectra that were obtained for the leaves of the not acclimated, cold-acclimated, and deacclimated cv. Kuga and cv. Thure plants (Figure 7A,B). The most intense band was visible at 1523 cm−1 and was connected with a C=C stretching vibration of β-carotene. The medium intensity second band at 1157 cm−1 was assigned to the C-C stretching vibration. The third band of low intensity at 1003 cm−1 reflected the CH3 groups that were attached to the polyene chain and coupled with the C-C bonds. Some bands of low intensity at 1389, 1354, 1327, 1284, and 744 cm−1 were associated with the presence of chlorophyll in the leaves [40]. The bands that were visible at 1441, 1304, and 1266 cm−1 came from the saturated and unsaturated fatty acids. Furthermore, the spectra also had the bands that were connected with polysaccharides at 1187 and 1121 cm−1 [40]. There was also a low intensity band at 1600 cm−1 that showed the presence of flavonoids [41]. Additionally, although it was visible in the band at 1051 cm−1 (particularly pronounced for the not acclimated cv. Thure plants), its origin could not be determined, which has also been reported in other studies [42,43,44].
Cluster analysis (chemometric method) was used to find the meaningful and systematic differences in the spectra of the cv. Kuga and cv. Thure leaves that were not acclimated, cold-acclimated and deacclimated (Figure 7C). The analysis was carried out in the range 600–1800 cm−1 and a distinct discrimination was achieved for the three groups. The not acclimated and deacclimated cv. Thure plants comprised the first group. Regardless of the cultivar, the cold-acclimated plants belonged to the second group. The not acclimated and deacclimated plants of cv. Kuga constituted the third group, which was significantly different compared to other groups.
It was demonstrated that the chemical composition of the leaves of cv. Kuga and cv. Thure were significantly different in the content and composition of carotenoids, chlorophylls, flavonoids, fatty acids or polysaccharides and that this was dependent on the temperature at which the plants had been grown. Additionally, the dendrogram enabled the differences between the cultivars to be identified.

4. Discussion

The abnormal weather phenomena that are connected with climate change are the new challenges for agriculture because of their effect on growth and yield formation in crop plants. One example of these changes is the occurrence of periods with relatively high temperatures during wintertime, which leads to the deacclimation of previously cold-acclimated plants and causes a decrease in their tolerance to frost, for example, in winter oilseed rape. The biochemical alterations that accompany deacclimation have not yet been fully explained and in some respects are even unknown.
As was expected, although a short period of high temperatures decreased the frost tolerance of the plants compared to the cold-acclimated oilseed rape, the tolerance was not reduced to the level of the not acclimated control. This indicates that after one week of deacclimating temperatures, the plants had not completely lost their frost tolerance; similar results were also shown earlier for oilseed rape [15,45], wheat, and barley [46]. Our work showed that two chosen cultivars of oilseed rape (cultivar characterized by plants of ‘normal’ height and semi-dwarf cultivar) after cold acclimation had similar frost tolerance. After deacclimation, the semi-dwarf cultivar also had a frost tolerance that was similar to the cultivar of plants of a ‘normal’ height.
In the next step, we analysed the physiological background of the altered frost tolerance in the deacclimated plants in order to determine/describe the cause of this decrease. We first focused on photosynthesis (including changes in the pigment content). Various environmental stresses reduce the content of chlorophylls and carotenoids in plants [47]. The lower content of photosynthetic pigments that occurs in low temperatures is a commonly observed phenomenon [48,49,50]. In this study, the cold acclimation of the oilseed rape plants caused a significant reduction in the content of the chlorophylls and carotenoids in both cultivars. There was a faster reduction in the content of chlorophylls than carotenoids during the cold acclimation, which was illustrated by the carotenoids/chlorophyll a + b ratio (Figure 3E). This may be related to the function of carotenoids, which protect PSII from injuries, especially when the level of chlorophylls is reduced [51]. Although the content of photosynthetic pigments increased again after the deacclimation period, it did not reach the level of the not acclimated plants, which showed that one week of deacclimation significantly reversed the changes that were caused by cold acclimation, which could be one of the first steps to restoring elongation growth [15], which is connected to the requirements of elevated production of assimilates in photosynthetic process.
Despite the phenomenon of an increased chlorophyll level in the deacclimated plants, the values of the parameters of PSII efficiency (phenomenological fluxes and energy flow calculations per reactive centre) in the deacclimated plants (as well as further CO2 assimilation PN) was lower or unchanged in the deacclimated oilseed rape compared to not acclimated or cold acclimated (see the ETo/CSm value in Table 2 and Figure 5A, which is especially important). A better dependence was found between the increased Fv/Fm ratio and increased chlorophyll content, which was true for all of the not acclimated, cold-acclimated, and deacclimated plants. The correlation between the content of the photosynthetic pigments and the Fv/Fm is known (a decrease in the pigment content also decreases the level of light absorption [50]). The slight decline in the Fv/Fm ratio after cold acclimation (Table 2) indicated an exposure to stress of the photosynthetic apparatus and, in some cases, is also considered to be an indirect indicator of the frost tolerance of plants [52,53,54]. After deacclimation, Fv/Fm increased compared to both the not acclimated and cold-acclimated plants. This coincided with the results that were obtained for oilseed rape plants during deacclimation at 20/12 °C (day/night) after four weeks of cold acclimation [45]. On the other hand, as previously mentioned, the deacclimation process caused a significant decrease (or lack of changes) in practically all of the other calculated parameters of the fast kinetic of the fluorescence of chlorophyll a that is related to the energy flow of both the reaction centre (RC) and the excited surface of a sample (CSm) (Table 2). This could be connected with injuries to the thylakoid membranes, which appeared during cold acclimation [54] or might also be related to the decrease in the activity of the chloroplast antioxidant systems [17]. It is also worth mentioning [55], in which authors found that the prolonged exposure of a plant to cold not only causes a marked depression of photosynthesis, but also that photosynthesis became less temperature and light dependent, which may additionally lengthen the process of adapting to new conditions. Taken together, in our experiment, the high chlorophyll content in the deacclimated plants compared to the cold-acclimated plants, which had a high Fv/Fm value but lower (or unchanged) phenomenological and specific energy fluxes, particularly the ETo/CSm and net photosynthesis (PN) values, could confirm all of these explanations.
In addition to the above-discussed photosynthetic pigments, other pigments such as anthocyanins and flavonols may also be important for developing temperature stress tolerance in plants. Reflectance parameters such as ARI and FRI are considered to be highly sensitive linear indicators of the content of anthocyanins and flavonols in plant leaves and fruits [56,57]. The accumulation of these pigments in leaves is often observed as a result of low temperature stress, drought, UV-B radiation, or high light [58,59,60]. During the cold acclimation of plants to low temperatures, we observed a significant increase in the anthocyanin pool in the leaves of both oilseed rape cultivars, which indicates their involvement in the response to cold stress (Figure 4A). Anthocyanins, which are synthesised de novo, play a photoprotective role for PSII, which was very important when the chlorophyll content decreased after cold acclimation (Figure 3A,B) [61]. By absorbing excess energy, they protect the most sensitive PSII components such as OEC or D1 protein, which is why in plant mutants that have an anthocyanin deficiency, PSII is damaged more quickly [62]. The accumulation of anthocyanin was episodic, and after deacclimation, the ARI values decreased to the level of the not acclimated plants (or lower). In turn, the increase in the flavonol pool, which was initiated by the low temperature, was also maintained after deacclimation (Figure 4B). Both the production of anthocyanins and flavonols supports the inhibition of ROS production and stabilises the chloroplast membranes, which has a positive effect on increasing stress tolerance [63]. There was a greater increase in the anthocyanin content in the plants of Thure cultivar, in which there was a smaller increase in the flavonol pool than in the Kuga cultivar. This may suggest that the reduced flavonol production capacity in the cv. Thure plants is “compensated” for by an increased anthocyanin production in order to provide effective protection against oxidative stress and PSII damage.
While the aforementioned changes in PN during the cold acclimation and after deacclimation were slight, the other gas exchange parameters changed significantly (gs or E—Figure 5A–C). The deacclimated plants assimilated CO2 with less intensity (low PN), and one of the reasons could be the closing of the stomata (a very low value of gs), which also resulted in reduced plant transpiration (E).
Another parameter that is important for cold acclimation (and frost tolerance) is the sugar content. In [64], the authors indicate that seasonal changes in the carbohydrate metabolism are associated with temperature changes. As the research confirms, the content of water-soluble sugars during cold acclimation increases dramatically in both perennial grasses [65,66] and in woody plants [67,68]. A higher content of sugars in cells is closely connected with an increasing freezing tolerance and is in winter plants a part of the cold hardening/acclimation process during autumn. Sugars are important for the osmotic potential of cell sap and they also protect the cellular membranes from injuries and can help maintain respiration [69]. As a result of deacclimation, a decrease in the soluble sugar content was also observed in [70,71]. This phenomenon was often associated with elongation regrowth. Our results are in agreement with those findings and show the same course of the changes in the water content of soluble sugars as for herbaceous and woody plants. After cold acclimation, we observed a large increase in the concentration of sugars but after deacclimation, there was a decrease to a level close to the not acclimated plants (Figure 5E). Similar effects were observed in cabbage seedlings where the content of sugar dropped after just one day of deacclimation [72]. It is worth mentioning that in our studies, the changes in the sugar content in the not acclimated, cold-acclimated, and deacclimated plants was somewhat/slightly accompanied by changes in the intensity of the CO2 assimilation (PN) (Figure 5A). Further, the changes in the soluble sugar content were not only associated with frost tolerance (Figure 1D), but also, obviously, with not only osmotic potential (Figure 5F). Osmolytes such as soluble sugars, amino acids, and organic acids regulate the cellular water relations and reduce cellular dehydration. They enable the enzymes, membranes, and other cellular components to be stabilised and are involved in retailoring the membrane lipid composition in order to optimise the liquid/crystalline physical structure [73,74]. The lowest value of osmotic potential was found in the cold-acclimated plants, most likely because of their high water-soluble sugar content. Conversely, the highest value of the osmotic potential correlated with the lowest content of soluble sugars for the deacclimated plants. Similar relationships between the osmotic potential and acclimation/deacclimation for oilseed rape leaves were shown by Rapacz [45].
Water loss by plants during exposure to low temperatures is a well-known phenomenon that is required for a cold-induced increase of frost tolerance. Generally, a reduced water content is associated with increased frost tolerance [75]. Osmolytes prevent ice formation in the intracellular space because the solute gradient water migrates from the cell cytosol to the apoplastic space. As a result, ice is formed in the apoplastic space, which has a relatively lower solute concentration. Thus, intercellular freezing causes less serious damage than the damage that is caused by intracellular freezing [76]. In our experiment, the water loss was well illustrated by the values of the RWC and the frost tolerance level that characterised the not acclimated and cold-acclimated plants. Simultaneously, during deacclimation, rehydration occurred [15], which seems to be one of the explanations for the lower frost tolerance that was observed in our plants (compare Figure 1D and Figure 6C; this is especially visible in cv. Thure). An increase in the RWC after a warm period was also accompanied by lower values of the soluble sugar content and higher values of the osmotic potential in the deacclimated plants.
The water band index (WBI) has been used repeatedly to analyse changes in the water content of leaf tissues [77]. Because the WBI values in the range 0.8–1.2 a.u. are typical for green vegetation [78], the results that were obtained in our experiment for the not acclimated, cold-acclimated, and deacclimated plants are in agreement with them. During the cold acclimation and deacclimation, we observed significant fluctuations in the WBI values, which, however, did not indicate a water deficit in tissues (values below 0.8 a.u.). However, the WBI values are additionally affected by the physicochemical properties of the leaf surface. On the other hand, the increase in the WBI after deacclimation in the Thure cultivar may indicate a potentially better/faster acclimation of plants to higher temperatures but simultaneously a lower tolerance to deacclimation.
The next parameter—water use efficiency (WUE)—provides information about the amount of carbon that is assimilated as biomass or the amount of grain that is produced per unit of the water that is used by the crop [79]. After the cold acclimation, we observed a reduced value of the WUE compared to the not acclimated control, which is most likely partly connected with the growth retardation under cold or is also accompanied by lower RWC and gs values. Interestingly, after a few days of the warm period, the WUE was on a similar level in the deacclimated plants as in the cold-acclimated plants, which most likely means that despite some of the observed physiological changes, the plant growth rate after deacclimation was still quite low. According to the literature, in cold stressed Stevia ssp., the WUE was also lower, as was PN [50].
The water relations in plant tissues are regulated by special water transporting channels called aquaporins (APQs). The rate of the transmembrane water flux can be controlled by changing the abundance or the activity of the aquaporins. In addition, a plant cell can alter the water potential gradient by accumulating or extruding osmolytes in order to favour the influx or efflux of water [80]. We devoted our studies to the aquaporin expression during cold acclimation and deacclimation because a low temperature causes changes in the water relations in a plant, which is usually observed through the cellular dehydration that is controlled by the aquaporins [81], which is a part of a plant’s ‘adaptation’ to low temperature conditions. The aquaporin BnPIP1 studied here belongs to the family of the plasma membrane intrinsic protein (PIPs) aquaporins. Some researchers have suggested that the PIP proteins may regulate all of the water transport in cells [82]. In both of the tested oilseed rape cultivars we observed a significant decrease in the BnPIP1 transcript accumulation in the cold-acclimated plants vs. the not acclimated control. This is in agreement with earlier findings for rice, Festuca, and barley that had been exposed to low temperatures [37,83,84]. At the same time, there was a higher accumulation of the protein BnPIP1 in the cold-acclimated plants compared to the not acclimated plants, which may be associated with the role of aquaporins in the dehydration processes that occur under low temperatures in winter oilseed rape. Earlier, it was also proven that the accumulation of the PIP protein was higher after chilling compared to control, but accumulation of PIP transcript in maize roots was lower [85]. Simultaneously, as was reported in [83] for rice, the 28 °C recovery temperature after chilling at 7 °C increased the accumulation of the PIP1 transcript. Miki et al. [86] used the proteomic approaches to analyse the composition of the plasma membrane proteins of Arabidopsis leaves during cold acclimation and deacclimation. The authors also found that most of the cold acclimation-responsive proteins returned to their non-acclimated levels during deacclimation.
FT-Raman spectroscopy is a non-invasive technique, which is useful for identifying the chemical composition of living plant tissue [87,88,89,90]. Although it has recently been used to study the effects of abiotic and biotic stresses on plants [91,92], in the presented studies, this method was used to determine the chemical composition of plant leaves that had been subjected to cold acclimation and deacclimation periods for the first time. Because the concentration of the compounds in leaves is directly correlated with the intensity of the bands that are observed on the spectra [93], the results for oilseed rape leaves showed, among others, the significant differences in the content of carotenoids and chlorophylls (Figure 7A,B). For the cold-acclimated and deacclimated leaves of both cultivars, there was a decrease in the pigment content compared to the not acclimated plants (Figure 3). However, the decline was much more visible for the cold-acclimated leaves, especially for the cv. Thure plants. The results obtained using FT-Raman spectroscopy and spectrophotometrically were then consistent and the trends of the changes in the pigment content were the same. In addition, a hierarchical analysis of similarity was performed in order to compare the chemical composition of the not acclimated, cold-acclimated, and deacclimated oilseed rape leaves (Figure 7C), which showed significant differences in the chemical composition that differentiated the plants from all three groups.

5. Conclusions

This work was focused on description of physiological changes during cold acclimation, but especially during deacclimation (16/9 °C (d/n), one week) of winter oilseed rape. Frost tests revealed that both tested cultivars, the semi-dwarf cultivar and cultivar with plants of ‘normal’ height, after cold acclimation, had frost tolerance on similar level. In addition their frost tolerance after deacclimation decreased similarly (none of the two cultivars were more “tolerant to deacclimation”). Deacclimation partially or completely reversed the physiological/biochemical effects that are induced by cold acclimation. The directions of changes were generally very similar in both cultivars (lack or weak cultivar dependency in this aspect was noted). Deacclimation lowered the soluble sugar content, increased the osmotic potential or the RWC and increased the photosynthetic pigment content. The chemical composition of the leaves, which was measured using FT-Raman spectroscopy, also clearly confirmed metabolic differences such as different levels of chlorophylls and carotenoids between the not acclimated, cold-acclimated, and deacclimated plants. Generally, the physiological changes that were observed in our studies (after deacclimation) were accompanied by a lower frost tolerance although not for all measured parameters the level noted in the not acclimated control was reached. Both of the tested cultivars including the semi-dwarf cultivar physiologically reacted to deacclimation very similarly. While the level of transcript BnPIP1 was similar in the cold-acclimated and deacclimated plants, there was a higher production of the protein BnPIP1 in the cold-acclimated plants and a lower production of this protein in deacclimated plants. Determining more molecular mechanisms responsible for the deacclimation phenomenon in oilseed rape will require further studies.

Supplementary Materials

The following are available online at https://www.mdpi.com/2073-4395/10/10/1565/s1, Figure S1: the Photosystem II efficiency measured for leaves of the not acclimated, cold-acclimated, and deacclimated oilseed rape cv. Kuga and cv. Thure. Changes in the values of specific parameters are presented as percentages compared to the values that were for the not acclimated plants are given as 100%. Figure S2: the reflectance intensity from leaves of the not acclimated, cold-acclimated, and deacclimated oilseed rape cv. Kuga and cv. Thure. Each curve represents the average of the measurements taken of 10 plants. Figure S3: visualization of the crude extract containing 20 µg of protein on the 12% polyacrylamide gel (A). Changes in the accumulation of BnPIP1 in protein fraction isolated from the not acclimated, cold-acclimated, and deacclimated leaves of oilseed rape plants cv. Kuga (B) and cv. Thure (C). Visualized band (A) corresponds with protein identified using the anti-BnPIP1 antibody. MW—molecular weight standard (Thermo Scientific PageRuler Prestained Protein Ladder).

Author Contributions

M.R. and E.P.—estimating the plant frost tolerance; E.P.—measuring the osmotic potential, critically reading and correcting the manuscript; J.O.—measuring the leaf reflectance; A.O.—measuring the leaf gas exchange; M.R. and B.J.—making the aquaporin transcript analysis; M.R. and D.S.—analysing the aquaporin protein; M.R.—conceptualising, analysing the FT-Raman spectroscopy, measuring the chlorophyll and sugar content as well as the RWC and fast kinetic of chlorophyll a fluorescence, calculating the data and performing the statistical analyses, preparing the figures, writing the manuscript; A.J.—conceptualising and designing the experiments, critically reading and correcting the manuscript, acquiring the funding/project leader. All authors have read and agreed to the published version of the manuscript.

Funding

The financial support of the Polish National Science Centre (project 2019/35/B/NZ9/02868) is gratefully acknowledged.

Acknowledgments

We would like to thank Artur Kozera from Rapool Company (Poland) for oilseed rape seeds cv. Kuga and Thure. We would like to thank Michał Dziurka for his help in analysing the pigments and sugar content.

Conflicts of Interest

The authors declare no conflict of interest.

References

  1. Wałkowski, T. Przezimowanie rzepaku w warunkach klimatycznych Polski—Dobór odmian [Winter survival of oilseed rape in Polish climate]. In Proceedings of the Nauka Doradztwu Rolniczemu, Radzików, Poland, 15–16 September 2016. [Google Scholar]
  2. Levitt, J. Responses of Plant to Environmental Stress: Water, Radiation, Salt and Other Stresses; Academic Press: New York, NY, USA, 1980. [Google Scholar]
  3. Li, P.H. Subzero temperature stress physiology of herbaceous plants. Hort. Rev. 1984, 6, 373–416. [Google Scholar]
  4. McKersie, B.D.; Leshem, Y.Y. Freezing stress. In Stress and Stress Coping in Cultivated Plants; McKersie, B.D., Leshem, Y.Y., Eds.; Kluwer Academic Publishers: Dordrecht, The Netherlands, 1994; pp. 104–128. [Google Scholar]
  5. Rapacz, M.; Janowiak, F. Relationship between prehardening photosynthetic activity at cold acclimation temperatures and frost tolerance in Winter Rape Brassica napus var. oleifera. The consequences for the reliability of frost resistance estimation under controlled conditions. J. Agron. Crop Sci. 1999, 182, 57–63. [Google Scholar] [CrossRef]
  6. Pociecha, E.; Dziurka, M.; Waligórski, P.; Krępski, K.; Janeczko, A. 24-Epibrassinolide pre-treatment modifies cold-induced photosynthetic acclimation mechanisms and phytohormone response of perennial ryegrass in cultivar-dependent manner. J. Plant Growth Regul. 2017, 36, 618–628. [Google Scholar] [CrossRef] [Green Version]
  7. Janeczko, A.; Dziurka, M.; Pociecha, E. Increased leaf tocopherol and ß-carotene content is associated with the tolerance of winter wheat cultivars to frost. J. Agron. Crop Sci. 2018, 204, 594–602. [Google Scholar] [CrossRef]
  8. Janeczko, A.; Pociecha, E.; Dziurka, M.; Jurczyk, B.; Libik-Konieczny, M.; Oklestkova, J.; Pilarska, M.; Novak, O.; Filek, M.; Rudolphi-Skórska, E.; et al. Changes in content of steroid regulators during cold hardening of winter wheat—Steroid physiological/biochemical activity and impact on frost tolerance. Plant Physiol. Biochem. 2019, 139, 215–228. [Google Scholar] [CrossRef]
  9. Cichy, H.; Cichy, A.; Starzycki, M.; Rybiński, W. The effect of plant density on yielding of winter oilseed rape. Biul. Inst. Hod. Aklim. Rośl. 2006, 242, 225. (In Polish) [Google Scholar]
  10. Lehtonen, I.; Ruosteenoja, K.; Jylhä, K. Projected changes in European extreme precipitation indices on the basis of global and regional climate model ensembles. Int. J. Climatol. 2014, 34, 1208–1222. [Google Scholar] [CrossRef]
  11. Stupnikova, I.V.; Borovskii, G.B.; Dorofeev, N.V.; Peshkova, A.A.; Voinikov, V.K. Accumulution and disappearance of dehydrins and sugars depending on freezing tolerance of winter wheat plants at different developmental phases. J. Therm. Biol. 2002, 27, 55–60. [Google Scholar] [CrossRef]
  12. Arora, R.; Rowland, J.J.; Odgen, E.L.; Dhanaraj, A.L. Dehardening kinetics, bud development, and dehydrin metabolism in blueberry cultivars during deacclimation at constant, warm temperatures. J. Am. Soc. Hort. Sci. 2004, 129, 667–674. [Google Scholar] [CrossRef] [Green Version]
  13. Pagter, M.; Hausman, J.F.; Arora, R. Deacclimation kinetics and carbohydrate changes in stem tissues of Hydrangea in response to an experimental warm spell. Plant Sci. 2011, 180, 140–148. [Google Scholar] [CrossRef]
  14. In, O.; Berberich, T.; Romdhane, S.; Feierabend, J. Changes in gene expression during dehardening of cold-hardened winter rye (Secale cereal L.) leaves and potential role of a peptide methionine sulfoxide reductase in cold-acclimation. Planta 2005, 220, 941–950. [Google Scholar] [CrossRef] [PubMed]
  15. Rapacz, M. Cold-deacclimation of oilseed rape (Brassica napus var. oleifera) in response to fluctuating temperatures and photoperiod. Ann. Bot. 2002, 89, 543–549. [Google Scholar] [CrossRef] [PubMed] [Green Version]
  16. Pociecha, E.; Janeczko, A.; Dziurka, M.; Gruszka, D. Disturbances in the Biosynthesis or Signalling of Brassinosteroids That Are Caused by Mutations in the HvDWARF, HvCPD and HvBRI1 Genes Increase the Tolerance of Barley to the Deacclimation Process. J. Plant Growth Regul. 2020. [Google Scholar] [CrossRef]
  17. Rapacz, M.; Jurczyk, B.; Sasal, M. Deacclimation may be crucial for winter survival of cereals under warming climate. Plant Sci. 2017, 256, 5–15. [Google Scholar] [CrossRef] [PubMed]
  18. Arora, R.; Taulavuori, K. Increased risk of freeze damage in woody perennials VIS-À-VIS climate change: Importance of deacclimation and dormancy response. Front. Environ. Sci. 2016, 4, 44–50. [Google Scholar] [CrossRef] [Green Version]
  19. Pagter, M.; Arora, R. Winter survival and deacclimation of perennials under warming climate: Physiological perspectives. Physiol. Plant. 2013, 147, 75–87. [Google Scholar] [CrossRef]
  20. Hoffman, L.; DaCosta, M.; Bertrand, A.; Castonguay, Y.; Ebdon, J.S. Comparative assessment of metabolic responses to cold acclimation and deacclimation in annual bluegrass and creeping bentgrass. Environ. Exp. Bot. 2014, 106, 197–206. [Google Scholar] [CrossRef]
  21. Rapacz, M.; Ergon, A.; Hoglind, M.; Jorgensen, M.; Jurczyk, B.; Ostrem, L.; Rognli, O.A.; Tronsmo, A.M. Overwintering of herbaceous plants in a changing climate. Still more questions than answers. Plant Sci. 2014, 225, 34–44. [Google Scholar] [CrossRef]
  22. Jørgensen, M.; Torp, T.; Mølmann, J.A.B. Impact of waterlogging and temperature on autumn growth, hardening and freezing tolerance of timothy (Phleum pratense). J. Agron. Crop Sci. 2020, 206, 242–251. [Google Scholar] [CrossRef] [Green Version]
  23. Pagter, M.; Alpers, J.; Erban, A.; Kopka, J.; Zuther, E.; Hincha, D.K. Rapid transcriptional and metabolic regulation of the deacclimation process in cold acclimated Arabidopsis thaliana. BMC Genom. 2017, 18, 731–747. [Google Scholar] [CrossRef] [Green Version]
  24. Zuther, E.; Juszczak, I.; Lee, Y.P.; Baier, M.; Hincha, D.K. Time-dependent deacclimation after cold acclimation in Arabidopsis thaliana accessions. Sci. Rep. 2015, 5, 12199–12208. [Google Scholar] [CrossRef] [PubMed] [Green Version]
  25. Juszczak, I.; Cvetkovic, J.; Zuther, E.; Hincha, D.K.; Baier, M. Natural Variation of Cold Deacclimation Correlates with Variation of Cold-Acclimation of the Plastid Antioxidant System in Arabidopsis thaliana Accessions. Front. Plant Sci. 2016, 7, 305–321. [Google Scholar] [CrossRef] [Green Version]
  26. Skoczowski, A.; Janeczko, A.; Gullner, G.; Tóbias, I.; Kornas, A.; Barna, B. Response of brassinosteroid-treated oilseed rape cotyledons to infection with the wild type and HR-mutant of Pseudomonas syringae or with P. fluorescence. J. Therm. Anal. Calorim. 2011, 104, 131–139. [Google Scholar] [CrossRef]
  27. Strasser, R.J.; Srivastava, A.; Tsimilli-Michael, M. The fluorescence transient as a tool to characterize and screen photosynthetic samples. In Probing Photosynthesis: Mechanism, Regulation and Adaptation; Yunus, M., Pathre, U., Mohanty, P., Eds.; Taylor and Francis: London, UK, 2000; pp. 443–480. [Google Scholar]
  28. Lichtenthaler, H.K.; Buschmann, C. Chlorophylls and carotenoids: Measurement and characterization by UV-VIS spectroscopy. In Current Protocols in Food Analytical Chemistry; Wrolstad, R.E., Acree, T.E., Decker, E.A., Penner, M.H., Reid, D.S., Schwartz, S.J., Shoemaker, C.F., Smith, D., Sporns, P., Eds.; Wiley: New York, NY, USA, 2001. [Google Scholar]
  29. Gitelson, A.A.; Merzylak, M.N.; Chivkunova, O.B. Optical properties and nondestructive estimation of anthocyanin content in plant leaves. Photochem. Photobiol. 2001, 71, 38–45. [Google Scholar] [CrossRef]
  30. Merzlyak, M.N.; Solovchenko, A.E.; Smagin, A.I.; Gitelson, A.A. Apple flavonols during fruit adaptation to solar radiation: Spectral features and technique for non-destructive assessment. J. Plant Physiol. 2005, 162, 151–160. [Google Scholar] [CrossRef] [PubMed]
  31. Peñuelas, J.; Filella, I.; Biel, C.; Serrano, L.; Savé, R. The reflectance at the 950–970 nm region as an indicator of plant water status. Int. J. Remote Sens. 1993, 14, 1887–1905. [Google Scholar] [CrossRef]
  32. Janowiak, F.; Markowski, A. Changes in leaf water relations and injuries in maize seedlings induced by different chilling conditions. J. Agron. Crop Sci. 1994, 172, 19–28. [Google Scholar] [CrossRef]
  33. Dubois, M.; Gilles, K.; Hamilton, J.K.; Rebers, P.A.; Smith, F. A colorimetric method for the determination of sugars. Nature 1951, 168, 167–168. [Google Scholar] [CrossRef]
  34. Bach, A.; Kapczyńska, A.; Dziurka, K.; Dziurka, M. Phenolic compounds and carbohydrates in relation to bulb formation in Lachenalia “Ronina” and “Rupert” in vitro cultures under different lighting environments. Sci. Horti. 2015, 188, 23–29. [Google Scholar] [CrossRef]
  35. Jurczyk, B.; Rapacz, M.; Budzisz, K.; Barcik, W.; Sasal, M. The effects of cold, light and time of day during low-temperature shift on the expression of CBF6, FpCor14b and LOS2 in Festuca pratensis. Plant Sci. 2012, 183, 143–148. [Google Scholar] [CrossRef]
  36. Ma, L.; Wu, J.; Qi, W.; Coulter, J.A.; Fang, Y.; Li, X.; Liu, L.; Jin, J.; Niu, Z.; Yue, J.; et al. Screening and verification of reference genes for analysis of gene expression in winter rapeseed (Brassica rapa L.) under abiotic stress. PLoS ONE 2020, 15, e0236577. [Google Scholar] [CrossRef]
  37. Sadura, I.; Libik-Konieczny, M.; Jurczyk, B.; Gruszka, D.; Janeczko, A. Plasma membrane ATPase and the aquaporin HvPIP1 in barley brassinosteroid mutants acclimated to high and low temperature. J. Plant Physiol. 2020, 244, 153090–153097. [Google Scholar] [CrossRef] [PubMed]
  38. Bradford, M.M. A rapid and sensitive method for the quantitation of microgram quantities of protein utilizing the principle of protein-dye binding. Anal. Biochem. 1976, 72, 248–254. [Google Scholar] [CrossRef]
  39. Laemmli, U.K. Cleavage of structural proteins during the assembly of the head of bacteriophage T4. Nature 1970, 227, 680–685. [Google Scholar] [CrossRef] [PubMed]
  40. Schulz, H.; Baranska, M. Identification and Quantification of Valuable Plant Substances by IR and Raman Spectroscopy. Vib. Spectrosc. 2007, 43, 13–25. [Google Scholar] [CrossRef]
  41. Schrader, B.; Klump, H.H.; Schenzel, K.; Schulz, H. Non-destructive NIR FT Raman analysis of plants. J. Mol. Struct. 1999, 509, 201–212. [Google Scholar] [CrossRef]
  42. Edwards, H.G.M.; Moody, C.D.; Villar, S.E.J.; Wynn-Williams, D.D. Raman spectroscopic detection of key biomarkers of cyanobacteria and lichen symbiosis in extreme Antarctic habitats: Evaluation for Mars lander missions. Icarus 2005, 174, 560–571. [Google Scholar] [CrossRef]
  43. Kula, M.; Rys, M.; Saja, D.; Tys, J.; Skoczowski, A. Far-red dependent changes in the chemical composition of Spirulina platensis. Eng. Life Sci. 2016, 16, 777–785. [Google Scholar] [CrossRef]
  44. Moravcová, S.; Tůma, J.; Dučaiová, Z.K.; Waligórski, P.; Kula, M.; Saja, D.; Słomka, A.; Bąba, W.; Libik-Konieczny, M. Influence of salicylic acid pretreatment on seeds germination and some defence mechanisms of Zea mays plants under copper stress. Plant Physiol. Biochem. 2018, 122, 19–30. [Google Scholar] [CrossRef]
  45. Rapacz, M. Regulation of frost resistance during cold de-acclimation and re-acclimation in oilseed rape. A possible role of PSII redox state. Physiol. Plant. 2002, 115, 236–243. [Google Scholar] [CrossRef]
  46. Pomeroy, M.K.; Andrews, C.J.; Fedak, G. Cold hardening and dehardening responses in winter wheat and winter barley. Can. J. Plant Sci. 1975, 55, 529–535. [Google Scholar] [CrossRef]
  47. Ashraf, M.; Harris, P.J.C. Photosynthesis under stressful environments: An overview. Photosynthetica 2013, 51, 163–190. [Google Scholar] [CrossRef]
  48. Han, Q.; Mukai, Y. Cold acclimation and photoinhibition of photosynthesis accompanied by needle color changes in Cryptomeria japonica during the winter. J. For. Res. 1999, 4, 229–234. [Google Scholar] [CrossRef]
  49. Janeczko, A.; Gullner, G.; Skoczowski, A.; Dubert, F.; Barna, B. Effects of brassinosteroid infiltration prior to cold treatment on ion leakage and pigment contents in rape leaves. Biol. Plant. 2007, 51, 355–358. [Google Scholar] [CrossRef]
  50. Hajihashemi, S.; Noedoost, F.; Geuns, J.M.C.; Djalovic, I.; Siddique, K.H.M. Effect of Cold Stress on Photosynthetic Traits, Carbohydrates, Morphology, and Anatomy in Nine Cultivars of Stevia rebaudiana. Front Plant Sci. 2018, 9, 1430–1441. [Google Scholar] [CrossRef] [Green Version]
  51. Gill, S.S.; Tuteja, N. Reactive oxygen species and antioxidant machinery in abiotic stress tolerance in crop plants. Plant Physiol. Bioch. 2010, 48, 909–930. [Google Scholar] [CrossRef]
  52. Rapacz, M.; Gąsior, D.; Zwierzykowski, Z.; Leśniewska-Bocianowska, A.; Humphreys, M.W.; Gay, A.P. Changes in cold tolerance and the mechanisms of acclimatation of photosystem II to cold hardening generated by anther culture of Festuca pratensis × Lolium multiflorum cultivars. New Phytol. 2004, 161, 105–114. [Google Scholar] [CrossRef]
  53. Ensminger, I.; Busch, F.; Huner, N.P.A. Photostasis and cold acclimation: Sensing low temperature through photosynthesis. Physiol. Plant. 2006, 126, 28–44. [Google Scholar] [CrossRef]
  54. Rapacz, M. Chlorophyll a fluorescence transient during freezing and recovery in winter wheat. Photosynthetica 2007, 5, 409–418. [Google Scholar] [CrossRef]
  55. Maciejewska, U.; Tomczyk, J.; Kacperska, A. Effects of cold on CO2 exchange in winter rape leaves. Physiol. Plant. 1984, 62, 315–320. [Google Scholar] [CrossRef]
  56. Solovchenko, A.E.; Chivkunova, O.B.; Gitelson, A.A.; Merzylak, M.N. Non-Destructive Estimation Pigment Content Ripening Quality and Damage in Apple Fruit with Spectral Reflectance in the Visible Range. Fresh Prod. 2010, 4, 91–102. [Google Scholar]
  57. Gitelson, A.; Solovchenko, A. Non-invasive quantification of foliar pigments: Possibilities and limitations of reflectance- and absorbance-based approaches. J. Photochem. Photobiol. 2018, 178, 537–544. [Google Scholar] [CrossRef] [PubMed]
  58. Chalker-Scott, L. Environmental significance of anthocyanins in plant stress responses. Photochem. Photobiol. 1999, 70, 1–9. [Google Scholar] [CrossRef]
  59. Merzylak, M.N.; Chivkunova, O.B. Light stress induced pigment changes and evidence for anthocyanin photoprotection in apple fruit. Photochem. Photobiol. 2000, 55, 154–162. [Google Scholar]
  60. Oliwa, J.; Skoczowski, A. Different response of photosynthetic apparatus to high-light stress in sporotrophophyll and nest leaves of Platycerium bifurcatum. Photosynthetica 2019, 57, 147–159. [Google Scholar] [CrossRef]
  61. Anderson, R.; Ryser, P. Early autumn senescence in red maple (Acer rubrum L.) is associated with high leaf anthocyanin content. Plants 2015, 4, 505–522. [Google Scholar] [CrossRef] [Green Version]
  62. Pietrini, F.; Iannelli, M.A.; Massacci, A. Anthocyanin accumulation in the illuminated surface of maize leaves enhances protection from photo-inhibitory risks at low temperature, without further limitation to photosynthesis. Plant Cell Environ. 2002, 25, 1251–1259. [Google Scholar] [CrossRef]
  63. Agati, G.; Azzarello, E.; Pollastri, S.; Tattini, M. Flavonoids as antioxidants in plants: Location and functional significance. Plant Sci. 2012, 196, 67–76. [Google Scholar] [CrossRef]
  64. Jouve, L.; Jacques, D.; Douglas, G.C.; Hoffmann, L.; Hausman, J.-F. Biochemical characterization of early and late bud flushing in common ash (Fraxinus excelsior L.). Plant Sci. 2007, 172, 962–969. [Google Scholar] [CrossRef]
  65. Patton, A.J.; Cunningham, S.M.; Volenec, J.J.; Reicher, Z.J. Differences in freeze tolerance of zoysiagrass: II. Carbohydrate and proline accumulation. Crop Sci. 2007, 47, 2170–2181. [Google Scholar] [CrossRef]
  66. Hoffman, L.; DaCosta, M.; Ebdon, J.S.; Watkins, E. Physiological changes during cold acclimation of perennial ryegrass accessions differing in freeze tolerance. Crop Sci. 2010, 50, 1037–1047. [Google Scholar] [CrossRef]
  67. Pagter, M.; Jensen, C.R.; Petersen, K.K.; Liu, F.; Arora, R. Changes in carbohydrates, ABA and bark proteins during seasonal cold acclimation and deacclimation in Hydrangea species differing in cold hardiness. Physiol. Plant. 2008, 134, 473–485. [Google Scholar] [CrossRef] [PubMed]
  68. Liu, B.; Zhou, H.; Cao, S.; Xia, Y.-P.; Arora, R. Comparative Physiology of Natural Deacclimation in Ten Azalea Cultivars. HortScience 2017, 52, 1451–1457. [Google Scholar] [CrossRef] [Green Version]
  69. Thomashow, M.F. Plant cold acclimation: Freezing tolerance genes and regulatory mechanisms. Annu. Rev. Plant Physiol. Plant Mol. Biol. 1999, 50, 571–599. [Google Scholar] [CrossRef] [Green Version]
  70. Shin, H.; Oh, Y.; Kim, D. Differences in cold hardiness, carbohydrates, dehydrins and related gene expressions under an experimental deacclimation and reacclimation in Prunus persica. Physiol. Plant. 2015, 154, 485–499. [Google Scholar] [CrossRef]
  71. Ouyang, L.; Leus, L.; De Keyser, E.; Van Labeke, M.-C. Cold acclimation and deacclimation of two garden rose cultivars under controlled daylength and temperature. Front. Plant Sci. 2020, 11, 327–341. [Google Scholar] [CrossRef]
  72. Sasaki, H.; Ichimura, K.; Oda, M. Changes in Sugar Content during Cold Acclimation and Deacclimation of Cabbage Seedlings. Ann. Bot. 1996, 78, 365–369. [Google Scholar] [CrossRef] [Green Version]
  73. Guy, C.L. Cold Acclimation and Freezing Stress Tolerance: Role of Protein Metabolism. Annu. Rev. Plant Physiol. Plant Mol. Biol. 1990, 41, 187–223. [Google Scholar] [CrossRef]
  74. Farooq, M.; Wahid, A.; Kobayashi, N.; Fujita, D.; Basra, S.M.A. Plant drought stress: Effects, mechanisms and management. Agron. Sustain. Dev. 2009, 29, 185–212. [Google Scholar] [CrossRef] [Green Version]
  75. Guy, C.L. Freezing tolerance of plants: Current understanding and selected emerging concepts. Can. J. Biol. 2003, 81, 1216–1223. [Google Scholar] [CrossRef]
  76. Li, P.H.; Palta, J.P. Frost hardening and freezing stress in tuber-bearing solanum species. In Plant Cold Hardiness and Freezing Stress; Li, P.H., Sakai, A., Eds.; Academic Press: New York, NY, USA, 1978; pp. 49–71. [Google Scholar]
  77. Araus, J.L.; Slafer, G.A.; Royo, C.; Serret, M.D. Breeding for Yield Potential and Stress Adaptation in Cereals. Crit. Rev. Plant Sci. 2001, 27, 377–412. [Google Scholar] [CrossRef]
  78. Peñuelas, J.; Piñol, J.; Ogaya, R.; Filella, I. Estimation of plant water concentration by the reflectance water index WI (R900/R970). Int. J. Remote Sens. 1997, 18, 2869–2875. [Google Scholar] [CrossRef]
  79. Hatfield, J.L.; Dold, C. Water Use Efficiency: Advances and Challenges in a Changing Climate. Front. Plant Sci. 2019, 10, 61–74. [Google Scholar] [CrossRef] [PubMed] [Green Version]
  80. Johansson, I.; Karlsson, M.; Johanson, U.; Larsson, C.; Kjellbom, P. The role of aquaporins in cellular and whole plant water balance. Biochim. Biophys. Acta Biomembr. 2000, 1465, 324–342. [Google Scholar] [CrossRef] [Green Version]
  81. Chen, K.; Arora, R. Understanding the cellular mechanism of recovery from freeze–thaw injury in spinach: Possible role of aquaporins, heat shock proteins, dehydrin and antioxidant system. Physiol. Plant. 2014, 150, 374–387. [Google Scholar] [CrossRef]
  82. Gerbeau, P.; Amodeo, G.; Henzler, T.; Santoni, V.; Ripoche, P.; Maurel, C. The water permeability of Arabidopsis plasma membrane is regulated by divalent cations and pH. Plant J. 2002, 30, 71–81. [Google Scholar] [CrossRef]
  83. Yu, X.; Peng, Y.H.; Zhang, M.H.; Shao, Y.J.; Su, W.A.; Tang, Z.C. Water relations and an expression analysis of plasma membrane intrinsic proteins in sensitive and tolerant rice during chilling and recovery. Cell Res. 2006, 16, 599–608. [Google Scholar] [CrossRef] [Green Version]
  84. Pawłowicz, I.; Rapacz, M.; Perlikowski, D.; Gondek, K.; Kosmala, A. Abiotic stresses influence the transcript abundance of PIP and TIP aquaporins in Festuca species. J. Appl. Genet. 2017, 58, 421–435. [Google Scholar] [CrossRef] [Green Version]
  85. Aroca, R.; Amodeo, G.; Fernandez-Illescas, S.; Herman, E.M.; Chaumont, F.; Chrispeels, M.J. The Role of Aquaporins and Membrane Damage in Chilling and Hydrogen Peroxide Induced Changes in the Hydraulic Conductance of Maize Roots. Plant Physiol. 2005, 137, 341–353. [Google Scholar] [CrossRef] [Green Version]
  86. Miki, Y.; Takahashi, D.; Kawamura, Y.; Uemura, M. Temporal proteomics of Arabidopsis plasma membrane during cold- and de-acclimation. Proteomics 2019, 197, 71–81. [Google Scholar] [CrossRef]
  87. Withnall, R.; Chowdhry, B.Z.; Silver, J.; Edwards, H.G.; de Oliveira, L.F. Raman spectra of carotenoids in natural products. Spectrochim. Acta A Mol. Biomol. Spectrosc. 2003, 59, 2207–2212. [Google Scholar] [CrossRef]
  88. Baranska, M.; Schulz, H.; Joubert, E.; Manley, M. In Situ Flavonoid Analysis by FT-Raman Spectroscopy: Identification, Distribution, and Quantification of Aspalathin in Green Rooibos (Aspalathus Linearis). Anal. Chem. 2006, 78, 7716–7721. [Google Scholar] [CrossRef] [PubMed]
  89. Baranska, M.; Baranski, R.; Schulz, H.; Nothnagel, T. Tissue-specific accumulation of carotenoids in carrot roots. Planta 2006, 224, 1028–1037. [Google Scholar] [CrossRef] [PubMed]
  90. Papaioannou, E.H.; Liakopoulou-Kyriakides, M.; Christofilos, D.; Arvanitidis, I.; Kourouklis, G. Raman Spectroscopy for Intracellular Monitoring of Carotenoid in Blakeslea Trispora. Appl. Biochem. Biotechnol. 2009, 159, 478–487. [Google Scholar] [CrossRef]
  91. Rys, M.; Szaleniec, M.; Skoczowski, A.; Stawoska, I.; Janeczko, A. FT-Raman spectroscopy as a tool in evaluation the response of plants to drought stress. Open Chem. 2015, 13, 1091–1100. [Google Scholar] [CrossRef]
  92. Saja, D.; Rys, M.; Stawoska, I.; Skoczowski, A. Metabolic response of cornflower (Centaurea cyanus L.) exposed to tribenuron-methyl: One of the active substances of sulfonylurea herbicides. Acta Physiol. Plant. 2016, 38, 168–180. [Google Scholar] [CrossRef] [Green Version]
  93. Baranski, R.; Baranska, M.; Schulz, H. Changes in carotenoid content and distribution in living plant tissue can be observed and mapped in situ using NIR-FT-Raman spectroscopy. Planta 2005, 222, 448–457. [Google Scholar] [CrossRef]
Publisher’s Note: MDPI stays neutral with regard to jurisdictional claims in published maps and institutional affiliations.
Figure 1. The frost tolerance of oilseed rape (cv. Kuga and cv. Thure) that characterised the not acclimated plants (A), cold-acclimated plants (B), and deacclimated plants (C). (D) Estimated temperature required to reduce plant regrowth by 50% (RT50). Mean values ± SD marked with the same letters (in Figure 1A–C) did not differ significantly at p ≤ 0.05 according to Duncan’s test, n = 15; lowercase—comparison separately within each cultivar, uppercase—comparison between cultivars. The values in Figure 1D are presented as ± the coefficient interval for p = 0.05.
Agronomy 10 01565 g001
Figure 2. The Kuga and Thure oilseed rape cultivars after frost treatment. (A) Not acclimated oilseed rape Kuga and Thure cultivars immediately after exposure to frost at −4 °C. (B) Not acclimated oilseed rape the Kuga and Thure cultivars that had been exposed to frost at −4 °C and then left to regrow (two weeks at 12 °C). (C) The cold-acclimated oilseed rape Kuga cultivar that had been exposed to frost at −8 °C, −10 °C, −12 °C, and −18 °C and then left to regrow (two weeks at 12 °C). (D) The cold-acclimated oilseed rape Thure cultivar that had been exposed to frost at −8 °C, −10 °C, −12 °C and −18 °C and then left to regrow (two weeks at 12 °C). (E) The deacclimated oilseed rape Kuga cultivar that had been exposed to frost at −6 °C, −8 °C, and −11 °C and then left to regrow (two weeks at 12 °C). (F) The deacclimated oilseed rape Thure cultivar that had been exposed to frost at −6 °C, −8 °C, and −11 °C and then left to regrow (two weeks at 12 °C).
Agronomy 10 01565 g002
Figure 3. Photosynthetic pigments in the leaves of the not acclimated, cold-acclimated, and deacclimated oilseed rape cv. Kuga and cv. Thure: (A) content of chlorophyll a, (B) content of chlorophyll b, (C) content of chlorophyll a + b, (D) content of carotenoids, (E) carotenoids/chlorophyll a+b ratio. Mean values ± SD marked with the same letters did not differ significantly at p ≤ 0.05 according to Duncan’s test, n = 5; lowercase—comparison separately within each cultivar, uppercase—comparison between cultivars.
Agronomy 10 01565 g003
Figure 4. Level of anthocyanins (parameter ARI; (A)) and flavonols (parameter FRI; (B)) that were calculated based on the leaf reflectance measurements for the not acclimated, cold-acclimated, and deacclimated oilseed rape cv. Kuga and cv. Thure. Mean values ± SD marked with the same letters did not differ significantly at p ≤ 0.05 according to Duncan’s test, n = 10; lowercase—comparison separately within each cultivar, uppercase—comparison between cultivars.
Agronomy 10 01565 g004
Figure 5. Gas exchange, total soluble sugars, and osmotic potential in the leaves of the not acclimated, cold-acclimated, and deacclimated oilseed rape cv. Kuga and cv. Thure; (A) net photosynthesis (Pn), (B) transpiration rate (E), (C) stomatal conductance (gs), (D) intercellular CO2 concentration, (E) total content of soluble sugars, and (F) osmotic potential. Mean values ± SD marked with the same letters did not differ significantly at p ≤ 0.05 according to Duncan’s test, n = 10 for gas exchange, n = 5 for content of sugars, and n = 7 for osmotic potential; lowercase—comparison separately within each cultivar, uppercase—comparison between cultivars.
Agronomy 10 01565 g005
Figure 6. Water relations of leaves of not acclimated, cold-acclimated, and deacclimated oilseed rape cv. Kuga and cv. Thure; (A) Water band index (WBI) based on the leaf reflectance at 970 nm, (B) water use efficiency index (WUE) based on the quotient of photosynthetic rate and transpiration (PN/E), (C) leaf relative water content (RWC) calculated as (fresh mass—dry mass)/(turgid mass—dry mass)] × 100. Values marked with the same letters do not differ significantly at p ≤ 0.05 according to Duncan’s test, n = 10; lowercase—comparison separately within each cultivar, uppercase—comparison between cultivars. Accumulation of the aquaporin transcript BnPIP1 (D) and the protein BnPIP1 (E,F) in the leaves of the not acclimated, cold-acclimated, and deacclimated oilseed rape cv. Kuga and cv. Thure. The results of the accumulation of the transcript (D) are presented as the fold change in the expression of the BnPIP1 gene in the given samples compared to the endogenous reference gene Actin. The visualised bands (E) corresponding to the BnPIP1 protein were identified using the anti-BnPIP1 antibody. The picture shows two individual gels made separately—first for cv. Kuga, second for cv. Thure. In total, 40 µg of proteins were loaded onto the gel. MW—molecular weight standard (Thermo Scientific PageRuler Prestained Protein Ladder). A.U.—arbitrary units. Values marked with the same letters do not differ significantly at p ≤ 0.05 according to Duncan’s test, n = 5 (transcript), n = 6 (protein); lowercase—comparison separately within each cultivar, uppercase—comparison between cultivars.
Agronomy 10 01565 g006
Figure 7. FT-Raman spectra of the leaves of the not acclimated (green line), cold-acclimated (blue line), and deacclimated (red line) oilseed rape cv. Kuga (A) and cv. Thure cultivars (B). Cluster analysis of the FT-Raman spectra of the oilseed rape cv. Kuga cv. Thure cultivars (C).
Agronomy 10 01565 g007
Table 1. Genes, sequence origins, and the primers and probes that were designed and used in the study.
Gene NameGenBank IDForward PrimerReverse PrimerTaqMan MGB Probe
PIP1AF118382.1TGTCGTTGGTTAGAGCCATATTGTCTTTGACGAACCCAACTCCACATAFAM-TCGCACCCAAACACTG-MGB
ActinAF111812.1ACTCTGGTGATGGTGTGTCTCAGCGTGAGGAAGAGCATAACCTTFAM-CCGTGCCGATCTACG-MGB
Table 2. Photosystem II efficiency in the leaves of the not acclimated, cold acclimated, and deacclimated oilseed rape cv. Kuga and cv. Thure. Mean values marked with the same letters (a; b; c; d; A; B; C; D—statistical differences) did not differ significantly at p ≤ 0.05 according to Duncan’s test, n = 15; lowercase—comparison separately within each cultivar, uppercase—comparison between cultivars. The percentage values of changes compared to the not acclimated plants (taken as 100%) are given in parenthesis. Fv/Fm—the maximum quantum yield of the photosystem II primary photochemistry; ABS—energy absorbed by the antennas; DI0—energy dissipated as heat; TR0—energy trapped in the reaction center; ET0—energy flow to the electron-transport chain; RC—calculation in relation to reaction center; CSm—calculation in relation to excited cross section. RC/CSm—the number of reactive centers for each leaf cross section.
Parametrscv. KUGAcv. THURE
Not AcclimatedCold AcclimatedDeacclimatedNot AcclimatedCold AcclimatedDeacclimated
Fv/Fm0.823 b (B)0.810 c (C) (−1.6)0.840 a (A) (+2.1)0.829 b (B)0.810 c (C) (−2.3)0.838 a (A) (+1.1)
ABS/RC1.155 a (A)1.168 a (A) (+1.1)1.034 b (B) (−10.5)1.157 a (A)1.007 b (B) (−13.0)1.085 ab (AB) (−6.2)
DIo/RC0.204 a (B)0.223 a (A) (+9.3)0.166 b (D) (−18.6)0.198 a (B)0.192 a (BC) (−3.0)0.176 a (CD) (−11.1)
TRo/RC0.951 a (A)0.945 a (A) (−0.6)0.868 b (BC) (−8.7)0.958 a (A)0.815 b (C) (−14.9)0.909 a (AB) (−5.1)
ETo/RC0.609 a (AB)0.590 a (B) (−3.1)0.610 a (AB) (+0.1)0.625 a (A)0.503 b (C) (−19.5)0.634 a (A) (+1.4)
ABS/CSm1621.8 a (A)1674.2 a (A) (+3.2)857.9 b (B) (−47.1)1638.5 a (A)1638.3 a (A) (−0.01)844.3 b (B) (−48.5)
DIo/CSm285.9 b (B)318.5 a (A) (+11.4)137.2 c (C) (−52.0)279.9 b (B)309.5 a (A) (+10.6)136.4 c (C) (−51.3)
TRo/CSm1335.8 a (A)1355.7 a (A) (+1.5)720.7 b (B) (−46.0)1358.6 a (A)1328.7 a (A) (−2.2)707.9 b (B) (−47.9)
ETo/CSm857.0 a (AB)848.4 a (AB) (−1.0)508.9 b (C) (−40.6)889.5 a (A)823.4 b (B) (−7.4)496.0 c (C) (−44.2)
RC/CSm1404.2 a (B)1433.4 a (A) (+2.1)829.7 b (C) (−40.9)1416.2 b (B)1626.9 a (A) (+14.9)778.2 c (C) (−45.1)