Article

Chlorophyll-a Fluorescence Analysis Reveals Differential Response of Photosynthetic Machinery in Melatonin-Treated Oat Plants Exposed to Osmotic Stress

by
Onoud Alyammahi
and
Mayank Anand Gururani
*
Biology Department, College of Science, UAE University, Al Ain 15551, UAE
*
Author to whom correspondence should be addressed.
Agronomy 2020, 10(10), 1520; https://doi.org/10.3390/agronomy10101520
Submission received: 10 September 2020 / Revised: 28 September 2020 / Accepted: 2 October 2020 / Published: 6 October 2020
(This article belongs to the Section Crop Breeding and Genetics)

Abstract

:
In this study, the effects of melatonin-induced enhancement on the principal photosynthetic parameters and antioxidant machinery were investigated in Avena sativa (oat) plants exposed to polyethylene glycol (PEG)-induced osmotic stress. The parameters of growth, chlorophyll content, stomatal conductance, proline accumulation, lipid peroxidation, and electrolyte leakage showed noteworthy improvements between the groups. Melatonin treatment caused upregulation of the genes that encode the three major antioxidant enzymes: ascorbate peroxidase (APX), superoxide dismutase (SOD) and catalase (CAT). Chlorophyll-a fluorescence kinetic analyses revealed that melatonin treatment improved performance indices (PIABS and PItotal), quantum yields, and efficiencies of photosystem II (PSII) in oat plants subjected to PEG-induced osmotic stress. Furthermore, upregulation of five genes (PsbA, PsbB, PsbC, PsbD, and PsbO) that encode the core proteins of PSII implied melatonin exerted a positive influence on photosynthesis under conditions of osmotic stress.

1. Introduction

Global agriculture losses are widespread due to various abiotic stresses. Recent estimates reveal that drought stress alone is predicted to cause a 50% decrease in crop productivity on arable land over the next 50 years [1]. The sessile characteristic of plants enables them to survive and cope with the environmental stresses by modulating their cellular and molecular responses. Therefore, it is imperative to understand plant responses to adverse environmental cues to be able to design effective strategies for developing stress-resilient crops in the future. Photosynthetic components are severely damaged with the onset of abiotic stress. These components mainly include the photosystem II (PSII) extrinsic proteins PsbA, PsbB, PsbC, and PsbD as well as the oxygen evolving complex (OEC) protein, PsbO. Among these genes, PsbA that encodes the D1 proteins is the most severely affected protein, and the stress-induced D1 damage and repair cycle has been studied in great detail [2]. However, the regulatory roles of extrinsic and intrinsic PSII proteins remain unclear. Potato plants with downregulated expression of PsbO were demonstrated to withstand heavy metal toxicity, drought, and salinity stress, indicating a putative role of PsbO in abiotic stress tolerance [3]. Another study demonstrated a similar relationship between PsbO expression and acclimation of photosynthetic machinery under abiotic stress conditions among forage grasses. The drought and frost tolerance genotypes of grasses showed lower accumulation of PsbO protein, suggesting a role of PsbO in the protection of OEC during stress [4].
Melatonin (N-acetyl-5-methoxytryptamine), a well-known animal hormone, has recently drawn great attention as a molecule involved in plant development and abiotic stress responses, although it is primarily considered an antioxidant that assists in regulating the production of ROS and other detrimental molecules in plants. Several studies have demonstrated the involvement of melatonin in various growth and developmental processes, from seed germination to photosynthesis [5]. The influence exerted by melatonin has also been studied extensively in various crops under almost all types of abiotic stress [6,7,8,9,10].
The primary objective of this study was to evaluate the osmotic stress tolerance in oat (Avena sativa L.) plants induced by the application of melatonin. In addition to the physiological and biochemical analyses, OJIP (where O and P denote origin and peak, respectively, and J and I are the intermediate phases of fluorescence induction) chlorophyll-a (Chl-a) fluorescence transients analysis was used to determine the dynamic changes occurring in the photosynthetic components.

2. Materials and Methods

2.1. Plant Growth and Experimental Design

Oat seeds were obtained from a local seeds store in Al Ain, UAE. The seeds were sowed in pots (25 cm diameter) filled with sterile soil peat (Van Egmond, Potgrond, Netherlands), and germination was observed over 3 to 4 days. Three-week-old plants were used for stress treatments, as described earlier [11]. Three pots/replicate were used. The well-watered (WW) plants served as control for the experiments. The MW plants were pretreated with 100 µM melatonin for 10 days and irrigated with normal water for the next 7 days. The MPEG plants were pretreated with 100 µM melatonin for 10 days and irrigated with 20% PEG 6000 solution for the next 7 days. Finally, the PEG plants were irrigated with normal water for 10 days, followed by 7 days of irrigation with 20% PEG 6000 solution. The 100 µM concentration of melatonin for oat plants was selected on the basis of a previous report [11].

2.2. Determination of Morphological Parameters and Chlorophyll Content

Root length, shoot length, and plant fresh weight (FW) were recorded, and the treated plants were analyzed when the experiment ended, on day 17. Prior to recording the FW, the oat seedlings were harvested, washed thoroughly using tap water, and completely dried with filter paper. The chlorophyll levels were measured as described earlier [12].

2.3. Stomatal Conductance, Electrolyte Leakage, and Malondialdehyde (MDA) Measurements

Stomatal conductance was recorded on the upper surface of the fully expanded leaves using a steady-state diffusion leaf porometer (SC-1; Decagon Devices, Inc., Pullman, WA, USA). The porometer was calibrated each day before taking the measurements. All measurements were done at 25 ± 1 °C and 55 ± 5% relative humidity. To record electrolyte leakage, the leaf disks were suspended in 10 mL distilled water in a test tube. Then, the leaf disks were boiled. Next, the filtrate was collected and the electrical conductivity (ECa) was measured. The filtrate was brought to room temperature and then heated to 55 °C for 30 min; the electrical conductivity (ECb) was then measured again. The filtrate was then boiled at 100 °C for 10 min, and the electrical conductivity (ECc) was recorded. The electrolyte leakage was calculated using
Electrolyte leakage (%) = (ECb–ECa/ECc) × 100
To estimate the MDA equivalent content, 500 mg leaf tissue was ground to a fine powder using liquid nitrogen and homogenized in 5 mL of 50 mM buffer (0.07% NaH2PO4·2H2O and 1.6% Na2HPO4·12H2O). It was then centrifuged at 20,000 g for 25 min at 4 °C. Next, 4 mL of 20% trichloroacetic acid containing 0.5% thiobarbituric acid was added to 1 mL of the supernatant. The reaction mixture was incubated at 95 °C for 30 min and kept on ice for 10 min. The reaction mixture was centrifuged at 13,000 rpm for 10 min, and the absorbance was recorded at 532 nm. The non-specific absorption at 600 nm was subtracted from the absorbance reading at 532 nm. The final MDA equivalent content was calculated as described earlier [13].

2.4. Chl-a Fluorescence Measurements

Pots containing WW, PEG, MW, and MPEG plants subjected to PEG-induced osmotic stress were dark-adapted for 1 h prior to measuring the Chl-a fluorescence. Measurements were taken under dark conditions using a Pocket Plant Efficiency Analyzer (Hansatech Instruments Ltd., King’s Lynn, United Kingdom). An actinic light beam of 3000 μmol photons m−2 s−1 was used for determining the fluorescence induction at 685 nm. Five randomly selected individual plants were used for each replicate, and three replicates were used for each treatment. Measurements were recorded in the middle part of the fully developed leaves. The maximal fluorescence (FM) and minimal fluorescence (FO) of the sampled leaves were used to calculate the quantum yield of PSII, expressed as the Fv/FM ratio. The data thus recorded were analyzed according to the “JIP-test equations” using the Biolyzer software program [14]. The JIP-test conditions [15] are in conformity with the general derivation for the actual quantum yield of primary photochemistry φPx = TRx/ABS = 1 − Fx/FM. These conditions interpret that each energy flux of the energy cascade from the photon absorption flux (ABS) is converted into a free energy flux (RE), transported via the photosynthetic electron transport chain (ET), and then stored by the reduction of the end-electron acceptors of PSI (Figure 1). The formulae and definitions of terms used in the JIP-test are listed in Supplementary Table S1.

2.5. Estimation of Proline and Expression Analysis of the Genes Involved in Proline Biosynthesis

Proline was extracted from frozen WW, MW, PEG, and MPEG leaves and subjected to colorimetric analysis, as described earlier [16]. In order to analyze the expression of the two genes encoding delta-1-pyrroline-5-carboxylate synthase 1 (P5CS1) and proline dehydrogenase 1(PDH1), the total RNA was first extracted from the frozen leaves collected on day 17 using the Plant RNA purification kit (Norgen Biotek Corp, Thorold, ON, Canada), and the cDNA was synthesized from 1 μg RNA using the TruScript First Strand cDNA Synthesis Kit (Norgen Biotek Corp, Thorold, ON, Canada). Diluted cDNA (10×) samples were then used as the template for the qRT-PCR analysis. The qRT-PCR analysis was performed using the QuantStudio5 System (Applied Biosystems, Beverly, MA, USA) and SYBR™ Green PCR Master Mix (Applied Biosystems, Beverly, MA, USA). Glyceraldehyde-3-phosphate dehydrogenase (GAPDH; NCBI Acc. No. MH260251) was used as internal control. The PCR program included pre-denaturation at 95 °C for 3 min, followed by 35 cycles at 95 °C for 30 s, 58 °C for 15 s, and 72 °C for 30 s, and final extension at 72 °C for 5 min. The relative gene expression was calculated as described earlier [17]. The primers used for the analysis are listed in Table 1.

2.6. Expression Analyses of the Genes Encoding the PSII Core Proteins and ROS-Scavenging Enzymes

The expression analyses of five genes (PsbA, PsbB, PsbC, PsbD, and PsbO) encoding the core proteins of the PSII were performed using the qRT-PCR. Similarly, the expression levels of genes encoding the three major ROS-scavenging enzymes (APX, SOD, and CAT) were determined. The RNA extraction, cDNA synthesis, and thermocycler conditions were the same as described in Section 2.3. The primers used in the study are listed in Table 1.

2.7. Statistical Analysis

All the experiments performed in this study were repeated at least three times, and the data obtained were analyzed using Origin 8.1 software (www.originlab.com). Statistical differences were calculated using the one-way analysis of variance followed by Tukey’s multiple comparison tests. Standard error was calculated using the n values for each experiment. Bars with different letters in the figures indicate significant differences at p < 0.05.

3. Results

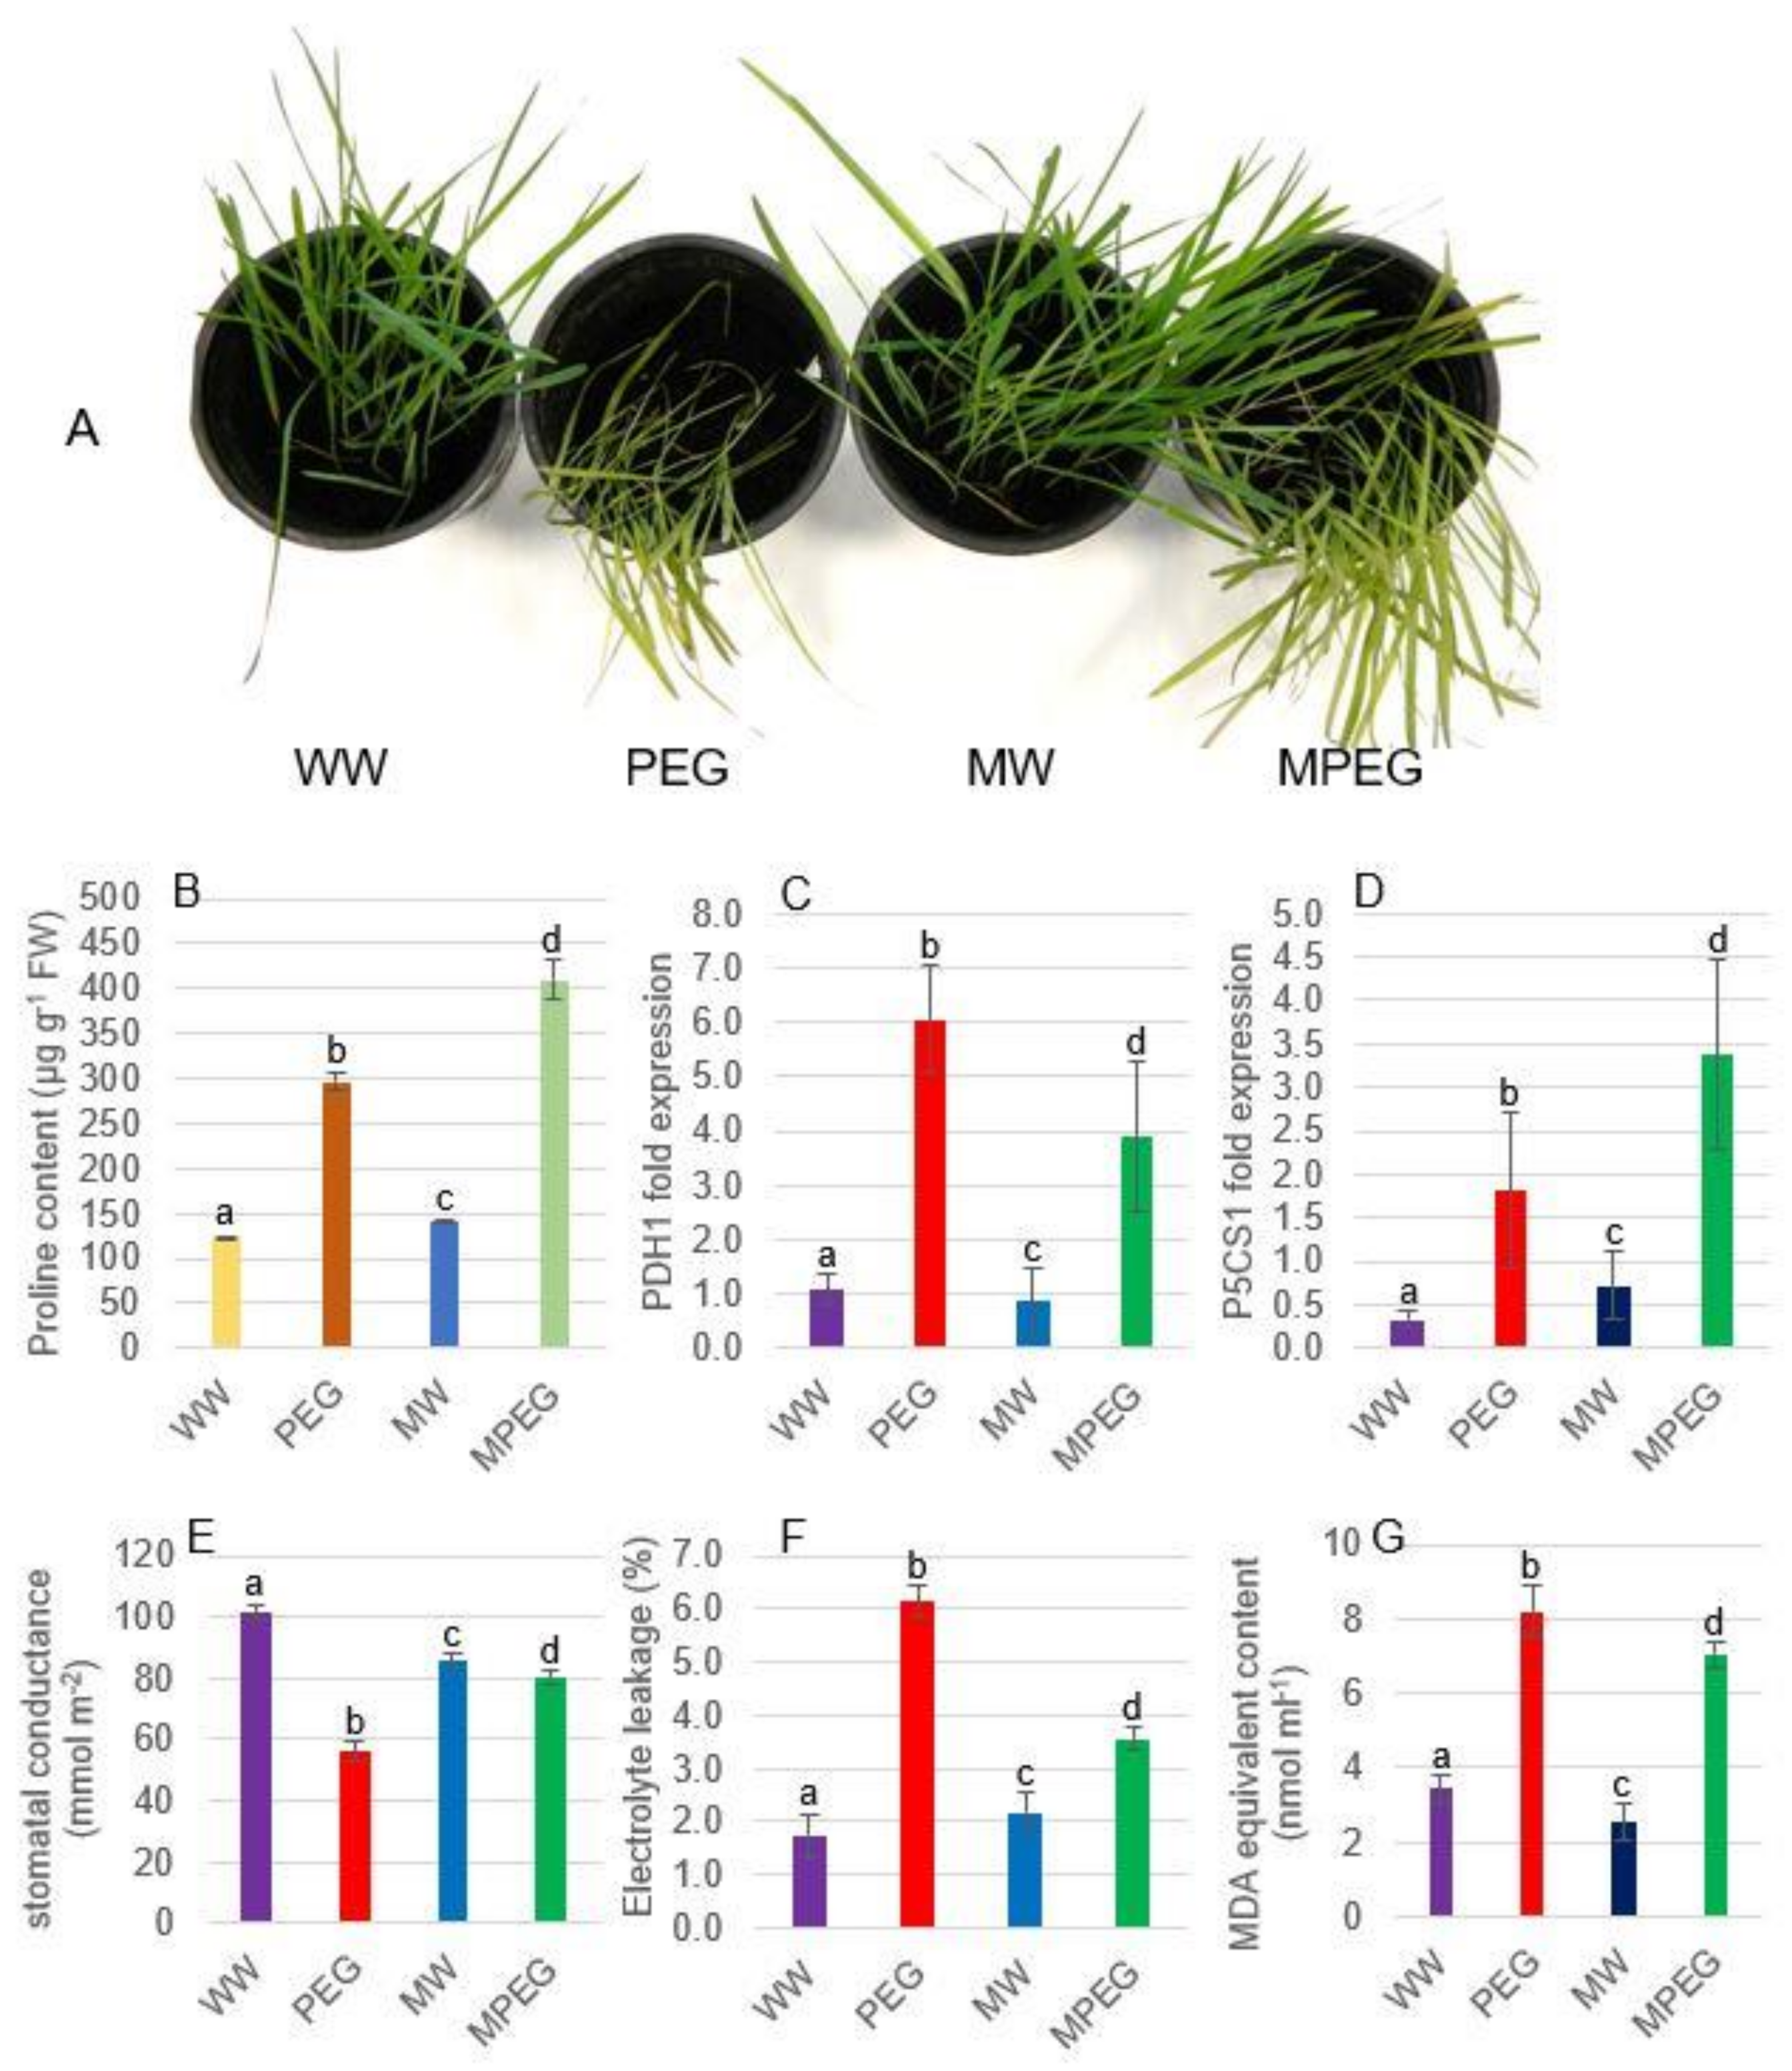
3.1. Morphological, Physiological, and Biochemical Changes in Oat Plants Subjected to Osmotic Stress

Significant morphological differences were noted in each plant group (Figure 2A; Table 2). The WW and the MW plants appeared normal, while the PEG plants exposed to 20% PEG-induced osmotic stress exhibited manifestations of stress as their leaves had begun to turn pale green to yellow. On the other hand, the MPEG plants appeared notably better with regards to growth than did the PEG plants exposed to 20% PEG without the melatonin pretreatment. Both the WW and MW plants showed an increase in root and shoot lengths and FW than the MPEG and PEG plants. The MPEG plants showed significantly higher average root and shoot lengths and FW than the PEG group (Table 2). As expected, the highest total chlorophyll content was seen in the leaves of the WW plants, while the PEG plants recorded the lowest levels of chlorophyll. Interestingly, the chlorophyll content accumulated in the MW and MPEG plants was similar, which was almost 1.7-fold higher than the leaves exposed to 20% PEG (Table 2). The proline levels of the melatonin-treated or untreated leaves were measured to demonstrate the effects of melatonin on proline biosynthesis in oat plants exposed to 20% PEG (Figure 2B). The PEG plants exposed to 20% PEG accumulated a significantly higher proline concentration than did the WW and MW plants. Interestingly, the MPEG plants accumulated higher proline contents than did the PEG plants. The biochemical assessment of proline was further corroborated with the analysis of mRNA expression of the genes encoding two key enzymes of proline biosynthesis. The expressions of PDH1 and P5CS1 genes were determined on day 17 (Figure 2C,D). The PDH1 gene expression was found at the highest levels in the PEG plants. The MPEG plants showed significantly higher PDH1 gene expression compared to the MW and WW plants, but they showed reduced expression compared to the PEG plants. The P5CS1 expression was also significantly higher in the PEG plants than in the WW and MW plants. However, the MPEG plants expressed an almost two-fold higher level of P5CS1 compared to the PEG plants.
The highest stomatal conductance was noted in the WW plants, followed by the MW and MPEG plants. The PEG plants exposed to 20% PEG revealed the lowest stomatal conductance. However, the MPEG plants exhibited significantly higher stomatal conductance than did the PEG plants (Figure 2E). Similarly, no significant difference in electrolyte leakage (%) was observed between the WW and MW plants, although it was almost 3.5-fold higher in the PEG plants. However, the MPEG plants (3.5%) exhibited significantly lower electrolyte leakage than the PEG plants (6.1%) (Figure 2F). The effect of the osmotic stress on the membrane lipid peroxidation was estimated in terms of MDA equivalent content levels (Figure 2G). The MDA equivalent content of the PEG plants was 3.1- and 3.0-times higher than that of the WW and MW plants, respectively. However, the MPEG plants accumulated 1.1-times lower levels of MDA equivalent content than did the PEG plants.

3.2. Melatonin Induces the Expression of Major PSII Genes under Osmotic Stress

Figure 3A–E demonstrates that PEG-induced osmotic stress suppressed the expressions of PsbA, PsbB, PsbC, and PsbD, compared to the WW group. The expression of these genes was significantly higher in the MPEG plants compared to the PEG plants. By contrast, the PsbO expression was markedly higher in the PEG plants than in the other three plant groups. The PsbO expression in the PEG plants was 3.8-times higher compared to the MPEG, two-times higher than the WW plants, and 4.2-times higher when compared to the MW plants.

3.3. Melatonin Upregulates the Expression of the Major ROS-Scavenging Enzyme Genes in Oat Plants under Osmotic Stress

The expression analysis of the genes encoding the APX, SOD, and CAT enzymes on day 17 showed that, barring SOD, no significant differences were evident in the expression of these genes between the WW and MW plants (Figure 3F–H). However, remarkable differences were observed between the PEG and MPEG plants: the MPEG plants exhibited 1.2-, 1.5-, and 1.4-fold higher levels of APX, SOD, and CAT expression respectively, compared to the PEG plants.

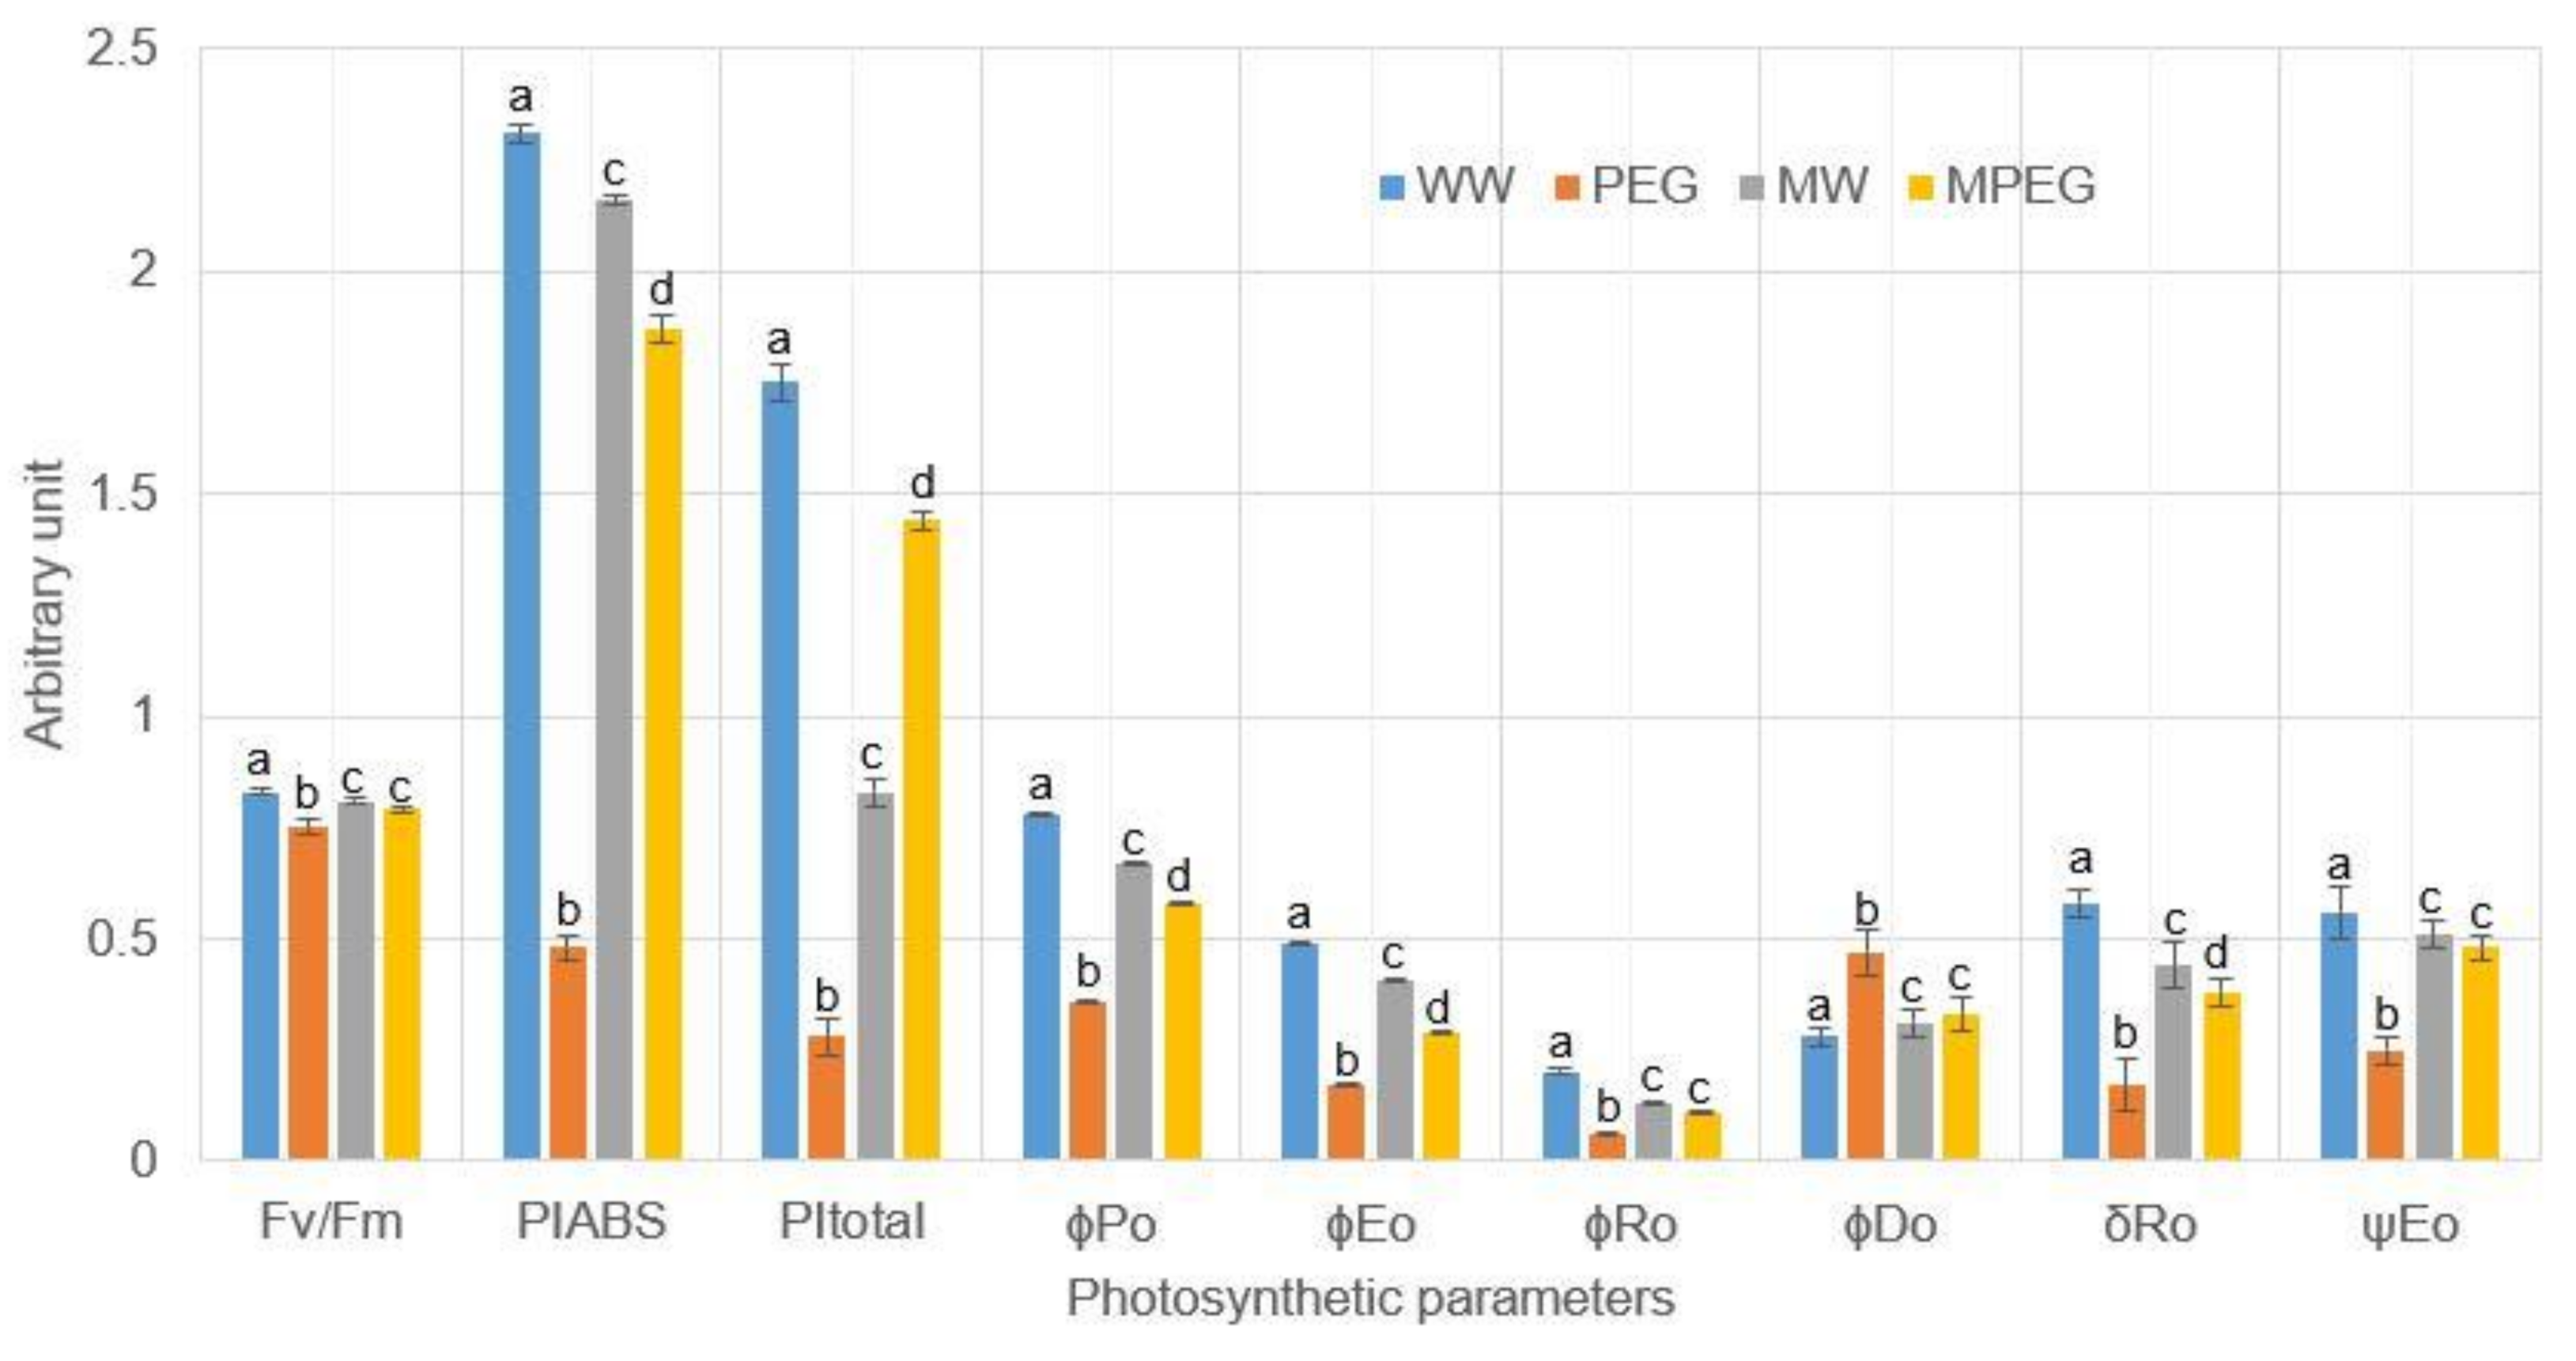
3.4. Melatonin-Pretreated Plants Were Photosynthetically more Efficient under Osmotic Stress

To estimate the photosynthetic performance of plants from the WW, PEG, MW, and MPEG groups, the fluorescence JIP-test was used. The Chl-a fluorescence transients of the dark-adapted leaves from all the four plant groups are shown on a logarithmic scale from 20 μs to 1 s in Figure 4. A typical OJIP shape was observed in all the samples with similar maximum variable fluorescence (FM–FO = FV), suggesting the plants were photosynthetically active.
The relative fluorescence between the steps O and K (20 and 300 s, respectively = WOK = (Ft − FO)/(FK − FO)) and O and J (20 s and 2 ms, respectively = WOJ = (Ft − FO)/(FJ − FO)) were normalized and are shown as the kinetic difference ∆WOK = WOK(treatment) − WOK(control) and ∆WOJ = WOJ(treatment) − WOJ(control), respectively. The different kinetics ∆WOK and ∆WOJ enable the visibility of the L- and K-band, respectively (Figure 5 and Figure 6).
The L-band is a marker of the energetic cooperativity of the dynamic PSII units. When the values of the WW leaf samples were subtracted from those of the PEG, MW, and MPEG plant samples, negative L-bands were revealed indicating a higher energetic connectivity between the active PSII units relative to the control WW samples. Phenomenologically, this energetic grouping is reflected in a sigmoidal ascent within the 0 to 300 μs range, which parallels the maximum reduction in the ΔWOK at around 150 μs, subsequently resulting in the decline of the L-band. A positive K-band in the PEG group plants was observed, indicating a higher rate of reduction of the primary electron acceptor of PSII, quinone (QA). Similar findings in previous studies suggest that a positive K-band is an indicator of a “leaky” OEC, exposed to non-water electron donors such as proline and ascorbate [16,18,19].

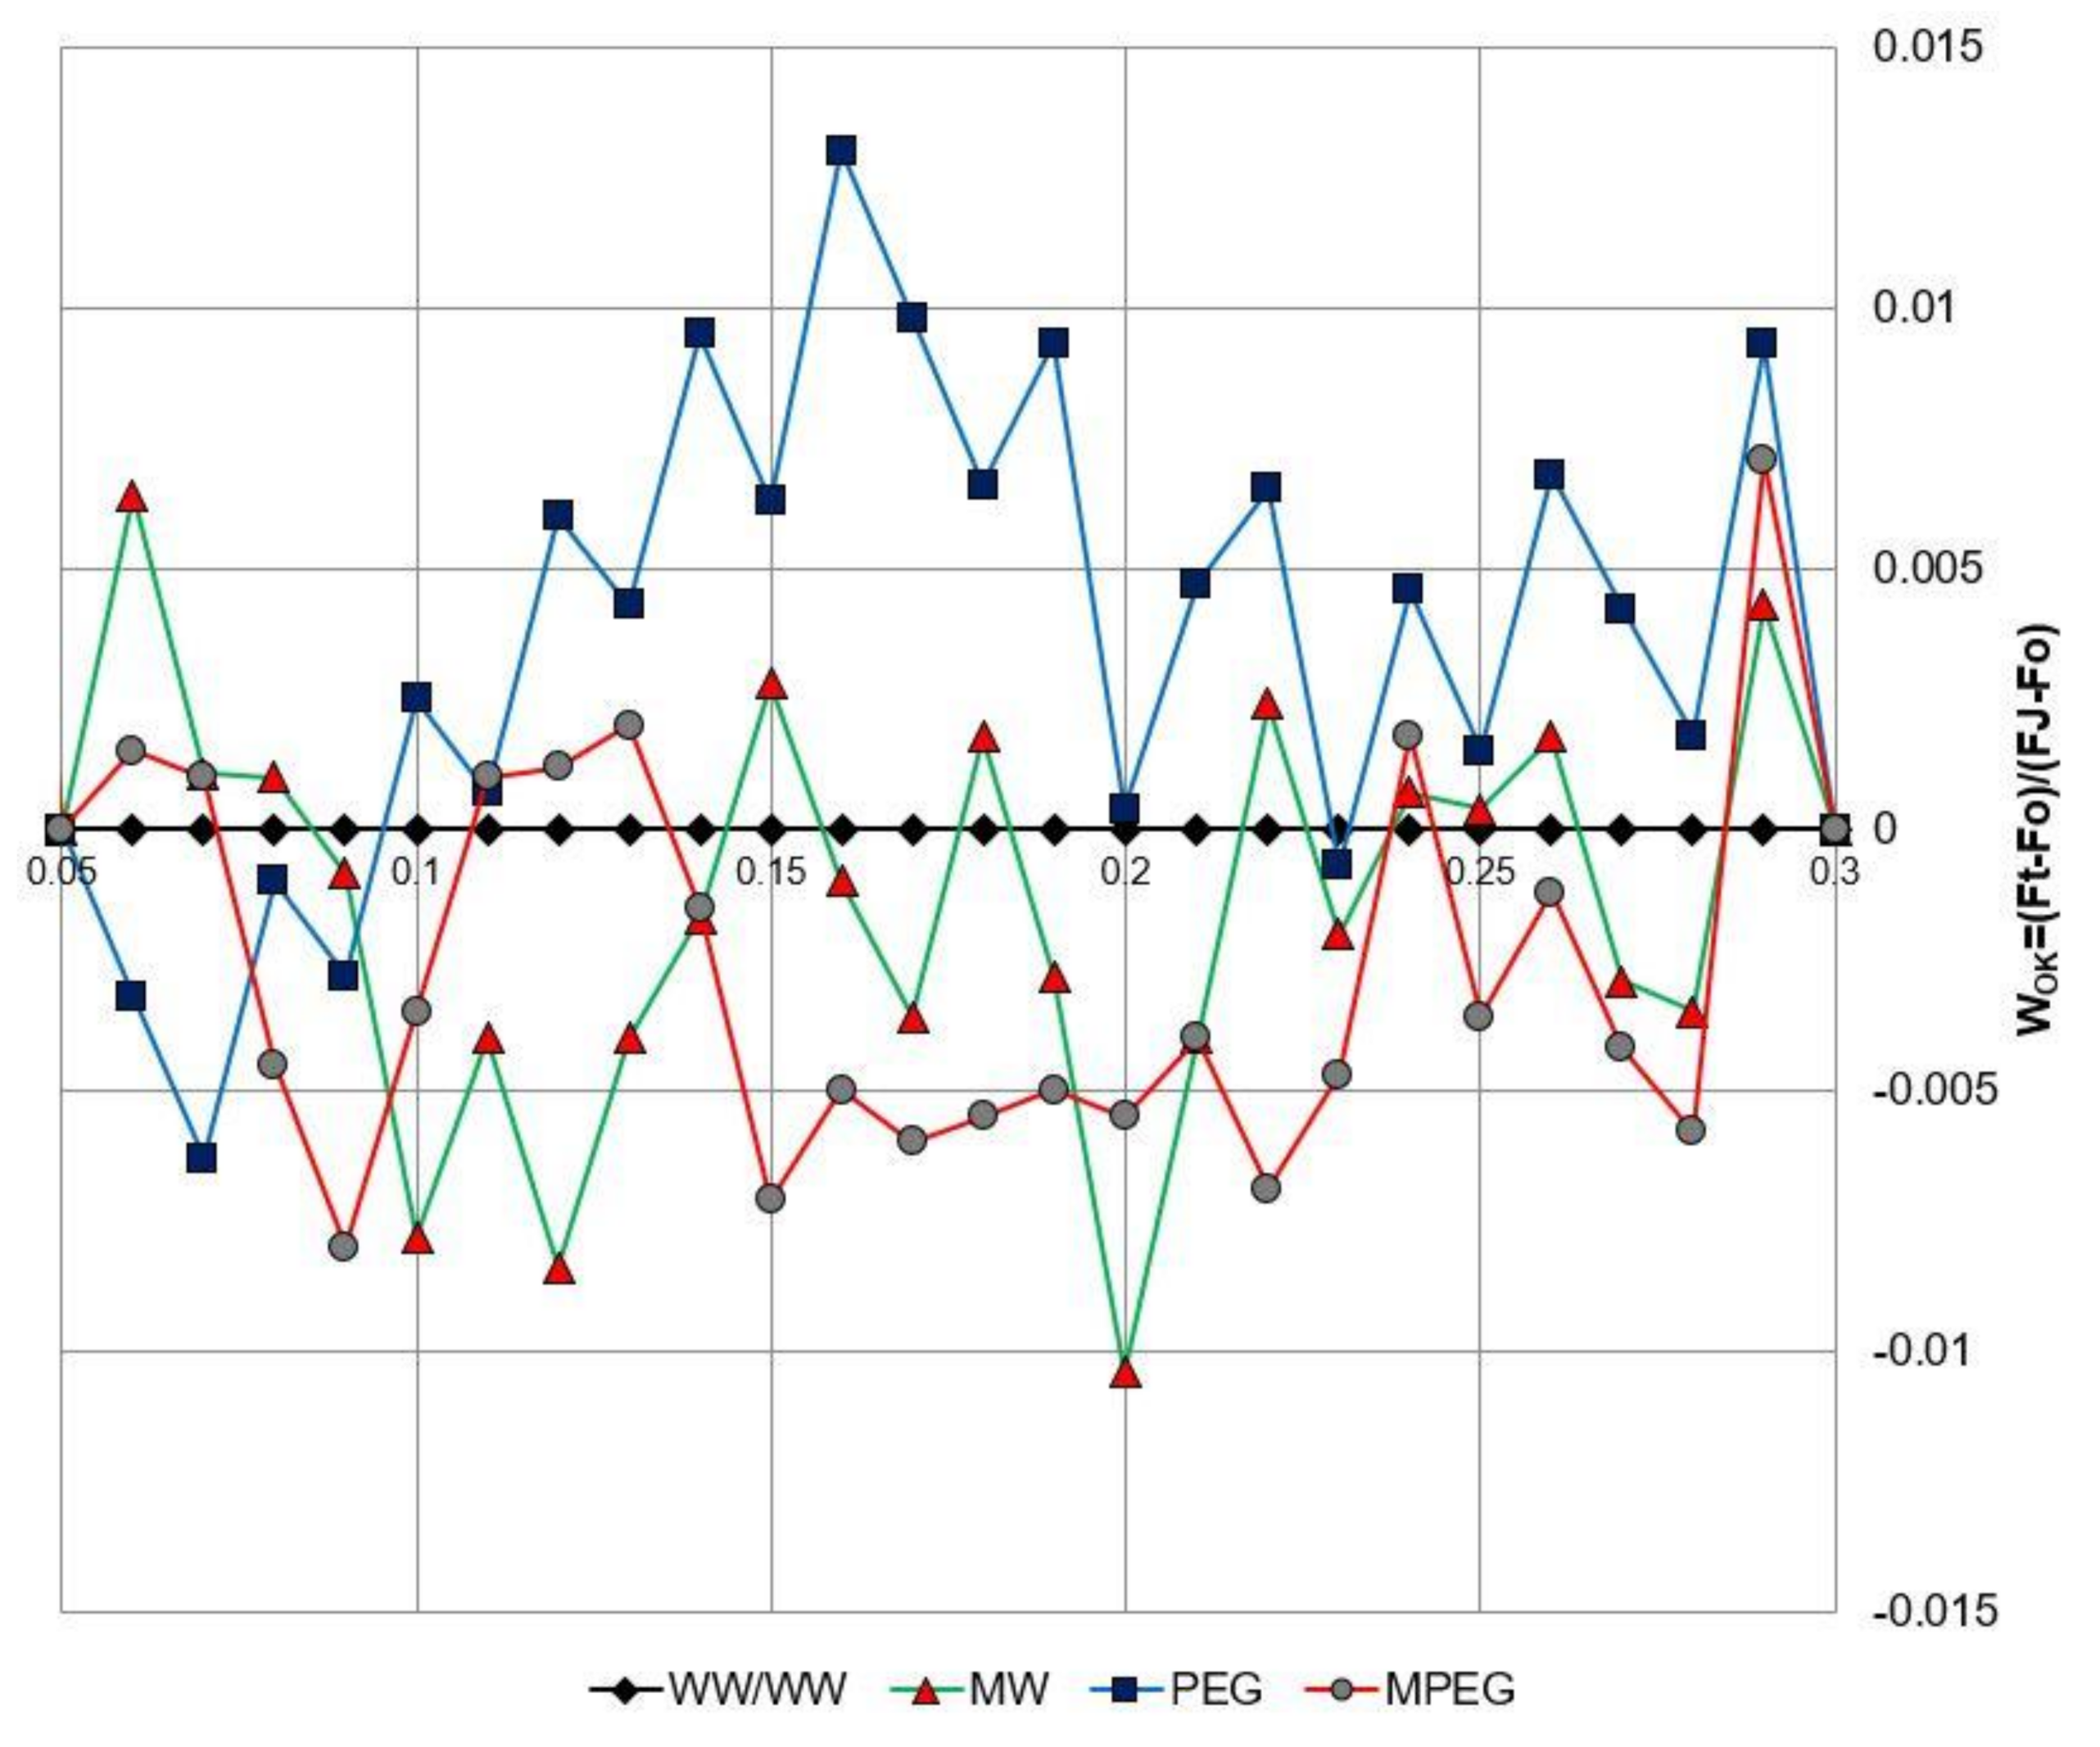
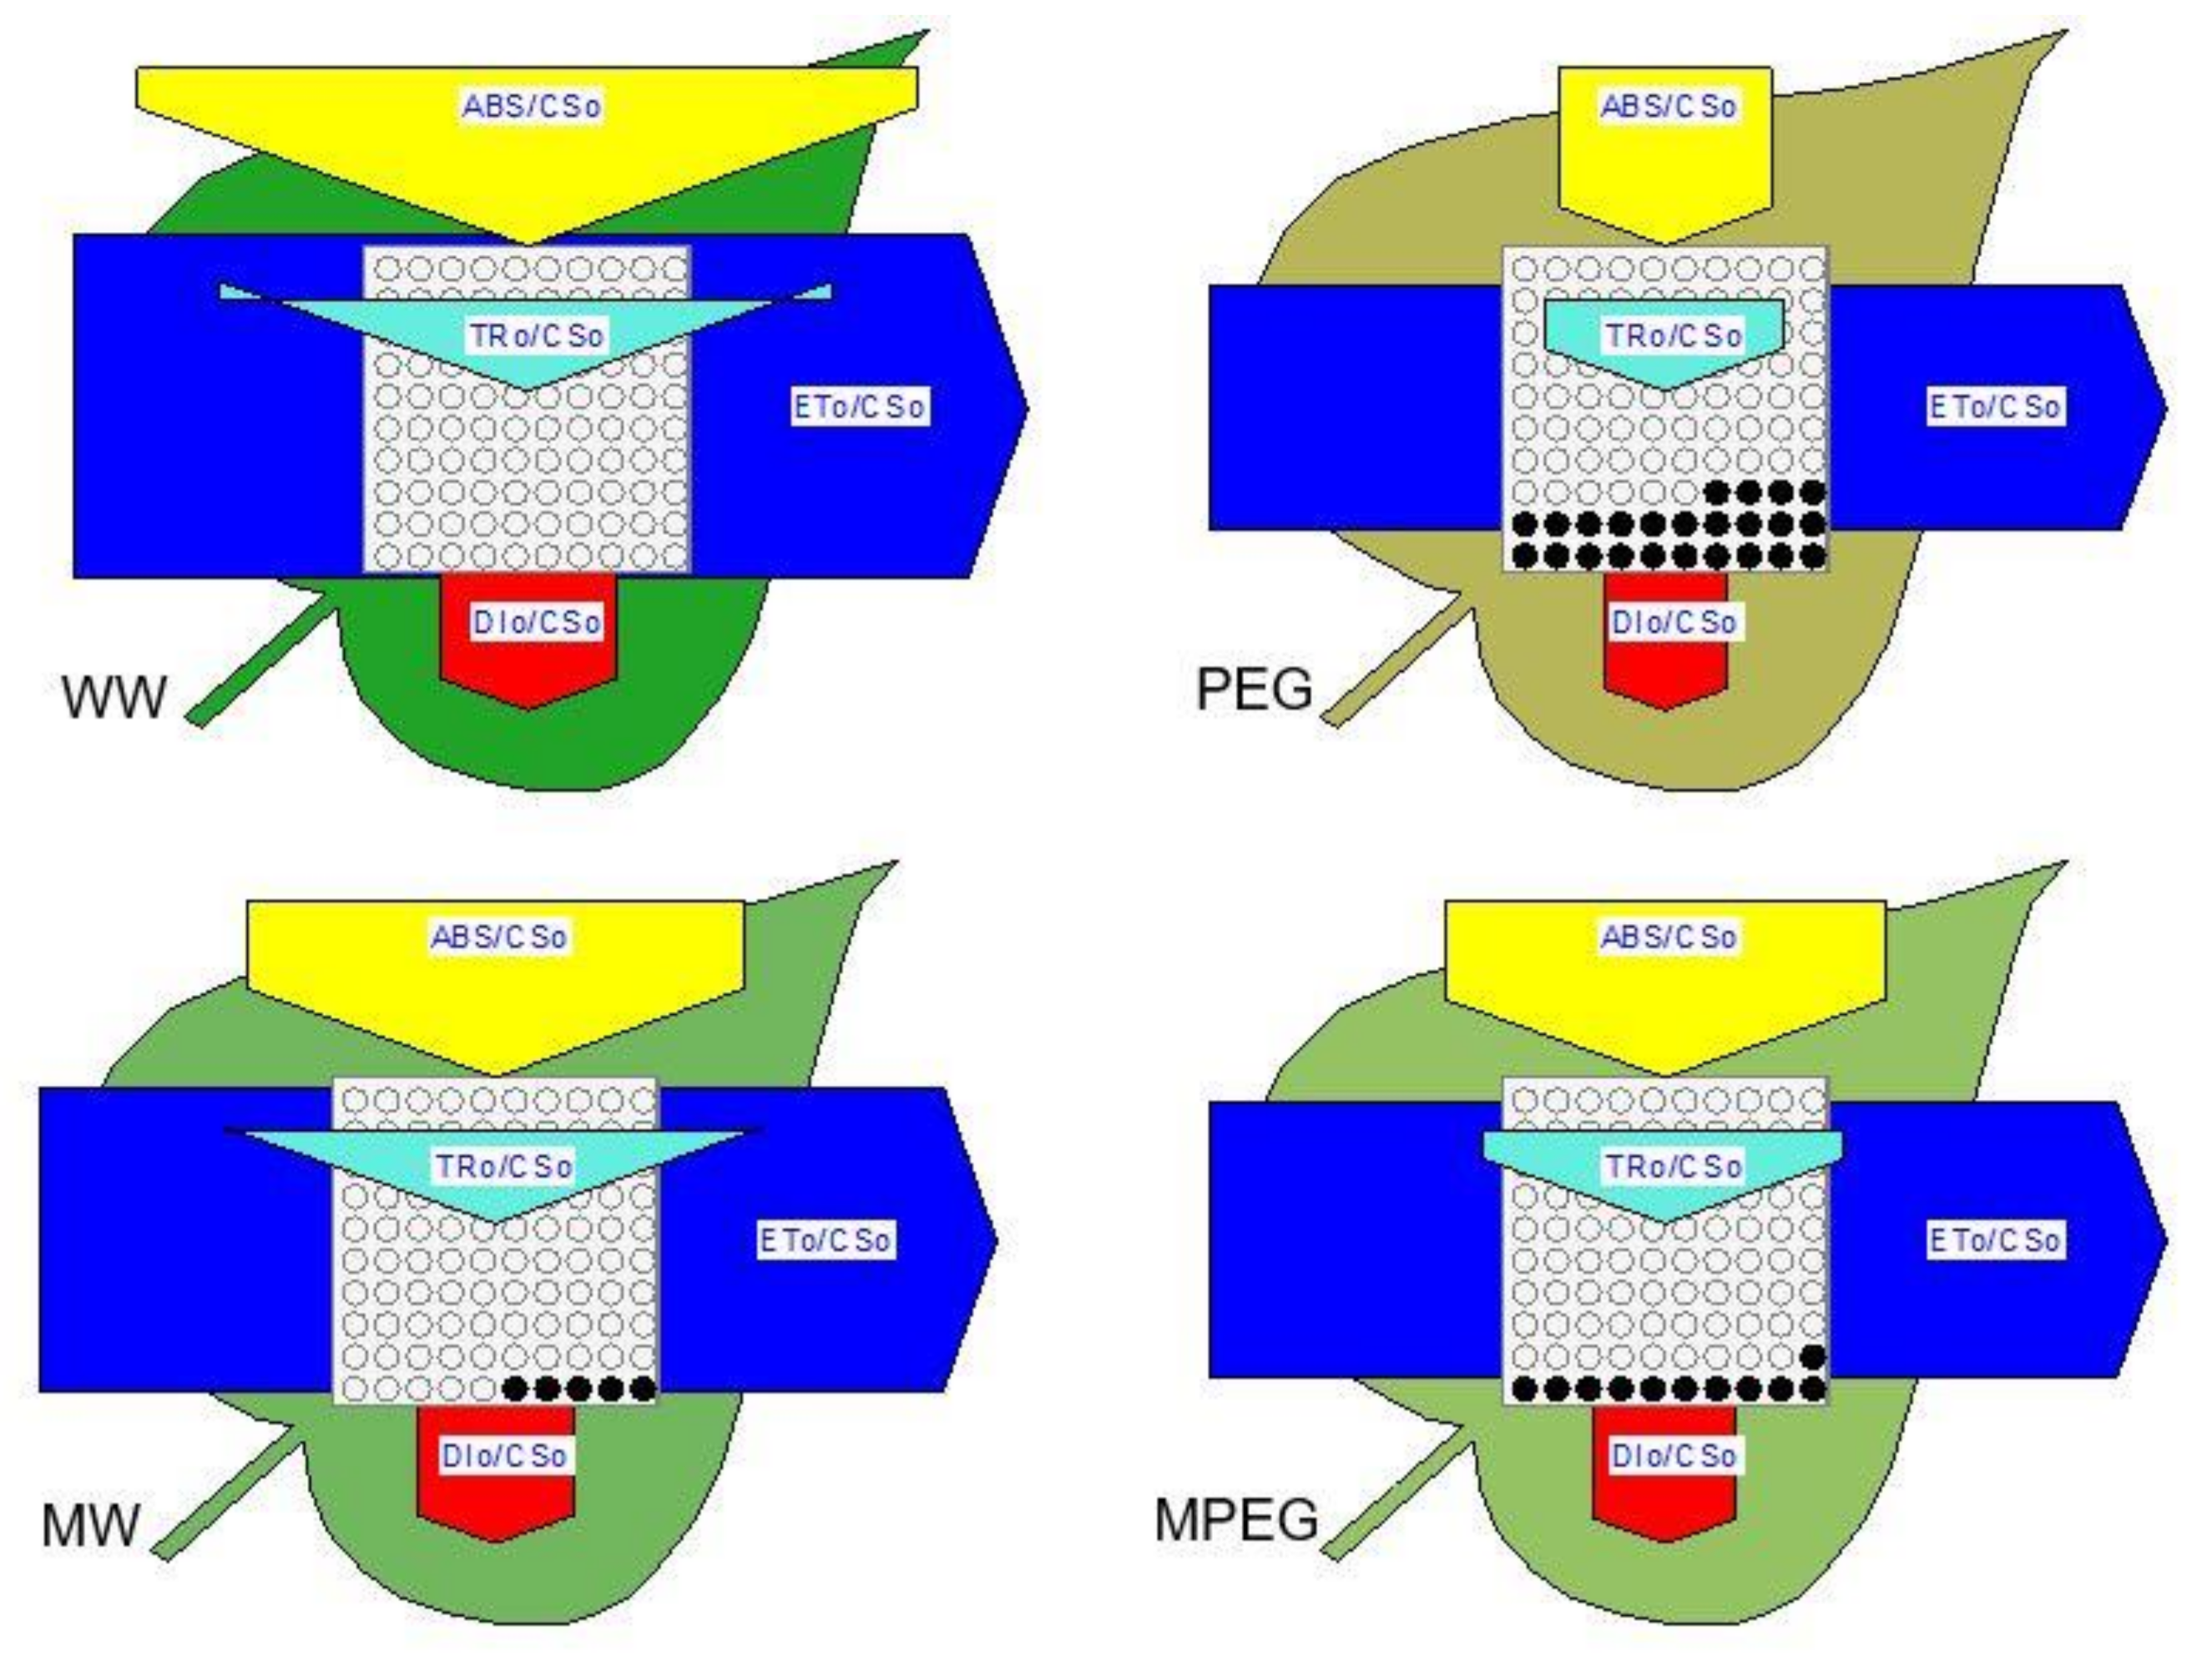
3.5. Melatonin-Induced Changes in the Biophysical Parameters of PSII as Revealed by the JIP-test Equations

The OJIP fluorescence transients were also investigated by the JIP-test to deduce nine structural and functional parameters that specified the photosynthetic performance of the experimental plant samples (Figure 7). The biophysical parameters thus evaluated included the performance indexes (PIABS and PItotal) and quantum yields and efficiencies (ϕPo, ϕEo, ϕRo, ϕDo, δRo, ψEo, and γRc). The values of the parameters calculated were normalized to those of the WW plants. The variations in the performance of the different plant groups illustrate the impact of the presence or absence of the melatonin treatment on the plants. The definitions and formulae of these parameters are shown in Supplementary Table S1. Although the Fv/Fm values of WW, MW, and MPEG plants showed no significant difference, the PEG plants recorded significantly lower (p < 0.05) Fv/Fm values than did the remaining plant groups (Figure 7). The parameter PIABS is used to evaluate the PSII performance, while PItotal reveals the performance up to the reduction of the PSI end-electron acceptors (RE). PIABS and PItotal, as a gauge of plant behavior, showed a significant decrease in the PEG plants, while MPEG plants showed a 3.9-fold higher PIABS and a 5.9-fold higher PItotal compared to that of the PEG plants. In terms of all the quantum yields and efficiencies, a drastic decline in all the parameters (ϕPo, ϕEo, ϕRo, ϕDo, δRo, ψEo, and γRc) was observed in the PEG plants, while the MPEG plants recorded significantly higher values for these parameters compared to the PEG plants (Figure 7).
In terms of phenomenological energy fluxes, the PEG plants showed significantly lower (p < 0.05) values of ABS/CS0, TR0/CS0, ET0/CS0, and DI0/CS0 than did the WW, MW, and MPEG plants (Figure 8). The area of the arrows for each of the parameters, ABS/CS0, TR0/CS0, ET0/CS0, and DI0/CS0 in Figure 8, exhibit the efficiency of light absorption, trapping, electron transport, and dissipation per cross-section of PSII, respectively [20]. ABS/CS0 indicated the number of absorbed photons over the excited cross-section ABS/CS0 was high in WW and MW plants, but a relatively sharper decline in ABS/CS0 was noted in PEG plants compared to that of MPEG plants (Figure 8).
The parameter ET0/CS0, indicating the electron transport in a PSII cross-section and the rate of re-oxidation of QA over a cross-section of active RCs, was remarkably higher in WW, MW, and MPEG plants compared to PEG plants, suggesting inactivated PSII-RCs and a damaged PSII-donor side in PEG plants. Total dissipation of excess energy measured over the cross-section of the sample is expressed as DI0/CS0. Notably, DI0/CS0 thus measured included both active and inactive RCs. A reduced density of active RCs (Figure 8, open circles) and an increase in the density of inactive RCs (Figure 8, dark circles) were most prominent in PEG plants.

4. Discussion

Recent studies have demonstrated the protective roles played by melatonin in different plants under different conditions of stress [9,11,21,22,23,24]. Nevertheless, very few studies have discussed the impact of melatonin on some of the basic photosynthetic parameters under stress conditions [9,10,25]. In this study, we examined the effects of melatonin pretreatment on photosynthetic components by performing comprehensive analyses of the critical photosynthetic parameters derived through the Chl-a fluorescence transient kinetics. Furthermore, the expression analysis of the genes encoding the core proteins of PSII was performed.
The effects of PEG-induced osmotic stress on the morphology of the oat plants with or without melatonin treatment (Figure 2A) appeared to be similar to the plants that were subjected to salinity stress, as described in our recent work [10]. The significant effects of PEG were observed in oat plants regarding their morphological parameters, such as root and shoot lengths and FW. Similarly, the chlorophyll content was seen to significantly drop in the PEG plants. Gao et al. [11] have recently reported similar effects on the growth parameters and chlorophyll content in naked oat seedlings exposed to stress conditions of PEG-induced drought. PEG-induced osmotic stress significantly reduced the plant growth, and interestingly, melatonin pretreatment appeared to have minimized these inhibitory effects in the MPEG plants (Table 2). These findings concurred with those of the earlier studies, where different melatonin concentrations promoted plant growth under a range of stress conditions like salinity and drought in different plant species [11,26,27,28]. The MPEG plant group exhibited a notably increased proline build-up in the leaf tissue compared to that of the PEG plant group, indicating that proline is necessary for stress resistance (Figure 2B). Such an increase in the proline content in the melatonin-treated plants subjected to stress conditions is in agreement with earlier studies [7,10,23]. Besides estimating the proline content in the leaf tissues of the plant groups, qRT-PCR was also performed to analyze the expression of the genes responsible for proline biosynthesis to further investigate the effect of melatonin treatment on proline biosynthesis during PEG-induced osmotic stress, at the molecular level. The P5CS1 expression was reported to be highly activated, while PDH isoforms were moderately stimulated during drought conditions resulting in increased proline levels in the tobacco plants [29]. Another study demonstrated significantly induced levels of the major proline biosynthesis genes, including P5CS1 and PDH1 in Artemisia plants subjected to drought stress [30]. Similar findings were recorded in our study, where the melatonin applied appeared to impede the drastic stimulation of the PDH1 and P5CS1 expressions in the MPEG plants compared to that of the PEG plants (Figure 2C,D).
Drought stress is one of the principal factors that causes dynamic suppression of the photosynthetic process due to stomatal and non-stomatal restrictions [31]. Hence, it is crucial to measure the stomatal conductance in plants to assess the impact of stress on the photosynthetic machinery. In this study, the MPEG plants showed significantly higher stomatal conductance compared to that of the PEG plants, suggesting that melatonin confers a protective effect on photosynthesis under PEG-induced osmotic stress, which permitted the stomata to maintain an efficient rate of passage of the carbon dioxide entry or water vapor exit (Figure 2E). Recently, Sun et al. [32] demonstrated that melatonin together with cold priming raises the rate of photosynthetic and stomatal conductance in wheat plants under conditions of cold stress. Recently, a similar regulation of stomatal conductance has also been reported in oat plants under salinity stress [10]. Comparable to stomatal conductance, another important marker used to assess the abiotic stress tolerance in plants is electrolyte leakage. This is a function of membrane permeability and expresses the damage that occurs to the cellular membranes. A significantly reduced electrolyte leakage was evident in the MPEG plants compared to that of the PEG plants, thus pointing to the melatonin-induced stress resistance in those plants (Figure 2F). The MDA equivalent content indicates the degree of lipid peroxidation in plants, caused mainly by environmental stress [33]. Melatonin application has been reported to reduce lipid peroxidation in cucumber seedlings grown under stress conditions of salinity [34]. Low endogenous melatonin production in rice plants with suppressed activity of the enzymes associated with melatonin biosynthesis caused retarded growth and abiotic stress susceptibility coupled with an increase in the MDA equivalent content [35]. These findings clearly reveal that melatonin promotes plant growth and abiotic stress tolerance, which results in lower levels of MDA being produced. Significantly low levels of MDA equivalent content in MPEG plants compared to those in PEG plants (Figure 2G) support the hypothesis aforementioned and suggests that the melatonin application can regulate the MDA equivalent content under PEG-induced osmotic stress conditions in oat plants.
Abiotic stress factors such as high salinity, drought, and heavy metal toxicity have been shown to induce changes in the expression of the genes encoding PSII, mostly because PSII is one of the components of photosynthesis that bears the brunt of the stress factors [2]. The PsbO expression pattern investigated in two genotypes of forage grasses in response to drought revealed that the PsbO was always expressed at higher levels in the drought-tolerant genotype [4]. Melatonin-treated Glycine max plants were reported to reveal altered expressions of the genes responsible for photosynthesis in response to salinity stress. Apparently, melatonin not only promoted plant growth, but it also inhibited the salt-induced suppression of the genes encoding the PSII proteins, thus further elucidating the protective role played by melatonin in higher plants [26]. PsbA encodes an indispensable component of PSII, the D1 protein, which plays a vital role in restoring the damaged D1 protein under stress [2]. Low accumulation of PsbA transcripts in response to PEG treatment in this study was in line with a previous study that reported a reduced PsbA expression in the lichen Xanthoria parietina under conditions of metal toxicity [36]. In another report, substantially enhanced drought tolerance levels were achieved with the overexpression of maize PsbA in the tobacco plants, indicating its potential in conferring abiotic stress tolerance [37]. The roles played by the other major intrinsic PSII proteins in abiotic stress tolerance are either unclear or have not been studied as yet in detail (reviewed in [38]). Among the PSII core proteins, PsbO is perhaps the most thoroughly investigated PSII component, particularly because of its unique function of splitting water molecules and thus releasing oxygen. However, many studies have suggested that, besides the water-splitting step during the light reactions, PsbO also contributes to photoprotection of PSII [39,40]. Potato plants with downregulated PsbO activity exhibited early tuberization in potato plants along with altered carbohydrate metabolism as well as improved photosynthesis and antioxidant activities under abiotic stresses [3]. Interestingly, this study noted that, barring PsbO, other genes (i.e., PsbA, PsbB, PsbC, and PsbD) showed significant downregulation in the PEG plants compared to the MPEG plants (Figure 3A–E). Similar findings have been reported earlier in response to different stresses in Arabidopsis [41,42], Nicotiana benthamiana [43], and Avena sativa [10]. APX, SOD, and CAT genes encoding major antioxidant enzymes were seen to be upregulated in the MPEG plants compared to the PEG plants (Figure 3F–H), concurring with the findings of the previous studies [44,45]. Recent findings have demonstrated that melatonin application improves photosynthesis, induces efficient antioxidant enzyme activity, and upregulates the expression of the related genes encoding APX, SOD, and CAT in response to cold stress, in wheat [7,32] and barley [46] and cadmium toxicity in wheat [47].
The estimation of continuous modifications of transient Chl-a fluorescence in stressed plant samples is essential because the behavior of the photosynthetic apparatus is vital to the overall physiology and vigor of the plants. In this study, the OJIP transient curves changed in response to PEG, as shown in Figure 4. Furthermore, the PEG-induced alterations in several JIP-parameters were greater than that in the FV/FM (Figure 7 and Figure 8). The FV/FM ratio was observed to show very few differences between the genotypes compared to the OJIP transients, suggesting that the OJIP transients were more sensitive for determining the physiological damage to the photosynthetic machinery [48]. Similar findings were reported in different crops where the FV/FM ratio was not significantly altered, even when the plants were subjected to cold conditions [49,50]. The OJIP transient of the oat plants changed drastically post PEG treatment. After 7 days of PEG-induced osmotic stress, the PEG group plants showed remarkably lowered fluorescence intensity during the O-J, J-I, and I-P phases. This decline indicates the inhibition of ET at the PSII donor site and a decline in the QA pool size [24,51]. Similar drops in the fluorescence slope at the J, I, and P steps in the PEG plants suggests an interrupted ET on the donor or the acceptor side of the PSII.
The Chl-a fluorescence data normalized between the steps O (50 μs) and K (300 μs), and plotted with the difference kinetics ΔWOK, reveal the L-band which is indicative of decreasing the PS II connectivity [52]. In our study, positive L-bands in the PEG plants clearly indicated a significant decrease in the energetic connectivity between the PSII units. On the other hand, negative L-bands in the MPEG plants showed that melatonin application alleviated the PEG-induced drop in the energetic connectivity between the PSII units (Figure 5). The effects of PEG-induced osmotic stress on the donor side of PSII can be examined in the K-band (Figure 6), which illustrates a defective ET on either the donor or the acceptor side of the PSII [52,53]. The K-band has been linked to the OEC getting dissociated and indicates the damage done to the donor side of PSII [54]. The negative K-band in the MPEG plants and positive one in the PEG plants further indicates that the OEC in the PEG plants remains intact despite PEG-induced osmotic stress and oxidative damage.
The parameters PItotal and PIABS have been used in numerous earlier studies to determine the degree of abiotic stresses in various plants [17,51,55]. From our findings, the PEG plants showed significantly lower PI values compared to the MPEG plants, indicating better optimal health of the latter plants under PEG-induced osmotic stress. Similar to the specific energy fluxes, the MPEG plants showed improved quantum yields and efficiencies (Figure 7). Similar increases in ϕPo, ϕEo, ϕRo, ϕDo, δRo, ψEo, and γRc in stress-tolerant plant species have been reported earlier [56,57,58]. The average values of the ABS/CS0, TR0/CS0, ET0/CS0, and DI0/CS0 increased in the PEG plants compared to those of the WW and MW plants (Figure 8). The MPEG plants too showed decreased values compared to the WW and MW; however, these values were significantly higher than those of the PEG plants (Figure 8), indicating that melatonin application maintained the stability of the active PSII units to a great extent under the conditions of PEG-induced osmotic stress. Similar results have been reported in wheat plants exposed to high temperature [20], salt-stressed wheat plants [51], and transgenic Arabidopsis plants expressing the SIP1 aquaporin gene exposed to osmotic stress [24].
In conclusion, our results reveal that melatonin pretreatment exerts a positive impact on the overall physiology of the oat plants subjected to PEG-induced osmotic stress. Melatonin treatment led to altered expression of the genes encoding core PSII proteins and ROS-scavenging enzymes. Based on these findings, we propose that melatonin improves the ROS scavenging activity and overall photosynthetic efficiency under osmotic stress conditions in higher plants.

Supplementary Materials

The following are available online at https://www.mdpi.com/2073-4395/10/10/1520/s1, Table S1: Formulae and glossary of terms used by the JIP-test for the analysis of Chl a fluorescence transient OJIP emitted by dark-adapted photosynthetic samples.

Author Contributions

M.A.G. conceived the study; O.A. and M.A.G. performed the experiments; O.A. and M.A.G. analyzed the data, and M.A.G. wrote the manuscript. Both authors read and approved the manuscript. All authors have read and agreed to the published version of the manuscript.

Funding

This research was funded by UAE University, Centre based grant [31R219].

Acknowledgments

The authors would like to acknowledge the UAE University and Khalifa Centre for Genetic Engineering and Biotechnology (KCGEB) for their financial support and research facilities.

Conflicts of Interest

The authors declare no conflict of interest.

Abbreviations

ABSAbsorbance
APXAscorbate peroxidase
CATCatalase
ETElectron transport
FWFresh weight
GRGlutathione reductase
MDAMalondialdehyde
OECOxygen evolving complex
PDHProline dehydrogenase
PEGPolyethylene glycol
PIPerformance index
PSIPhotosystem I
PSIIPhotosystem II
RCReaction left
ROSReactive oxygen species
SODSuperoxide dismutase
WWWell-watered

References

  1. Dhankher, O.P.; Foyer, C.H. Climate resilient crops for improving global food security and safety. Plant Cell Environ. 2018, 41, 877–884. [Google Scholar] [CrossRef] [PubMed]
  2. Gururani, M.A.; Venkatesh, J.; Tran, L.S.P. Regulation of photosynthesis during abiotic stress-induced photoinhibition. Mol. Plant 2015, 8, 1304–1320. [Google Scholar] [CrossRef] [PubMed] [Green Version]
  3. Gururani, M.A.; Upadhyaya, C.P.; Strasser, R.J.; Yu, J.W.; Park, S.W. Evaluation of abiotic stress tolerance in transgenic potato plants with reduced expression of PSII manganese stabilizing protein. Plant Sci. 2013, 198, 7–16. [Google Scholar] [CrossRef] [PubMed]
  4. Pawłowicz, I.; Kosmala, A.; Rapacz, M. Expression pattern of the psbO gene and its involvement in acclimation of the photosynthetic apparatus during abiotic stresses in Festuca arundinacea and F. pratensis. Acta Physiol. Plant. 2012, 34, 1915–1924. [Google Scholar] [CrossRef] [Green Version]
  5. Arnao, M.B.; Hernández-Ruiz, J. Melatonin as a chemical substance or as phytomelatonin rich-extracts for use as plant protector and/or biostimulant in accordance with EC legislation. Agronomy 2019, 9, 570. [Google Scholar] [CrossRef] [Green Version]
  6. Galano, A.; Tan, D.; Reiter, R. On the free radical scavenging activities of melatonin’s metabolites, AFMK and AMK. J. Pineal Res. 2013, 54, 245–257. [Google Scholar] [CrossRef] [PubMed]
  7. Turk, H.; Erdal, S.; Genisel, M.; Atici, O.; Demir, Y.; Yanmis, D. The regulatory effect of melatonin on physiological, biochemical and molecular parameters in cold-stressed wheat seedlings. Plant Growth Regul. 2014, 74, 139–152. [Google Scholar] [CrossRef]
  8. Weeda, S.; Zhang, N.; Zhao, X.; Ndip, G.; Guo, Y.; Buck, G.A.; Fu, C.; Ren, S. Arabidopsis Transcriptome Analysis Reveals Key Roles of Melatonin in Plant Defense Systems. PloS ONE 2014, 9, e93462. [Google Scholar] [CrossRef] [Green Version]
  9. Li, H.; Chang, J.; Chen, H.; Wang, Z.; Gu, X.; Wei, C. Exogenous Melatonin Confers Salt Stress Tolerance to Watermelon by Improving Photosynthesis and Redox Homeostasis. Front. Plant Sci. 2017, 8, 1–9. [Google Scholar] [CrossRef] [Green Version]
  10. Varghese, N.; Alyammahi, O.; Nasreddine, S.; Alhassani, A.; Gururani, M.A. Melatonin positively influences the photosynthetic machinery and antioxidant system of avena sativa during salinity stress. Plants 2019, 8, 610. [Google Scholar] [CrossRef] [Green Version]
  11. Gao, W.; Zhang, Y.; Feng, Z.; Bai, Q.; He, J.; Wang, Y. Effects of Melatonin on Antioxidant Capacity in Naked Oat Seedlings under Drought Stress. Molecules 2018, 23, 1580. [Google Scholar] [CrossRef] [PubMed] [Green Version]
  12. Gururani, M.A.; Ganesan, M.; Song, I.-J.; Han, Y.; Kim, J.-I.; Lee, H.-Y.; Song, P.-S. Transgenic Turfgrasses Expressing Hyperactive Ser599Ala Phytochrome A Mutant Exhibit Abiotic Stress Tolerance. J. Plant Growth Regul. 2016, 35, 11–21. [Google Scholar] [CrossRef]
  13. Fu, J.; Huang, B. Involvement of antioxidants and lipid peroxidation in the adaptation of two cool-season grasses to localized drought stress. Environ. Exp. Bot. 2001, 45, 105–114. [Google Scholar] [CrossRef]
  14. Strasser, R.J.; Srivastava, A. Govindjee Polyphasic Chlorophyll a fluorescence transient in plant and cyanobacteria. Photochem. Photobiol. 1995, 61, 32–42. [Google Scholar] [CrossRef]
  15. Strasser, R.J. The grouping model of plant photosynthesis: Heterogeneity of photosynthetic units in thylakoids. In Photosynthesis III; Structure and Molecular Organisation of Photosynthetic Apparatus: Balaban, PHL, USA, 1981; pp. 727–737. [Google Scholar]
  16. Gururani, M.A.; Upadhyaya, C.P.; Strasser, R.J.; Woong, Y.J.; Park, S.W. Physiological and biochemical responses of transgenic potato plants with altered expression of PSII manganese stabilizing protein. Plant Physiol. Biochem. 2012, 58, 182–194. [Google Scholar] [CrossRef]
  17. Ghosh, R.; Gururani, M.A.; Ponpandian, L.N.; Mishra, R.C.; Park, S.-C.; Jeong, M.-J.; Bae, H. Expression analysis of sound vibration-regulated genes by touch treatment in arabidopsis. Front. Plant Sci. 2017, 8, 8. [Google Scholar] [CrossRef] [Green Version]
  18. Papageorgiou, G.C. Govindjee Non-Photochemical Quenching and Energy Dissipation in Plants, Algae and Cyanobacteria. In Non-Photochemical Quenching and Energy Dissipation in Plants, Algae and Cyanobacteria; Demmig-Adams, B., Ed.; Springer: Dordrecht, The Netherlands, 2014; pp. 1–44. ISBN 978-94-017-9031-4. [Google Scholar]
  19. Toth, S.Z.; Nagy, V.; Puthur, J.T.; Kovacs, L.; Garab, G. The Physiological Role of Ascorbate as Photosystem II Electron Donor: Protection against Photoinactivation in Heat-Stressed Leaves. Plant Physiol. 2011, 156, 382–392. [Google Scholar] [CrossRef] [Green Version]
  20. Mathur, S.; Jajoo, A.; Mehta, P.; Bharti, S. Analysis of elevated temperature-induced inhibition of photosystem II using chlorophyll a fluorescence induction kinetics in wheat leaves (Triticum aestivum). Plant Biol. (Stuttg.) 2011, 13, 1–6. [Google Scholar] [CrossRef]
  21. Yin, Z.; Lu, J.; Meng, S.; Liu, Y.; Mostafa, I.; Qi, M.; Li, T. Exogenous melatonin improves salt tolerance in tomato by regulating photosynthetic electron flux and the ascorbate–glutathione cycle. J. Plant Interact. 2019, 14, 453–463. [Google Scholar] [CrossRef]
  22. Nawaz, M.; Jiao, Y.; Chen, C.; Shireen, F.; Zheng, Z. Melatonin pretreatment improves vanadium stress tolerance of watermelon seedlings by reducing vanadium concentration in the leaves and regulating melatonin biosynthesis and antioxidant-related gene expression. J. Plant Physiol. 2018, 220, 115–127. [Google Scholar] [CrossRef]
  23. Kabiri, R.; Hatami, A.; Oloumi, H.; Naghizadeh, M.; Nasibi, F.; Tahmasebi, Z. Foliar application of melatonin induces tolerance to drought stress in Moldavian balm plants (Dracocephalum moldavica) through regulating the antioxidant system. Folia Hortic. 2018, 30, 155–167. [Google Scholar] [CrossRef] [Green Version]
  24. Gururani, M.A.; Venkatesh, J.; Ghosh, R.; Strasser, R.J.; Ponpandian, L.N.; Bae, H. Chlorophyll-a fluorescence evaluation of PEG-induced osmotic stress on PSII activity in Arabidopsis plants expressing SIP1. Plant Biosyst. Int. J. Deal. Asp. Plant Biol. 2017, 3504, 1–8. [Google Scholar] [CrossRef]
  25. Lazár, D.; Murch, S.J.; Beilby, M.J.; Al Khazaaly, S. Exogenous melatonin affects photosynthesis in characeae Chara australis. Plant Signal. Behav. 2013, 8, 1–5. [Google Scholar] [CrossRef] [PubMed] [Green Version]
  26. Wei, W.; Li, Q.T.; Chu, Y.N.; Reiter, R.J.; Yu, X.M.; Zhu, D.H.; Zhang, W.K.; Ma, B.; Lin, Q.; Zhang, J.S.; et al. Melatonin enhances plant growth and abiotic stress tolerance in soybean plants. J. Exp. Bot. 2015, 66, 695–707. [Google Scholar] [CrossRef] [Green Version]
  27. Shi, H.; Jiang, C.; Ye, T.; Tan, D.X.; Reiter, R.J.; Zhang, H.; Liu, R.; Chan, Z. Comparative physiological, metabolomic, and transcriptomic analyses reveal mechanisms of improved abiotic stress resistance in bermudagrass [Cynodon dactylon (L). Pers.] by exogenous melatonin. J. Exp. Bot. 2015, 66, 681–694. [Google Scholar] [CrossRef] [Green Version]
  28. Wang, L.Y.; Liu, J.L.; Wang, W.X.; Sun, Y. Exogenous melatonin improves growth and photosynthetic capacity of cucumbers under salinity-induced stress. Photosynthetica 2015, 53, 1–10. [Google Scholar] [CrossRef]
  29. Dobrá, J.; Vanková, R.; Havlová, M.; Burman, A.J.; Libus, J.; Storchová, H. Tobacco leaves and roots differ in the expression of proline metabolism-related genes in the course of drought stress and subsequent recovery. J. Plant Physiol. 2011, 168, 1588–1597. [Google Scholar] [CrossRef]
  30. Soni, P.; Abdin, M.Z. Water deficit-induced oxidative stress affects artemisinin content and expression of proline metabolic genes in Artemisia annua L. FEBS Open Bio 2017, 7, 367–381. [Google Scholar] [CrossRef]
  31. Mutava, R.N.; Prince, S.J.K.; Syed, N.H.; Song, L.; Valliyodan, B.; Chen, W.; Nguyen, H.T. Understanding abiotic stress tolerance mechanisms in soybean: A comparative evaluation of soybean response to drought and flooding stress. Plant Physiol. Biochem. 2015, 86, 109–120. [Google Scholar] [CrossRef]
  32. Sun, L.; Li, X.; Wang, Z.; Sun, Z.; Zhu, X.; Liu, S.; Song, F.; Liu, F.; Wang, Y. Cold priming induced tolerance to subsequent low temperature stress is enhanced by melatonin application during recovery in wheat. Molecules 2018, 23, 1091. [Google Scholar] [CrossRef] [Green Version]
  33. Gill, S.S.; Tuteja, N. Reactive oxygen species and antioxidant machinery in abiotic stress tolerance in crop plants. Plant Physiol. Biochem. 2010, 48, 909–930. [Google Scholar] [CrossRef] [PubMed]
  34. Li, D.; Cao, Y.; Guo, Y. Melatonin promotes seed germination under high salinity by regulating antioxidant systems, ABA and GA 4 interaction in cucumber (Cucumis sativus L.). J. Pineal Res. 2014, 57, 269–279. [Google Scholar]
  35. Byeon, Y.; Back, K. Low melatonin production by suppression of either serotonin N-acetyltransferase or N-acetylserotonin methyltransferase in rice causes seedling growth retardation with yield penalty, abiotic stress susceptibility, and enhanced coleoptile growth under anoxi. J. Pineal Res. 2016, 60, 348–359. [Google Scholar] [CrossRef] [PubMed]
  36. Sen, G.; Eryilmaz, I.E.; Ozakca, D. The effect of aluminium-stress and exogenous spermidine on chlorophyll degradation, glutathione reductase activity and the photosystem II D1 protein gene (psbA) transcript level in lichen Xanthoria parietina. Phytochemistry 2014, 98, 54–59. [Google Scholar] [CrossRef] [PubMed]
  37. Huo, Y.; Wang, M.; Wei, Y.; Xia, Z. Overexpression of the Maize psbA Gene enhances drought tolerance through regulating antioxidant system, photosynthetic capability, and stress defense Gene expression in tobacco. Front. Plant Sci. 2016, 6, 1–10. [Google Scholar] [CrossRef] [PubMed] [Green Version]
  38. Sasi, S.; Venkatesh, J.; Daneshi, R.F.; Gururani, M.A. Photosystem II extrinsic proteins and their putative role in abiotic stress tolerance in higher plants. Plants 2018, 7, 1–15. [Google Scholar] [CrossRef] [PubMed] [Green Version]
  39. Yamamoto, Y.; Aminaka, R.; Yoshioka, M.; Khatoon, M.; Komayama, K.; Takenaka, D.; Yamashita, A.; Nijo, N.; Inagawa, K.; Morita, N.; et al. Quality control of photosystem II: Impact of light and heat stresses. Photosynth. Res. 2008, 98, 589–608. [Google Scholar] [CrossRef] [PubMed]
  40. Bricker, T.M.; Roose, J.L.; Fagerlund, R.D.; Frankel, L.K.; Eaton-rye, J.J. Biochimica et Biophysica Acta the extrinsic proteins of Photosystem II. BBA Bioenerg. 2012, 1817, 121–142. [Google Scholar] [CrossRef] [Green Version]
  41. Yi, X.; Hargett, S.R.; Frankel, L.K.; Bricker, T.M. The effects of simultaneous RNAi suppression of PsbO and PsbP protein expression in photosystem II of Arabidopsis. Photosynth. Res. 2008, 98, 439–448. [Google Scholar] [CrossRef]
  42. Roose, J.L.; Frankel, L.K.; Bricker, T.M. Developmental Defects in Mutants of the PsbP Domain Protein 5 in Arabidopsis thaliana. PLoS ONE 2011, 6, 1–9. [Google Scholar] [CrossRef] [Green Version]
  43. Pérez-Bueno, M.L.; Barón, M.; García-Luque, I. PsbO, PsbP, and PsbQ of photosystem II are encoded by gene families in Nicotiana benthamiana. Structure and functionality of their isoforms. Photosynthetica 2011, 49, 573–580. [Google Scholar] [CrossRef]
  44. Akilan, S.; Halima, T.H.; Sasi, S.; Kappachery, S.; Baniekal-Hiremath, G.; Venkatesh, J.; Gururani, M.A. Evaluation of osmotic stress tolerance in transgenic Arabidopsis plants expressing Solanum tuberosum D200 gene. J. Plant Interact. 2019, 14, 79–86. [Google Scholar] [CrossRef] [Green Version]
  45. Puyang, X.; An, M.; Han, L.; Zhang, X. Protective effect of spermidine on salt stress induced oxidative damage in two Kentucky bluegrass (Poa pratensis L.) cultivars. Ecotoxicol. Environ. Saf. 2015, 117, 96–106. [Google Scholar] [CrossRef] [PubMed]
  46. Li, X.; Tan, D.; Dong, J.; Liu, F. Melatonin enhances cold tolerance in drought—Type deficient mutant barley. J. Pineal Res. 2016, 61, 328–339. [Google Scholar] [CrossRef] [PubMed]
  47. Ni, J.; Wang, Q.; Shah, F.A.; Liu, W.; Wang, D.; Huang, S.; Fu, S.; Wu, L. Exogenous melatonin confers cadmium tolerance by counterbalancing the hydrogen peroxide homeostasis in wheat seedlings. Molecules 2018, 23, 799. [Google Scholar] [CrossRef] [Green Version]
  48. Zushi, K.; Kajiwara, S.; Matsuzoe, N. Chlorophyll a fluorescence OJIP transient as a tool to characterize and evaluate response to heat and chilling stress in tomato leaf and fruit. Sci. Hortic. (Amst.) 2012, 148, 39–46. [Google Scholar] [CrossRef]
  49. Camejo, D.; Nicolás, E.; Torres, W.; Alarcón, J.J. Differential heat-induced changes in the CO2 assimilation rate and electron transport in tomato (Lycopersicon esculentum Mill.). J. Hortic. Sci. Biotechnol. 2010, 85, 137–143. [Google Scholar] [CrossRef]
  50. Chen, L.S.; Cheng, L. The sun-exposed peel of apple fruit has a higher photosynthetic capacity than the shaded peel. Funct. Plant Biol. 2007, 34, 1038–1048. [Google Scholar] [CrossRef]
  51. Mehta, P.; Jajoo, A.; Mathur, S.; Bharti, S. Chlorophyll a fl uorescence study revealing effects of high salt stress on Photosystem II in wheat leaves. Plant Physiol. Biochem. 2010, 48, 16–20. [Google Scholar] [CrossRef]
  52. Jedmowski, C.; Ashoub, A.; Brüggemann, W. Reactions of Egyptian landraces of Hordeum vulgare and Sorghum bicolor to drought stress, evaluated by the OJIP fluorescence transient analysis. Acta Physiol. Plant. 2013, 35, 345–354. [Google Scholar] [CrossRef]
  53. Yusuf, M.A.; Kumar, D.; Rajwanshi, R.; Strasser, R.J.; Tsimilli-Michael, M.; Govindjee; Sarin, N.B. Overexpression of gamma-tocopherol methyl transferase gene in transgenic Brassica juncea plants alleviates abiotic stress: Physiological and chlorophyll a fluorescence measurements. Biochim. Biophys. Acta 2010, 1797, 1428–1438. [Google Scholar] [CrossRef] [PubMed] [Green Version]
  54. Kalaji, H.M.; Jajoo, A.; Oukarroum, A.; Brestic, M.; Zivcak, M.; Samborska, I.A.; Cetner, M.D.; Łukasik, I.; Goltsev, V.; Ladle, R.J. Chlorophyll a fluorescence as a tool to monitor physiological status of plants under abiotic stress conditions. Acta Physiol. Plant. 2016, 38, 38. [Google Scholar] [CrossRef] [Green Version]
  55. Oukarroum, A.; El Madidi, S.; Strasser, R.J. Exogenous glycine betaine and proline play a protective role in heat-stressed barley leaves (Hordeum vulgare L.): A chlorophyll a fluorescence study. Plant Biosyst. 2012, 146, 1037–1043. [Google Scholar] [CrossRef]
  56. Kalaji, H.M.; Oukarroum, A.; Alexandrov, V.; Kouzmanova, M.; Brestic, M.; Zivcak, M.; Samborska, I.A.; Cetner, M.D.; Allakhverdiev, S.I.; Goltsev, V. Identification of nutrient deficiency in maize and tomato plants by invivo chlorophyll a fluorescence measurements. Plant Physiol. Biochem. 2014, 81, 16–25. [Google Scholar] [CrossRef] [PubMed]
  57. Yusuf, M.; Hasan, S.A.; Ali, B.; Hayat, S.; Fariduddin, Q.; Ahmad, A. Effect of salicylic acid on salinity-induced changes in Brassica juncea. J. Integr. Plant Biol. 2008, 50, 1096–1102. [Google Scholar] [CrossRef] [PubMed]
  58. Vuletic, V.; Spanic, V. Characterization of photosynthetic performance during natural leaf senescence in winter wheat: Multivariate analysis as a tool for phenotypic characterization Characterization of photosynthetic performance during natural leaf senescence in winter wheat. Photosynthetica 2019, 57, 116–128. [Google Scholar]
Figure 1. Schematic illustration of the photosynthetic events analyzed by the JIP-test. Dark arrows indicate the flow of the sequential energy fluxes from the absorbance (ABS1, ABS2) of the photons by the photosystem II (PSII) antenna molecules followed by the trapping flux (TR), photosynthetic electron transport flux (ET), and reduction of the end electron acceptors at the PS I electron acceptor side (RE). Formulae and glossary of terms used by the JIP-test are listed in Supplementary Table S1. DI, dissipation; Fdx, ferrodoxin; NADP, nicotinamide adenine dinucleotide phosphate; PSU, photosynthetic unit; QA, quinone-A; QB, quinone-B.
Agronomy 10 01520 g001
Figure 2. (A) Effect of pretreatment with melatonin on the morphological differences between the four treatments in oat plants. (B) Proline content, (C) PDH1 gene expression, (D) P5CS1 gene expression, (E) Stomatal conductance, (F) Electrolyte leakage, and (G) MDA equivalent content estimation. WW, well-watered; PEG, PEG-treated oat plants; MW, Melatonin-treated well-watered oat plants; MPEG, Melatonin-treated oat plants subjected to PEG stress. Different letters in each row indicate significant differences (p ≤ 0.05) between the treatments after performing Tukey’s test (n = 3).
Agronomy 10 01520 g002
Figure 3. Real-time mRNA expression of the genes encoding (A) PsbA, (B) PsbB, (C) PsbC, (D) PsbD, (E) PsbO, (F) ascorbate peroxidase (APx), (G) superoxide dismutase (SOD), and (H) catalase (CAT). Fold expression values are normalized to those of the GAPDH control. WW, well-watered; PEG, PEG-treated oat plants; MW, Melatonin-treated, well-watered oat plants; MPEG, Melatonin-treated oat plants subjected to PEG stress. Different letters in each row indicate significant differences (p ≤ 0.05) in the relative gene expression between the treatments after performing the Tukey test (n = 6).
Agronomy 10 01520 g003
Figure 4. Fast Chlorophyll-a fluorescence kinetics OJIP of the dark-adapted leaves of the oat plants. Transient polyphasic curves of each line represent the means of 15 measurements (5 measurements per plant taken from 3 different plants). WW, well-watered; PEG, PEG-treated oat plants; MW, melatonin-treated, well-watered oat plants; MPEG, Melatonin-treated oat plants subjected to PEG stress.
Agronomy 10 01520 g004
Figure 5. The L-band: Relative variable fluorescence WOK = (Ft − FO)/(FK − FO) and differences between the WW, MW, PEG, and MPEG plants under normal and PEG-induced osmotic stress conditions. Curves represent the difference kinetics, ΔWOK of the plants under normal and PEG-induced osmotic stress conditions on a logarithmic scale.
Agronomy 10 01520 g005
Figure 6. The K-band: Double normalization of the data for the WW, MW, PEG, and MPEG plants under normal and PEG-induced osmotic stress conditions at F0 and FJ, WOJ = (Ft–F0)/(FJ–F0). The curves represent the difference kinetics, ΔWOJ of the plants under normal and PEG-induced osmotic stress conditions on a logarithmic scale.
Agronomy 10 01520 g006
Figure 7. Effect of melatonin application on oat plants under PEG-induced osmotic stress analyzed by JIP-test parameters. The details of each parameter are given in Supplementary Table S1. Values are the mean ± SE of three independent assays of four replicates in each treatment. Different letters in each row indicate significant differences (p ≤ 0.05) between treatments; Tukey’s test (n = 9). WW, well-watered oat plants (control); PEG, oat plants exposed to 20% PEG for 7 days; MW, oat plants exposed to melatonin for 7 days then watered normally for 10 days; MPEG, plants treated with melatonin for 7 days then exposed to 20% PEG for 10 days.
Agronomy 10 01520 g007
Figure 8. Energy pipeline leaf model of phenomenological fluxes (per cross-section, CSo) in WW, MW, PEG, and MPEG plants under normal and PEG-induced osmotic stress conditions. The details of each parameter are given in Supplementary Table S1.
Agronomy 10 01520 g008
Table 1. Primers used in qPCR for amplifying 11 Avena sativa genes.
No.Primer NameSequence 5′ to 3′
1As-PsbA-F TCG CTT CTG CAA CTG GAT AAC
As-PsbA-R GCA GCG ATG AAG GCG ATA ATA
2As-PsbD-F GCC CTT GGT AGA GTT CCT AAA G
As-PsbD-R CGA AAT AAG CGC AAG GAA AGA G
3As-PsbB-F GCG GGT ACG TTG GGT ATA TTA G
As-PsbB-R CAG CAG CGA TAC TAC TGG AAA G
4As-PsbC-F AAC GGT TTG GAC TTG AGT AGG
As-PsbC-R CTA CGC CAC CCA CAG AAT TTA
5As-PsbO-F AGA GAG GCT CGG TGA AAT AGA
As-PsbO-R CCA ATC CCA GGG AAC AGT AAA G
6AsGAPDH-FGGTGGTGCCAAGAAGGTTAT
AsGAPDH-RGGAGACAATGGTGATGTCAGAG
7As-P5Cs1-FTGTCCTCTGGGTGTTCTCTTGAT
As-P5Cs1-RCGAATGGCTAAAGACGCAATC
8As-PDH1-FCCCCGTGGAGCACATCAT
As-PDH1-RAAGGTTGAAGCAGAGAGCAATCC
9As-CAT1-FCAGGCTGGCGAGAGATTCC
As-CAT1-RAGCATCCGTGAGTGCATCAA
10As-APX-FGCTCCGTGAAGTAAGTGTTATCAAAC
As-APX-RCCTGGGAAGGTGCCACAA
11As-SOD-FCACAAGCACTTCACAGGAACAGT
As-SOD-RTGCCACTCTGAACATTTCATCAC
Table 2. Impact of melatonin application on the growth parameters and chlorophyll content of oat plants exposed to PEG-induced osmotic stress. WW, well-watered oat plants (control); PEG, oat plants exposed to 20% PEG for 7 days; MW, oat plants exposed to melatonin for 7 days then watered normally for 10 days; MPEG, plants treated with melatonin for 7 days then exposed to 20% PEG for 10 days. Values are the mean ± SE of three independent assays of four replicates in each treatment. Different letters in each row indicate significant differences (p ≤ 0.05) between treatments; Tukey’s test (n = 5).
WWPEGMWMPEG
Root length (cm)10.84 ± 1 a5.4 ± 0.3 b7.4 ± 0.5 c6.86 ± 0.4 d
Shoot length (cm)20.36 ± 1.3 a9.6 ± 0.5 b16.4 ± 0.9 c15.08 ± 0.3 d
F.W. (g)0.55 ± 0.04 a0.17 ± 0.02 b0.37 ± 0.03 c0.33 ± 0.09 c
Chl-A (mg/g dwb)5.68 ± 0.2 a2.15 ± 0.2 b4.69 ± 0.2 c4.51 ± 0.1 c
Chl-B (mg/g dwb)6.36 ± 0.5 a3.17 ± 0.7 b5.09 ± 0.7 c4.49 ± 0.9 d
Total Chl (mg/g dwb)12.05 ± 0.5 a5.32 ± 0.5 b9.78 ± 0.8 c9.01 ± 1.0 c

