Article

Jerusalem Artichoke: Quality Response to Potassium Fertilization and Irrigation in Poland

by
Bożena Bogucka
* and
Krzysztof Jankowski
Department of Agrotechnology, Agricultural Production Management and Agribusiness, University of Warmia and Mazury in Olsztyn, Oczapowskiego 8, 10-719 Olsztyn, Poland
*
Author to whom correspondence should be addressed.
Agronomy 2020, 10(10), 1518; https://doi.org/10.3390/agronomy10101518
Submission received: 27 August 2020 / Revised: 17 September 2020 / Accepted: 26 September 2020 / Published: 6 October 2020
(This article belongs to the Special Issue Optimization of Water Usage and Crop Yield Using Precision Irrigation)

Abstract

:
The aim of this study was to determine the effects of soil potassium fertilization (150, 250 and 350 kg K2O ha−1) and irrigation on the tuber quality (content of ά-tocopherol, β-carotene, essential and endogenous amino acids) of three Jerusalem artichoke (Helianthus tuberosus L.) cultivars (Topstar, Violette de Rennes, Waldspindel). Jerusalem artichokes were grown during a field experiment in the Agricultural Experiment Station in Tomaszkowo (53°42′ N, 20°26′ E, north-eastern Poland). The content of ά-tocopherol and β-carotene was determined at 1.60–2.65 and 0.75–1.00 mg kg−1 DM, respectively, in all Jerusalem artichoke cultivars produced in north-eastern Poland. High rates of potassium fertilizer (250 and 350 kg K ha−1) increased the content of ά-tocopherol in tubers by 47% and 66% on average, respectively. The stimulatory effects of high potassium rates on the content of ά-tocopherol (2.5-fold increase) were observed only in response to irrigation. High rates of potassium fertilizer induced a particularly high increase (3.2-fold) in ά-tocopherol concentrations in Jerusalem artichokes cv. Waldspindel. Irrigation increased ά-tocopherol levels (by 40%) and decreased the concentrations of β-carotene (by 25%) and most essential and endogenous amino acids (isoleucine, leucine, lysine, phenylalanine, valine, alanine, glycine, histidine, serine, threonine). The Topstar cultivar accumulated the highest quantities of essential and endogenous amino acids. Leucine, methionine + cysteine were the limiting amino acids in Jerusalem artichoke tubers. The analyzed tubers were characterized by very high nutritional quality of dietary protein (Essential Amino-Acid Index, 66–78).

1. Introduction

Jerusalem artichoke (Helianthus tuberosus L., Asteraceae) originated in North America where it was cultivated by the native population [1,2]. The species is presently grown in Europe and Asia as a valuable source of lignocellulosic biomass for the energy sector [3,4,5,6,7,8,9]. Jerusalem artichoke is a crop species that most effectively converts solar energy to biomass in both quantitative and qualitative terms [10,11,12,13,14]. Processed biomass is a valuable resource for the production of biofuels [1,3,4,15,16]. Immature aerial parts of H. tuberosus are used in biogas production, whereas straw is processed into solid fuels (pellets, briquettes), and tubers are a high-yielding resource in the production of bioethanol or substrate/cosubstrate in the methane fermentation process [16,17,18]. In the temperate climate of Poland, tuber and straw yields can reach 14–30 and 20–50 Mg ha−1 dry matter (DM), respectively [13]. The amount of energy accumulated in the harvested biomass (tubers, straw) ranges from 142–281 [4] to 348 GJ ha−1 [19]. However, high levels of genetic/phenotypic variation in H. tuberosus populations lead to considerable differences in yield, even in relatively similar agricultural production systems in Europe [13,20]. Jerusalem artichoke has low agronomic requirements [1,16], it is resistant to a wide range of biotic and abiotic stressors [1,21,22,23], and prevents soil erosion [17]. The species easily adapts to diverse environments [8], therefore it can be effectively grown for energy production on marginal land [4]. Jerusalem artichoke is also a natural source of: (i) inulin, (ii) oligofructose, and (iii) fructose [24,25,26], compounds with nutritional and functional attributes (food and feed) that are particularly beneficial to individuals with type 2 diabetes, obesity and cardiovascular disorders [25,27,28]. Tubers are abundant in protein, polyphenols and vitamins [26,29]. These qualities make Jerusalem artichoke biomass particularly suitable for biorefining and the development of the bioeconomy [6]. In biorefineries, organic chemical compounds and lignocellulosic materials are recovered, processed and used in the production of biofuels, bioproducts and bioenergy. Jerusalem artichoke biomass is ideally suited for these industrial applications [23].
Jerusalem artichoke tubers can survive (without loss) in frozen soils for several months because they are abundant in inulin. Overwintering success is compromised only in areas where tubers become dehydrated [21]. The species has minimal soil and fertilizer requirements [21,28,30]. It is susceptible to numerous fungal pathogens (Sclerotinia sclerotiorum (Lib.) de Bary, Fusarium acuminatum Ellis & Everh, Botrytis cinerea Pers.) which colonize mainly tubers. Pests of economic importance do not exert pressure on Jerusalem artichoke plantations [23].
The biological value of Jerusalem artichoke tubers is determined by the genetic characteristics of cultivars and the applied production technology [28,30,31,32,33,34]. Fertilization, in particular potassium fertilization, is an agricultural treatment that exerts the greatest impact on the biological value of tubers. Potassium enhances plant growth, development and tuber yields [35], and it plays an important role in the transport of photosynthesis products from leaves and their accumulation in tubers [36,37]. Agricultural crops are increasingly often irrigated due to a higher risk of drought, including in the temperate climate [38,39,40]. Denorpy [17], Monti et al. [24] and Gao et al. [34] demonstrated that H. tuberosus is sensitive to water stress. Jerusalem artichoke thrives in regions with high levels of precipitation, and irrigation exerts particularly beneficial effects during tuber formation [34]. The aim of this study was to determine the effects of soil potassium fertilization and irrigation on the tuber quality (measured as content of ά-tocopherol, β-carotene, amino acids) of three Jerusalem artichoke cultivars representing different maturity groups.

2. Materials and Methods

2.1. Field Experiment

Jerusalem artichoke (Helianthus tuberosus L.) was grown in a field experiment in the Agricultural Experiment Station in Tomaszkowo (53°42′ N, 20°26′ E, NE Poland) in 2018. The experiment had a three-factorial split-split-plot design with three replications. The experimental variables were: (i) cultivar: Topstar (an early edible cultivar with yellow-brown tubers), Violette de Rennes (a mid-late edible cultivar with red tubers), Waldspindel (a mid-late cultivar with red tubers, used in herbal and distilling industries); (ii) soil potassium fertilization-potassium sulfate (kg K2O ha−1): 150, 250, 350; (iii) irrigation: with and without irrigation.
The studied cultivars had been obtained from an organic farm (Die Topinambur Manufaktur, Heimenkirch, Bavaria, Germany). Tubers were planted in mid-April to a depth of 6–8 cm, with 75 × 30 cm spacing. Before planting, potassium fertilizer was applied in the form of potassium sulfate (50%), 80 kg N ha−1 (urea, 46%), 70 kg P2O5 ha−1 (enriched superphosphate, 40%), and 90 CaO kg ha−1 (ground dolomite, 52% CaO, 37% MgCO3, 48% CaCO3), according to the experimental design. Organic fertilizer was not applied.
Soil moisture content was controlled from the beginning of tuber formation, during the growth of aerial plant parts, until leaf ageing and the translocation of sugars to tubers (from mid-June to mid-October). The optimal soil moisture content was set at 14.3–16.5%, i.e., 65–75% of field water capacity at a depth of 30 cm. Measurements were conducted twice a week. The crops were irrigated every 5–7 days at 20 dm3 m−2 when field water capacity decreased below 60% (≤13.2% soil moisture content). Irrigation treatments for Jerusalem artichoke were developed based on the irrigation regime for late potato cultivars (Solanum tuberosum L.) and field water capacity for different soil types [40]. Soil moisture content was measured with the SM 150-KIT probe (Geomor-Technik sp. z o. o., Szczecin, Poland). Plots were irrigated 11 times during the growing season of H. tuberosus (13 and 19 June; 3 and 9 July; 10 and 23 August; 3, 11, 20 and 28 September; 6 October) in the total amount of 220 mm of water.
The experiment was established on Haplic Luvisol loamy sand [41]. Each experimental plot had an area of 2.7 m2. Oat (Avena sativa L.) was the preceding crop. Composite soil samples were collected from each plot to a depth of 20 cm to determine the chemical properties of soil. Soil pH was determined at 5.4 with a digital pH meter, and soil nutrient levels were determined at 74 mg P kg−1 (Egner-Riehm method), 145 mg K kg−1 (Egner-Riehm method) and 69 mg Mg kg−1 (AAS) [42]. Tubers were hilled once after planting. Jerusalem artichoke was harvested at the beginning of November.

2.2. Determination of Tocopherol and β-Carotene Content

The content of β-carotene and tocopherols ((±)-ά-tocopherol, β-tocopherol, (+)-γ-tocopherol, (+)-δ-tocopherol) was determined under limited exposure to sunlight. Samples of freeze-dried H. tuberosus tubers (Alpha 1-4 LS Cbasic laboratory freeze dryer, CHRIST GmbH, Osterode am Harz Germany) were ground in a laboratory mill (Knife Mill GM 300, Retsch GmbH, Haan, Germany). Ground samples of 5 g were combined with 30 cm3 of 20% (w/v) ascorbic acid (aqueous solution) (analytical grade, Sigma-Aldrich Chemie GmbH, Munich, Germany) and extracted in 100 cm3 of naphthyl ether/ethanol mixture (v/v 1:1) (analytical grade, Sigma-Aldrich Chemie GmbH) at room temperature, in dark, for 18 h. The samples were saponified with 50% (w/v) aqueous KOH solution (analytical grade, Sigma-Aldrich Chemie GmbH) at room temperature, in dark, for 6–18 h. The samples were extracted in 4 × 50 cm3 of naphthyl ether (40/60, analytical grade, Sigma-Aldrich Chemie GmbH). The extracts were combined in the separator and rinsed with 10% (w/v) aqueous NaCl solution (analytical grade, Avantor Performance Materials Poland SA, Gliwice, Poland) and deionized water. The eluate was dehydrated with anhydrous sodium sulfate (analytical grade, Sigma-Aldrich Chemie GmbH) and evaporated to dryness in a rotary evaporator at 40 °C (IKA RU 10 digital, Janke & Kunkel IKA–Labortechnik, Baden-Württemberg, Germany). The remainder was dissolved in 5 cm3 of anhydrous n-hexane (analytical grade, Avantor Performance Materials Poland SA), the extract was passed through a PTFE syringe filter with 0.22 µm pore size (30-SF-02, Chromacol Ltd., Hertfordshire, UK) and analyzed in a HPLC system (Shimadzu, Kyoto, Japan).
Tocopherol concentrations were determined using a Nucleosil C18 250 × 4.6 mm 5 μm column (Sigma-Aldrich Chemie GmbH) under the following conditions: mobile phase–methanol:H2O (95:5 v/v) (HPLC grade, Sigma-Aldrich Chemie GmbH), flow rate–1 cm3 min−1, detector: RF Ex 293 and Em 326, sample loop–20 µL. The results were calibrated based on external standards for (±)-α-tocopherol (DL-all-rac α-tocopherol), β-tocopherol, (+)-γ-tocopherol and (+)-δ-tocopherol (Sigma-Aldrich Chemie GmbH). A standard mixture composed of 5 μg of α-T cm−3, 2 μg of β-T cm−3, 2 μg of γ-T cm−3 and 2 μg of δ-T cm−3 in anhydrous ethanol (analytical grade, Avantor Performance Materials Poland SA) was prepared. The peak areas of the analyte and the applied standards were compared [43].
The concentration of β-carotene was determined with the use of the Gemini® 5 μm C18 110 A 250 × 4 mm column (Phenomenex Inc., Torrance, CA, USA) under the following conditions: mobile phase–methanol: tetrahydrofuran (95:5 v/v) (HPLC grade, Sigma-Aldrich Chemie GmbH), flow rate–1 cm3 min−1, detector: UV-vis 450 nm, sample loop–20 µl. Synthetic β-Carotene Type I external standard was applied (Sigma-Aldrich Chemie GmbH) [44,45]. Vitamin A activity was determined in retinol equivalents (RE), where 1 RE = 6 μg of β-carotene [46].

2.3. Determination of Amino Acid Content and the Nutritional Value of Protein

The content of amino acids, excluding tryptophan, was determined in dried tuber samples in the AAA-400 amino acid analyzer (INGOS s.r.o, Prague, Czech Republic). The samples were hydrolyzed in 6 M HCl for 24 h at a temperature of 110 °C. The hydrolysate was cooled, filtered, rinsed and evaporated in a water bath, and dry residue was dissolved in a buffer with a pH of 2.2. The obtained specimens were analyzed in the ninhydrin test. The applied buffers had a pH of 2.6, 3.0, 4.25 and 7.9. Ninhydrin solution was buffered at pH 5.5. The column with a length of 370 mm was packed with ion-exchange resin (Ostion ANB, INGOS s.r.o.). Column temperature was 58–74 °C, and reactor temperature was 120 °C. The concentrations of sulfur-containing amino acids (methionine and cysteine) were determined by hydrolysis with a mixture of formic acid and hydrogen peroxide (9:1) at a temperature of 110 °C for 23 h. Cooled samples were handled in accordance with the acid hydrolysis protocol. The applied buffers had a pH of 2.6 and 3.0. Column temperature was 60 °C, and reactor temperature was 120 °C. Tryptophan content was determined based on Polish Standard PN-77/R-64820 [43]. The applied analytical method involves the quantification of synthetic methionine, but not the hydroxy analogue of methionine.
The nutritional value of protein was determined with the use of the limiting amino acid index [47] (Equation (1)) and the essential amino acid index (EAAI) [48]:
CS = a b a w   ×   100
where CS – chemical score, ab – content of essential amino acid and aw – content of essential amino acid in the reference protein.

2.4. Statistical Analysis

Data were processed statistically by one-way analysis of variance (ANOVA) in the Statistica 13.3 program [49]. Multiple comparison Tukey’s HSD (honestly significant difference) statistical test was applied to assess significant differences (p < 0.05) between means. The results of the F-test for fixed effects in ANOVA are presented in Table 1.

2.5. Weather Conditions

The growing season of 2018 lasted for 201 days. Jerusalem artichokes were harvested in the first week of November. Weather conditions during the experimental period are presented in Table 2. During the growing season, mean monthly air temperatures did not differ considerably from the long-term average of 1981–2010. Rapid growth of aerial plant parts and tuber setting began in mid-June. Total precipitation during the growing season reached 418.8 mm, and it was 7% lower than the long term average (450.1 mm). Rainfall was unevenly distributed, with dry spells in May and September. Precipitation levels were lowest in May and September, 57% and 64% lower than the long-term average, respectively, and irrigation was required (3, 11, 20 and 28 September). As described in the Methods section, the optimal moisture content of soil was determined based on the irrigation system for late-maturing potato varieties. A comparison of the water requirements of plants with precipitation levels shows that rainfall was 27% lower than the optimal water supply also in August. Only in July precipitation exceeded the long-term average by 90% and the water requirements of plants by 45%. Despite the above, measurements of the soil moisture status revealed the need for irrigation since the field water capacity dropped below 60%, i.e., to ≤13.2%.

3. Results and Discussion

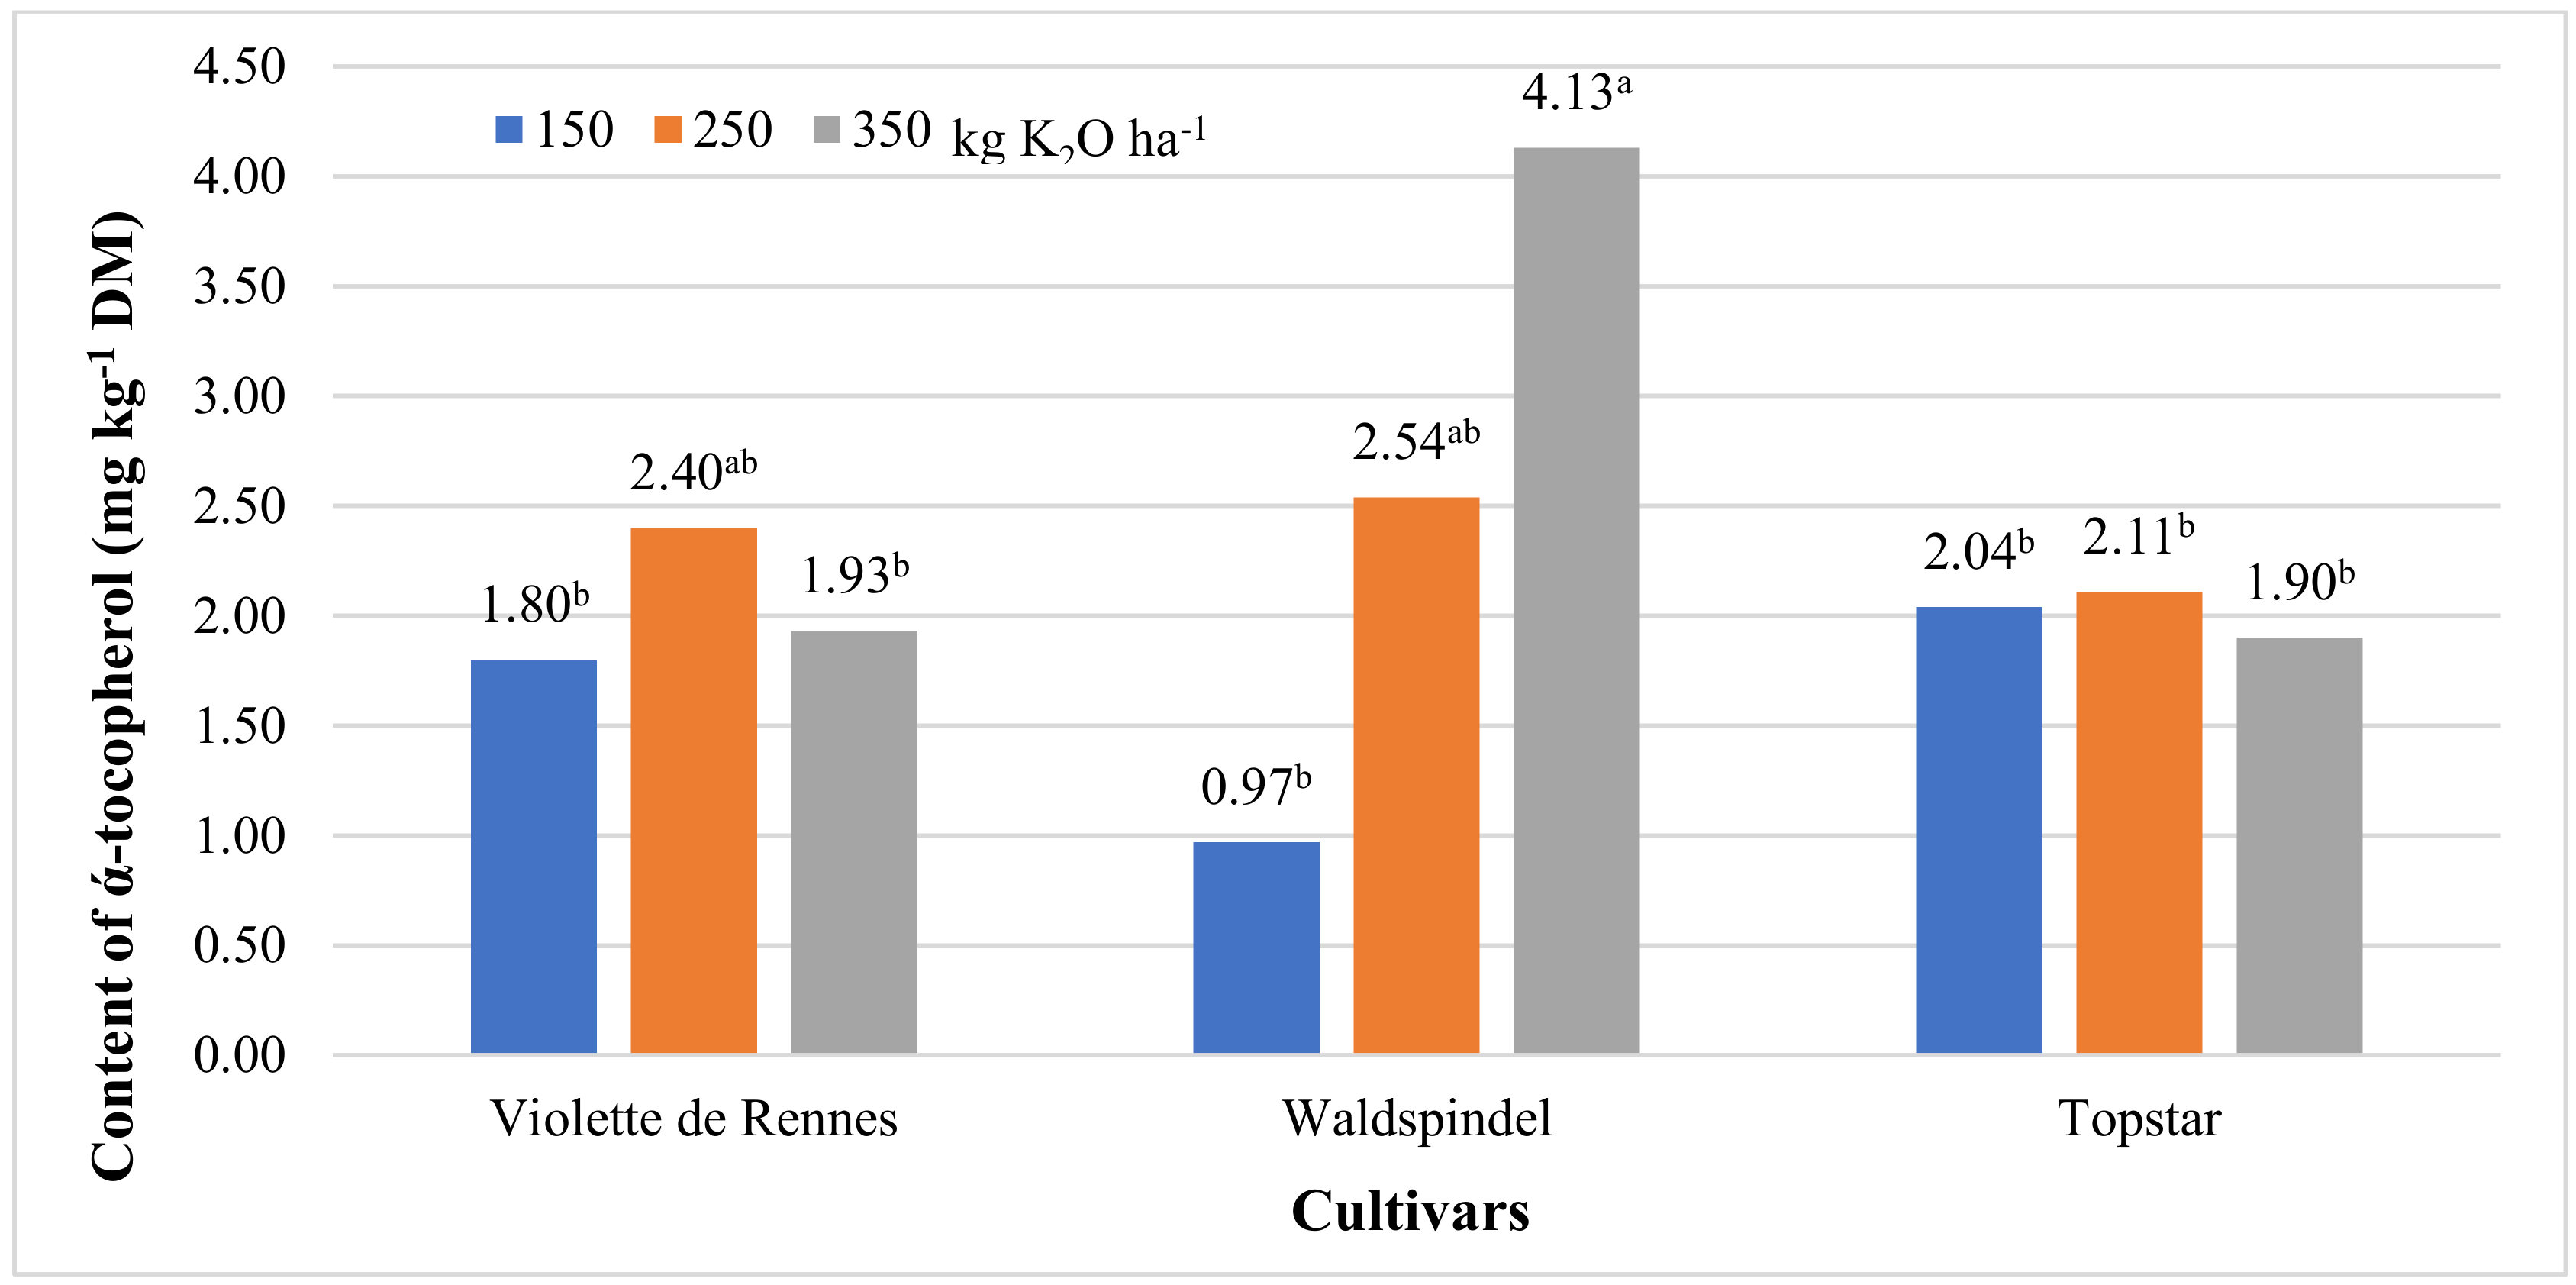
3.1. Content of ά-Tocopherol and β-Carotene

α-, β-, γ- and δ-Tocopherols (lipid-soluble compounds with vitamin E activity) act as antioxidants that exert anti-sclerotic effects and improve vascular function. According to Sram et al. [50], vitamin E is essential for healthy brain function and a 12-month course of vitamin E improves short-term memory, psychomotor functions and mood. The optimal daily dose of supplemental vitamin E is 200–400 mg of tocopheryl acetate [51]. α-Tocopherol has the highest biological activity (100%), and the activity of the remaining tocopherols (β, γ, δ) ranges from 2 to 35% [52]. Tocopherols are thermally stable even at a temperature of 200 °C (only 10% of tocopherol is lost during cooking) [52]. In the present study, the content of ά-tocopherol in Jerusalem artichoke tubers ranged from 1.60 to 2.65 mg kg−1 DM (Table 3).
Wheat germ oil is the richest source of α-tocopherol (2500 mg kg−1) [52]. In edible vegetable oils, the mean concentration of α-tocopherol ranges from 50–100 (soybean oil) to 300–400 mg kg−1 (canola and sunflower oil) [53,54]. The concentration of α-tocopherol was determined at 1–9 mg kg−1 in the seeds of oilseed crops (linseed, mustard, poppy, pumpkin), 1–15 mg kg−1 in cereal grain (buckwheat, barley, maize, rye, spelt, millet), and 16–104 mg kg−1 in legume seeds (chick peas, lentils, peas) [55]. Potato tubers contain 0.5–2.8 [56] to even 20.8 mg kg−1 DM of ά-tocopherol (native Andean cultivars) [57].
In the current study, an increase in the potassium fertilizer rate led to a significant increase in the ά-tocopherol content of Jerusalem artichoke tubers (Table 3). This correlation was particularly pronounced in cv. Waldspindel where ά-tocopherol levels increased 3.2-fold when the potassium rate was increased from 150 to 350 kg K2O ha−1 (Figure 1). Irrigation increased ά-tocopherol concentrations by 41% on average in the studied Jerusalem artichoke cultivars (Table 3). Potassium fertilizer enhanced α-tocopherol levels only in irrigated plots. In non-irrigated plots, potassium fertilization was not correlated with ά-tocopherol concentrations in H. tuberosus tubers (Figure 2). α-Tocopherol is the most biologically active form of tocopherol, and its proportion in total tocopherols is an important consideration [52]. Potassium rate was the only experimental variable which significantly differentiated the proportion of α-tocopherol in total tocopherols (Table 1). The highest percentage of α-tocopherol in total tocopherols (79.6% on average) was noted in tubers supplied with potassium at 350 kg ha−1, regardless of cultivar or irrigation (Table 3).
β-Carotene is a vitamin A precursor which is essential for the maintenance of normal vision, healthy skin and immunity [58]. The recommended daily allowance of vitamin A is 4.8 mg of β-carotene [59]. Foods of animal origin and carotene-containing plants are the main sources of vitamin A in the human diet [52,60,61]. In this study, the β-carotene content of H. tuberosus tubers ranged from 750 to 1000 μg kg−1 DM (Table 3), and it was 1.8-to 2.5-fold higher than in potato tubers (400 μg kg−1 DM), and 3.7-to 5-fold higher than in sugar beetroots (200 μg kg−1 DM) [62]. In the present study cultivar, potassium rate and irrigation did not affect β-carotene synthesis in Jerusalem artichoke tubers (Table 1). In a study by Wierzbicka and Hallmann [61], agronomic factors also exerted a weak influence on β-carotene synthesis in potato tubers.
Vitamin A activity is determined in retinol equivalents (RE) [46,62]. Raju et al. [46] analyzed the activity of provitamin A in 30 species of leafy vegetables and reported the highest value in broccoli (641 RE) and the lowest value in sorrel (12 RE). In the present experiment, vitamin A activity in Jerusalem artichokes was determined in the range of 125–167 RE, and it was higher in non-irrigated tubers (Table 3).

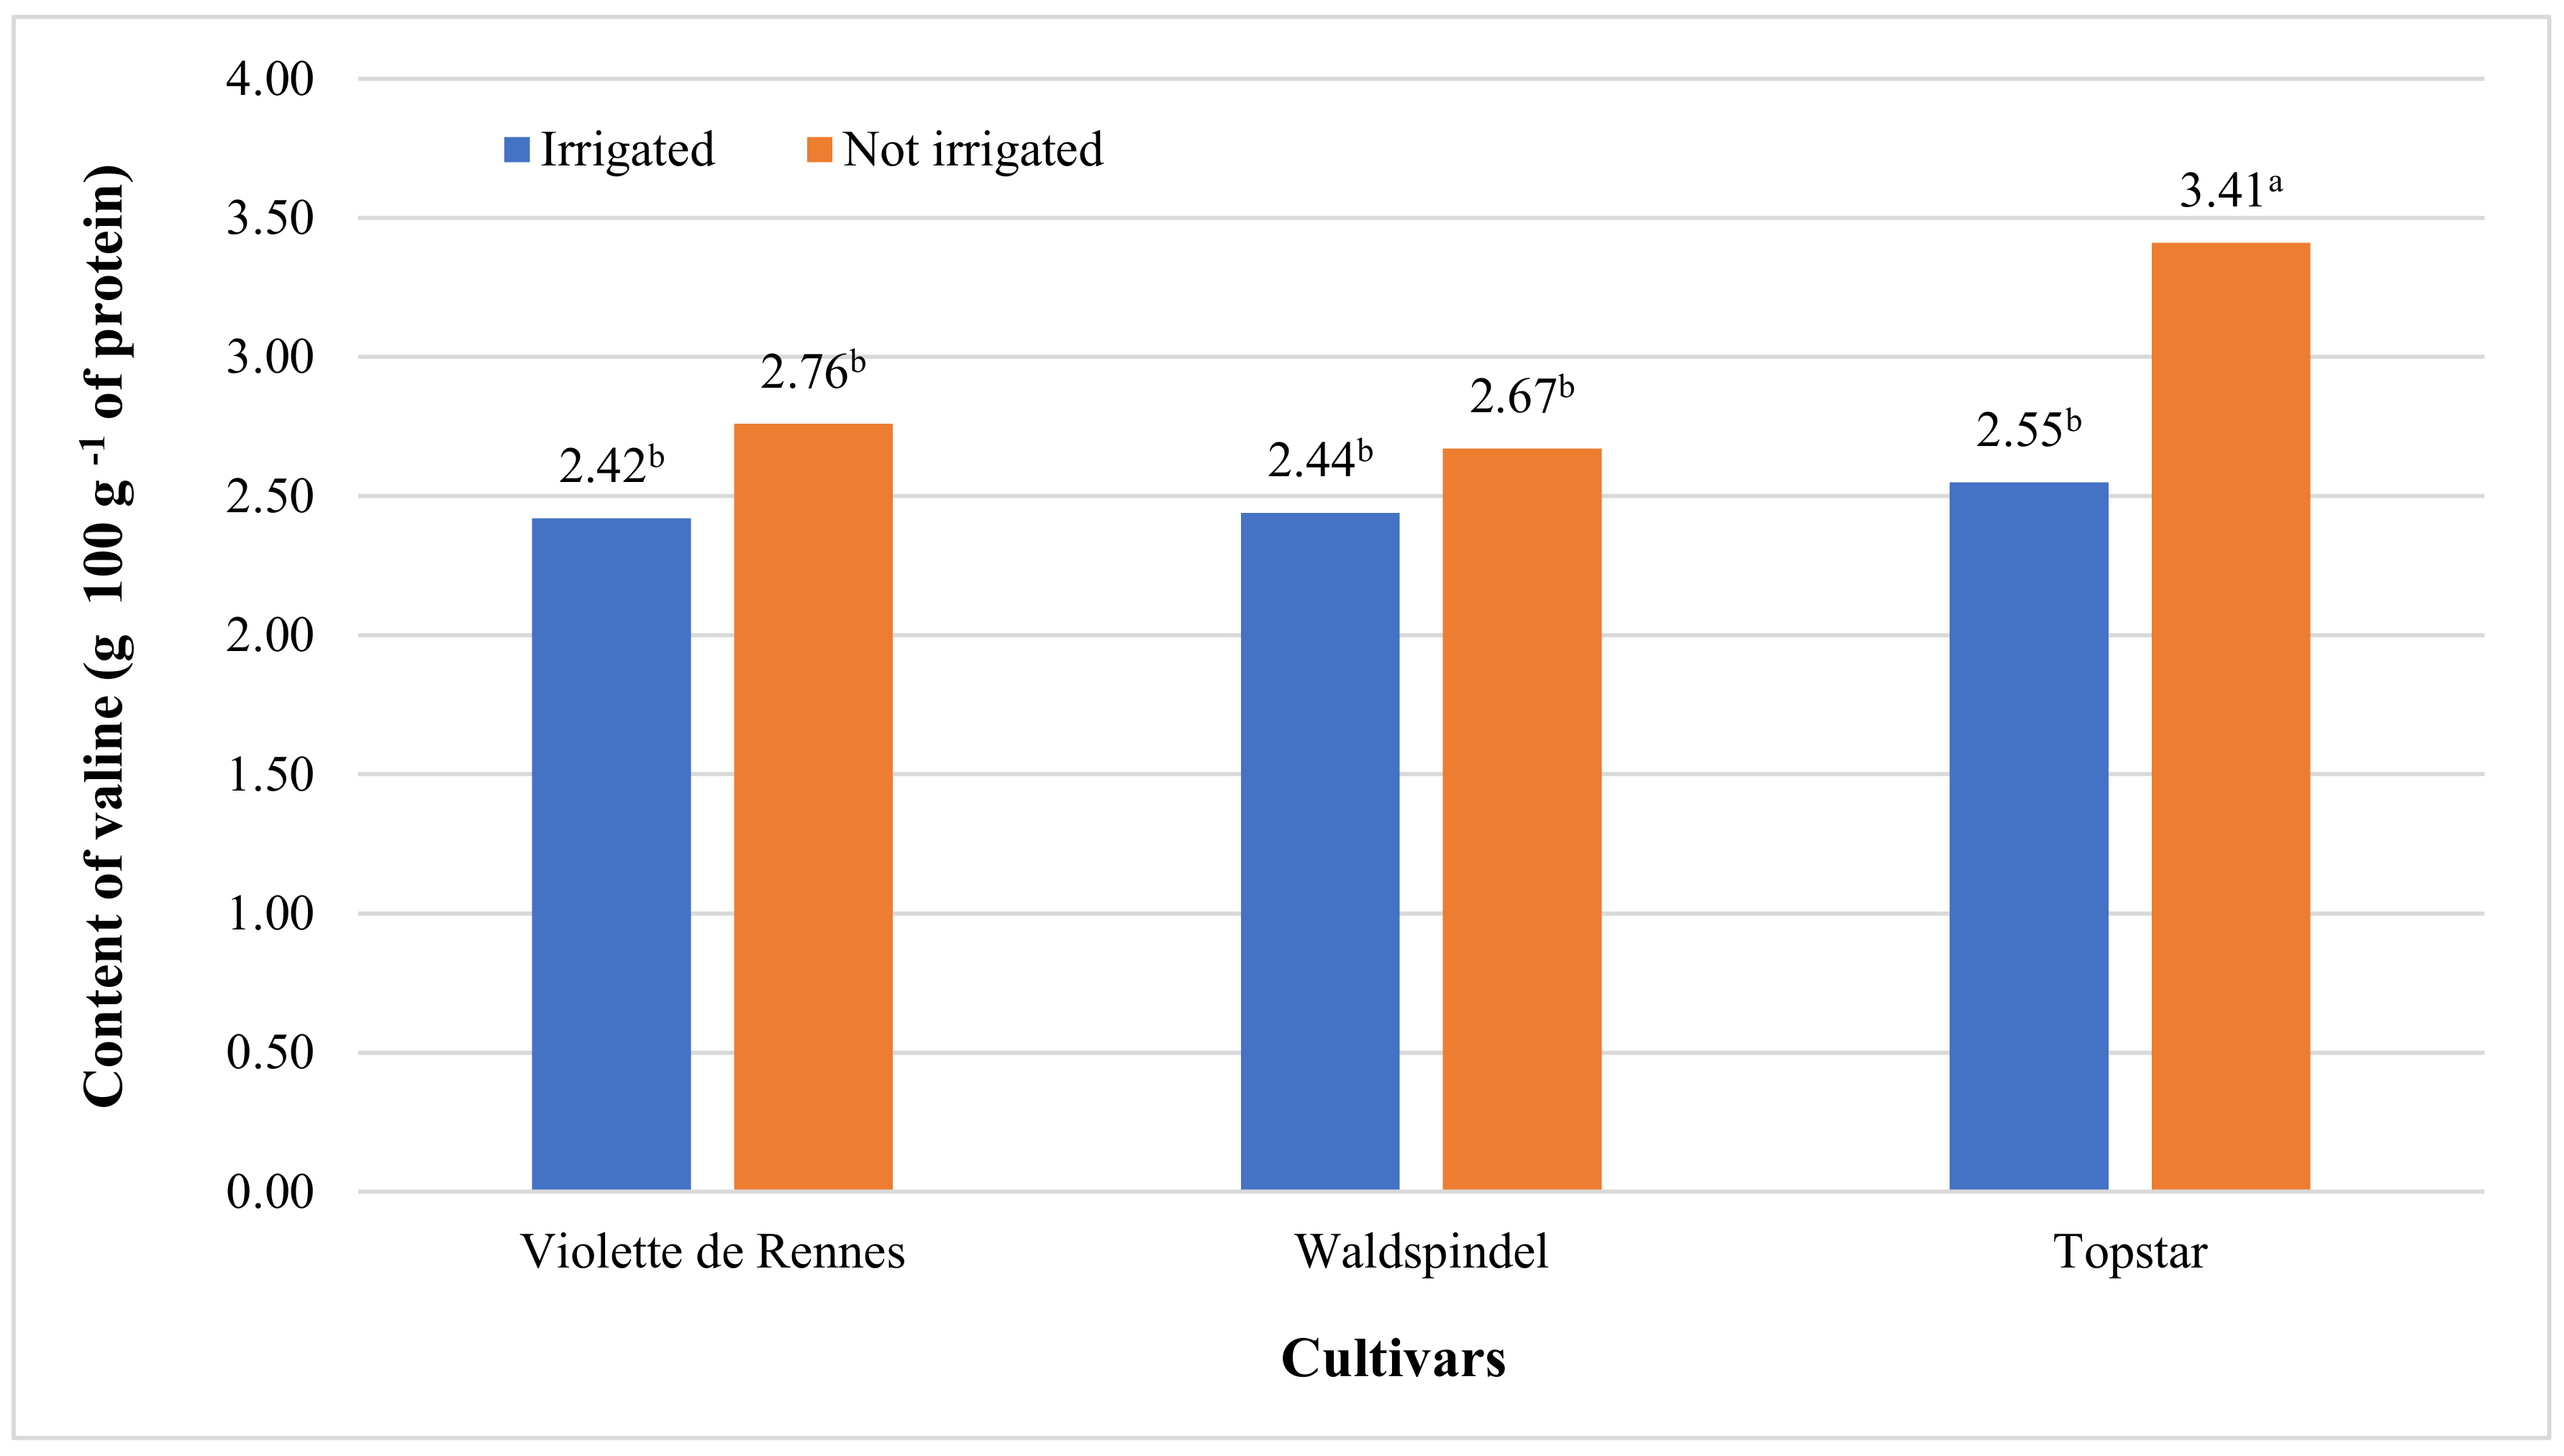
3.2. Amino acid Content and Nutritional Value of Protein

Jerusalem artichoke contains highly nutritional protein with a balanced amino acid profile [63]. In this study, amino acid concentrations differed across the examined cultivars (Table 1).
The highest content of most essential (isoleucine, leucine, phenylalanine, thyrosine and valine) and endogenous amino acids (alanine, glycine, threonine) was noted in cv. Topstar. Jerusalem artichoke cv. Waldspindel was most abundant in thyrosine and arginine, whereas the tubers of cv. Violette de Rennes were characterized by the highest concentrations of aspartic acid and glutamic acid (Table 4 and Table 5).
The content of lysine, methionine, cystine, tryptophan, histidine, proline and serine was not differentiated by the genetic factor (Table 1). An increase in the potassium fertilizer rate to 250 kg K2O ha−1 decreased the content of glutamic acid (by 1.22 g 100 g−1 of protein) in Jerusalem artichoke tubers (Table 5). This correlation was particularly visible in cvs. Violette de Rennes and Topstar where glutamic acid levels decreased by 2.57 g 100 g−1 of protein on average in response to higher potassium rates (Figure 3). The phenylalanine content of the examined cultivars was also influenced by potassium fertilization (Cv. × K interaction) (Table 1). Phenylalanine levels were highest in cv. Topstar supplied with the lowest potassium rate (150 kg K2O ha−1). In the tubers of cv. Waldspindel, similar concentrations of phenylalanine were noted only in response to the highest potassium rate (350 kg K2O ha−1) (Figure 4).
In the work of Eppendorfer [64], potassium deficiency induced the greatest decrease in the concentration of proline, followed by glutamic acid, but it increased histidine and aspartic acid levels. These findings were not corroborated by the present study where the synthesis of endogenous amino acids was not significantly affected by higher potassium rates (Table 5). The content of aspartic acid in Jerusalem artichoke tubers was a cultivar-dependent trait (Table 1). The highest accumulation of aspartic acid was noted in cv. Violette de Rennes (Table 5). According to Eppendorfer [64], as cited by Pęksa et al. [65], the content of essential amino acids is inversely correlated with fertilizer rates. In this experiment, the applied rates of potassium fertilizer were not correlated with the synthesis of essential amino acids (isoleucine, leucine, lysine, methionine, cystine, phenylalanine, thyrosine, tryptophan, valine).
Irrigation decreased the content of most essential (isoleucine, leucine, lysine, phenylalanine, valine) and endogenous amino acids (alanine, glycine, histidine, serine, threonine) (Table 4 and Table 5). A particularly high decline (25%) in valine concentration was noted in irrigated tubers cv. Topstar (Figure 5). Irrigation enhanced the concentrations of only selected endogenous amino acids (arginine, glutamic acid, proline) (Table 4 and Table 5). In irrigated plots, an above-average increase was noted in arginine levels in tubers cv. Waldspindel and in glutamic acid and proline concentrations in cv. Violette de Rennes (Figure 6, Figure 7 and Figure 8).
The essential amino acid index and the limiting amino acid index support evaluations of the nutritional quality of protein relative to chicken egg protein as the reference. New reference proteins which contain smaller amounts of amino acids (even twice smaller for methionine + cysteine, threonine, tryptophan, phenylalanine + thyrosine) and correspond to human nutritional requirements have been introduced in 2007 [66]. The nutritional value of the studied protein preparations was evaluated based on their chemical scores (SC). The chemical scores of cvs. Topstar and Waldspindel exceeded the reference value only for phenylalanine + thyrosine (by 29.8% and 18.2%, respectively), and leucine was the limiting amino acid (52.7% and 45.0%, respectively). In a study by Mitrus et al. [67], leucine was also the first limiting amino acid in S. tuberosum (36.5%). In Jerusalem artichokes cv. Violette de Rennes, the content of all amino acids was below the reference value, from 1.6% (phenylalanine + thyrosine) to 21.8–59.2% (the remaining amino acids), and methionine + cysteine were the limiting amino acids (40.8%) (Table 6). Methionine + cysteine were also identified as the limiting amino acids in Jerusalem artichoke tubers analyzed by Danilcenko et al. [68] and Pęksa et al. [69]. In the work of Ciborowska and Rudnicka [70], the nutritional value of potatoes was limited by methionine + cysteine. According to Zhu et al. [71] and Pęksa et al. [65,69], the limiting amino acids in potato and Jerusalem artichoke tubers are determined mainly by cultivar and geographic location. Jerusalem artichokes are abundant in protein of high biological value. The species contains all essential amino acids in optimal proportions. Cieślik and Filipiak-Florkiewicz [63] reported higher levels of methionine in Jerusalem artichoke than in potato tubers. Contrary results were noted in this study, in particular in cv. Violette de Rennes. The nutritional value of protein evaluated based on the EAAI ranged from 66% (cv. Violette de Rennes) to 71–78% (cvs. Topstar and Waldspindel) (Table 6). Oser [48] and Sawicka [23] determined the EAAI of potatoes at 56-68%. The EAAI of other tuber crops of economic importance ranges from 54% (cassava, Manihot esculenta Crantz) to 82% (sweet potatoes, Ipomoea batatas L./Poir.) [48]. The EAAI of Jerusalem artichoke tubers exceeds the mean values for S. tuberosum and M. esculenta.
The chemical score calculated for different potassium fertilization rates exceeded the reference value for phenylalanine + thyrosine (by 12% at 250 kg K2O ha−1, by 14% at 150 kg K2O ha−1, and by 20% for 350 kg K2O ha−1) (Table 7). The limiting amino acid was leucine at 150 kg K2O ha−1 (47%), and methionine + cysteine at 250 and 350 kg K2O ha−1 (45% and 49%, respectively). The nutritional value of protein expressed by the EAAI relative to the reference protein ranged from 70 to 74% for the applied rates of potassium fertilizer (Table 7).
The CS of phenylalanine + thyrosine exceeded the reference value by 10% in irrigated plots and by 20% in the absence of irrigation (Table 8). The limiting amino acid was leucine regardless of the irrigation regime (44–52%). The nutritional value of protein expressed by the EAAI relative to the reference protein ranged from 67 to 76% in irrigated and non-irrigated tubers (Table 8).

4. Conclusions

The present study confirmed that the genetic factor (cultivar) strongly affects the biological value of Jerusalem artichoke tubers. Topstar cultivar was most abundant in essential (isoleucine, leucine, phenylalanine, thyrosine, valine) and endogenous amino acids (alanine, glycine, threonine). High rates of potassium fertilizer (250 and 350 kg K2O ha−1) increased the absolute content of ά-tocopherol and its proportion in total tocopherols, and decreased the content of glutamic acid in tubers. Irrigation increased ά-tocopherol levels and decreased the concentrations of β-carotene and most essential and endogenous amino acids. The limiting amino acids in Jerusalem artichoke tubers were leucine (cv. Topstar and Waldspindel) and methionine + cysteine (cv. Violette de Rennes). Leucine was the limiting amino acid in tubers supplied with low potassium rates (150 kg K2O ha−1), whereas in plots with moderate and high potassium rates (250 and 350 kg K2O ha−1, respectively), the limiting amino acids were methionine + cysteine. Jerusalem artichoke tubers were characterized by very high nutritional value of protein, expressed by the EAAI.

Author Contributions

Conceptualization, methodology, B.B., formal analysis, writing—original draft preparation, B.B. and K.J. All authors have read and agreed to the published version of the manuscript.

Funding

Project financially co-supported by Minister of Science and Higher Education in the range of the program entitled “Regional Initiative of Excellence” for the years 2019–2022, Project No. 010/RID/2018/19, amount of funding 12.000.000 PLN.”

Acknowledgments

The results presented in this paper were obtained as part of a comprehensive study financed by the University of Warmia and Mazury in Olsztyn (grant No. 20.610.020-110).

Conflicts of Interest

The authors declare no conflict of interest.

References

  1. Yang, L.; He, Q.S.; Corscadden, K.; Udenigwe, C.C. The prospects of Jerusalem artichoke in functional food ingredients and bioenergy production. Biotechnol. Rep. 2015, 5, 77–88. [Google Scholar] [CrossRef] [PubMed] [Green Version]
  2. Dias, N.S.; Ferreira, J.F.S.; Liu, X.L.; Suarez, D.L. Jerusalem artichoke (Helianthus tuberosus L.) maintains high inulin, tuber yield, and antioxidant capacity under moderately-saline irrigation waters. Ind. Crop. Prod. 2016, 94, 1009–1024. [Google Scholar] [CrossRef]
  3. Matias, J.; Encinar, J.M.; Gonzales, J.; Gonzales, J.F. Optimisation of ethanol fermentation of Jerusalem artichoke tuber juice using simple technology for a decentralised and sustainable ethanol production. Energy Sustain. Dev. 2015, 25, 34–39. [Google Scholar] [CrossRef]
  4. Fang, Y.R.; Liu, J.A.; Steiberger, Y.; Xie, G.H. Energy use efficiency and economic feasybility of Jerusalem artichoke production on arid and coastal saline lands. Ind. Crop. Prod. 2018, 117, 131–139. [Google Scholar] [CrossRef]
  5. Jankowski, K.J.; Dubis, B.; Sokólski, M.M.; Załuski, D.; Bórawski, P.; Szempliński, W. Biomass yield and energy balance of Virginia fanpetals in different production technologies in north-eastern Poland. Energy 2019, 185, 612–623. [Google Scholar] [CrossRef]
  6. Lewandowski, I.; Bahrs, E.; Dahmen, N.; Hirth, T.; Rausch, T.; Weidtmann, A.W. Biobased value chains for a growing bioeconomy. GCB Bioenergy 2019, 11, 4–8. [Google Scholar] [CrossRef]
  7. Dubis, B.; Jankowski, K.J.; Sokólski, M.M.; Załuski, D.; Bórawski, P.; Szempliński, W. Biomass yield and energy balance of fodder galega in different production technologies: An 11-year field experiment in a large-area farm in Poland. Renew. Energ. 2020, 154, 813–825. [Google Scholar] [CrossRef]
  8. Gao, K.; Zhang, Z.; Zhu, T.; Coulter, J.A. The influence of flower removal on tuber yield and biomass characteristics of Helianthus tuberosus L. in a semi-arid area. Ind. Crop. Prod. 2020, 150, 112374. [Google Scholar] [CrossRef]
  9. Jankowski, K.J.; Sokólski, M.M.; Dubis, B.; Załuski, D.; Szempliński, W. Sweet sorghum—Biomass production and energy balance at different levels of agricultural inputs. A six-year field experiment in north-eastern Poland. Eur. J. Agron. 2020, 119, 126119. [Google Scholar] [CrossRef]
  10. Piskier, T. Labour inputs and costs of topinambour growing. Inżynieria Rol. 2006, 11, 359–365. (In Polish) [Google Scholar]
  11. Piskier, T. A model of topinambour cultivation for fuel purposes. Inżynieria Rol. 2010, 7, 183–190. (In Polish) [Google Scholar]
  12. Sawicka, B.; Skiba, D.; Michałek, W. Jerusalem artichoke as an alternative source of biomass on the fallowed land in the Lublin region. Zesz. Probl. PNR 2009, 542, 465–479. (In Polish) [Google Scholar]
  13. Sawicka, B. Energy value Jerusalem artichoke (Helianthus tuberosus L.) as a source of biomass. Zesz. Nauk. UP Wrocław Rol. 2010, 47, 245–256. (In Polish) [Google Scholar]
  14. Bolibok, Ł. Energy value of the straw of selected Jerusalem artichoke cultivars. Episterme 2011, 12, 15–20. (In Polish) [Google Scholar]
  15. Stolarski, M.J.; Krzyżaniak, M.; Warmiński, K.; Tworkowski, J.; Szczukowski, S.; Olba-Zięty, E.; Gołaszewski, J. Energy efficiency of herbaceous crops production depending on the type of digestate and mineral fertilizers. Energy 2017, 134, 50–60. [Google Scholar] [CrossRef]
  16. Paixão, S.M.; Alves, L.; Pacheco, R.; Silva, C.M. Evaluation of Jerusalem artichoke as a sustainable energy crop to bioethanol: Energy and CO2eq emissions modeling for an industrial scenario. Energy 2018, 150, 468–481. [Google Scholar] [CrossRef] [Green Version]
  17. Denoroy, P. The crop physiology of Helianthus tuberosus L.: A model orientated view. Biomass Bioenerg. 1996, 11, 11–32. [Google Scholar] [CrossRef]
  18. Kim, S.; Kim, C.H. Evaluation of whole Jerusalem artichoke (Helianthus tuberosus L.) for consolidated bioprocessing ethanol production. Renew. Energ. 2014, 65, 83–91. [Google Scholar] [CrossRef]
  19. Sawicka, B.; Skiba, D.; Bienia, B.; Kieltyka-Dadasiewicz, A.; Danilcenko, H. Jerusalem artichoke (Helianthus tuberosus L.) as energy raw material. In Proceedings of the 9th International Scientific Conference Rural Development, Research and Innovation for Bioeconomy, Kaunas, Lithuania, 26–28 September 2019; pp. 336–342. [Google Scholar]
  20. Diederichsen, A. Phenotypic diversity of Jerusalem artichoke (Helianthus tuberosus L.) germplasmpreserved by the Canadian genebank. Helia 2010, 33, 1–16. [Google Scholar] [CrossRef]
  21. Swanton, C.J.; Cavers, P.B.; Clementsl, D.R.; Mooret, J.M. The biology of Canadian weeds. 101. Helianthus tuberosus L. Can. J. Plant Sci. 1992, 72, 1367–1382. [Google Scholar] [CrossRef]
  22. Liu, S.; Zhao, C.; Zhang, Y.; Hu, Z.; Wang, C.; Zong, Y.; Zhang, L.; Zou, J. Annual net greenhouse gas balance in a halophyte (Helianthus tuberosus) bioenergy cropping system under various soil practices in Southeast China. Bioenergy 2015, 7, 690–703. [Google Scholar] [CrossRef]
  23. Sawicka, B. Jerusalem Artichoke Helianthus tuberosus L.—Biology, Cultivation and Applications; University of Life Sciences: Lublin, Poland, 2016; p. 223. (In Polish) [Google Scholar]
  24. Monti, A.; Amaducci, M.T.; Venturi, G. Growth response, leaf gas exchange and fructans accumulation of Jerusalem artichoke (Helianthus tuberosus L.) as affected by different water regimes. Eur. J. Agron. 2005, 23, 136–145. [Google Scholar] [CrossRef]
  25. Niness, R.K. Inulin and Oligofructose. J. Nutr. 1999, 129, 1402–1406. [Google Scholar] [CrossRef] [PubMed] [Green Version]
  26. Michalska-Ciechanowska, A.; Wojdyło, A.; Bogucka, B.; Dubis, B. Moderation of inulin and polyphenolics contents in three cultivars of Helianthus tuberosus L. by potassium fertilization. Agronomy 2019, 9, 884. [Google Scholar] [CrossRef] [Green Version]
  27. Nair, K.K.; Kharb, K.; Thompkinson, D.K. Inulin Dietary Fiber with Functional and Health Attributes. Food Rev. Int. 2010, 26, 189–203. [Google Scholar] [CrossRef]
  28. Sawicka, B. The effect of nitrogen fertilization of the biological value of Helianthus tuberosus L. tubers. Rocz. AR Pozn. 2000, 323, 447–451. (In Polish) [Google Scholar]
  29. Mystkowska, I.; Zarzecka, K. Nutritional value andpro-healthy properties of jerusalem artichoke (Helianthus tuberosus L.). Post. Fitoter. 2013, 2, 123–126. (In Polish) [Google Scholar]
  30. Sawicka, B.; Kalembasa, D.; Skiba, D. Variability in macroelement content in theaboveground part of Helianthus tuberosus L. at different nitrogen fertilization levels. Plant Soil Environ. 2015, 61, 158–163. [Google Scholar] [CrossRef]
  31. Góral, S. Morphological variation and yield of selected Jerusalem artichoke (Helianthus tuberosus L.) clones. Hod. Roślin Nasienn. 1998, 2, 6–11. (In Polish) [Google Scholar]
  32. Praznik, W.; Cieślik, E.; Filipiak, A. The influence of harvest time on the content of nutritional components in tubers of Jerusalem artichoke (Helianthus tuberosus L.). In Proceedings of the Seventh Seminar on Inulin, Leuven, Belgium, 22–23 January 1998; pp. 154–157. [Google Scholar]
  33. Matias, J.; Gonzales, J.; Cabanillas, J.; Royano, L. Influence of NPK fertilisation and harvest date on agronomic performance of Jerusalem artichoke crop in the Guadiana Basin (Southwestern Spain). Ind. Crop. Prod. 2013, 48, 191–197. [Google Scholar] [CrossRef]
  34. Gao, K.; Zhu, T.; Wang, Q. Nitrogen fertilization, irrigation, and harvest times affect biomass and energy value of Helianthus tuberosus L. J. Plant Nutr. 2016, 39, 1906–1914. [Google Scholar]
  35. Soja, G.; Dersch, G.; Praznik, W.I. Harvest dates, fertilizer and varietal effects on yield, concentration and molecular distribution of fructan in Jerusalem artichoke (Helianfhus tuberosus L.). J. Agron. Crop Sci. 1990, 165, 181–189. [Google Scholar] [CrossRef]
  36. Westermann, D.T.; James, D.W.; Tindall, T.A.; Hurst, R.L. Nitrogen and potassium fertilization of potatoes: Sugars and starch. Am. Potato J. 1994, 71, 433–453. [Google Scholar] [CrossRef]
  37. Johnston, A.E.; Milford, G.F.J. Potassium and Nitrogen Interactions in Crops; Potash Development Association: York, UK, 2000; p. 16. [Google Scholar]
  38. Haverkort, A.; Verhagen, A. Climate change and its repercussions for the potato supply chain. Potato Res. 2008, 51, 223–237. [Google Scholar] [CrossRef]
  39. Pandey, A.D.; Ostrowski, V.M.; Pandey, R.P. Simulation and optimization for irrigation and cropplanning. Irrig. Drain. 2012, 61, 178–188. [Google Scholar]
  40. PIORiN. Integrated Production Method for Potatoes. Main Inspectorate of Plant Health and Seed Inspection; 2014. Available online: http://www.piorin.gov.pl/30.01.2020 (accessed on 15 June 2020). (In Polish)
  41. IUSS Working Group WRB. World Reference Base for Soil Resources. In World Soil Resources Reports, 2nd ed.; FAO: Roma, Italy, 2006. [Google Scholar]
  42. Houba, V.J.G.; Van der Lee, J.J.; Novozamsky, I. Soil and Plant Analysis. Part 5B. Soil Analysis Procedure other Procedure; Wageningen Agriculture University: Wageningen, The Netherlands, 1995. [Google Scholar]
  43. Polish Standard PN-77-R-64820. In Animal Feed. Determination of Tryptophan Content; Polish Standard ISO 6867: 2002; Animal Feed. Determination of Vitamin E Content. High-Performance Liquid Chromatography—Tocopherols in Animal Feed; Polish Committee for Standardization: Warsaw, Poland, 1977.
  44. Manz, U. Assay Methods for Beta-Carotene in ROVIMIX-β-Carotene 10% and in Mixed Animal Feeds, and of Carotene in Animal Feedstuffs, Blood Plasma and MilkInformation Services Animal Nutrition Department, Chalcombe PublicationsChalcombe Publications: Basel, Switzerland, 1986.
  45. Rodriquez-Bernaldo de Quiros, A.; Costa, H.S. Analysis of carotenoids in vegetable and plasma samples. J. Food Compos. Anal. 2006, 19, 97–111. [Google Scholar] [CrossRef]
  46. Raju, M.; Varakumar, S.; Lakshminarayana, R.; Krishnakantha, T.P.; Baskaran, V. Carotenoid composition and vitamin A activity of medicinally important green leafy vegetables. Food Chem. 2007, 101, 1598–1605. [Google Scholar] [CrossRef]
  47. Mitchell, H.H.; Block, R.J. Some relationship between the amino acid contents of proteins and their nutritive values for the rat. J. Biol. Chem. 1946, 163, 599–620. [Google Scholar] [CrossRef]
  48. Oser, B.L. An integrated essential amino acid index for predicting biological value of proteins. In Protein Amino Acid Nutrition; Academic Press: Cambridge, MA, USA, 1959; pp. 295–311. [Google Scholar]
  49. Statsoft Inc. Statistica (Data Analysis Software System), 10th ed.; Statsoft Inc.: Tulsa, OK, USA, 2011; Available online: http:/www.statsoft.com (accessed on 1 April 2020).
  50. Sram, R.J.; Binkova, B.; Topinka, J.; Kotesovec, F.; Fojtikova, I.; Hanel, I.; Klaschka, J.; Kocisova, J.; Prosek, M.; Machalek, J. Effect of antioxidant supplementation in an elderly population. Basic Life Sci. 1993, 61, 459–477. [Google Scholar]
  51. Martin, A.; Youdim, K.; Szprengiel, A.; Shukitt-Hale, B.; Joseph, J. Roles of Vitamins E and C on Neurodegenerative Diseasesand Cognitive Performance. Nutr. Rev. 2002, 60, 308–326. [Google Scholar] [CrossRef] [PubMed]
  52. Moszczyński, P.; Pyć, R. Biochemistry of Vitamins. Part 2: Lipophilic Vitamins and Ascorbic Acid; Polish Scientific Publishers: Warszaw, Poland, 1999; p. 162. (In Polish) [Google Scholar]
  53. Krist, S. Vegetable Fats and Oils; Springer: Cham, Switzerland, 2000; p. 774. [Google Scholar]
  54. Mao, X.; Chen, W.; Huyan, Z.; Sherazi, S.T.H. Impact of linolenic acid on oxidative stability of rapeseed oils. J. Food Sci. Technol. 2020, 57, 3184–3192. [Google Scholar] [CrossRef] [PubMed]
  55. Ryan, E.; Galvin, K.; O’Connor, T.P.; Maguire, A.R.; O’Brien, N.M. Phytosterol, Squalene, Tocopherol Content and Fatty Acid Profile of Selected Seeds, Grains, and Legumes. Plant Foods Hum. Nutr. 2007, 62, 85–91. [Google Scholar] [CrossRef] [PubMed]
  56. Lachman, J.; Hamouz, K.; Orsak, M.; Pivec, V. Potato tubers as a significant source of antioxidants in human nutrition. Rost. Vyroba 2000, 46, 231–236. [Google Scholar]
  57. Andre, C.M.; Qufir, M.; Guignard, C.; Hoffmann, L.; Hausman, J.F.; Evers, D.; Larondelle, Y. Antioxidant Profiling of Native Andean Potato Tubers (Solanum tuberosum L.) Reveals Cultivars with High Levels of β-Carotene, ά-Tocopherol, Chlorogenic Acid, and Petanin. J. Agric. Food Chem. 2007, 55, 10839–10849. [Google Scholar] [CrossRef]
  58. Gilbert, C. How to manage children with the eye signs of vitamin A deficiency. Community Eye Health J. 2013, 26, 68. [Google Scholar]
  59. Toti, E.; Chen, C.Y.O.; Palmery, M.; Valencia, D.V.; Peluso, I. Non-Provitamin A and Provitamin A Carotenoids as Immunomodulators: Recommended Dietary Allowance, Therapeutic Index, or Personalized Nutrition? Oxid. Med. Cell. Longev. 2018, 2018, 20. [Google Scholar] [CrossRef]
  60. Staniaszek, K.; Goździcka-Józefiak, A. The influence of β-carotene, retinoids, RAR and RXR receptors proliferation and neoplastic transformation of cells. Biotechnologia 2008, 3, 28–45. (In Polish) [Google Scholar]
  61. Wierzbicka, A.; Hallmann, E. The prevalence and role of carotenoids in potatoes. Ziemn. Pol. 2015, 3, 42–46. (In Polish) [Google Scholar]
  62. Preedy, V.R. Vitamin A and Carotenoids. Chemistry, Analysis, Function and Effects; Royal Society and Chemistry: Cambridge, UK, 2012; p. 555. [Google Scholar]
  63. Cieślik, E.; Filipiak-Florkiewicz, A. Perspective usage of Jerusalem artichoke (Helianthus tuberosus L.) for producing functional food. Żywność Nauka Technol. Jakość 2000, 1, 73–81. (In Polish) [Google Scholar]
  64. Eppendorfer, W.H. Free and total amino acid composition of edible parts of beans, kale, spinach, cauliflower and potatoes as influenced by nitrogen fertilization and phosphorus and potassium deficiency. J. Sci. Food Agric. 1996, 71, 449–458. [Google Scholar] [CrossRef]
  65. Pęksa, A.; Rytel, E.; Tajner-Czopek, A.; Kita, A.; Pytlarz-Kozicka, M.; Miedzianka, J. The comparision of amino acid composition of the protein in preparation obtained from potato tu bers cultivated within ecological and conventional systems. Biuletyn IHAR 2012, 266, 307–317. (In Polish) [Google Scholar]
  66. WHO; FAO; UNU. Protein and Amino Acid Requirements in Human Nutrition; United Nations University: Tokyo, Japan, 2007. [Google Scholar]
  67. Mitrus, J.; Stankiewicz, C.; Steć, E.; Kamecki, M.; Starczewski, J. The influence of selected cultivation on the content of total protein and amino acids in the potato tubers. Plant Soil Environ. 2003, 49, 131–134. [Google Scholar] [CrossRef] [Green Version]
  68. Danilcenko, H.; Jariene, E.; Gajewska, M.; Sawicka, B.; Kulaitien, J.; Cerniauskiene, J.; Aleknaviciene, P. Changes in amino acids content in tuber of Jerusalem artichoke (Helianthus tuberosus L.) cultivars during storage. Acta Sci. Pol. Hortorum Cultus 2013, 12, 97–105. [Google Scholar]
  69. Pęksa, A.; Kita, A.; Jariene, E.; Danilcenko, H.; Gryszkin, A.; Figiel, A.; Kulaitiene, J.; Cerniauskiene, J.; Aniołowska, M. Amino acid improving and physical qualities of extruded corn snacks using flours made from Jerusalem artichoke (Helianthus tuberosus L.), Amaranth (Amaranthus cruentus L.) and Pumpkin (Cucurbita maxima L.). J. Food Qual. 2016, 38, 580–589. [Google Scholar] [CrossRef]
  70. Ciborowska, H.; Rudnicka, A. Nutrition—Dietary Guidelines for Healthy and Sick Individuals; Medical Publishing House: Warsaw, Poland, 2014; p. 658. (In Polish) [Google Scholar]
  71. Zhu, F.; Cai, Y.Z.; Ke, J.; Corke, H. Compositions of phenolic compounds, amino acid and reducing sugars in commercial potato varieties and their effects on acrylamide formation. J. Sci. Food Agric. 2010, 90, 2254–2262. [Google Scholar] [CrossRef]
Figure 1. The effect of potassium fertilization on the ά-tocopherol content of tubers in the analyzed Jerusalem artichoke cultivars. Means with the same letters do not differ significantly at p ≤ 0.05 in Tukey’s test. The absence of letters denotes non-significant main effects.
Agronomy 10 01518 g001
Figure 2. The effects of irrigation and potassium fertilization on the ά-tocopherol content of tubers in the analyzed Jerusalem artichoke cultivars. Means with the same letters do not differ significantly at p ≤ 0.05 in Tukey’s test. The absence of letters denotes non-significant main effects.
Agronomy 10 01518 g002
Figure 3. The effect of potassium fertilization on the glutamic acid content of tubers in the analyzed Jerusalem artichoke cultivars. Means with the same letters do not differ significantly at p ≤ 0.05 in Tukey’s test. The absence of letters denotes non-significant main effects.
Agronomy 10 01518 g003
Figure 4. The effect of potassium fertilization on the phenylalanine content of tubers in the analyzed Jerusalem artichoke cultivars. Means with the same letters do not differ significantly at p ≤ 0.05 in Tukey’s test. The absence of letters denotes non-significant main effects.
Agronomy 10 01518 g004
Figure 5. The effect of irrigation on the valine content of tubers in the analyzed Jerusalem artichoke cultivars. Means with the same letters do not differ significantly at p ≤ 0.05 in Tukey’s test. The absence of letters denotes non-significant main effects.
Agronomy 10 01518 g005
Figure 6. The effect of irrigation on the arginine content of tubers in the analyzed Jerusalem artichoke cultivars. Means with the same letters do not differ significantly at p ≤ 0.05 in Tukey’s test. The absence of letters denotes non-significant main effects.
Agronomy 10 01518 g006
Figure 7. The effect of irrigation on the glutamic acid content of tubers in the analyzed Jerusalem artichoke cultivars. Means with the same letters do not differ significantly at p ≤ 0.05 in Tukey’s test. The absence of letters denotes non-significant main effects.
Agronomy 10 01518 g007
Figure 8. The effect of irrigation on the proline content of tubers in the analyzed Jerusalem artichoke cultivars. Means with the same letters do not differ significantly at p ≤ 0.05 in Tukey’s test. The absence of letters denotes non-significant main effects.
Agronomy 10 01518 g008
Table 1. F-test statistics in ANOVA.
ParameterCv.KIrrigation (IR)Cv. × KCv. × IRK × IRCv. × K × IR
α-Tocopherol1.899 ns6.254 **2.850 ns6.161 **0.053 ns7.787 **2.426 ns
% α-Tocopherol in total tocopherols1.428 ns5.678 **0.004 ns2.830 ns1.766 ns1.098 ns1.541 ns
β-Carotene1.558 ns0.932 ns10.066 **0.371 ns0.010 ns1.370 ns1.370 ns
Retinol equivalents1.578 ns0.928 ns10.061 **0.376 ns0.010 ns1.395 ns0.496 ns
Alanine4.001 *0.711 ns14.589 **0.563 ns1.253 ns0.879 ns1.653 ns
Arginine17.560 ***0.199 ns10.283 **1.113 ns5.001 *0.396 ns2.395 ns
Glycine5.258 *0.717 ns23.100 **1.329 ns2.885 ns0.119 ns2.127 ns
Histidine0.482 ns0.607 ns13.105 **0.519 ns1.017 ns0.151 ns1.236 ns
Aspartic acid7.032 **1.674 ns0.944 ns1.463 ns0.729 ns0.144 ns1.710 ns
Glutamic acid20.094 **4.917 *8.103 *3.383 *5.050 *1.457 ns1.505 ns
Proline2.472 ns1.399 ns11.632 **2.266 ns5.884 *1.765 ns1.611 ns
Serine2.120 ns0.276 ns9.025 **0.620 ns1.495 ns0.235 ns1.078 ns
Threonine4.229 *0.532 ns17.101 **0.712 ns1.564 ns0.068 ns1.669 ns
Isoleucine6.208 **0.196 ns17.926 **1.614 ns1.617 ns0.131 ns1.562 ns
Leucine8.587 **0.803 ns21.939 **1.109 ns3.340 ns0.389 ns2.297 ns
Lysine1.004 ns0.160 ns4.445 *0.543 ns0.677 ns0.018 ns0.400 ns
Methionine1.369 ns0.141 ns0.435 ns0.265 ns0.381 ns0.494 ns0.690 ns
Cystine1.695 ns0.231 ns1.326 ns0.232 ns0.338 ns0.980 ns0.716 ns
Phenylalanine3.666 *2.447 ns25.538 **3.391 *3.268 ns0.481 ns1.215 ns
Thyrosine29.488 ***0.061 ns1.565 ns0.817 ns0.921 ns0.154 ns1.911 ns
Tryptophan1.610 ns0.093 ns0.127 ns0.093 ns0.129 ns0.219 ns0.261 ns
Valine7.553 **0.501 ns23.428 **1.121 ns3.981 *0.442 ns1.734 ns
* Significant at p < 0.05, ** significant at p < 0.01, *** significant at p < 0.001, ns–not significant.
Table 2. Meteorological data for the growing season of 2018 and long-term average for 1981–2010.
SpecificationMonth
AprilMayJuneJulyAugustSeptemberOctoberNovember
Mean air temperature (°C)10.815.717.219.719.214.58.73.3
1981–20107.713.516.118.717.912.88.02.9
Rainfall total (mm)33.525.053.7141.044.620.384.716.0
1981–201033.358.580.474.259.456.942.644.8
Water requirements of late-maturing potato varieties [40]-6274977950--
Table 3. The effect of experimental factors on the vitamin content of Jerusalem artichoke tubers.
Parameterα-Tocopherol
(mg kg−1 Lyophilisate)
α-Tocopherol
(% Total Tocopherols)
β-Carotene
(mg kg−1 Lyophilisate)
Retinol Equivalents
Cultivar
Violette de Rennes2.0476.10.82137
Waldspindel2.5570.20.83138
Topstar2.0271.20.97162
Potassium fertilization (kg K2O ha−1)
1501.60 b68.0 b0.81135
2502.35 ab69.8 b0.94157
3502.65 a79.6 a0.88147
Irrigation
Irrigated2.57 a72.40.75 b125 b
Not irrigated1.83 b72.61.00 a167 a
Means with the same letters do not differ significantly at p ≤ 0.05 in Tukey’s test. The absence of letters denotes non-significant main effects.
Table 4. The effect of experimental factors on the content of essential amino acids (g 100 g−1 of protein) in Jerusalem artichoke tubers.
ParameterIsoleucineLeucineLysineMethionineCysteinePhenylalanineThyrosineTryptophanValine
Cultivar
Violette de Rennes2.12 b2.99 b3.720.590.4334.79 b1.41 b0.672.59 b
Waldspindel2.09 b2.97 b3.940.670.5325.01 ab2.44 a0.822.56 b
Topstar2.49 a3.48 a4.230.760.5705.36 a2.82 a0.682.98 a
Potassium fertilization (kg ha−1)
1502.203.083.990.690.5234.982.220.712.70
2502.223.113.860.640.4824.872.200.722.65
3502.283.254.060.690.5315.322.260.752.77
Irrigation
Irrigated2.02 b2.88 b3.66 b0.650.4764.62 b2.320.712.47 b
Not irrigated2.45 a3.41 a4.28 a0.700.5485.49 a2.130.742.95 a
Means with the same letters do not differ significantly at p ≤ 0.05 in Tukey’s test. The absence of letters denotes non-significant main effects.
Table 5. The effect of experimental factors on the content of endogenous amino acids (g 100 g−1 of protein) in Jerusalem artichoke tubers.
ParameterAlanineArginineGlycineHistidineAspartic acidGlutamic acidProlineSerineThreonine
Cultivar
Violette de Rennes3.04 b16.86 b2.69 b2.108.92 a9.84 a2.992.182.63 b
Waldspindel3.23 ab22.07 a2.75 ab2.147.34 b7.31 b2.282.242.73 ab
Topstar3.50 a14.68 b3.11 a2.227.43 b8.08 b2.552.503.11 a
Potassium fertilization (kg K2O ha−1)
1503.2317.832.812.118.408.90 a2.522.262.76
2503.1817.482.792.137.677.68 b2.912.292.78
3503.3718.292.952.237.628.64 ab2.392.382.93
Irrigation
Irrigated3.00 b19.55 a2.58 b1.98 b7.718.88 a3.05 a2.11 b2.52 b
Not irrigated3.51 a16.19 b3.13 a2.33 a8.097.93 b2.16 b2.51 a3.12 a
Means with the same letters do not differ significantly at p ≤ 0.05 in Tukey’s test. The absence of letters denotes non-significant main effects.
Table 6. Nutritional value of protein in tubers of the analyzed Jerusalem artichoke cultivars.
Amino Acids
(g 100 g−1 of Protein)
cv. Topstarcv. Waldspindelcv. Violette de Rennes
MeanCSEAAIMeanCSEAAIMeanCSEAAI
Isoleucine2.4988.9078.002.0974.6071.002.1278.2066.00
Leucine3.4852.702.9745.002.9945.30
Lysine4.2372.903.9467.903.7264.30
Methionine + Cysteine1.3353.201.2048.001.0240.80
Phenylalanine + Tyrosine8.18129.807.45118.206.2098.40
Tryptophan0.6861.800.8274.500.6760.90
Valine2.9885.102.5673.102.5974.00
Chicken egg albumin as the reference standard (WHO/FAO/UNU 2007) (g 100 g1 of protein): isoleucine-2.80; leucine-6.60; lysine-5.80; methionine + cysteine-2.50; phenylalanine + tyrosine-6.30; tryptophan-1.10; valine-3.50.
Table 7. The effect of potassium fertilization on the nutritional value of protein in Jerusalem artichoke tubers.
Amino Acids
(g 100 g−1 of Protein)
150 kg K2O ha−1250 kg K2O ha−1350 kg K2O ha−1
MeanCSEAAIMeanCSEAAIMeanCSEAAI
Isoleucine2.2078.5771.002.2279.2870.002.2881.4374.00
Leucine3.0846.673.1147.123.2549.24
Lysine3.9968.793.8666.554.0670.00
Methionine + Cysteine1.2148.401.1244.801.2248.80
Phenylalanine + Thyrosine7.20114.287.07112.227.58120.32
Tryptophan0.7164.540.7265.450.7568.18
Valine2.7077.142.6575.712.7779.14
Chicken egg albumin as the reference standard (WHO/FAO/UNU 2007) (g 100 g−1 of protein): isoleucine-2.80; leucine-6.60; lysine-5.80; methionine + cysteine-2.50; phenylalanine + tyrosine-6.30; tryptophan-1.10; valine-3.50.
Table 8. The effect of irrigation on the nutritional value of protein in Jerusalem artichoke tubers.
Amino Acids
(g 100 g−1 of protein)
IrrigationNo Irrigation
MeanCSEAAIMeanCSEAAI
Isoleucine2.0272.1467.002.4587.5076.00
Leucine2.8843.643.4151.67
Lysine3.6663.104.2873.79
Methionine + Cysteine1.1345.201.2550.00
Phenylalanine + Thyrosine6.94110.167.62120.95
Tryptophan0.7164.540.7467.27
Valine2.4770.572.9584.28
Chicken egg albumin as the reference standard (WHO/FAO/UNU 2007) (g 100 g−1 of protein): isoleucine-2.80; leucine-6.60; lysine-5.80; methionine + cysteine-2.50; phenylalanine + tyrosine-6.30; tryptophan-1.10; valine-3.50.

