Article

Nutritional Relationships in Bitter Pit-Affected Fruit and the Feasibility of Vis-NIR Models to Determine Calcium Concentration in ‘Fuji’ Apples

by
Claudia Bonomelli
1,
René Mogollón
1,
Sergio Tonetto de Freitas
2,
Juan Pablo Zoffoli
1 and
Carolina Contreras
1,3,*
1
Facultad de Agronomía e Ingeniería Forestal, Pontificia Universidad Católica de Chile, Vicuña Mackenna 4860, P.O. Box 7820436, Santiago 7820244, Chile
2
Brazilian Agricultural Research Corporation, EMBRAPA, Rodovia BR-428, Km 152, Zona Rural, Caixa Postal 23, CEP 56302-970, Petrolina PE 56302-970, Brazil
3
Instituto de Producción y Sanidad Vegetal, Facultad de Ciencias Agrarias y Alimentarias, Universidad Austral de Chile, Isla Teja S/N, Valdivia 5110566, Chile
*
Author to whom correspondence should be addressed.
Agronomy 2020, 10(10), 1476; https://doi.org/10.3390/agronomy10101476
Submission received: 17 August 2020 / Revised: 20 September 2020 / Accepted: 21 September 2020 / Published: 27 September 2020
(This article belongs to the Special Issue Mineral Nutrition of Fruit Trees)

Abstract

:
‘Fuji’ is among the most cultivated apples worldwide but affected by the disorder bitter pit (BP). Calcium deficiency plays an important role on fruit susceptibility to BP. The objectives of this study were to determine nutritional relationships in BP-affected fruit and to verify if Vis-NIR models can predict Ca concentration in ‘Fuji’ apples. Fruit was harvested during 2018 season from two different orchards with historical high BP incidence. Seven hundred and fifty apples were stored at 0 °C for 150 days plus 10 days at 20 °C for BP assessments. After storage, 20 fruit with BP symptoms (BP+) and 20 healthy fruit (BP−) were assessed individually for mineral concentration. Vis-NIR evaluation involved a spectra range from 285 to 1200 nm to predict Ca concentration from ‘Fuji’ powder enriched Ca solutions. In each orchard, healthy apples had significantly higher Ca concentration than apples with BP. The K/Ca and Mg/Ca ratios were significantly lower in healthy fruit compared with BP− affected fruit. The relationship B/Ca proved to be significant in BP fruit. Although Ca interaction with organic substances and/or cellular structures could influence NIR spectra in fresh fruit, our results showed that Vis-NIR models could not be used to direct prediction of fruit Ca concentration.

1. Introduction

The ‘Fuji’ apple has become the most popular commercial apple cultivar in the Asian market due to its distinctive crispness, sweetness, and attractive appearance with a high price among the traditional cultivars [1]. Chile is the leading producer in the Southern Hemisphere with 32% of the total production and the world’s fourth largest exporter [2], with ‘Fuji’ among the most important varieties. Commonly, ‘Fuji’ is classified as low susceptible bitter pit (BP) cultivar [3]; however, the susceptibility increases in years of low yield and bigger fruits associated to its alternate (biennial) bearing characteristic [4].
In the 1930′s, bitter pit was already a subject of study for many researchers. In these early years, the idea of a nutritional unbalance was already hypothesized, as well the possibility that a ‘failure’ in the vascular system could be related to nutritional changes leading to BP incidence in the fruit [5,6]. Askew et al. [7] also studied the incidence of pitting and the numerical ratios of nutrient for diagnostic purposes. All these studies lead to the conclusion that the primary elements involved in BP are Ca, Mg, K, and N. In the 1960′s, Martin et al. [8] reported in low Ca-treated trees that Ca is the main nutrient that affects the balance with the other elements. According to more recent studies, BP has been described as a deficiency of Ca in fruits caused by low total Ca levels or by not being in the available forms at specific cellular compartments [3,9]. The Ca role in plant cells is associated with its nature as a secondary messenger, stabilizer of the cell wall and cell membrane [10], which makes it a primary element for fruit quality and its postharvest life. In addition to Ca levels, the ratio of this nutrient with others such as Mg, K, and N can play a more important role in cell and tissue metabolism than the role of each nutrient alone [11].
Several studies have been carried out to predict BP and many commercial methods are based on total Ca concentration or the ratio between Ca and other nutrients in the fruit [3,12,13]. It has been indicated by different authors that performing mineral analyzes on fruit between 20–40 days before harvesting can serve as an indicator of fruit susceptibility to BP incidence during storage [14]. It has also been proposed that a ‘passive method’, which assesses BP symptoms in fruit collected between 10–30 days before harvest and left at room temperature, may predict the risk of BP incidence in the fruit after harvest [15]. Al Shoffe et al. [16] also proposed the ‘passive method’ to be more straightforward for storage operators, and with good or even superior correlation with BP incidence than mineral analysis. Unfortunately, there is no rapid mineral test and the measurement of Ca concentration and its relationships with other nutrients, such as Ca/K, Mg/Ca and K + Mg/Ca, in laboratories have not been efficient at a commercial level [16,17].
In the last decades, the use of Vis-NIR spectroscopy as a non-destructive technique has been studied for determining quality parameters in fruit and vegetables [18]. Although NIR radiation does not present energy absorption for macro and micro nutrients, a different concentration of those could affect NIR spectra when they are binding to organic substances and/or to cellular structures, such as the cell wall, proteins, and membrane [19]. Due to this, reflectance in the Vis-NIR range has been used to determine nutritional conditions of agricultural products in a fast and low-cost way [20]. Partial least squared modeling using NIR spectra has been shown to have high accuracy rate estimating N and Ca contents in citrus fruit [21]; other minerals such as phosphorus, boron, copper, and Mg did not achieve acceptable regression coefficients [22]. Other reports have shown good prediction on other nutrient such as K [18] on grapes and rice, and copper and phosphorus in mate plants [23].
It is known that NIR radiation is not absorbed by ionic nutrients, such as Ca. However, we hypothesize that Ca binding to organic substances and/or to cellular structures, such as the cell wall, proteins and membrane, could affect NIR spectra, which could be used to develop models to predict Ca concentration in the fruit. The objectives of this study were to determine the nutritional relationships with BP incidence, and to develop VIS-NIR models to predict Ca concentration in ‘Fuji’ apples.

2. Materials and Methods

2.1. Plant Material

‘Fuji’ apples were harvested in April 2018 from two different orchards. The first orchard was located in Longaví (Central Valley) (36°00′00″ S 71°40′11″ W) and the second in Coihue (Southern Chile) (37°33′39.7″ S 72°36′01.3″ W), both orchards had records of high BP incidence during several years.
Seven hundred and ninety apples were picked from each orchard and transported to the Postharvest Laboratory at the Catholic University of Chile, Santiago, Chile. Initial fruit maturity was assessed on 20 randomly selected fruit from each orchard, and other group of 20 random apples (4 replicates, and 5 fruits per replicate) were analyzed at harvest for mineral concentration. The remainder 750 apples were stored at 0 °C for 150 days plus 10 days at 20 °C. At the end of the storage time, 20 fruit with BP and 20 healthy fruit were assessed for mineral concentration for each orchard.

2.2. Mineral Sampling

Each apple was cut in half through the equator, the calyx half was used for the mineral assessments since this tissue is more susceptible to BP in the fruit. The stem half was discarded. Each apple was labeled in the four cardinal points in a clockwise direction. The same cardinal points were sampled in each apple and all samples were taken from three out of four cardinal points. The fourth cardinal points were stored at −80 °C for further molecular analyses. In each labeled cardinal point, three cylinders of flesh tissue (peel included) were cut in a vertical direction from top to the bottom of the halved apple with a cork borer of 1 cm in diameter. Each flesh cylinder was 1 cm width × 4 cm in length. In order to complete ~22 g of fresh weight tissue, a total of nine cylinders were sampled, i.e., three cylinders per each cardinal point. The fresh weight of the nine cylinders was determined, and then placed in a glass petri dish for further mineral analyses. Twenty apples in total were analyzed and each mineral data corresponded to one apple.
Fruit samples were weighed with a digital balance (Shanghai SP-300, Shanghai Huade Weighing Apparatus Co., Shanghai, China) to determine the total fresh weight, and thereafter were oven-dried for 48 h at 65 °C until constant weight to obtain the dry matter content. Nutrient concentrations were determined by dry combustion until components were converted to ash. The following nutrients were determined according to Ryan et al. [24]: Ca, K, Mg, P, B, Cu, Fe, Mn, and Zn. The ash tissue samples were then dissolved in HCl (2 M), and concentrations were determined by Inductively Coupled Plasma—Optical Emission Spectroscopy (ICP-OES) (Agilent 720 ES axial—Varian, Mulgrave, Victoria, Australia). The N concentrations were determined with a LECO CNS-2000 Macro Elemental Analyzer (Leco, St. Joseph, MI, USA).

2.3. Soil Sampling

Soil samples (one composite sample per orchard) were collected in December 2018. Each composite soil sample (~1000 g per sample) consisted of 5 sub-samples taken from 0–20 cm depth near the canopy drip line. The soil samples were dried at 40 °C, sifted through a 2 mm mesh screen and weighed, then agitated for 30 min, filtered, and all exchangeable cations were measured by extracting them from the soil by 1 N ammonium acetate at pH 7.0. Then extractions were analyzed by an ICP-Optical Emission Spectroscopy Agilent 720 ES axial—Varian (Victoria, Australia) according to Sparks [25]. The pH and electric conductivity (EC) were determined using EC meter model 852 (Schott Gerate, Mainz, Germany).

2.4. Bitter Pit Assessment

Each fruit of the 750 apples was visually evaluated at 0, 10, 30, 50, 70, 90, 110, 130, and 150 days of storage at 0 °C to detect BP symptoms. Bitter pit incidence was calculated as the number of affected fruits and expressed as percentages. In order to quantify BP severity, a visual quantification was carried out and the number of pits per fruit were registered.

2.5. NIR Approach to Predict Ca Concentration

Our previous and other studies have suggested that NIR spectroscopy can be used to determine Ca concentration in fresh fruit [21], which could be used to monitor apple susceptibility to BP. However, there are no studies to understand if the NIR models determine Ca concentration in the fruit by direct NIR interaction with Ca, or by indirect NIR interaction with Ca-related organic substances and/or cellular structures. Therefore, in order to determine if NIR models could be used to directly predict Ca concentration in the fruit, 16 ‘Fuji’ apples harvested from orchard 1 were lyophilized (tissue and peel), and subsequently ground into 36 g of fine apple powder. Apple powder was used to ensure the same chemical and structural sample, varying only the Ca concentrations. This approach was used to understand if NIR models could directly determine Ca concentration in apples, excluding all chemical and structural differences indirectly related with Ca concentration in the sample. The apple powder was carefully mixed to obtain a homogenous mixture. The powder was then mixed with Ca at the concentration of 0, 0.8, 2, 4, 8, 11.2, 15.2, 19.2, 22, and 25.2 Ca/L. This range of concentrations was based on the Ca concentrations found in the mineral analysis described above. Each sample had 1.8 g of homogenous apple powder and a total final volume of 10.2 mL. The Ca stock solution was made with 1.1076 g of CaCl2 (Sigma Aldrich, Parque Rincao-Cotia, SP, Brazil) diluted in 100 mL of distillated water to obtain 4 g Ca/100 mL. Since NIR spectra is sensible to water content in the sample, each solution was constructed with different volumes of the stock solution and distilled water to obtain a final volume of 10.2 mL in each solution.
Each apple powder and Ca mixture was prepared in a petri dish, and two replications per Ca concentration. NIR spectra were collected using a spectrometer model F-750 Produce Quality Meter (Felix Instruments, Camas, WA, USA) with a spectra range from 285 to 1200 nm and spectral definition of 3 nm. The data were collected in reflectance mode, after 30 min of mixing apple powder with the stock solution.

2.6. Statistical Analyses

For the BP analysis, the experimental design was completely randomized with a factorial combination of orchards (orchard 1 and orchard 2) and BP (BP+: apples with BP symptoms, and BP-: healthy apples). Each fruit of the 750 apples was a unique replicate and no treatments were applied. A two-way ANOVA was performed using the available software R v.3.1.2 (R Development Core Team 2008, Vienna, Austria). For the NIR analysis, predictive models were performed using original spectral data collected, and spectral curves with standard normal variate (SVN) as pre-processing. A two-way ANOVA was performed between spectral intensities and Ca concentrations using software R v.3.1.2 (R Development Core Team, 2008).

3. Results

3.1. Mineral Concentration in Healthy and BP-Affected Fruit

The levels of BP incidence and severity are shown in Table 1. The disorder first appeared after 50 days of storage in both orchards, and by the end of the storage orchard 1 had a 5.6% incidence and orchard 2 a 3.6%. In both orchards, the severity of BP plateaued at ~4 pits per fruit in average after 90 days of storage and did not increase for the rest of storage time.
The soil taxonomy of orchard 1 corresponds to Fluventic Xerochrepts and orchard 2 corresponds to Andic Xerochrepts according to the Soil Taxonomy-USDA. In addition, the soil analyses performed before harvest showed that the nutrient supplies were in adequate ranges (Table S1).
In regard to nutrient analyses in the fruit, orchard 2 showed higher K concentrations in the apples at harvest compared to orchard 1, whereas Ca, Mg, and P had similar values between orchards (Table 2).
After 150 days of storage, fruit with and without BP showed different mineral composition (Figure 1). For all nutrients, there were significant differences between orchard 1 and 2, showing orchard 1 higher concentrations of N, Ca, and Mg, and orchard 2 higher concentrations of K. As for healthy and BP+ fruit, Ca concentrations showed significant differences at orchard level in healthy fruit, whereas in BP+ fruit, Ca decreased with both orchards having similar Ca levels (Figure 1). On the other hand, K concentration was slightly higher in BP affected fruit. In addition, other minerals such as B, P, Cu, Mn, and Zn did not show significant changes that allow to stablish a relationship with BP incidence in the fruit. Only Fe had significant differences showing higher levels on BP+ fruit for both orchards (Figure S1).
Even though there was no BP incidence difference between orchards, relevant differences were found at nutritional level within the fruit (BP− and BP+) and in the nutritional relationships. The mineral ratios showed no differences between the two orchards at harvest for B/Ca and Mg/Ca, whereas N/Ca, N/B, K/Ca, K/Mg, and (K + Mg)/Ca ratios showed significant differences between orchards.
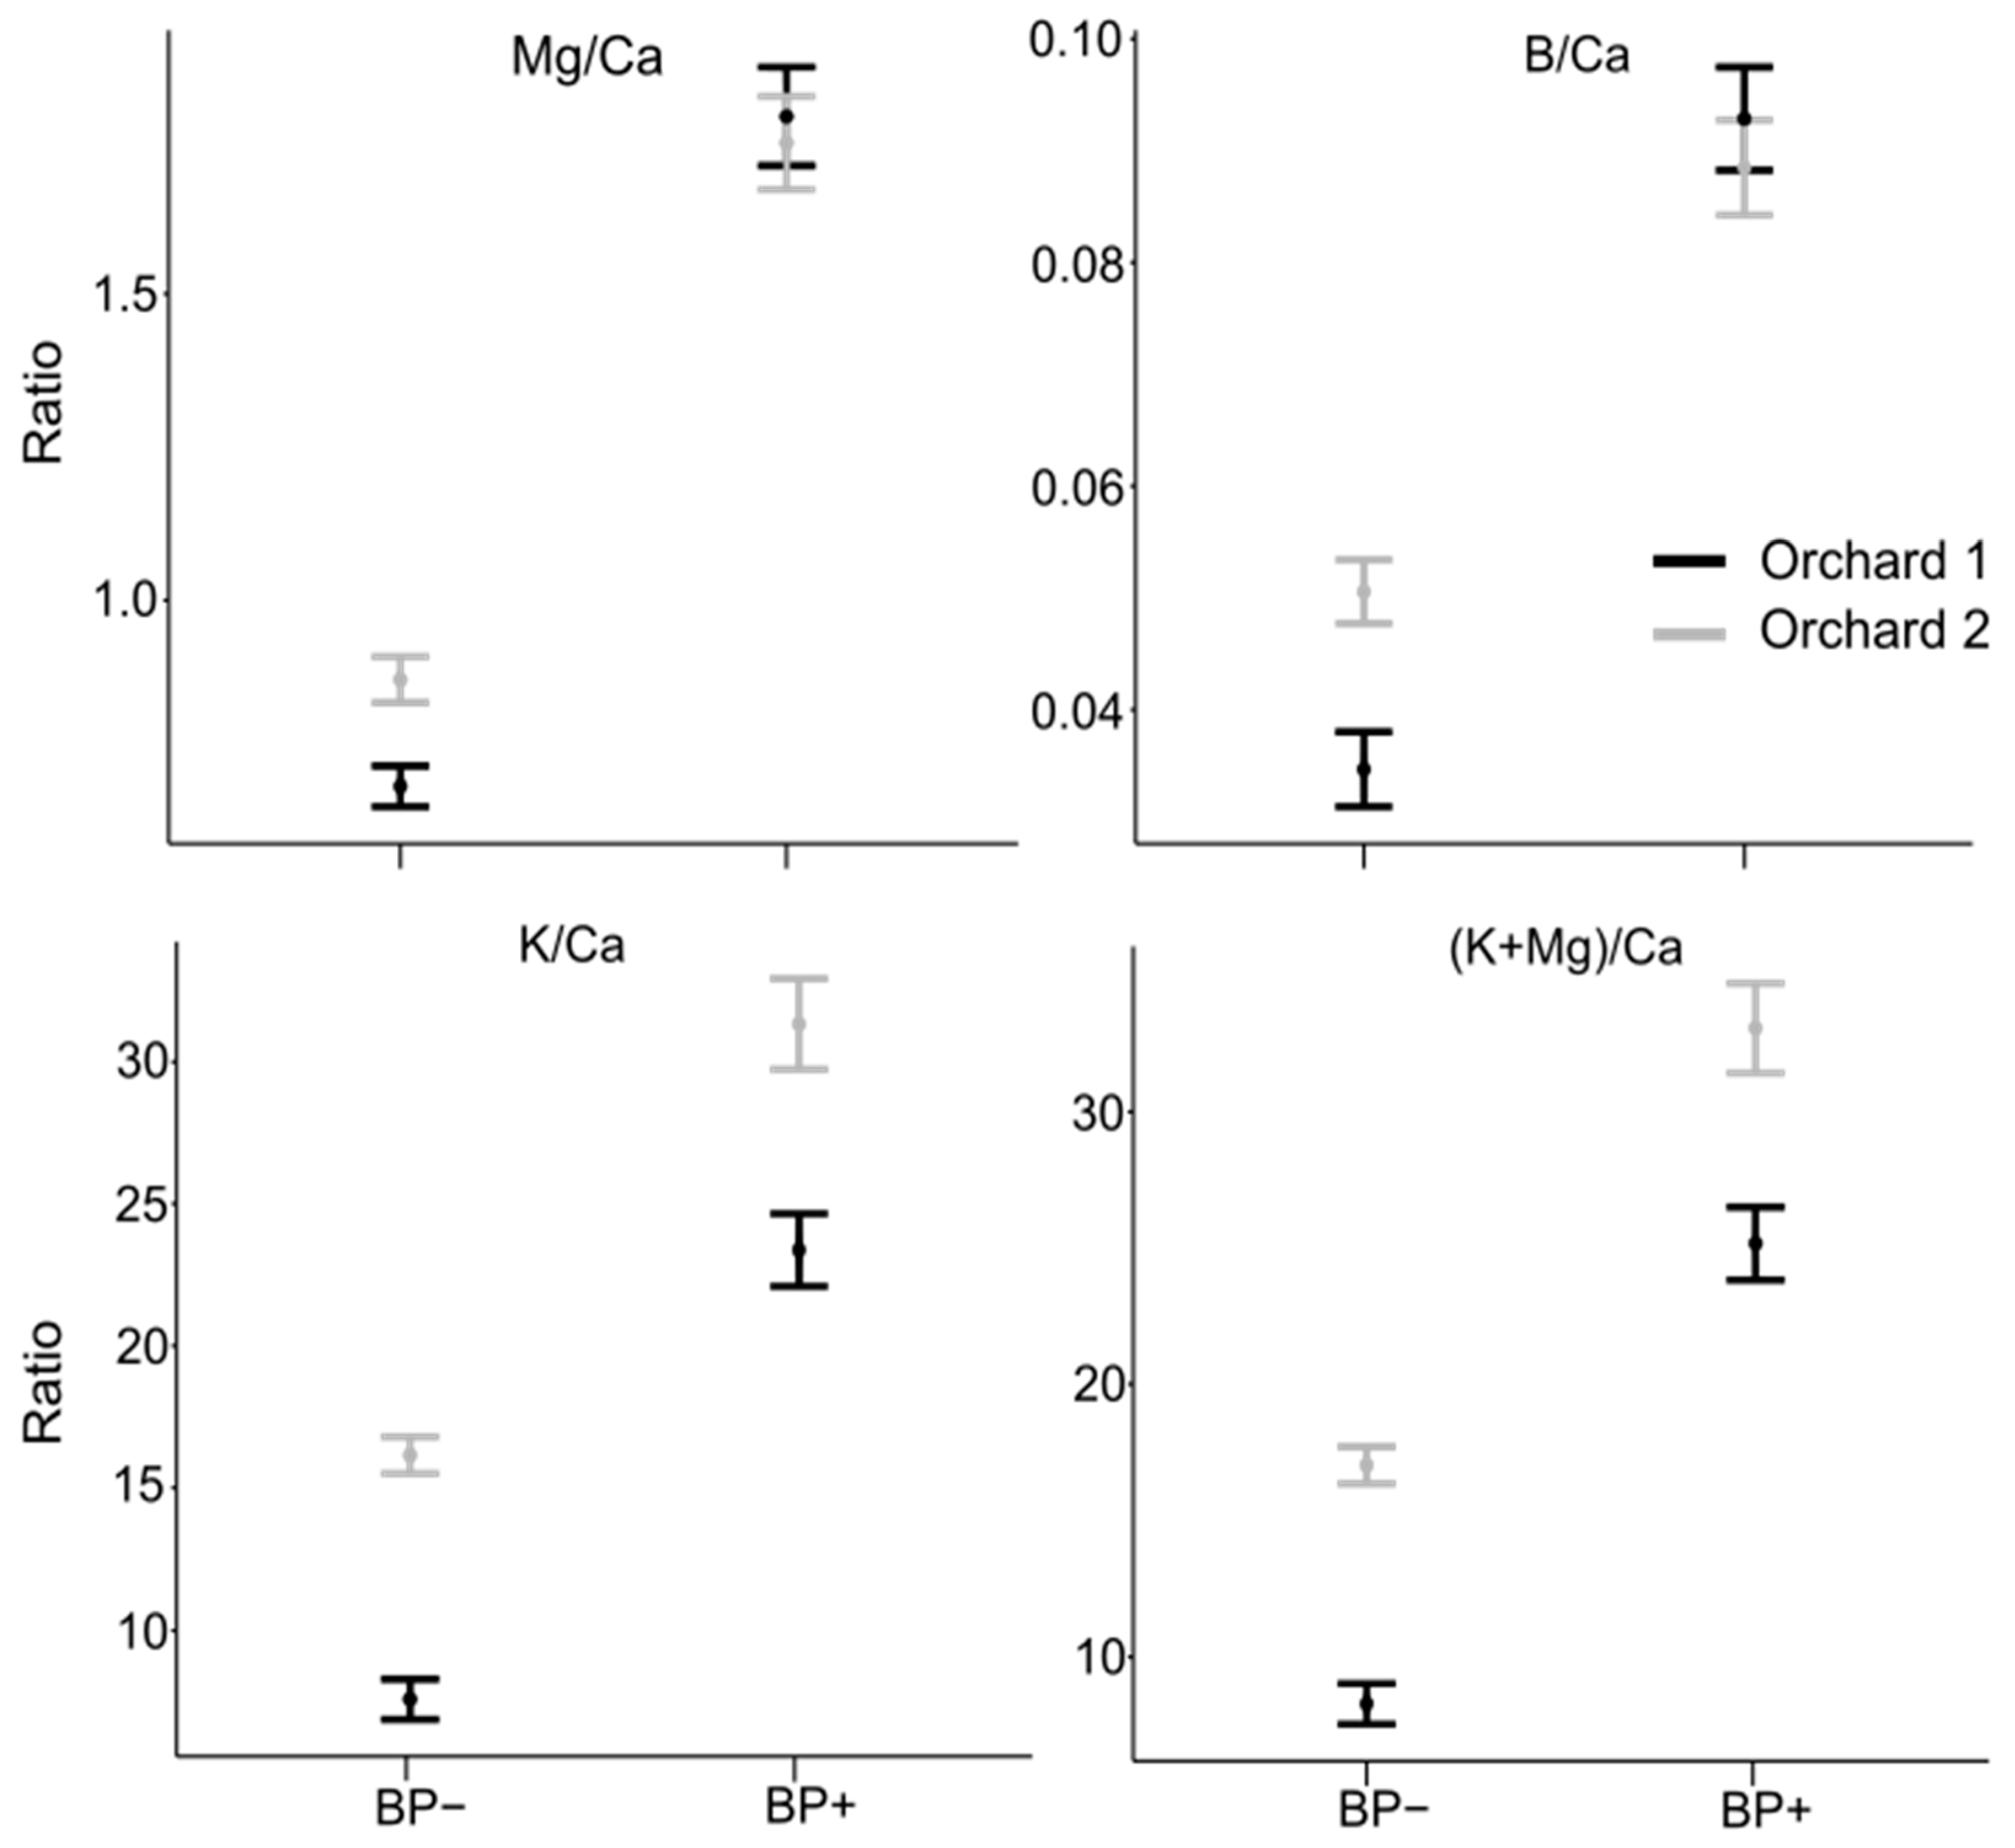
After 150 days at 0 °C the mineral relationships studied showed that there were significant differences at orchard level (Figure 2). In addition, a significant and interesting pattern was found in Ca-related nutrient concentrations (Mg/Ca, B/Ca, K/Ca, and (K + Mg)/Ca) in fruit BP− or BP+ (Figure 2). The ratios were always higher in BP affected fruit regardless the orchard. Other nutrient relationships such as K/Mg and N/Ca also showed differences, but only in orchard 1 in fruit with BP symptoms (Figure S2).

3.2. Principal Component Analysis (PCA) for Mineral Concentrations

Mineral data from both orchards were subjected to principal component analysis (PCA) to describe the mineral behavior in fruit with BP and without BP (Figure 3). In orchard 1, BP symptoms were related to low concentrations of Ca, Zn, Mn, and Cu and high concentrations of K, P, Fe, and B (Figure 3A). Orchard 2 showed similar results to orchard 1, except for Mg concentration, which was higher in fruit with BP (Figure 3B), however, this mineral does not fully explain the symptom appearance.
A PCA performed with mineral dataset combined (orchard 1 and 2) corroborated that BP incidence is highly related to lower concentrations of Ca, Zn, Mn, and Cu and high concentrations of K and Fe (grouped eigenvectors with similar eigenvalues) (Figure 3C). Whereas other minerals such as, N, Mg, B, and P may not be directly related to the BP incidence since their eigenvalues and eigenvectors showed a greater dispersion in the PCA biplot (Figure 3C).
Seven different mineral relationships were studied (N/B, N/Ca, B/Ca, K/Ca, K/Mg, (K + Mg)/Ca, and Mg/Ca) in order to find mineral relationships that might explain and/or correlate with the BP symptoms. N/B relationship did not show any correlation with bitter pit symptoms when PCA was performed for each orchard or both datasets, while Mg/Ca, B/Ca, K/Ca, and (K + Mg)/Ca showed high positive correlation with BP+ fruit in each analysis (Figure 3D–F). These four mineral relationships (Mg/Ca, B/Ca, K/Ca, and (K + Mg)/Ca) showed a high ratio in fruits with BP symptoms regardless of the orchard (1 or 2) (Figure 3D–F).
Unlike the previous relationships, the K/Mg, N/Ca, and N/B relationships evidenced differences between healthy and fruit with BP but with a clear influence of the orchard (Figure S2).

3.3. NIR Approach to Predict Ca Concentration

The reflectance spectra collected showed two peaks: one at 650 and another at 670 nm. Higher reflectance spectra showed a flat region between 700 nm and 950 nm where a greater variability of the spectra was observed (Figure 4A). Between 720 and 820 nm, all mean spectral curves (different Ca concentrations) showed the greatest dispersion (Figure 4B). In addition, 720 nm was the wavelength that showed peaks for all Ca concentrations. Therefore, the 720 nm wavelength was selected to study correlation between reflectance intensities and the different concentrations of enriched Ca powder studied.
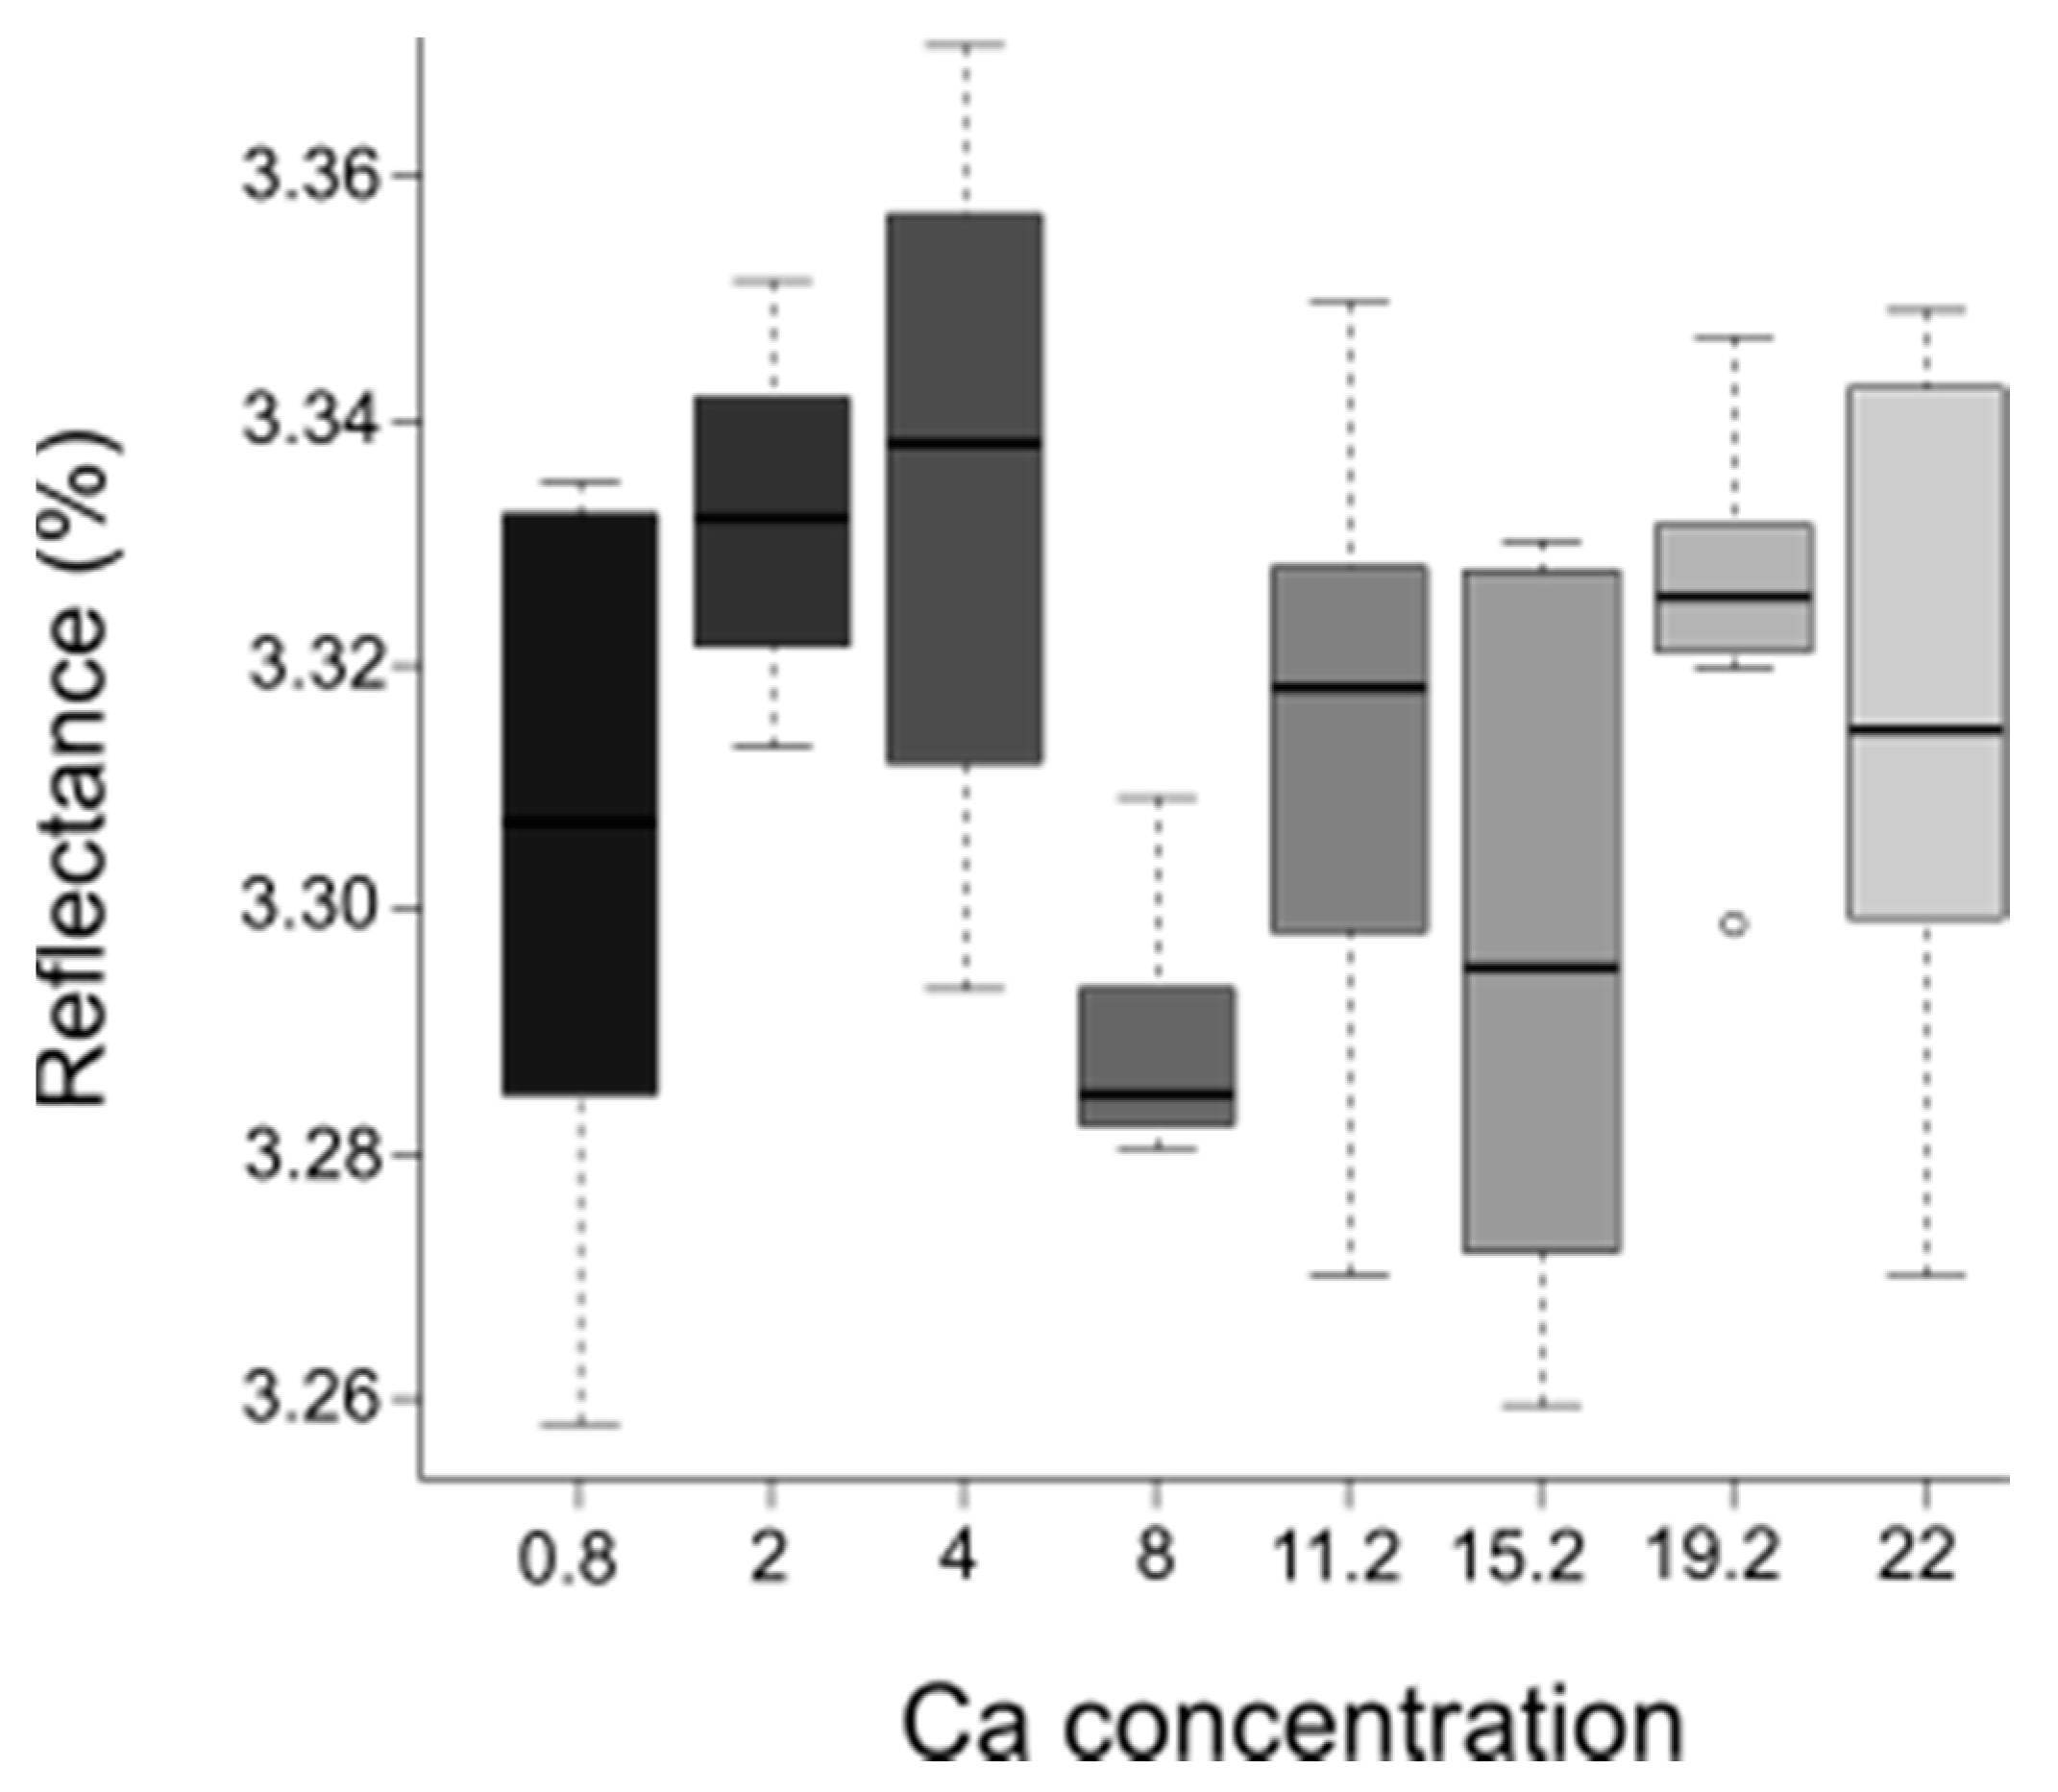
After observing the mean reflectance for each Ca concentration, there is no evidence of a pattern that relates different Ca concentrations with changes in the spectrum, in other words, it was not observed changes in spectra intensities following the changes in Ca concentrations (Figure 5). This analysis was repeated performing a pre-processing to the NIR data (SVN) to reduce the noise, but this process only reduces the gap between spectra and did not allow observing a relationship between spectra and Ca concentration in the sample (data not shown).

4. Discussion

Our understanding of BP leads us to the fact that this physiological disorder does not depend only on the Ca concentration in the fruit, but also on its balance with other nutrients such as K, Mg, and N [26]. Nearly sixty years ago, Bünemann [6] studied the nutrient concentrations in pit-affected areas and healthy tissue, and found a relationship between nutrients and BP, since the disorder did not develop upon Ca deficiency alone. In addition, he observed lower values of Ca, N, and K in the ‘pitted’ tissues and higher concentrations of Mg than in the healthy tissue, the same as Askew et al. [7] where they reported four-fold more Mg in pitted tissue. Mg is antagonist to Ca which could be explained by the absorption (soil supply, irrigation, or white roots growth), or by the distribution of Ca inside the plant. We found higher amounts of Mg only in orchard 1, suggesting that there is a strong orchard factor determining fruit nutrient concentration. Orchard 1 always showed higher N levels, which may be related to NH4 fertilization, and therefore, an antagonism to Ca absorption. Martin et al. [8] induced low-Ca-levels trees for five years, and found high levels of Mg, K, and N, concluding that low Ca had produced a ‘striking disturbance in the mineral balance’. In the case of N, this mineral favors vegetative growth, which increases leaf area that favors xylemic Ca movement into the leaves and away to the fruit, in addition to generating a dilution of the fruit Ca content due to higher growth rates, similar to the effect of gibberellins [17]. On the other hand, if the nitrogen source is NH4+, there is competition with Ca for root uptake since both minerals are absorbed as cations [11,27]. Otherwise, ammonium toxicity has been reported to induce BP under controlled conditions [22]. Regarding Mg and K, if both are found in excessive levels in the soil, they generate competition at the electrochemical level, inhibiting root Ca uptake that can lead for fruit tissue deficiency [28] as probably happened in this study.
There is a vast amount of evidence that the relationship between Ca and other minerals are also involved in the development of BP. Our study was not the exception, and found the same mineral ratio trends reported in previous studies back in the 1960′s [7], or as new as Do Amarante et al. [29]. Both studies suggest there is a cationic competition that can be given by the favored absorption of N, K, and Mg relative to Ca or by its translocation and uptake into the fruit (Figure 2 and Figure 3). However, a high B/Ca ratio was found to be highly correlated to BP incidence in our study, which has been less studied than the other nutritional relationships. Boron is a micronutrient that can be toxic at low concentrations and affects the flowering and development of fruits and seeds [30]. There is a narrow margin between deficiency and toxicity boron concentration. The deficiency results in tearing of pollen bags and affects fruit set and development due to the role of B in their cell wall [30]. On the other hand, Hosseini et al. [31] reported that Zn treatments prevent the growth loss by B toxicity. Eraslan et al. [32] reported in tomato and pepper that B application treatments significantly affected nutrient concentrations. For example, under acid soil B alleviates Al toxicity via alkalization of the root zone [33]. Additionally, phosphorus can decrease the negative effects of B toxicity on plant growth [34,35]. In kiwifruit, Sotiropoulos et al. [36] reported that the presence of Ca in a nutrient solution significantly reduced B concentration and eliminated B toxicity. In addition, it has been demonstrated that high concentration of B in Malus domestica decreases calcium cytoplasm and inhibits pollen tube growth by disappearance of the cytoplasm calcium gradient [37]. The boron concentration increment against the decrease of Ca has also been observed in raps, where high boron concentration triggered recalcitrant Ca, or Ca attached to cell wall decreased causing deficiency disorders [38]. Recently, the mineral nutrient concentration in leaves and fruits (flesh and peel) of ‘Honeycrisp’ apple trees grown on a genetically diverse group of rootstocks were measured [39]. They induced the concentration of fruit and leaf phosphorus, potassium, and boron, which were all positively correlated with a higher BP incidence and fruit size. In other words, the leaf boron concentration displayed consistent positive correlation with potassium, and both nutrients have a negative relationship with calcium; concluding that the K/Ca ratio in leaves and fruits was the best BP predictor. In general terms, Ca and B have similarities in their role in the cell wall structure, their transport is primarily xylemic depending on the transpiration stream, and both have limited movement by phloem.
The mobility of nutrients by phloem would contribute to obtain nutrients from the soil under limiting conditions; thus, B may be supplied through redistribution from other plant tissues. According to Oertli and Richardson [40], B immobility cannot be explained by the absence of a phloem transport or chemical fixation, but rather by the local mobility of B at a short distance. Wang et al. [41] indicated that unlike herbaceous model plants, woody plants have B reserves and their regulation helps trees to cope with B deficiency. Picchioni et al. [42], for instance, observed that B reserves in the fruit trees retranslocated more than 70–80% to young tissues in apple, pear, and prune. On the other hand, Brown et al. [43] reported in a genetically modified tobacco for synthesizing sorbitol, that the mobility of B in the phloem can be triggered. Brown and Hu [44] demonstrated that B is mobile in species that produce significant amounts of sorbitol like Pyrus, Malus, and Prunus. Therefore, the main factor that confers phloem B mobility to a plant species is the synthesis of sugar alcohols and the subsequent transport of the B-sugar alcohol complex to sink tissues [45]. Thus, B absorption is especially benefited in species of Malus genus, since they are rich in polyols [46] such as mannitol, which favors B transport via phloem [47,48].
The fact that a high B/Ca ratio correlated with BP appearance suggests that other interactions/relationships may be occurring when the disorder manifests. In addition, this may be related to the role that B and Ca share in the cell wall formation and that there must be an optimal concentration relationship between them. The deficiencies and excesses of these two nutrients may be another factor that intervenes in the disorder, which requires further research.
All these ideas support the fact that Ca deficiency disorders are not caused only by the lack of minerals in the soil, but also by any variation that limits the ability of the wall to bind Ca [3]. Although there is still a limited understanding of BP and the mineral relationships associated to the ontogeny of the disorder, it seems there is a fine-tuning regulation in the development of BP in regard to mineral distribution or availability. A proposed model is shown in Figure 6, which includes B/Ca as one of the relevant relationships related to the appearance of BP in apples.
Regarding NIR, estimation of macro and micronutrients such as N, Ca, K, Cu, and P had been successful reported in citrus, grapes, rice, and mate plants [20,21,23]. Based on these results, Vis-NIR spectra could potentially detect different concentrations of mineral nutrients on any vegetal material. In our study, regression models for quantification of Ca in ‘Fuji’ apples were performed using reflectance spectrum between 285–1200 nm, however, the results obtained show that it is not possible to determine with high precision the Ca levels in apple fruit. In addition, no spectral pattern correlating mineral concentration with spectral intensity was found. Therefore, it was concluded that, at least in ‘Fuji’ apples, the concentration of Ca in the fruit cannot be directly estimated using Vis-NIR spectral data. Understanding that NIR radiation is not absorbed by ionic nutrients such as Ca, the use of NIR spectroscopy to determine such nutrients in plant tissues can only be accomplish by indirect calibration, in other words, by chemical and/or structural changes indirectly related with Ca concentration in the fruit.

5. Conclusions

In the present study, BP symptoms were related with the mineral composition of ‘Fuji’ apples. BP-affected fruit had the lowest calcium concentration on both orchards evaluated. In addition, high macronutrient ratios and calcium: N/Ca, Mg/Ca, K/Ca, and K + Mg/Ca, were found in BP symptomatic fruit. Likewise, the B (micronutrient)/Ca ratio was highly correlated with BP incidence in ‘Fuji’ apples. Further research needs to be done in order to determine the role of boron in BP disorder. The determination of Ca using non-destructive techniques has been successful in species such as citrus, grape, and mate leaf tissues, however in our study, no correlations were observed in apple tissues between the reflectance spectrum between 285–1200 nm. Therefore, we conclude that it is not feasible to determine calcium concentration in apple fruit using Vis-NIR.

Supplementary Materials

The following are available online at https://www.mdpi.com/2073-4395/10/10/1476/s1, Table S1. Soil chemical analysis of ‘Fuji’ apple orchards. Figure S1. Interaction plots for mineral concentrations for healthy and bitter pit affected fruit in both orchards after 150 days of storage at 0 °C for the 2018 season. Figure S2. Interaction plots for mineral relationships for healthy and bitter pit affected fruit in both orchards after 150 days of storage at 0 °C for the 2018 season.

Author Contributions

Conceptualization, C.C. and C.B.; Methodology, Validation, and Formal Analysis, R.M.; Writing—Original Draft Preparation, C.C. and C.B.; Writing—Review & Editing, J.P.Z. and S.T.d.F. All authors have read and agreed to the published version of the manuscript.

Funding

This research received no external funding.

Acknowledgments

We thank to Álvaro Jara and Paulina Naranjo for harvest technical support, and Verfrut export company for supplying the fruit and providing information of each orchard.

Conflicts of Interest

The authors declare no conflict of interest.

References

  1. O’Rourke, D. World Production, Trade, Consumption, and Economic Outlook for Apples. In Apples: Botany, Production and Uses; Ferree, D.C., Warrington, I.J., Eds.; CABI Publishing: Wallingford, UK, 2003; pp. 15–29. [Google Scholar]
  2. USDA. Available online: https://apps.fas.usda.gov/psdonline/circulars/fruit.pdf (accessed on 7 September 2020).
  3. De Freitas, S.T.; do Amarante, C.V.T.; Mitcham, E.J. Mechanisms regulating apple cultivar susceptibility to bitter pit. Sci. Hortic. 2015, 186, 54–60. [Google Scholar] [CrossRef]
  4. Fiorabanço, J.C.; Costa, A.B. Biennal bearing in apple cultivars. Rev. Ceres. 2018, 65, 144–149. [Google Scholar] [CrossRef] [Green Version]
  5. Smock, R.; Van Doren, A. The histology of bitter pit in apples. Proc. Am. Soc. Hort. Sci. 1937, 35, 176–179. [Google Scholar]
  6. Bünemann, G. Zusammenhänge zwischen Stickstoff- und Kationengehalt und Auftreten von Stippigkeit bei Äpfeln verschiedener Sorten und Herkünfte (Vorläufige Mitteilung). Die Gart. 1959, 24, 330–333. [Google Scholar]
  7. Askew, H.; Chittenden, E.; Monk, R.; Watson, J. Chemical investigations on bitter pit of apples. N. Z. J. Agric. Res. 1960, 3, 169–178. [Google Scholar] [CrossRef] [Green Version]
  8. Martin, D.; Wade, G.; Starkborne, K. Bitter pit in the apple variety Sturmer in a pot experiment using low levels of major elements. Aust. J. Exp. Agric. Anim. Husb. 1962, 2, 92–96. [Google Scholar] [CrossRef]
  9. De Freitas, S.T.; do Amarante, C.V.T.; Labavitch, J.; Mitcham, E.J. Cellular approach to understand bitter pit development in apple fruit. Postharvest Biol. Technol. 2010, 57, 6–13. [Google Scholar] [CrossRef]
  10. Hocking, B.; Tyerma, S.; Burton, R.; Gilliham, M. Fruit Calcium: Transport and Physiology. Front. Plant Sci. 2016, 7, 1–17. [Google Scholar] [CrossRef] [Green Version]
  11. Fallahi, E.; Conway, W.S.; Hickey, K.D.; Sams, C.E. The role of calcium and nitrogen in postharvest quality and disease resistance of apples. HortScience 1997, 30, 751. [Google Scholar] [CrossRef] [Green Version]
  12. Al Shoffe, Y.; Nock, J.; Zhang, Y.; Zhu, L.; Watkins, C. Comparisons of mineral and non-mineral prediction methods for bitter pit in ‘Honeycrisp’ apples. Sci. Hortic. 2019, 254, 116–123. [Google Scholar] [CrossRef]
  13. Al Shoffe, Y.; Nock, J.; Baugher, T.; Marini, R.; Watkins, C. Bitter pit and soft scald development during storage of unconditioned and conditioned ‘Honeycrisp’apples in relation to mineral contents and harvest indices. Postharvest Biol. Technol. 2020, 160, 111044. [Google Scholar] [CrossRef]
  14. Do Amarante, C.; Steffens, C.; Ernani, P. Identificação pré-colheita do risco de ocorrência de “bitter pit” em maçãs ‘gala’ por meio de infiltração com magnésio e análise dos teores de cálcio e nitrogênio nos frutos. Rev. Bras. Frutic. 2010, 32, 27–34. [Google Scholar] [CrossRef] [Green Version]
  15. Torres, E.; Recasens, I.; Peris, J.M.; Alegre, S. Induction of symptoms pre-harvest using the “passive method”: An easy way to predict bitter pit. Postharvest Biol. Technol. 2015, 101, 66–72. [Google Scholar] [CrossRef] [Green Version]
  16. Al Shoffe, Y.; Nock, J.; Watkins, C. Non-Mineral Prediction of Bitter Pit in ‘Honeycrisp’ Apples. Fruit Q. 2018, 26, 21–24. [Google Scholar]
  17. Do Amarante, C.V.T.; Silveira, J.P.G.; Steffens, C.A.; de Freitas, S.T.; Mitcham, E.J.; Miqueloto, A. Post-bloom and preharvest treatment of ‘Braeburn’ apple trees with prohexadione-calcium and GA4+7 affects vegetative growth and postharvest incidence of calcium-related physiological disorders and decay in the fruit. Sci. Hortic. 2020, 261, 108919. [Google Scholar] [CrossRef]
  18. Zhang, Y.; Nock, J.; Al Shoffe, Y.; Watkins, C. Non-destructive prediction of soluble solids and dry matter contents in eight apple cultivars using near-infrared spectroscopy. Postharvest Biol. Technol. 2019, 151, 111–118. [Google Scholar] [CrossRef]
  19. Ciavarella, S.; Batten, G.D.; Blakeney, A.B. Measuring potassium in plant tissues using near infrared spectroscopy. J. Near Infrared Spec. 1998, 66, 63–66. [Google Scholar] [CrossRef]
  20. García-Sánchez, F.; Gálvez-Sola, L.; Martínez-Nicolás, J.; Muelas-Domingo, R.; Nieves, M. Using Near-Infrared Spectroscopy in Agricultural Systems. In Developments in Near-Infrared Spectroscopy; Kyprianidis, K., Ed.; IntechOpen: London, UK, 2017; pp. 97–127. [Google Scholar] [CrossRef]
  21. Gálvez-Sola, L.; García-Sánchez, F.; Pérez-Pérez, J.G.; Gimeno, V.; Navarro, J.M.; Moral, R.; Martínez-Nicolás, J.J.; Nieves, M. Rapid estimation of nutritional elements on citrus leaves by near infrared reflectance spectroscopy. Front. Plant Sci. 2015, 6, 1–8. [Google Scholar] [CrossRef] [Green Version]
  22. Fukumoto, M.; Nagai, K. Possible role of calcium and ammonium in the development of bitter pit in apple. Physiol. Plant. 1983, 59, 171–176. [Google Scholar] [CrossRef]
  23. Rossa, Ü.B.; Angelo, A.C.; Nisgoski, S.; Westphalen, D.J.; Frizon, C.N.T.; Hoffmann-Ribani, R. Application of the NIR method to determine nutrients in yerba mate (Ilex paraguariensis A. St.-Hill) leaves. Commun. Soil Sci. Plant Anal. 2015, 46, 2323–2331. [Google Scholar] [CrossRef]
  24. Ryan, J.; Estefan, G.; Rashid, A. Soil and Plant Analysis Laboratory Manual, 2nd ed.; International Center for Agricultural Research in the Dry Areas (ICARDA): Aleppo, Syria, 2001; p. 172. [Google Scholar]
  25. Sparks, D.L. Methods of Soil Analysis, Part 3. In Chemical Methods SSSA Book Series, 3rd ed.; Soil Science Society of America: Madison, WI, USA, 1996; p. 1424. [Google Scholar]
  26. De Freitas, S.T.; Mitcham, E.I. Factors involved in fruit calcium deficiency disorders. Hortic. Rev. 2012, 40, 107–146. [Google Scholar]
  27. Siddiqi, M.Y.; Malhotra, B.; Min, X.; Glass, A.D.M. Effects of ammonium and inorganic carbon enrichment on growth and yield of a hydroponic tomato crop. J. Plant. Nutr. Soil Sci. 2002, 165, 191–197. [Google Scholar] [CrossRef]
  28. Zharare, G.; Asher, C.; Blamey, F. Magnesium antagonizes pod-zone calcium and zinc uptake by developing peanut pods. J. Plant Nutr. 2011, 34, 1–11. [Google Scholar] [CrossRef]
  29. Do Amarante, C.V.T.; Miqueloto, A.; Steffens, C.A.; Maciel, T.M.; Denardi, V.; Argenta, L.C.; de Freitas, S.T. Optimization of fruit tissue sampling method to quantify calcium, magnesium and potassium contents to predict bitter pit in apples. Acta Hortic. 2018, 1194, 487–492. [Google Scholar] [CrossRef]
  30. Brown, P.; Bellaloui, N.; Wimmer, M.A.; Bassil, E.S.; Ruiz, J.; Hu, H.; Pfeffer, H.; Dannel, F.; Römheld, V. Boron in plant biology. Plant Biol. 2002, 4, 205–223. [Google Scholar] [CrossRef]
  31. Hosseini, S.M.E.; Maftoun, M.; Karimian, N.; Rounagui, A.; Emam, Y. Effect of zinc sulfate on corn resistance to boron toxicity. Iran. J. Soil Water Sci. 2004, 18, 125–134. [Google Scholar]
  32. Eraslan, F.; Inal, A.; Gunes, A.; Alpaslan, M. Boron toxicity alters nitrate reductase activity, proline accumulation, membrane permeability, and mineral constituents of tomato and pepper plants. J. Plant Nutr. 2007, 30, 981–994. [Google Scholar] [CrossRef]
  33. Li, X.; Li, Y.; Mai, J.; Tao, L.; Qu, M.; Liu, J.; Shen, R.; Xu, G.; Feng, Y.; Xiao, H.; et al. Boron alleviates aluminum toxicity by promoting root alkalization in transition zone via polar auxin transport. Plant Physiol. 2018, 177, 1254–1266. [Google Scholar] [CrossRef] [Green Version]
  34. Kaya, C.; Tuna, A.L.; Dikilitas, M.; Ashraf, M.; Koskeroglu, S.; Guneri, M. Supplementary phosphorus can alleviate boron toxicity in tomato. Sci. Hortic. 2009, 121, 284–288. [Google Scholar] [CrossRef]
  35. Ghaffari, S.; Etesami, H. The Importance of Boron in Plant Nutrition. In Metalloids in Plants: Advances and Future Prospects; Deshmukh, R., Tripathi, D., Guerriero, G., Eds.; John Wiley & Sons, Inc. Press: Hoboken, NJ, USA, 2019; pp. 431–447. [Google Scholar]
  36. Sotiropoulos, T.E.; Therios, I.N.; Dimassi, K.N. Calcium application as a means to improve tolerance of kiwifruit (Actinidia deliciosa L.) to boron toxicity. Sci. Hortic. 1999, 81, 443–449. [Google Scholar] [CrossRef]
  37. Fang, K.; Zhang, W.; Xing, Y.; Zhang, Q.; Yang, L.; Cao, Q.; Qin, L. Boron toxicity causes multiple effects on Malus domestica pollen tube growth. Front. Plant Sci. 2016, 7, 1–12. [Google Scholar] [CrossRef] [PubMed] [Green Version]
  38. Wang, H.; Wang, Y.; Du, C.; Xu, F.; Yang, Y. Effects of boron and calcium supply on calcium fractionation in plants and suspension cells of rape cultivars with different boron efficiency. J. Plant Nutr. 2003, 26, 789–806. [Google Scholar] [CrossRef]
  39. Fazio, G.; Lordan, L.; Grusak, M.; Francescatto, P.; Robinson, T. Mineral nutrient profiles and relationships of ‘Honeycrisp’ grown on a genetically diverse set of rootstocks under Western New York climatic conditions. Sci. Hortic. 2020, 266, 108477. [Google Scholar] [CrossRef]
  40. Oertli, J.; Richardson, W.F. The mechanism of boron immobility in plants. Physiol. Plant. 2006, 23, 108–116. [Google Scholar] [CrossRef]
  41. Wang, N.; Yang, C.; Pan, Z.; Liu, Y.; Peng, S. Boron deficiency in woody plants: Various responses and tolerance mechanisms. Front. Plant Sci. 2015, 6, 916. [Google Scholar] [CrossRef] [PubMed] [Green Version]
  42. Picchioni, G.A.; Weinbaum, S.A.; Brown, P.H. Retention and the kinetics of uptake and export of foliage-applied, labeled boron by apple, pear, prune, and sweet cherry leaves. J. Am. Soc. Hortic. Sci. 1995, 120, 28–35. [Google Scholar] [CrossRef] [Green Version]
  43. Brown, P.; Bellaloui, N.; Hu, H.; Dandekar, A. Transgenically enhanced sorbitol synthesis facilitates phloem boron transport and increases tolerance of tobacco to boron deficiency. Plant Physiol. 1999, 119, 17–20. [Google Scholar] [CrossRef] [Green Version]
  44. Brown, P.; Hu, H. Phloem Mobility of Boron is Species Dependent: Evidence for Phloem Mobility in Sorbitol-rich Species. Ann. Bot. 1996, 77, 497–506. [Google Scholar] [CrossRef] [Green Version]
  45. Hu, H.; Penn, S.G.; Lebrilla, C.B.; Brown, P.H. Isolation and characterization of soluble boron complexes in higher plants (the mechanism of phloem mobility of boron). Plant Physiol. 1997, 113, 649–655. [Google Scholar] [CrossRef] [Green Version]
  46. Brown, P.; Shelp, B. Boron mobility in plants. Plant Soil 1997, 193, 85–101. [Google Scholar] [CrossRef]
  47. Coskun, Y.; Olgunsoy, P.; Karatas, N. Mannitol application alleviates boron toxicity in wheat seedlings. Commun. Soil Sci. Plan. 2014, 45, 944–952. [Google Scholar] [CrossRef]
  48. Minchin, P.; Thorp, T.; Boldingh, H.; Gould, N.; Cooney, J.; Negm, F.; Focht, E.; Arpaia, M.L.; Hu, H.; Brown, P. A possible mechanism for phloem transport of boron in ‘Hass’ avocado (Persea americana Mill.) trees. J. Hortic. Sci. Biotechnol. 2012, 87, 23–28. [Google Scholar] [CrossRef]
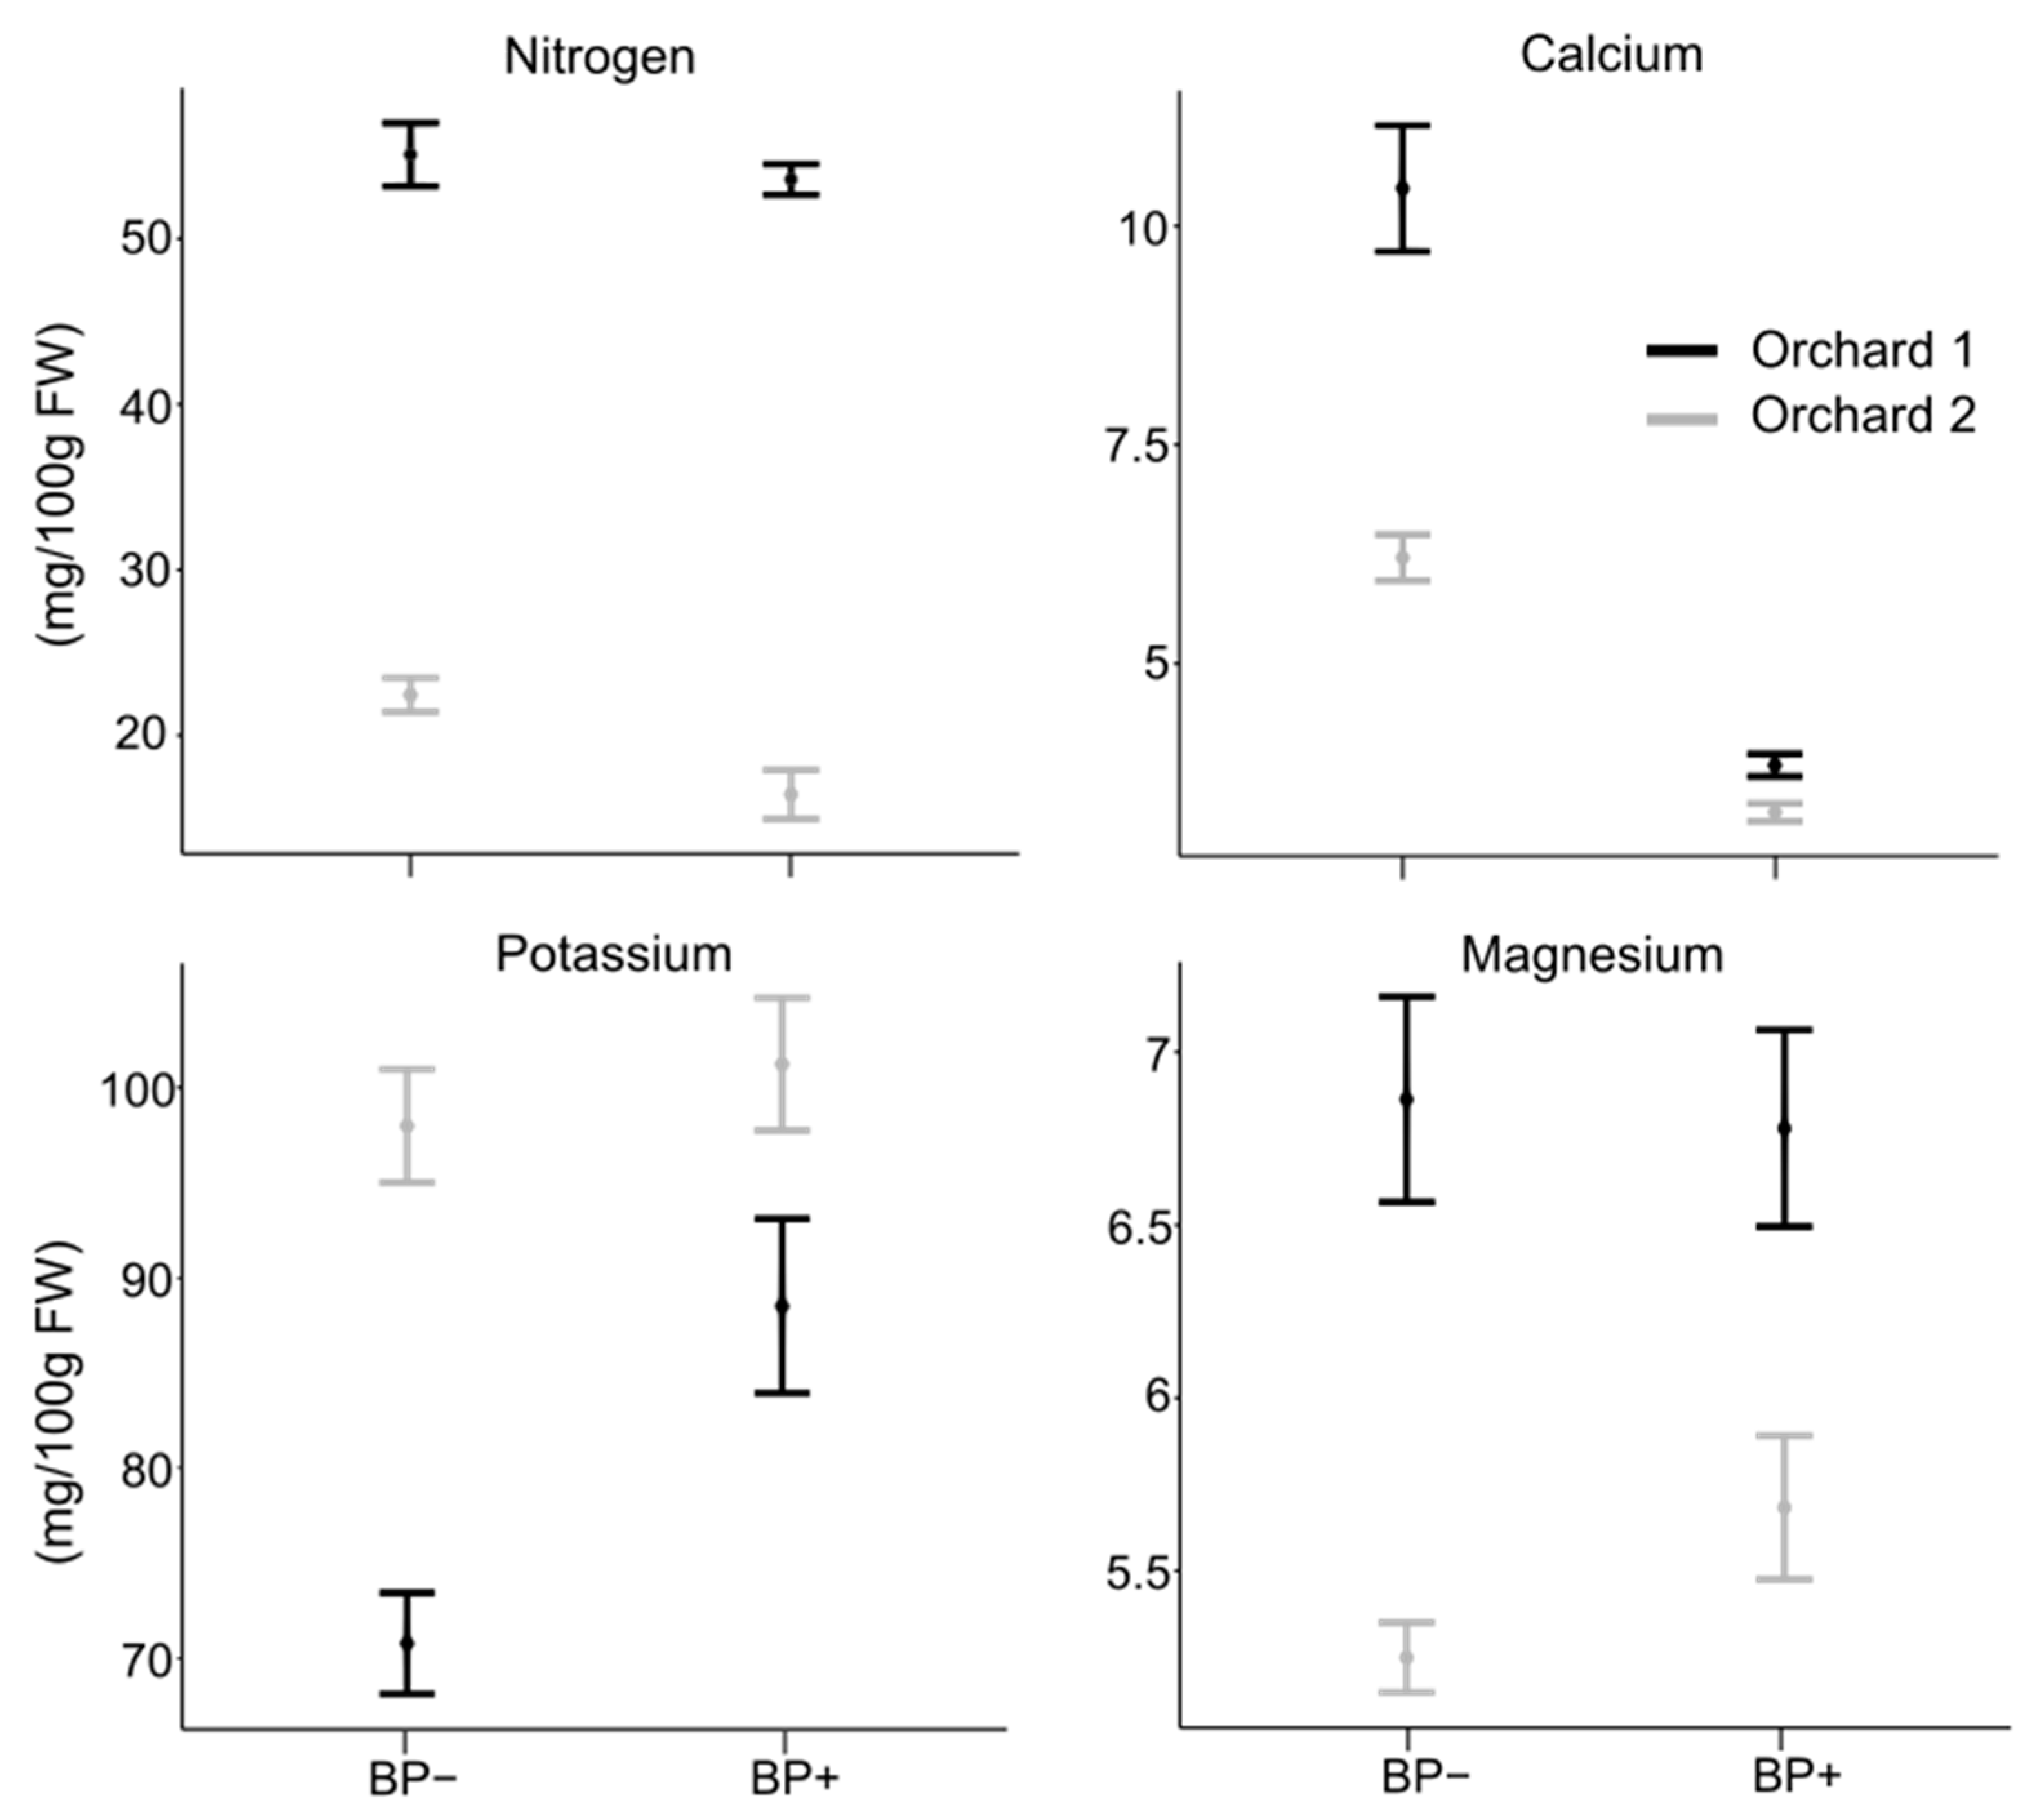
Figure 1. Mineral concentrations in healthy and bitter pit (BP)-affected fruit in both orchards after 150 days of storage at 0 °C for 2018 season. Means are presented ± standard error.
Agronomy 10 01476 g001
Figure 2. Mineral relationships in healthy and BP affected fruit in both orchards after 150 days of storage at 0 °C for the 2018 season. Means are presented ± standard error.
Agronomy 10 01476 g002
Figure 3. Principal component analysis (PCA) biplots representing mineral data (A): orchard 1; (B): orchard 2; and (C): a combination of both orchards datasets) and mineral relationships (D): orchard 1; (E): orchard 2; and (F): a combination of both orchards datasets) after 150 days of storage at 0 °C for the 2018 season.
Agronomy 10 01476 g003
Figure 4. (A) Reflectance spectra collected in apple solution (lyophilized apple powder + CaCl2 stock) with different Ca concentrations; (B) Mean reflectance spectra collected for different Ca concentrations. The apple powder was mixed with Ca at the concentration of 0, 0.8, 2, 4, 8, 11.2, 15.2, 19.2, 22, and 25.2 Ca/L, which represents the concentration range found in the fresh apples.
Agronomy 10 01476 g004
Figure 5. Boxplot for reflectance spectra collected after 0.5 h, each line corresponds to a different Ca concentration mixed with apple powder in solution.
Agronomy 10 01476 g005
Figure 6. Suggested nutrient balances leading to the development of BP in ‘Fuji’ apples. (*) In genus Malus, Pyrus, and Prunus, B can transport with polyols in the phloem [44].
Agronomy 10 01476 g006
Table 1. Bitter pit incidence and severity of ‘Fuji’ apples from harvest to 150 days of storage at 0 °C during the 2018 season. (*) P value (≤ 0.05) corresponds to bitter pit severity between orchards.
Orchard 1Orchard 2
Evaluation Date (Days)Bitter Pit Incidence (%)Bitter Pit Severity (Average Number of Pits)Bitter Pit Incidence (%)Bitter Pit Severity (Average Number of Pits)P Value (*)
00000-
100000-
300000-
500.440.530.469
701.93.80.74.60.485
903.252.84.50.641
1104.14.83.34.40.655
1305.34.53.54.30.816
1505.64.73.64.20.528
Table 2. Mineral concentrations of ‘Fuji’ apples at harvest during the 2018 season. Values are means ± standard error (SE) from 20 fruit in orchard 1, and 17 fruit in orchard 2. Statistically significant differences are indicated by italics (P ≤ 0.05; Tukey HSD test). Dry matter is expressed as percentage and nutrient values are expressed in fresh weight basis (mg 100 g−1).
Orchard 1Orchard 2
MeanSEMeanSEP Value
Dry matter14.650.4414.610.440.915
N27.451.1231.981.060.006
Ca7.440.327.910.220.247
K67.182.5999.261.910.000
Mg5.480.155.490.090.976
P10.770.2410.950.330.647
B0.290.010.240.010.001
Cu0.090.010.070.010.021
Fe0.130.010.140.010.160
Mn0.020.000.040.000.000
Zn0.050.000.050.000.421