Abstract
Rice is generally consumed in the form of milled rice. The yield of total milled rice and head mill rice is affected by both the paddy rice yield and milling efficiency. In this study, three recombinant inbred line (RIL) populations and one F4:5 population derived from a residual heterozygous (RH) plant were used to determine quantitative trait loci (QTLs) affecting milling yield of rice. Seven traits were analyzed, including recovery of brown rice (BR), milled rice (MR) and head rice (HR); grain yield (GY); and the yield of brown rice (BRY), milled rice (MRY) and head rice (HRY). A total of 77 QTLs distributed on 35 regions was detected in the three RIL populations. Four regions, where qBR5, qBR7, qBR10, and qBR12 were located, were validated in the RH-derived F4:5 population. In the three RIL populations, all the 11 QTLs for GY detected were accompanied with QTLs for two or all the three milling yield traits. Not only the allele direction for milling yield traits was unchanged, but also the effects were consistent with GY. In the RH-derived F4:5 population, regions controlling GY also affected all three milling yield traits. Results indicated that variations of BRY and MRY were mainly ascribed to GY, but HRY was determined by both GY and HR. Results also showed that the regions covering GW5–Chalk5 and Wx loci had major effects on milling quality and milling yield of rice. These two regions, which have been known to affect multiple traits determining grain quality and yield of rice, provide good candidates for milled yield improvement.
1. Introduction
As a major cereal crop, rice (Oryza sativa L.) provides staple food for at least half of the global population. Rice food is mainly consumed in the form of cooked milled rice. Farmer’s incomes are based on both the paddy rice yield and the milling efficiency. In the postharvest processing, paddy grains are firstly de-hulled into brown rice and then milled into milled rice. Milled rice is separated into head rice (also called whole rice) and broken rice. Milled rice whose length is longer than or equal to 3/4 of its unbroken length falls into the category of head rice, and the rest is called broken rice. Head rice has a higher price than broken rice [1]. Three parameters, recovery of brown rice (BR), milled rice (MR) and head rice (HR), are used to evaluate rice milling quality and efficiency of the milling processing [2,3,4]. Generally, BR is defined as the percentage of brown rice to grains, MR the percentage of milled rice to grains, and HR the percentage of head rice to grains. Alternatively, MR is measured as the percentage of milled rice to brown rice, and HR the percentage of head rice to milled rice [5]. In some reports, these traits are called percent milling yield, brown rice yield, milled rice yield, total milled yield, or head rice yield [3,6,7,8].
In the past two decades, analysis of quantitative trait loci (QTLs) was employed to study the genetic basis of rice milling quality. A larger number of QTLs were identified using various populations developed from crosses of the same subspecies [3,9], between the indica and japonica subspecies [6,10,11,12], or between different species [2]. In these studies, clustering of QTLs for different milling traits was commonly observed. Some of them detected only one cluster. For example, Tan et al. [9] located QTLs for MR and HR in the C1087–RZ403 region on chromosome 3; Aluko et al. [2] detected br8 and hr8 in RM126–RM137 on chromosome 8; and Lou et al. [12] found qMRR-3 and qHRR-3 in RM3204–RM6283 on chromosome 3. Other studies detected more clusters. Li et al. [6] located qBR-4 and qMR-4 in the C975–C734 interval on chromosome 4, qBR-9 and qMR-9 in R1751–R2272 on chromosome 9, qBR-10 and qMR-10 in C488–R716 on chromosome 10, and qBR11 and qMR11 in R728–G202 on chromosome 11. Zheng et al. [11] detected QBr6 and QMr6 in the Wx region on chromosome 6, and QBr7 and QMr7 in RM505–RM118 on chromosome 7.
When QTL mapping for milling quality traits and components of grain yield was performed using the same population, a proportion of genomic regions were found to be associated with both types of traits. Using 240 backcross introgression lines derived from the Ce258/IR75862 cross, three QTL regions were found to simultaneously affect components of milling quality and grain yield [5]. In the RM71–RM300 interval harboring qBR2, the Ce258 allele increased BR and panicle weight. In RM348–RM349 harboring qBR4, the Ce258 allele increased BR and grain weight but decreased spikelet number. In RM250–RM482 harboring qHR2, the Ce258 allele increased HR, grain number and spikelet number but decreased grain weight. Using 205 recombinant inbred lines (RILs) developed from the L-204/01Y110 cross, two QTL regions were found to simultaneously affect milling traits and grain weight [8]. For QTLs located in RM5638–RM1361 on chromosome 1, the L-204 allele increased BR and HR but decreased grain weight. For QTLs linked to RM3283 on chromosome 10, the L-204 allele increased HR but decreased grain weight. These results provide evidences for genetic association between milling quality and grain yield in rice, but it remains unknown whether this association has a consequence on the yield of milled and head rice.
In the present study, QTL analysis was employed to determine the dependence of milled and head rice yield on milling quality and grain yield. Firstly, three RIL populations were used to detect QTLs for brown, milled and head rice recovery; grain yield; and brown, milled and head rice yield. Then, QTL validation was performed using one secondary population derived from a residual heterozygote (RH) identified from one of the RIL populations.
2. Materials and Methods
2.1. Plant Materials
Four populations of indica rice (Oryza sativa subsp. indica) were used, including three RIL populations and one RH-derived F4:5 population.
The three RIL populations were previously used to detect QTLs for components of appearance quality and physiochemical traits for eating and cooking quality [13,14,15]. The TI population consisting of 204 lines was constructed from crosses between Teqing (TQ) and IRBB lines. The IRBB lines are near isogenic lines carrying different bacterial blight resistance genes [16] in the background of IR24, including IRBB50, IRBB51, IRBB52, IRBB54, IRBB55, and IRBB59. The ZM population consisting of 230 lines was constructed from a cross between Zhenshan 97 and Milyang 46 (MY46). The XM population consisting of 209 lines was constructed from a cross between Xieqingzao and MY46. All the parental lines of these populations have been widely used in the breeding and production of three-line hybrid rice in China.
The RH-derived F4:5 population was previously used to validate minor QTL for gel consistency [15]. It was derived from one RH plant that was an F7 progeny of the cross TQ/IRBB52. Of the 135 polymorphic markers included in the TI map, 33 were heterozygous and 102 were homozygous in the RH plant. This plant was selfed to produce an F2-type population consisting of 250 individuals. Single seed descent was applied to advance the population to F4. Seeds of the F4 plants were harvested and a population consisting of 250 F4:5 families was constructed.
2.2. Field Experiment and Trait Measurement
All the populations were planted in the middle rice growing season (from May to October) at the China National Rice Research Institute (CNRRI), Hangzhou (30°04′ N, 119°54′ E), China. The three RIL populations were tested for 2 years, including 2008 and 2009 for TI, 2009 and 2010 for ZM, and 2003 and 2009 for XM. The RH-derived F4:5 population was tested for 1 year in 2017. The experiments followed a randomized complete block design. Twelve plants per line were transplanted in a single row with 16.7 cm between plants and 26.7 cm between rows. Field management followed common practice in rice production.
At maturity, five plants from the 10 middle plants of each line were randomly sampled and harvested. The grains were dried and weighted to calculate grain yield per plant (GY, g). Dried grains were stored at room temperature for three months. Then, two replicates of filled grains were processed independently. Filled grain of 100 g was de-husked using a Satake Rice Machine (Suzhou, China). The brown rice was milled using a JNMJ3 rice miller (Taizhou, China). Head rice of which the length was longer than or equal to 3/4 of the full length was separated from broken rice. Three traits for milling quality, i.e., BR, MR and HR, were calculated as the percentage of the weight of brown, milled and head rice to grain weight, respectively. Three traits for milling yield, i.e., brown, milled and head rice yield per plant, were calculated as follows:
Brown rice yield per plant (BRY, g) = BR × GY
Milled rice yield per plant (MRY, g) = MR × GY
Head rice yield per plant (HRY, g) = HR × GY
2.3. Marker Data and Genetic Maps
Marker data and genetic maps of the four populations have been available [15]. The TI, ZM and XM maps were 1345.3, 1814.7 and 2080.4 cM in length, consisting of 135, 256 and 240 DNA markers, respectively. Genomic coverage and distances between neighboring markers are satisfactory for primary QTL mapping in the ZM and XM populations. A number of large homozygous segments remain in the TI map due to low polymorphism between the female and male parents of the TI population. For the RH-derived F4:5 population, the map consisted of 35 markers, including 28 simple sequence repeats, six InDels and one single nucleotide polymorphism.
2.4. Data Analysis
For the three RIL populations that were tested for 2 years, phenotypic data averaged over 2 years were used for computing the descriptive statistics, plotting the frequency distribution and calculating the Pearson correlation coefficient, and the data of each year were used for QTL mapping. QTL analysis was performed using the default setting of the MET (multi-environmental trials) approach in IciMapping V4.1 [17], taking the 2 years for each population as two environments. LOD thresholds for genome-wide type I error of p < 0.05 were calculated with 1000 permutation test and used to claim a putative QTL. QTL effects and the proportions of phenotypic variance explained (R2) were estimated. When a QTL was shown to have a significant genotype-by-environment (GE) interaction, the effect and R2 due to GE interaction were also measured. QTLs were designated as proposed by McCouch and CGSNL [18].
For the RH-derived F4:5 population that was tested for 1 year, QTLs were determined with the BIP (bi-parental populations) approach in IciMapping V4.1 [17]. LOD > 2.0 was used as the threshold to claim a putative QTL. QTLs were designated as proposed by McCouch and CGSNL [18].
3. Results
3.1. Phenotypic Performance of the Three RIL Populations
Descriptive statistics of the seven traits in the three RIL populations are presented in Table S1. Two of the seven traits, BR and MR, showed similar coefficients of variation (CV) among the three populations, ranging from 0.0116 to 0.0119 and 0.0140 to 0.0180, respectively. The CV of the five other traits were higher in the ZM and XM populations than in the TI population, ranging from 0.1266 to 0.2642 in ZM, 0.1288 to 0.2942 in XM, and 0.0967 to 0.1871 in TI (Table S1). Continuous distributions were observed for all the traits in the three populations (Figure S1), suggesting polygenic inheritance of these traits.
Correlations between the seven traits were either non-significant or positive highly significant (p < 0.01) (Table 1). Regarding the three traits for milling quality, the correlation was strong between BR and MR but weak between these two traits and HR. The correlation coefficients (r) between BR and MR ranged from 0.764 to 0.815 in the three populations, but their correlations with HR were either non-significant or had low r values (0.230–0.363). These results suggest that the control of properties for maintaining whole milled rice may differ greatly from that for achieving high brown and milled rice recovery.

Table 1.
Simple correlation coefficients between seven traits in three RIL populations of rice.
Regarding the four yield traits, GY, BRY, MRY and HRY, not only the correlations were all significant but also the coefficients were all high. Near-perfect correlation was observed between GY, BRY and MRY, with the r values ranging from 0.996 to 0.999. Lower r values were found between these three traits and HRY, ranging from 0.816 to 0.826, 0.902 to 0.907 and 0.900 to 0.907 in the TI, ZM and XM populations, respectively. These results suggest that GY is the main source of variations for BRY, MRY and HRY, and the postharvest processing has a more significant influence on HRY than on BRY and MRY.
Regarding the three pairs of corresponding traits for milling quality and yield, the correlation was stronger between HR and HRY than between the other two pairs of traits. The r values ranged from 0.505 to 0.710 between HR and HRY in the three populations and decreased to 0.292–0.055 between BR and BRY, and 0.136–0.425 between MR and MRY. These results also suggest that the postharvest processing has a more significant influence on HRY than on BRY and MRY.
3.2. QTL Detected in the Three RIL Populations
In the TI, ZM and XM populations, a total of 27, 33 and 17 QTLs were detected for the seven traits analyzed, of which one, four and none showed significant GE interactions, respectively (Figure 1; Table 2, Table 3 and Table 4). Based on the physical position of DNA markers, it was found that all the five QTLs having significant GE effects were located in the region covering the Wx locus on the short arm of chromosome 6.
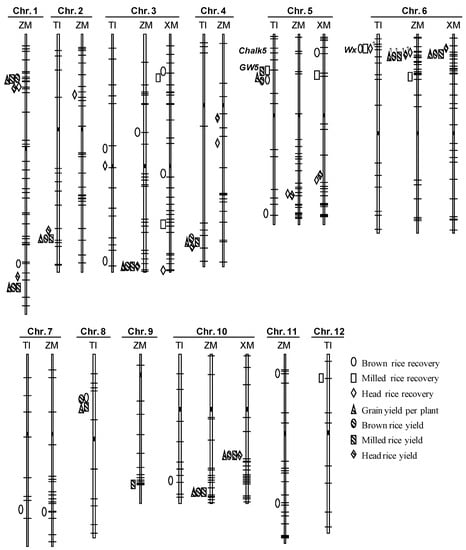
Figure 1.
Genomic distribution of QTLs for seven traits detected in three RIL populations. TI = Teqing/IRBB lines; ZM = Zhenshan 97/Milyang 46; XM = Xieqingzao/Milyang 46. Marker positions in each chromosome are indicated by solid lines and the distances are in proportion to the physical length. Solid rectangles refer to the approximate positions of centromeres. QTLs are drawn on the left side of the corresponding interval. Significant genotype-by-environment interaction is indicated by the number “1”.
Table 2.
QTLs for seven traits detected in the TI population.
Table 3.
QTLs for seven traits detected in the ZM population.
Table 4.
QTLs for seven traits detected in the XM population.
3.3. QTLs Detected in the TI Population
The 27 QTLs identified in the TI population were distributed across nine of the 12 rice chromosomes (Figure 1, Table 2). Numbers of QTLs detected for BR, MR, HR, GY, BRY, MRY, and HRY were 8, 3, 2, 4, 4, 4, and 2, having overall R2 of 59.55%, 21.93%, 23.40%, 25.05%, 26.13%, 25.49%, and 12.93%, respectively. Twenty-two of these QTLs formed six clusters distributed on chromosomes 2, 3, 4, 5, 6, and 8.
The largest cluster consisted of five QTLs, followed by three clusters of four QTLs. It was found that the 14 QTLs detected for grain yield and the three traits for milling yield were all included in these four clusters. In the RM437–RM18189 region on chromosome 5, the TQ allele increased BR, MR, GY, BRY, and MRY by 0.51%, 0.39%, 1.30 g, 1.25 g, and 1.13 g, respectively (Table 2). In the RM6–RM240 region on chromosome 2, the TQ allele increased GY, BRY, MRY, and HRY by 1.89 g, 1.54 g, 1.30 g, and 1.21 g, respectively. In the RM6992–RM349 region on chromosome 4, the TQ allele decreased GY, BRY, MRY, and HRY by 1.44 g, 1.14 g, 0.99 g, and 0.89 g, respectively. In the RM547–RM22755 region on chromosome 8, the TQ allele increased BR, GY, BRY, and MRY by 0.20%, 1.10 g, 0.98 g, and 0.79 g, respectively.
The fifth cluster consisted of three QTLs, which were located in the RM190–RM587 region covering the Wx locus [19] on chromosome 6. The TQ allele increased BR, MR and HR by 0.30%, 0.28% and 1.40%, respectively. The sixth cluster consisted of two QTLs, which were located in the RM15139–RM15303 region covering the GS3 locus [20] on chromosome 3. The TQ allele decreased BR by 0.41 g but increased HR by 2.51 g.
In the other five regions, one QTL was detected in each region. Included were qBR3.2 located in the interval RM16048–RM16184 on chromosome 3, qBR5.2 in RM274–RM334 on chromosome 5, qBR7 in RM70–RM18 on chromosome 7, qBR10 in RM6100–RM3773 on chromosome 10, and qMR12 in RM20–RM27610 on chromosome 12.
3.4. QTLs Detected in the ZM Population
The 33 QTLs identified in the ZM population were distributed across 10 of the 12 rice chromosomes (Figure 1, Table 3). Numbers of QTLs detected for BR, MR, HR, GY, BRY, MRY, and HRY were 5, 1, 5, 5, 5, 6, and 6, having overall R2 of 19.55%, 3.25%, 24.34%, 23.57%, 23.08%, 26.20%, and 28.39%, respectively. Twenty-four of these QTLs formed six clusters distributed on chromosomes 1, 3, 5, 6, and 10.
Two clusters on chromosome 1 and one on chromosome 6 were the three largest clusters consisting of five QTLs. Each of them affected one milling quality trait and all the four yield traits. In the RG532–RM5359 region on the short-arm chromosome 1, the MY46 allele increased HR, GY, BRY, MRY, and HRY by 2.21%, 0.89 g, 0.74 g, 0.69 g, and 0.70 g, respectively (Table 3). In the RZ730–RG381 region on the long arm of chromosome 1, the MY46 allele decreased BR by 0.24% but increased GY, BRY, MRY, and HRY by 1.12 g, 0.86 g, 0.76 g, and 0.67 g, respectively. In the RZ516–RM197 region covering the Wx locus on chromosome 6, the MY46 allele decreased HR, GY, BRY, MRY, and HRY by 1.56%, 0.79 g, 0.63 g, 0.58 g, and 0.66 g, respectively.
The other three clusters consisted of four, three and two QTLs, respectively. The RZ613–RG418A region on chromosome 3 affected all four yield traits, with the MY46 allele decreasing GY, BRY, MRY, and HRY by 0.76 g, 0.61 g, 0.56 g, and 0.65 g, respectively. The RZ811–RZ583 region on chromosome 10 affected three yield traits, with the MY46 allele decreasing GY, BRY and MRY by 0.83 g, 0.73 g and 0.68 g, respectively. The CDO348–RG480 region on chromosome 5 affected the recovery and yield of head rice, with the MY46 allele decreasing HR and HRY by 1.61% and 0.79 g, respectively.
Two other QTLs, qHRY4 and qHR4, were mapped in close positions on chromosome 4 (Figure 1). The MY46 allele increased HRY and HR by 0.76 g and 1.31%, respectively (Table 3). In the other seven regions, one QTL was detected in each region. Included were qHR2 located in the interval A5–RM71 on chromosome 2, qBR3 in RM251–RG393 on chromosome 3, qMR6 in RM276–RZ667 on chromosome 6, qBR7 in RG650–RZ395 on chromosome 7, qMRY9 in RG667–RM201 on chromosome 9, qBR11.1 in RZ816–RM332, and qBR11.2 in RM187–RM254 on chromosome 11.
3.5. QTLs Detected in the XM Population
The 17 QTLs identified in the XM population were distributed on four of the 12 rice chromosomes (Figure 1, Table 4). Numbers of QTLs detected for BR, MR, HR, GY, BRY, MRY, and HRY were 3, 3, 2, 2, 2, 2, and 3, having overall R2 of 11.68%, 13.11%, 8.86%, 13.62%, 13.21%, 13.80%, and 13.98%, respectively. Twelve of these QTLs formed four clusters distributed on chromosomes 3, 5, 6, and 10.
The clusters on chromosomes 6 and 10 were the two largest clusters consisting of four QTLs, both of which affected all four yield traits. In the RM190–RM204 region covering the Wx locus on chromosome 6, the MY46 allele decreased GY, BRY, MRY, and HRY by 1.74 g, 1.43 g, 1.32 g, and 0.99 g, respectively (Table 4). In the RM1859–RM184 region on chromosome 10, the MY46 allele decreased GY, BRY, MRY, and HRY by 1.36 g, 1.11 g, 1.04 g, and 1.11 g, respectively.
The other two clusters each consisted of two QTLs. In the RM6849–RM14629 region on the short arm of chromosome 3, the MY46 allele increased BR and MR by 0.21% and 0.28%, respectively. In the RM163–RG470 on the long arm of chromosome 5, the MY46 allele decreased HR and HRY by 1.62% and 0.80 g, respectively. Two other QTLs, qBR5 and qMR5, were mapped in close positions on the short arm of chromosome 5 (Figure 1). The MY46 allele increased BR and MR by 0.19% and 0.43%, respectively (Table 4). The remaining three QTLs were loosely linked on the long arm of chromosome 3, including qBR3.2 for brown rice recovery, qMR3.2 for milled rice recovery, and qHR3 for head rice recovery.
3.6. Validation of Five QTL Regions in an RH-Derived F4:5 Population
In the Ti52-3 population that was derived from an RH-plant of TQ/IRBB52, correlations between the seven traits (Table S2) are much the same as in the three RIL populations. Regarding the three traits for milling quality, the correlation between BR and MR (r = 0.773) was much stronger than between these two traits and HR (r = 0.243 and 0.266). Regarding the four yield traits, near-perfect correlation was observed between GY, BRY and MRY (r values ranging as 0.993–0.998), and their correlations with HRY were slightly weaker (r values ranging as 0.923–0.929). Regarding the three pairs of traits for milling quality and yield, the correlation between HR and HRY (r = 0.440) was much stronger than between the two others (r = 0.065 and 0.159).
Among the 16 segregating regions distributed on 12 chromosomes in the Ti52-3 population, QTLs were detected in 10 regions across nine chromosomes (Figure 2; Table 5). A total of 26 QTLs were found, including 6, 6, 1, 3, 3, 3, and 4 for BR, MR, HR, GY, BRY, MRY, and HRY, which had overall R2 of 33.39%, 45.99%, 6.01%, 22.75%, 22.93%, 23.73%, and 23.27%, respectively.
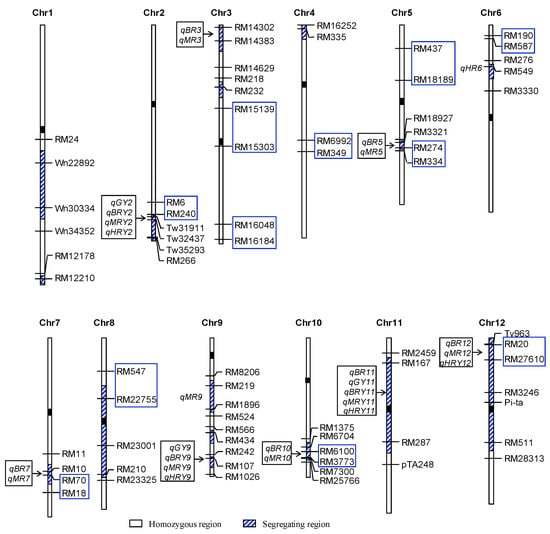
Figure 2.
Genomic distribution of QTLs for seven traits detected in the RH-F4:5 population. BR = Brown rice recovery; MR = Milled rice recovery; HR = Head rice recovery; GY = Grain yield per plant; BRY = Brown rice yield per plant; MRY = Milled rice yield per plant; HRY = Head rice yield per plant. Markers within the blue rectangle are flanking markers of QTLs detected in the TI population.
Table 5.
QTLs for seven traits detected in the RH-F4:5 population.
Of the QTLs detected in the TI population, four were covered by the segregating regions of the Ti52-3 population (Figure 2), including qBR5.2 located in the interval RM274–RM334 on chromosome 5, qBR7 in RM70–RM18 on chromosome 7, qBR10 in RM6100–RM3773 on chromosome 10, and qMR12 in RM20–RM27610 on chromosome 12. They were all well validated. The TQ alleles consistently increased BR in the qBR5.2 and qBR10 regions, decreased BR in the qBR7 region, and decreased MR in the qMR12 region (Table 2 and Table 5). Additionally, significant effects were newly detected on MR in the qBR5.2, qBR7 and qBR10 regions, and on BR and HRY in the qMR12 region. The QTL region qBR8/qGY8/qBRY8/qMRY8 found in the TI population was overlapped with the segregating region RM22755–RM23001 in the Ti52-3 population (Figure 2). These QTLs were not detected in Ti52-3. Since one side of this putative QTL region was homozygous in the new population, it is possible that the QTLs were not segregated in Ti52-3.
The other six QTL regions found in the Ti52-3 population were not detected in the TI population. One of them, Tw31911–Tw32437 on chromosome 2, showed significant effects on four traits. In the neighboring region RM6–RM240, QTLs for the same four traits were detected in the TI population. However, the QTL directions were opposite between the two regions. It is noted that RM6–RM240 segregated in the TI population was homozygous in the Ti52-3 population (Figure 2). The gene underlying this QTL cluster may be located between RM6–RM240 and Tw31911–Tw32437, and crossover may have occurred between the gene and Tw31911.
Five other QTL regions detected in the Ti52-3 population included three QTL clusters and two regions affecting a single trait. The RM14302–RM14383 region on chromosome 3 affected two traits, in which the TQ allele increased BR and MR by 0.13% and 0.31%, respectively. The RM107 region on chromosome 9 affected four traits, in which the TQ allele increased GY, BRY, MRY, and HRY by 0.93 g, 0.76 g, 0.73 g, and 0.62 g, respectively. The RM167–RM287 region on chromosome 11 affected five traits, in which the TQ allele decreased BR, GY, BRY, MRY, and HRY by 0.10%, 0.76 g, 0.63 g, 0.55 g, and 0.36 g, respectively. The remaining two QTLs were qHR6 and qMR9, of which the TQ allele decreased HR and MR by 1.34% and 0.20%, respectively.
4. Discussion
Milled and head rice yield, two of the most important commercial traits in rice production, are determined by grain yield and milling quality. Understanding the genetic relationship among these traits is critical for the improvement of milled and head rice yield in breeding. In this study, QTL analysis for seven traits—brown, milled and head rice recovery, grain yield, and brown, milled and head rice yield—was performed using three RIL populations and one RH-derived F4:5 population. New knowledge on the genetic basis underlying the control of brown, milled and head rice yield is provided.
In the four populations investigated in this study, correlations between the four yield traits were all highly significant. Near-perfect correlations were observed between GY, BRY and MRY, and their correlations with HRY were slightly weaker. These results were supported by QTLs detected for the four traits. Four, five, two, and three QTLs were detected for grain yield in the TI, ZM, XM, and Ti52-3 populations. It is worth noting that each of these QTL regions had significant effects on all or two of the three traits for milling yield. For multiple QTLs accompanied in the same region, not only the allelic direction remained unchanged, but also the effects were consistent. Of the four regions controlling GY in TI, the qGY2 and qGY4 regions controlled all four traits, but the qGY5 and qGY8 regions were non-significant for HRY (Table 2). No other QTLs for these traits were detected in TI. Of the five regions controlling GY in ZM, the qGY1.1, qGY1.2, qGY3, and qGY6 regions controlled all four traits, but the qGY10 region was non-significant for HRY (Table 3). One more QTL for MRY, qMRY9, was detected alone. One more QTL for HRY, qHRY4, was detected and accompanied with a QTL for HR, qHR4. In XM, the two regions controlling GY both affected all four traits (Table 4). One more QTL for HRY, qHRY5, was detected and accompanied with a QTL for HR, qHR5. Similarly, all three regions controlling GY in Ti52-3 affected all four traits (Table 5). These results have two implications. Firstly, variation on paddy grain yield might be the only main source of variation for brown and milled rice yield. Secondly, variations on the paddy grain yield and head rice recovery both make important contributions to the variation of head rice yield.
Significant correlations between different quality traits in rice have been commonly observed [7,8,12,21], which could be partly ascribed to the influence of a QTL region on multiple traits [7,12]. By comparing the locations of genes or QTLs reported for various grain quality traits in rice, it is found that some regions harboring QTLs for milling quality are associated with other traits that determine appearance quality or eating and cooking characteristics. Two typical examples are the GW5–Chalk5 region on chromosome 5 [22,23] and the Wx region on chromosome 6 [19]. In the GW5–Chalk5 region, QTLs having major effects for MR were detected in the TI and XM populations. In a previous study reported by Zheng et al. [11], one QTL for MR, QMr5, was also detected in this region, having an additive effect of 1.10% and R2 of 11.5%. In addition, this region was reported to affect various traits for grain chalkiness, endosperm transparency and grain size in the TI and XM populations [13,14].
The Wx gene not only plays a key role in controlling eating and cooking quality of rice, but also influences other traits including protein content, head rice recovery, grain chalkiness, and grain weight [2,3,8,9,24]. The Wx locus was segregated in the TI, ZM and XM populations, having major effects on amylose content and gel consistency [15]. The Wx region also showed significant effects on grain chalkiness, grain width and endosperm transparency in TI; on grain chalkiness and grain length in ZM; and on grain chalkiness, grain length and endosperm transparency in XM [13,14]. In the present study, this region was found to have significant effects on BR, MR and HR in TI; on HR, GY, BRY, MRY, and HRY in ZM; and on GY, BRY, MRY, and HRY in XM.
In conclusion, the GW5–Chalk5 and Wx regions are good targets for studying the genetic control of multiple traits determining grain yield, appearance quality, eating and cooking quality, milling quality, and milling yield.
5. Conclusions
A total of 77 QTLs for seven traits affecting milling yield in rice were detected using three RIL populations. All the regions harboring QTLs for grain yield were found to affect two or all three milling yield traits. QTLs for head rice yield were usually accompanied with grain yield and head rice recovery. Variations of brown and milled rice yield were mainly ascribed to grain yield, but head rice yield was determined by both grain yield and head rice recovery. Two regions covering GW5–Chalk5 and Wx loci, respectively, had a major contribution to milling quality and milling yield of rice.
Supplementary Materials
The following are available online at https://www.mdpi.com/2073-4395/10/1/75/s1, Figure S1: Frequency distribution of seven traits in three RIL populations. Table S1: Phenotypic performance of seven traits in the three RIL populations. Table S2: Simple correlation coefficients between seven traits in the RH-F4:5 population.
Author Contributions
Conceptualization, J.-Y.Z., H.-A.X. and J.-F.Z.; investigation, H.Z., Y.-J.Z., A.-D.Z., Y.-Y.F. and T.-X.H.; writing—original draft preparation, H.Z.; writing—review and editing, J.-Y.Z. All authors have read and agreed to the published version of the manuscript.
Funding
This work was supported by the Science and Technology Innovation Program of the Fujian Academy of Agricultural Sciences (Grant No. STIT 2017-1-1), the National Research and Development Program (Grant No. 2016YFD0101801), the Special Foundation of Non-Profit Research Institutes of Fujian Province (Grant No. 2018R1101013-4) and the National Natural Science Foundation of China (Grant No. 31521064).
Acknowledgments
The authors would like to thank D.-P. Li for his assistance in field work. We acknowledge Y.-F. Sun and H.-Z. Lin for their technical assistance in laboratory works.
Conflicts of Interest
The authors declare no conflict of interest.
References
- Nalley, L.; Tack, J.; Barkley, A.; Jagadish, K.; Brye, K. Quantifying the agronomic and economic performance of hybrid and conventional rice varieties. Agron. J. 2016, 108, 1514–1523. [Google Scholar] [CrossRef]
- Aluko, G.; Martinez, C.; Tohme, J.; Castano, C.; Bergman, C.; Oard, J.H. QTL mapping of grain quality traits from the interspecific cross Oryza sativa x O. glaberrima. Theor. Appl. Genet. 2004, 109, 630–639. [Google Scholar] [CrossRef] [PubMed]
- Kepiro, J.L.; McClung, A.M.; Chen, M.H.; Yeater, K.M.; Fjellstrom, R.G. Mapping QTLs for milling yield and grain characteristics in a tropical japonica long grain cross. J. Cereal Sci. 2008, 48, 477–485. [Google Scholar] [CrossRef]
- Bao, J. Genes and QTLs for rice grain quality improvement. In Rice-Germplasm, Genetics and Improvement; Yan, W., Bao, J., Eds.; Intech: Rijeka, Croatia, 2014; pp. 239–278. [Google Scholar]
- Hu, X.; Shi, Y.-M.; Jia, Q.; Xu, Q.; Wang, Y.; Chen, K.; Sun, Y.; Zhu, L.-H.; Xu, J.-L.; Li, Z.-K. Analyses of QTLs for rice panicle and milling quality traits and their interaction with environment. Acta Agron. Sin. 2011, 37, 1175–1185. [Google Scholar]
- Li, Z.F.; Wan, J.M.; Xia, J.F.; Zhai, H.Q.; Ikehashi, H. Identification of quantitative trait loci underlying milling quality of rice (Oryza sativa) grains. Plant Breed. 2004, 123, 229–234. [Google Scholar] [CrossRef]
- Nelson, J.C.; McClung, A.M.; Fjellstrom, R.G.; Moldenhauer, K.A.K.; Boza, E.; Jodari, F.; Oard, J.H.; Linscombe, S.; Scheffler, B.E.; Yeater, K.M. Mapping QTL main and interaction influences on milling quality in elite US rice germplasm. Theor. Appl. Genet. 2011, 122, 291–309. [Google Scholar] [CrossRef]
- Nelson, J.C.; Jodari, F.; Roughton, A.I.; McKenzie, K.M.; McClung, A.M.; Fjellstrom, R.G.; Scheffler, B.E. QTL mapping for milling quality in elite western U.S. rice germplasm. Crop Sci. 2012, 52, 242–252. [Google Scholar] [CrossRef]
- Tan, Y.F.; Sun, M.; Xing, Y.Z.; Hua, J.P.; Sun, X.L.; Zhang, Q.F.; Corke, H. Mapping quantitative trait loci for milling quality, protein content and color characteristics of rice using a recombinant inbred line population derived from an elite rice hybrid. Theor. Appl. Genet. 2001, 103, 1037–1045. [Google Scholar] [CrossRef]
- Dong, Y.; Tsuzuki, E.; Lin, D.; Kamiunten, H.; Terao, H.; Matsuo, M.; Cheng, S. Molecular genetic mapping of quantitative trait loci for milling quality in rice (Oryza sativa L.). J. Cereal Sci. 2004, 40, 109–114. [Google Scholar] [CrossRef]
- Zheng, T.Q.; Xu, J.L.; Li, Z.K.; Zhai, H.Q.; Wan, J.M. Genomic regions associated with milling quality and grain shape identified in a set of random introgression lines of rice (Oryza sativa L.). Plant Breed. 2007, 126, 158–163. [Google Scholar] [CrossRef]
- Lou, J.; Chen, L.; Yue, G.; Lou, Q.; Mei, H.; Xiong, L.; Luo, L. QTL mapping of grain quality traits in rice. J. Cereal Sci. 2009, 50, 145–151. [Google Scholar] [CrossRef]
- Mei, D.-Y.; Zhu, Y.-J.; Yu, Y.-H.; Fan, Y.-Y.; Huang, D.-R.; Zhuang, J.-Y. Quantitative trait loci for grain chalkiness and endosperm transparency detected in three recombinant inbred line populations of indica rice. J. Integr. Agric. 2013, 12, 1–11. [Google Scholar] [CrossRef]
- Wang, Z.; Chen, J.-Y.; Zhu, Y.-J.; Fan, Y.-Y.; Zhuang, J.-Y. Validation of qGS10, a quantitative trait locus for grain size on the long arm of chromosome 10 in rice (Oryza sativa L.). J. Integr. Agric. 2017, 16, 20–30. [Google Scholar] [CrossRef]
- Zhang, H.; Zhu, Y.-J.; Fan, Y.-Y.; Huang, T.-X.; Zhang, J.-F.; Xie, H.-A.; Zhuang, J.-Y. Identification and verification of quantitative trait loci for eating and cooking quality of rice (Oryza sativa). Plant Breed. 2019, 138, 568–576. [Google Scholar] [CrossRef]
- Huang, N.; Angeles, E.R.; Domingo, J.; Magpantay, G.; Singh, S.; Zhang, G.; Kumaravadivel, N.; Bennett, J.; Khush, G.S. Pyramiding of bacterial blight resistance genes in rice: Marker-assisted selection using RFLP and PCR. Theor. Appl. Genet. 1997, 95, 313–320. [Google Scholar] [CrossRef]
- Meng, L.; Li, H.; Zhang, L.; Wang, J. QTL IciMapping: Integrated software for genetic linkage map construction and quantitative trait locus mapping in biparental populations. Crop J. 2015, 3, 269–283. [Google Scholar] [CrossRef]
- McCouch, S.R.; CGSNL (Committee on Gene Symbolization, Nomenclature and Linkage, Rice Genetic Cooperative). Gene nomenclature system for rice. Rice 2008, 1, 72–84. [Google Scholar] [CrossRef]
- Wang, Z.Y.; Wu, Z.L.; Xing, Y.Y.; Zheng, F.G.; Guo, X.L.; Zhang, W.G.; Hong, M.M. Nucleotide sequence of rice waxy gene. Nucleic Acids Res. 1990, 18, 5898. [Google Scholar] [CrossRef]
- Fan, C.; Xing, Y.; Mao, H.; Lu, T.; Han, B.; Xu, C.; Li, X.; Zhang, Q. GS3, a major QTL for grain length and weight and minor QTL for grain width and thickness in rice, encodes a putative transmembrane protein. Theor. Appl. Genet. 2006, 112, 1164–1171. [Google Scholar] [CrossRef]
- Wang, D.-Y.; Zhang, X.-F.; Zhu, Z.-W.; Chen, N.; Min, J.; Yao, Q.; Yan, J.-L.; Liao, X.-Y. Correlation analysis of rice grain quality characteristics. Acta Agron. Sin. 2005, 31, 1086–1091. (In Chinese) [Google Scholar]
- Weng, J.; Gu, S.; Wan, X.; Gao, H.; Guo, T.; Su, N.; Lei, C.; Zhang, X.; Cheng, Z.; Guo, X.; et al. Isolation and initial characterization of GW5, a major QTL associated with rice grain width and weight. Cell Res. 2008, 18, 1199–1209. [Google Scholar] [CrossRef] [PubMed]
- Li, Y.; Fan, C.; Xing, Y.; Yun, P.; Luo, L.; Yan, B.; Peng, B.; Xie, W.; Wang, G.; Li, X.; et al. Chalk5 encodes a vacuolar H+-translocating pyrophosphatase influencing grain chalkiness in rice. Nat. Genet. 2014, 46, 398–404. [Google Scholar] [CrossRef] [PubMed]
- Zhou, P.H.; Tan, Y.F.; He, Y.Q.; Xu, C.G.; Zhang, Q. Simultaneous improvement for four quality traits of Zhenshan 97, an elite parent of hybrid rice, by molecular marker-assisted selection. Theor. Appl. Genet. 2003, 106, 326–331. [Google Scholar] [CrossRef] [PubMed]


© 2020 by the authors. Licensee MDPI, Basel, Switzerland. This article is an open access article distributed under the terms and conditions of the Creative Commons Attribution (CC BY) license (http://creativecommons.org/licenses/by/4.0/).