Abstract
Specific length amplified fragment sequencing (SLAF-seq) is a recently developed high-resolution strategy for the discovery of large-scale de novo genotyping of single nucleotide polymorphism (SNP) markers. In the present research, in order to facilitate genome-guided breeding in potato, this strategy was used to develop a large number of SNP markers and construct a high-density genetic linkage map for tetraploid potato. The genomic DNA extracted from 106 F1 individuals derived from a cross between two tetraploid potato varieties YSP-4 × MIN-021 and their parents was used for high-throughput sequencing and SLAF library construction. A total of 556.71 Gb data, which contained 2269.98 million pair-end reads, were obtained after preprocessing. According to bioinformatics analysis, a total of 838,604 SLAF labels were developed, with an average sequencing depth of 26.14-fold for parents and 15.36-fold for offspring of each SLAF, respectively. In total, 113,473 polymorphic SLAFs were obtained, from which 7638 SLAFs were successfully classified into four segregation patterns. After filtering, a total of 7329 SNP markers were detected for genetic map construction. The final integrated linkage map of tetraploid potato included 3001 SNP markers on 12 linkage groups, and covered 1415.88 cM, with an average distance of 0.47 cM between adjacent markers. To our knowledge, the integrated map described herein has the best coverage of the potato genome and the highest marker density for tetraploid potato. This work provides a foundation for further quantitative trait loci (QTL) location, map-based gene cloning of important traits and marker-assisted selection (MAS) of potato.
1. Introduction
Potato, Solanum tuberosum L., is the fourth most important food crop in the world behind maize, wheat, and rice, with a total production of more than 388 million tons in 2017 [1]. Nevertheless, cultivated potato is a highly heterozygous outcrossing autotetraploid (2n = 4x = 48), which causes complexities in genetic or genomic studies, and provides many challenges for breeding. Therefore, more breeding efforts have been focused on improving important traits, such as processing quality, nutritional value, as well as disease/pest resistance.
A high-density genetic linkage map can provide a large amount of information that facilitates map-based cloning, QTL identification, and comparative genomic researches, establishing a general tool for marker-assisted selection breeding (MAS). However, the construction of linkage maps in autopolyploids always has more difficulties than that in polyploids as well as allopolyploid species, due to their complicated segregation patterns and chromosomal pairing [2,3,4,5]. Over the past two decades, multiple linkage maps have been constructed for potato (both diploid and autotetraploid potato) for the purpose of better understanding the potato genome, facilitating map-based cloning, and developing markers for MAS [6,7,8,9,10,11]. Gebhardt et al. (1991) [6] reported the first potato map in the world, including 135 restriction fragment length polymorphism (RFLP) molecular markers and defining 12 distinct linkage groups, which was drawn from segregation data derived from the interspecific cross of diploid potato (2n = 2x = 24), S. phureja × (S. tuberosum × S. chacoense). Yamanaka et al. (2005) [10] constructed an integrated genetic linkage map of diploid potato, using 106 F1 individuals from a cross of two wild and landrace germplasm 86.61.26 × 84.194.30 as the mapping population. This map included 13 newly developed P450-based analogue (PBA), 27 random amplified polymorphic DNA (RAPD), 4 inter-simple sequence repeat (ISSR), 22 simple sequence repeat (SSR), 9 restriction fragment length polymorphism-sequence-tagged sites (RFLP-STSs), and 7 RFLP markers, with a coverage of 673 cM and an average marker distance of 8.2 cM. Van Os et al. (2006) [11] constructed an ultradense map of potato with more than 10,000 amplified fragment length polymorphism (AFLP) markers from a heterozygous diploid potato population. It is also the densest meiotic recombination map ever constructed.
With the rapid development of next-generation sequencing technologies, single nucleotide polymorphism (SNP) markers have been developed to construct high-density genetic linkage maps for many important crop species, such as maize [12,13], rice [14,15], and wheat [16,17]. For potato, Xun et al. (2011) [18] used a homozygous double-monoploid potato clone to sequence and assemble 86% of the 844-megabase genome, which bridged the gap between genomics and applied breeding with an in-depth understanding of the structure and function of the potato genome, and provided an effective tool and data to develop potato SNP markers. To date, several high-density genetic linkage maps based on SNP markers have been reported with the accomplishment and subsequent development of the potato’s whole genome sequence. Felcher et al. (2012) [19] first used SNP markers and two diploid potato populations to create two linkage maps, where over 4400 markers were mapped, including 787 markers common to both populations, and the map sizes were 965 and 792 cM, respectively. Hackett et al. (2013) [20] constructed a high-density SNP map of tetraploid potato based on obtained Infinium 8300 Potato SNP Array data, which included 1130 markers with a coverage of 1087.5 cM, using a mapping population of 190 progenies from a cross between the breeding clone 12601ab1 and the cultivar stirling. Endelman et al. (2016) [21] first used a diploid inbred line-based F2 population to construct a genetic linkage map of diploid potato with 2264 SNP markers. To sum up, most potato linkage maps are generated from diploid populations of wild species and primitive cultivars. Linkage mapping in tetraploid potato species is still a challenge despite the recent advances in mapping methodology, genotyping, and molecular marker technology.
Due to the advances in next generation sequencing (NGS) technologies, new high-throughput genotyping methods hold promise for the detection of a large number of SNPs in a short time, which include genotyping-by-sequencing (GBS) [22], complexity reduction of polymorphic sequences (CroPSs) [23], restriction site-associated DNA sequencing (RAD-seq) [24,25], and specific length amplified fragment sequencing (SLAF-seq) [26]. Specific-locus amplified fragment sequencing (SLAF-seq) technology, reported by Sun et al. (2013) [26], is an efficient strategy for the de novo SNP discovery and genotyping of large populations based on an enhanced reduced representation library (RRL) sequencing method. The advantages of SLAF-seq technology are: (i) Deep sequencing to ensure genotyping accuracy; (ii) a lower sequencing cost; (iii) pre-designed RRL scheme to optimize marker efficiency; (iv) and double barcode multiplexed sequencing system for large population and large numbers of loci. To date, this strategy has been applied to various species for SNP high-density genetic mapping, such as cucumber [27], Agropyron gaertn [28], and orchardgrass [29], due to its advantages of optimized marker efficiency, accurate genotyping, affordable price, and applicability for large populations. In the present research, an F1 mapping population of 106 individuals was created from the cross between two tetraploid potato varieties, YSP-4 × MIN-021. We used the SLAF-seq approach to construct a high-density integrated SNP genetic linkage map of tetraploid potato, which will expedite map-based cloning efforts, QTL location for important traits, as well as marker-assisted selection breeding for tetraploid potato.
2. Materials and Methods
2.1. Plant Materials
The F1 mapping population consisted of 106 individuals from a cross between two tetraploid potato varieties, YSP-4 (female) and MIN-021 (male). YSP-4 is a wild tetraploid potato material, which has a short growth period, moderate tuber numbers per plant, high commodity potato rate, and high starch content (ca. 18%). This material is also highly resistant to early blight and virus disease. MIN-021 is a tetraploid potato material, which has a short growth period, high yield, and high starch content (ca. 19%). All the materials were planted in the potato breeding base of Inner Mongolia Agricultural University. The field trial was arranged in randomized complete block design (RCBD) with three replications per plot. Each plot contained 20 plants, which were grown in 2 rows with a spacing of 30 cm within rows and 90 cm between rows, and the planting depth was about 12 cm. The experiment field had sandy soil with pH 7.8 to 8.2, good irrigation conditions with annual precipitation from 300 to 400 mm, and the geographic position is 111°42′ E, 45°57′ N, with an altitude of 1063 m.
2.2. DNA Extraction
At the potato squaring stage, the genomic DNA of all parents and 106 progenies was extracted from young fresh leaf tissue by the Plant Genomics DNA Kit (Tiangen, Beijing, China). Then, the quality of DNA was determined by electrophoresis on a 1% (w/v) agarose gel stained with ethidium bromide, and the concentration was quantified by an ND-1000 Spectrophotometer (Nano Drop, Wilmington, DE, USA) and adjusted to a concentration of 50 ng/µL.
2.3. SLAF Library Preparation and Sequencing
According to the genome size and GC (guanine-cysteine) content of the tested materials, the potato genome (http://solanaceae.plantbiology.msu.edu/pgsc_download.shtml) was selected as a reference genome to make predictions of the electronic enzyme, and finally determine the enzyme combination of Rsa I and Hae III to digest the genomic DNA of the 106 F1 individuals and their two parents. The read length used for sequencing ranged from 264 to 394 bp. The SLAF labels (the length of fragments ranged from 314 to 364 bp) were selected for paired-end sequencing (125 bp per end) on an Illumina HiSeq 2500 sequencing platform, performed by the Beijing Biomarker Technologies Corporation (http://Biomarker.com.cn/). The SLAFs with a sequence depth of less than 10-fold were considered as low-depth SLAFs and filtered out. Several steps were defined to deal with SLAF-seq data: Samples were distinguished by barcodes and data grouping by sequence similarity; sequence error evaluation by control data; minor allele frequency (MAF) filtering and SLAF definition; correction of sequence errors; and definition and evaluation of genotypes. In addition, the quality score algorithm was developed to evaluate the quality of SNP discovery and genotyping, which can help researchers balance accuracy and cost during heterozygote detection using high-throughput sequencing technology. The Q30 (a quality score of 30; indicating 99.90% confidence) was used to evaluate the sequencing quality of reads, and examination of the base distribution was used to detect the GC content of the raw data for data quality control. The raw sequence reads were deposited in the NCBI-short read archive (SRA) database (accession: PRJNA597429).
2.4. SLAF Data Analysis and Development of SNP Markers
The approach of clustering among reads was used to develop and search for polymorphic SLAF labels from 106 F1 individuals and their parents. All paired-end reads generated from SLAF-seq raw reads were compared according to their sequence similarity as detected by the BLAST-like alignment tool (BLAT) [30]. The F1 individual sequence reads were aligned on the referenced potato genome using Burrows–Wheeler Aligner (BWA) software [31]. Identical reads from different samples were clustered, and the fragment with over 90% sequence identity was defined as an SLAF label. The SLAF labels with differences in high-depth fragments were also considered as SNP or indel markers. According to the differences among sequences or allele numbers, the SLAF labels were divided into three categories, including NoPoly (non-polymorphic), Poly (polymorphic), and Repeat (repetitive). After comparing the sequence differences on SLAFs from each sample, the polymorphic SLAF labels were screened for further analysis. Both Sequence Alignment/Map tools (SAMtools) [32] and Genome Analysis Tookit (GATK) [33] were used to identify SNPs, and their intersection was identified as the candidate SNP dataset. Only biallelic SNPs were retained as the final SNPs. The SNP locus were confirmed from the polymorphic SLAF labels, with the screening criteria of MAF > 0.5.
2.5. Construction of High-Density Linkage Map
The HighMap software was used to construct a high-density genetic linkage map of tetraploid potato [34]. The single-linkage clustering algorithm was used to cluster the SNP markers, which were ordered into linkage groups. The high quality MLOD value among SLAF labels was calculated and used for linkage grouping. The genotyping errors were corrected using the module of error genotyping correction of HighMap sofware.
3. Results
3.1. SLAF Library Construction and SLAF Labels Development
The in silico restriction enzyme combination of RsaI and HaeIII was used for genome DNA digestion and the prediction of the potato reference genome. A total of 334,787 SLAF labels were predictably obtained, which were evenly distributed on the genome. The rice genome (Oryza sativa) was used as a control for the restriction enzyme digestion control trial, in order to indirectly monitor the progress of the potato SLAF library construction. Compared with the control, the ratio of paired-end mapping reads was 89.20%, and the digestion efficiency of the RsaI and HaeIII restriction enzymes was 90.91%, which indicated that the potato SLAF library was constructed normally and suitable for high-throughput sequencing.
After SLAF library construction and high-throughput sequencing, a total of 2269.98 million pair-end reads (556.71 Gb data) with a length of 100 bp were obtained. The Q30 ratio was 95.05%, and the average GC (guanine-cytosine) content was 35.51%. Of all the high-quality data, 48,849,737 reads were from the male parent MIN-21, 41,510,213 reads were from the female parent YSP-4, and the average 90,562,465 reads were from 106 offspring of the F1 mapping population (Table 1). According to bioinformatics analysis, a total of 838,604 SLAF labels were developed, with an average depth of 26.14-fold and 15.36-fold for each SLAF of the parents and offspring, respectively. Of all the 838,604 high-quality SLAFs, 282,838 were polymorphic, of which 113,473 polymorphic SLAFs could be used for map construction.

Table 1.
Basic statistic of the SLAF-seq data in tetraploid potato.
3.2. SNP Marker Detection
A total of 7638 SLAF labels were screened from 113,473 polymorphic SLAFs, which were successfully classified into four segregation patterns: Hk × hk, lm × ll, nn × np, and ef × eg (Table 2). The patterns, except aa × bb, were used for later genetic map construction which was suitable for the F1 population, because the potato F1 population was not obtained by a cross between two fully homozygous parents with genotype aa or bb. After filtering out the SNP markers with sequence depths no more than 4-fold, a total of 7329 SNP markers were detected from 7638 SLAFs for map construction.
Table 2.
The number of SLAFs in different types of segregation patterns for map construction.
3.3. Construction of the Genetic Linkage Map
After four quality control steps, the 7329 screened SNPs were used to calculate the modified logarithm of odds (MLOD) values between two markers [35]. The markers with an MLOD value of less than three were filtered, and the remaining markers were grouped into 12 linkage groups (LGs). The HighMap software was used to analyze the linear arrangements of all the grouped SNPs and the genetic distance between adjacent SNP markers within each LG. An integrated map as well as two separate linkage maps for the female and male parents were constructed, including 12 linkage groups.
In YSP-4, the maternal linkage map contained 1638 SNP markers, which covered a total length of 1383.86 cM, with an average marker distance of 0.83 cM. The number of markers in the linkage groups ranged from 43 to 341 markers, with an average of 137 markers. The length of LGs ranged from 32.82 to 282.89 cM, with an average size of 0.84 cM (Table A1). In MIN-021, the paternal linkage map consisted of 1402 SNP markers, and covered a total length of 1203.94 cM, with an average marker distance of 0.87 cM. The number of mapped markers in the LGs ranged from 542 to 243, with an average of 117 markers. The length of LGs ranged from 26.05 to 170.2 cM, with an average size of 100.33 cM (Table A2).
The integrated genetic map included 3001 SNP markers, which covered a total length of 1415.88 cM, and the average distance between adjacent markers was 0.47 cM. The number of markers in the linkage groups ranged from 43 to 341 markers, with an average of 137 markers. The length of LGs ranged from 45.02 to 282.89 cM, with an average size of 117.99 cM (Table 3, Figure 1 and Figure A1). LG chr10 was not only the shortest but also the densest group, with 440 loci spanning 33.47 cM, which had an average marker density of 0.08 cM. LG chr2 was the longest group, with 225 loci spanning 205.09 cM. The largest gap on this map was 25.19 cM, located in LG chr7 (Table 3; Figure 1).
Table 3.
The integrated genetic map for tetraploid potato.
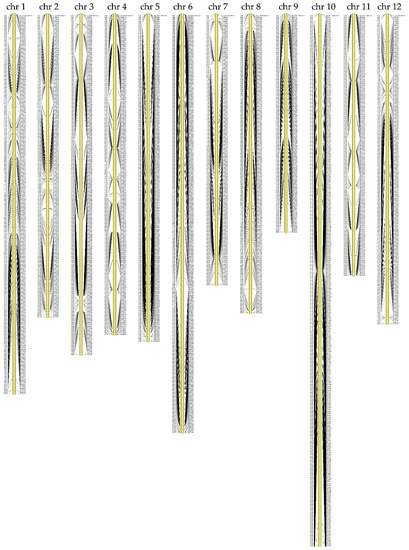
Figure 1.
The high-density integrated genetic map of tetraploid potato. A total of 3001 SNP markers were distributed in 12 linkage groups, covering 1415.88 cM, with an average interval of 0.47 cM between markers.
The average depth of the SNP markers on the integrated map was 85.63-fold in the paternal parent MIN-021 and 65.10-fold in the maternal parent YSP-4, as well as 40.34-fold in the offspring of the F1 population. Segregation distortion is occurs when the segregation ratio deviates from the expected Mendelian ratio, which is considered as a powerful driving force for organic evolution [36]. The Chi-square (χ2) test (α = 0.05) was used to analyze the goodness-of-fit to the expected segregation ratios for all the SNP markers. A total of 80 out of 3001 markers (2.7%) did not fit the expected segregation ratios at a level of α ≤ 0.05. The distorted SNP markers were mainly located on LG chr 3, chr 5, chr 7, chr 8, chr 11, and chr 12 (Table 4).
Table 4.
The distorted SNP markers on integrated genetic map of tetraploid potato.
3.4. Evaluation of the Genetic Map
The quality of this genetic map was evaluated by haplotype maps and heat maps, which directly revealed the recombination relationship among SNP markers in the 12 LGs. Haplotype maps were created to reflect the crossover events. The recombination events of the 12 LGs are shown on the haplotype maps (Figure A2). The haplotype maps from 12 LGs showed that all LGs had an extremely low double crossover rate, which indicated the genetic map had a high quality.
Heat maps were also constructed to evaluate the quality of the genetic map by using pair-wise recombination values for the 3001 SNP markers (Figure A3). It showed that most of the heat maps for 12 LGs performed well in visualization, which indicated that the markers were well-ordered, and the genetic distances of adjacent markers were accurate in each LG.
4. Discussion
4.1. The Development of SNP Markers Using SLAF-seq Technology
A genetic linkage map is the basis for QTL identification of important traits, map-based gene cloning, and molecular marker-assisted breeding of crops. Different types and numbers of polymorphic markers were used to construct genetic maps. For potato, most genetic linkage maps were mainly based on several conventional low-throughput molecular markers, including RFLP [6,7,8,9,10], AFLP [9,11], as well as RAPD, ISSR, and SSR markers [10]. However, it is time-consuming and costly to construct a high-density genetic map for potato using conventional molecular marker technologies. SNP markers are the most frequent polymorphisms and are suitable for high-throughput genotyping. In addition, many SNP markers are located within transcribed regions, which can generate more links between the genetic and physical maps. To date, high-density polymorphic SNP markers have been used in potato for large-scale genotyping and high-density genetic map construction [19,20,21].
SNP markers can be rapidly developed on a large scale by different high-throughput sequencing technologies and genotyping methods, such as genotyping by sequencing (GBS) [22], restriction site-associated sequencing (RAD-seq) [24,25], and SLAF-seq. The SLAF-seq technology, a combination of locus-specific amplification and high-throughput sequencing, provides a high-resolution strategy with a shorter period of time and lower cost for large-scale genotyping and can be generally applicable to various species and populations [26].
In the present research, we first used SLAF-seq technology in potato to develop SNP markers and construct the high-density genetic map. A total of 2269.98 million pair-end reads were obtained based on high-throughput sequencing. According to bioinformatics analysis, a total of 838,604 SLAF labels were generated, of which 282,838 were polymorphic. Finally, a total of 7329 polymorphic SNP markers were developed for high-density genetic map construction. The present study extends the utility of SLAF-seq technology to potato. The results showed that SLAF-seq was an effective tool to rapid develop large-scale SNP markers, which met the requirements for high-density genetic map construction of tetraploid potato.
4.2. Mapping Population and Strategies
In general, the F2, backcross (BC), doubled haploid (DH), or recombinant inbred lines (RIL)population are used as an appropriate mapping population to construct genetic linkage maps [5,37,38]. However, for most autopolyploid species, it is very difficult to obtain a typical family-based population in potato because of its high heterozygosity. To date, most of the reported potato linkage maps have been established by applying a double pseudo-testcross strategy on an F1 population. The double pseudo-testcross strategy was first put forward by Grattapaglia and Sederoff (1994) [37] to construct the genetic linkage map for genetically heterozygous species of forest trees. An F1 population was used as a mapping population by crossing between two irrelevant and highly heterozygous parents. The gene segregation patterns were assumed as a backcross. Afterwards, this strategy has been widely used to construct linkage maps for those heterozygous species, such as danshen [39], pineapple [40], rhodesgrass [41], and sweet potato [5].
In the present research, an F1 segregation population from a cross YSP-4 × MIN-021 was created, of which 106 individuals were randomly selected and used for SNP genotyping and map construction based on the double pseudo-testcross strategy. In the pseudo-testcross, a total of 7638 polymorphic SLAF markers were classified into four segregation patterns, which were hk × hk, lm × ll, nn × np, and ef × eg. The 7329 SNP markers screened and confirmed from 7638 polymorphic SLAFs were then used to construct a genetic linkage map. In our study, among the 838,604 high-quality SLAFs, 282,838 were polymorphic, with a polymorphic rate of 33.7%. It indicates that there is considerable genetic difference between YSP-4 and MIN-021. Therefore, it is suitable to use them as mapping parents, and the F1 population derived from the cross between them conforms to the requirements of the mapping population for high-density map construction.
4.3. The High-Density Genetic Map of Tetraploid Potato
Segregation distortion is a common phenomenon that has been observed in many studies [42,43,44]. It may generate from cytological attributes, genetic drift, gametophyte selection, or some biological reasons [45,46]. Segregation distortion could alter the estimation of recombination and cause a spurious linkage [47]. Therefore, distorted markers may affect the accuracy of genetic maps. In our study, only 2.7% SNP markers located on the integrated map were distorted markers, which indicated the high map accuracy.
To our knowledge, only one high-density SNP genetic linkage map for tetraploid potato was reported because of the high heterozygosity of autotetraploid potato [20]. In the present research, we first used the SLAF-seq method for genotyping and developing SNP markers, and constructed high-density genetic maps of tetraploid potato. The integrated map included 3001 SNP markers, and had a genetic length of 1415.88 cM, with an average distance between markers of 0.47 cM. Compared with the map obtained by Hackett et al. (2013) [20], the integrated map had more SNP markers (3001 vs. 1130), higher marker density (0.47 cM vs. 1.60 cM), and larger total length (1415.88 cM vs. 1087.5 cM). Thus, our map has better coverage of the potato genome and nearer marker density.
5. Conclusions
In the present study, the SLAF-seq technology was first successfully used for the development of large-scale SNP markers and the construction of high-density linkage maps in tetraploid potato. The integrated high genetic linkage map generated here has the best coverage of the potato genome and the nearest marker density reported for tetraploid potato until now. This work represents an important step forward in genomics and marker-assisted breeding of tetraploid potato. It also provides a foundation for QTL location and map-based gene cloning of important traits for potato, such as tuber yield, starch content, and protein content. In addition, the application of SLAF-seq strategy and the mapping population in our study will provide valuable references for other tetraploid plants.
Author Contributions
Z.Y. and X.Y. conceived and designed the research. Z.Y., X.Y. and M.Z. performed the experiments. X.Y. and M.Z. completed the writing of the article. D.Y., J.L. (Jingwei Li), G.W., and J.L. (Jiaqi Li) assisted in the completion of the experiments. All authors have read and agreed to the published version of the manuscript.
Funding
This work was supported by grants from the Inner Mongolia Major Science and Technology Project (zdzx2018019), Inner Mongolia Youth Science and Technology Talents Project for Colleges and Universities (NJYT-18-B04), Inner Mongolia Natural Science Foundation (2018MS03040), Major Project for Inner Mongolia Science and Technology Program (201602048), and Animal and Plant Breeding Project for Transformation of Scientific Achievements in Inner Mongolia Agricultural University (YZGC2017006).
Conflicts of Interest
The authors declare no conflict of interest.
Appendix A
Table A1.
The maternal genetic map for tetraploid potato.
Table A1.
The maternal genetic map for tetraploid potato.
| Linkage Group (ID) | Total Marker | Total Distance (cM) | Average Distance (cM) | Max Gap (Cm) | Gap ≥ 5 cM (%) |
|---|---|---|---|---|---|
| chr1 | 43 | 54.06 | 1.29 | 26.6 | 95.24 |
| chr2 | 70 | 199.96 | 2.9 | 66.56 | 86.96 |
| chr3 | 138 | 58.29 | 0.43 | 48.73 | 99.27 |
| chr4 | 107 | 149.13 | 1.41 | 30.15 | 93.4 |
| chr5 | 167 | 45.02 | 0.27 | 21.7 | 98.8 |
| chr6 | 235 | 172.13 | 0.74 | 31.9 | 95.73 |
| chr7 | 153 | 282.89 | 1.86 | 88.65 | 94.74 |
| chr8 | 153 | 116.85 | 0.77 | 15.34 | 96.71 |
| chr9 | 80 | 91.37 | 1.16 | 55.92 | 98.73 |
| chr10 | 341 | 32.82 | 0.1 | 7.32 | 99.85 |
| chr11 | 57 | 123.36 | 2.2 | 31.91 | 91.07 |
| chr12 | 94 | 57.8 | 0.62 | 16.63. | 96.77 |
| Total | 1638 | 1383.68 | 0.84 | 88.65 | 95.62 |
Table A2.
The paternal genetic map for tetraploid potato.
Table A2.
The paternal genetic map for tetraploid potato.
| Linkage Group (ID) | Total Marker | Total Distance (cM) | Average Distance (cM) | Max Gap (cM) | Gap ≥ 5 cM (%) |
|---|---|---|---|---|---|
| chr1 | 243 | 117.29 | 0.48 | 12.87 | 99.17 |
| chr2 | 156 | 167.27 | 1.08 | 28.45 | 96.77 |
| chr3 | 125 | 51.51 | 0.42 | 15.34 | 96.77 |
| chr4 | 132 | 151.04 | 1.15 | 51.29 | 95.42 |
| chr5 | 76 | 83.47 | 1.11 | 10.46 | 93.33 |
| chr6 | 83 | 77.56 | 0.95 | 37.57 | 96.34 |
| chr7 | 52 | 101.5 | 1.99 | 71.52 | 96.08 |
| chr8 | 71 | 88.68 | 1.27 | 70.27 | 98.57 |
| chr9 | 82 | 108.18 | 1.34 | 16.63 | 93.83 |
| chr10 | 102 | 52.42 | 0.52 | 10.46 | 98.02 |
| chr11 | 138 | 178.97 | 1.31 | 41.74 | 96.35 |
| chr12 | 142 | 26.05 | 0.18 | 3.92 | 100 |
| Total | 1402 | 1203.94 | 0.87 | 71.52 | 96.72 |

Figure A1.
The SNP distribution on the potato genome. The x-axis represents the chromosome length and the y-axis indicates the chromosome code. Each band represents a chromosome, and the genome is divided according to the size of 1 M. The more SNPs in each band, the darker the color; the smaller the number of SNPs, the lighter the color. The darker areas in the figure are the areas where SNPs are concentrated.

Figure A2.
Haplotype maps for 12 linkage groups of the integrated genetic map for tetraploid potato. The haplotype maps consist of 12 maps from LG chr 1 to LG chr 12. Each two columns represent the genotype of an individual. Blank columns are used between two individuals. The first and second columns represent the paternal and maternal chromosome, respectively. Rows correspond to genetic markers. Green and blue boxes indicate one chromatid from parents, and gray boxes indicate missing data.

Figure A3.
Heat maps for 12 linkage groups of the integrated genetic map for tetraploid potato. The heat maps consist of 12 maps from LG chr 1 to LG chr 12. Markers of each row and column are ranked according to the map order. Each small square represents the rate of recombination between two markers. Yellow color represents highly tight linkage; red color represents relatively weak linkage, the darker the red color, the less tight linkage; and blue color represents no linkage.
References
- FAOSTAT. 2017. Available online: http://faostat.fao.org/site/339/default.aspx (accessed on 2 September 2019).
- Hermsen, J.G.T. Nature, evolution and breeding of polyploids. Iowa State J. Res. 1984, 58, 411–420. [Google Scholar]
- Sybenga, J. Chromosome pairing affinity and quadrivalent formation in polyploids: Do segmental allopolyploids exist? Genome 1996, 39, 1176–1184. [Google Scholar] [CrossRef]
- Cervantes-Flores, J.C.; Yencho, G.C.; Kriegner, A.; Pecota, K.V.; Faulk, M.A.; Mwanga, R.O.M.; Sosinski, B.R. Development of a genetic linkage map and identification of homologous linkage groups in sweetpotato using multiple-dose AFLP markers. Mol. Breed. 2008, 21, 511–532. [Google Scholar] [CrossRef]
- Zhao, N.; Yu, X.X.; Jie, Q.; Li, H.; Li, H.; Hu, J.; Zhai, H.; He, S.Z.; Liu, Q.C. A genetic linkage map based on AFLP and SSR markers and mapping of QTL for dry-matter content in sweetpotato. Mol. Breed. 2013, 32, 807–820. [Google Scholar] [CrossRef]
- Gebhardt, C.; Ritter, E.; Barone, A.; Debener, T.; Walkemeier, B.; Schachtschabel, U.; Kaufmann, H.; Thompson, R.D.; Bonierbale, M.W.; Ganal, M.W. RFLP maps of potato and their alignment with the homoeologous tomato genome. Theor. Appl. Genet. 1991, 83, 49–57. [Google Scholar] [CrossRef] [PubMed]
- Tanksley, S.D.; Ganal, M.W.; Prince, J.P.; De Vicente, M.C.; Bonierbale, M.W.; Broun, P.; Fulton, T.M.; Giovannoni, J.J.; Grandillo, S.; Martin, G.B. High density molecular linkage maps of the tomato and potato genomes. Genetics 1992, 132, 1141–1160. [Google Scholar] [PubMed]
- Jacobs, J.M.E.; Van Eck, H.J.; Arens, P.; Verkerk-Bakker, B.; Te Lintel Hekkert, B.; Bastiaanssen, H.J.M.; El-Kharbotly, A.; Pereira, A.; Jacobsen, E.; Stiekema, W.J. A genetic map of potato (Solanum tuberosum) integrating molecular markers, including transposons, and classical markers. Theor. Appl. Genet. 1995, 91, 289–300. [Google Scholar] [CrossRef]
- Caromel, B.; Mugniéry, D.; Lefebvre, V.; Andrzejewski, S.; Ellissèche, D.; Kerlan, M.C.; Rousselle, P.; Roussellebourgeois, F. Mapping QTLs for resistance against Globodera pallida (Stone) Pa2/3 in a diploid potato progeny originating from Solanum spegazzinii. Theor. Appl. Genet. 2003, 106, 1517–1523. [Google Scholar] [CrossRef]
- Yamanaka, S.; Ikeda, S.; Imai, A.; Luan, Y.; Watanabe, J.A.; Watanabe, K.N. Construction of integrated genetic map between various existing DNA markers and newly developed P450-related PBA markers in diploid potato (Solanum tuberosum). Breed. Sci. 2005, 55, 223–230. [Google Scholar] [CrossRef]
- Van Os, H.; Andrzejewski, S.; Bakker, E.; Barrena, I.; Glenn, J.B.; Caromel, B.; Ghareeb, B.; Isidore, E.; De Jong, W.; Van Koert, P. Construction of a 10,000-marker ultradense genetic recombination map of potato: Providing a framework for accelerated gene isolation and a genomewide physical map. Genetics 2006, 173, 1075–1087. [Google Scholar] [CrossRef]
- Sa, K.J.; Park, J.Y.; Park, K.C.; Ju, K.L. Analysis of genetic mapping in a waxy/dent maize RIL population using SSR and SNP markers. Genes. Genom. 2012, 34, 157–164. [Google Scholar] [CrossRef]
- Su, C.F.; Wang, W.; Gong, S.L.; Zuo, J.H.; Li, S.J.; Xu, S.Z. High density linkage map construction and mapping of yield trait QTLs in maize (Zea mays) using the genotyping-by-sequencing (GBS) technology. Front. Plant Sci. 2017, 8, 706–719. [Google Scholar] [CrossRef] [PubMed]
- Zhai, H.J.; Feng, Z.Y.; Liu, X.Y.; Cheng, X.J.; Peng, H.R.; Yao, Y.Y.; Sun, Q.X.; Ni, Z.F. A genetic linkage map with 178 SSR and 1 901 SNP markers constructed using a RIL population in wheat (Triticum aestivum L.). J. Integr. Agric. 2015, 14, 1697–1705. [Google Scholar] [CrossRef]
- Leon, T.B.D.; Linscombe, S.; Subudhi, P.K. Molecular dissection of seedling salinity tolerance in rice (Oryza sativa L.) using a high-density GBS-based SNP linkage map. Rice 2016, 9, 52–73. [Google Scholar] [CrossRef] [PubMed]
- Yang, Q.; Yang, Z.J.; Tang, H.F.; Yu, Y.; Chen, Z.Y.; Wei, S.H.; Sun, Q.X.; Peng, Z.S. High-density genetic map construction and mapping of the homologous transformation sterility gene (hts) in wheat using gbs markers. BMC Plant Biol. 2018, 18, 301–309. [Google Scholar] [CrossRef] [PubMed]
- Colasuonno, P.; Gadaleta, A.; Giancaspro, A.; Nigro, D.; Giove, S.; Incerti, O.; Mangini, G.; Signorile, A.; Simeone, R.; Blanco, A. Development of a high-density SNP-based linkage map and detection of yellow pigment content QTLs in durum wheat. Mol. Breed. 2014, 34, 1563–1578. [Google Scholar] [CrossRef]
- Xu, X.; Pan, S.K.; Cheng, S.F.; Zhang, B.; Mu, D.S.; Ni, P.X.; Zhang, G.Y.; Yang, S.; Li, R.Q.; Wang, J. Genome sequence and analysis of the tuber crop potato. Nature 2011, 475, 189–195. [Google Scholar]
- Felcher, K.J.; Coombs, J.J.; Massa, A.N.; Hansey, C.N.; Hamilton, J.P.; Veilleux, R.E.; Buell, C.R.; Douches, D.S. Integration of two diploid potato linkage maps with the potato genome sequence. PLoS ONE 2012, 7, e36347. [Google Scholar] [CrossRef]
- Hackett, C.A.; Mclean, K.; Bryan, G.J. Linkage analysis and QTL mapping using SNP dosage data in a tetraploid potato mapping population. PLoS ONE 2013, 8, e63939. [Google Scholar] [CrossRef]
- Endelman, J.B.; Jansky, S.H. Genetic mapping with an inbred line-derived F2 population in potato. Theor. Appl. Genet. 2016, 129, 935–943. [Google Scholar] [CrossRef]
- Elshire, R.J.; Glaubitz, J.C.; Sun, Q.; Poland, J.A.; Kawamoto, K.; Buckler, E.S.; Mitchell, S.E. A robus, simple genotyping by-sequencing (GBS) approach for high diversity species. PLoS ONE 2011, 6, e19379. [Google Scholar] [CrossRef] [PubMed]
- Van Orsouw, N.J.; Hogers, R.C.; Janssen, A.; Yalcin, F.; Snoeijers, S.; Verstege, E.; Schneiders, H.; van der Poel, H.; Van Oeveren, J.; Verstegen, H.; et al. Complexity reduction of polymorphic sequences (CRoPS): A novel approach for large-scale polymorphism discovery in complex genomes. PLoS ONE 2007, 2, e1172. [Google Scholar] [CrossRef] [PubMed]
- Miller, M.R.; Dunham, J.P.; Amores, A.; Cresko, W.A.; Johnson, E.A. Rapid and cost-effective polymorphism identification and genotyping using restriction site associated DNA (RAD) markers. Genome Res. 2007, 17, 240–248. [Google Scholar] [CrossRef] [PubMed]
- Baird, N.A.; Etter, P.D.; Atwood, T.S.; Currey, M.C.; Shiver, A.L.; Lewis, Z.A.; Selker, E.U.; Cresko, W.A.; Johnson, E.A. Rapid SNP discovery and genetic mapping using sequenced RAD markers. PLoS ONE 2008, 3, e3376. [Google Scholar] [CrossRef]
- Sun, X.W.; Liu, D.Y.; Zhang, X.F.; Li, W.B.; Liu, H.; Hong, W.G.; Jiang, C.B.; Guan, N.; Ma, C.X.; Zeng, H.P. SLAF-seq: An efficient method of large-scale de novo SNP discovery and genotyping using high-throughput sequencing. PLoS ONE 2013, 8, e58700. [Google Scholar] [CrossRef] [PubMed]
- Xu, X.W.; Lu, L.; Zhu, B.Y.; Xu, Q.; Qi, X.H.; Chen, X.H. QTL mapping of cucumber fruit flesh thickness by SLAF-seq. Sci. Rep. 2015, 5, 15829. [Google Scholar] [CrossRef]
- Zhang, Y.; Zhang, J.P.; Huang, L.; Gao, A.N.; Yang, X.M.; Liu, W.H.; Li, X.Q.; Li, L.H. A high-density genetic map for P genome of Agropyron Gaertn. based on specific-locus amplified fragment sequencing (SLAF-seq). Planta 2015, 242, 1335–1347. [Google Scholar] [CrossRef]
- Zhao, X.X.; Huang, L.K.; Zhang, X.Q.; Wang, J.P.; Yan, D.F.; Li, J.; Tang, L.; Li, X.L.; Shi, T.W. Construction of high-density genetic linkage map and identification of flowering-time QTLs in orchardgrass using SSRs and SLAF-seq. Sci. Rep. 2016, 6, 29345. [Google Scholar] [CrossRef]
- Ken, W.J. BLAT—The BLAST-like alignment tool. Genome Res. 2002, 12, 656–664. [Google Scholar]
- Li, H.; Durbin, R. Fast and accurate short read alignment with Burrows-Wheeler transform. Bioinformatics 2009, 25, 1754–1760. [Google Scholar] [CrossRef]
- Depristo, M.A.; Banks, E.; Poplin, R.E.; Garimella, K.V.; Maguire, J.R.; Hartl, C. A framework for variation discovery and genotyping using next-generation DNA sequencing data. Nat. Genet. 2011, 43, 491–498. [Google Scholar] [CrossRef] [PubMed]
- Li, H.; Handsaker, B.; Wysoker, A.; Fennell, T.; Ruan, J.; Homer, N.; Marth, G.; Abecasis, G.; Durbin, R. The sequence Alignment/Map format and SAMtools. Bioinformatics 2009, 25, 2078–2079. [Google Scholar] [CrossRef] [PubMed]
- Liu, D.Y.; Ma, C.X.; Hong, W.G.; Huang, L.; Liu, M.; Liu, H.; Zeng, H.P.; Deng, D.J.; Xin, H.G.; Song, J.; et al. Construction and analysis of high-density linkage map using high-throughput sequencing data. PLoS ONE 2014, 9, e98855. [Google Scholar] [CrossRef] [PubMed]
- Vision, T.J.; Brown, D.G.; Shmoys, D.B.; Durrett, R.T.; Tanksley, S.D. Selective mapping: A strategy for optimizing the construction of high-density linkage maps. Genetics 2000, 155, 407–420. [Google Scholar]
- Foisset, N.; Delourme, R.; Barret, P.; Hubert, N.; Landry, B.S.; Renard, M. Molecular-mapping analysis in Brassica napus using isozyme, RAPD and RFLF markers on a doubled-haploid progeny. Theor. Appl. Genet. 1996, 93, 1017–1025. [Google Scholar] [CrossRef]
- Grattapaglia, D.; Sederoff, R. Genetic linkage maps of eucalyptus grandis and eucalyptus urophylla using a pseudo-testcross: Mapping strategy and RAPD markers. Genetics 1994, 137, 1121–1137. [Google Scholar]
- Venkat, S.K.; Bommisetty, P.; Patil, M.S.; Reddy, L.; Chennareddy, A. The genetic linkage maps of anthurium species based on RAPD, ISSR and SRAP markers. Sci. Hortic. 2014, 178, 132–137. [Google Scholar] [CrossRef]
- Liu, T.; Guo, L.L.; Pan, Y.L.; Zhao, Q.; Wang, J.H.; Song, Z.Q. Construction of the first high-density genetic linkage map of salvia miltiorrhiza using specific length amplified fragment (SLAF) sequencing. Sci. Rep. 2016, 6, 24070. [Google Scholar] [CrossRef]
- Carlier, J.D.; Reis, A.; Duval, M.F.; Coppens d’Eeckenbrugge, G.; Leitao, J.M. Genetic maps of RAPD, AFLP and ISSR markers in Ananas bracteatus and A. comosus using the pseudo-testcross strategy. Plant Breed. 2010, 123, 186–192. [Google Scholar] [CrossRef]
- Ubi, B.E.; Fujimori, M.; Mano, Y.; Komatsu, T. A genetic linkage map of rhodesgrass based on an F1 pseudo-testcross population. Plant Breed. 2010, 123, 247–253. [Google Scholar] [CrossRef]
- Cloutier, S.; Ragupathy, R.; Niu, Z.; Duguid, S. SSR-based linkage map of flax (Linum usitatissimum L.) and mapping of QTLs underlying fatty acid composition traits. Mol. Breed. 2011, 28, 437–451. [Google Scholar] [CrossRef]
- Escudero, M.; Hahn, M.; Hipp, A.L. RAD-seq linkage mapping and patterns of segregation distortion in sedges: Meiosis as a driver of karyotypic evolution in organisms with holocentric chromosomes. J. Evol. Biol. 2018, 31, 833–843. [Google Scholar] [CrossRef] [PubMed]
- Moreira, F.M.; Madini, A.; Marino, R.; Zulini, L.; Stefanini, M.; Velasco, R.; Kozma, P.; Grando, M.S. Genetic linkage maps of two interspecific grape crosses (vitisspp.) used to localize quantitative trait loci for downy mildew resistance. Tree Genet. Genomes 2011, 7, 153–167. [Google Scholar] [CrossRef]
- Shappley, Z.W.; Jenkins, J.N.; Meredith, W.R.; Mccarty, J.C. An RFLP linkage map of upland cotton, Gossypium hirsutum L. Theor. Appl. Genet. 1998, 97, 756–761. [Google Scholar] [CrossRef]
- Lacape, J.M.; Nguyen, T.B.; Thibivilliers, S.; Bojinov, B.; Courtois, B.; Cantrell, R.G.; Burr, B.; Hau, B. A combined RFLP-SSR-AFLP map of tetraploid cotton based on a Gossypium hirsutum x Gossypium barbadense backcross population. Genome 2003, 46, 612–626. [Google Scholar] [CrossRef] [PubMed]
- Cloutier, S.; Cappadocia, M.; Landry, B.S. Analysis of RFLP mapping inaccuracy in Brassica napus L. Theor. Appl. Genet. 1997, 95, 83–91. [Google Scholar] [CrossRef]
© 2020 by the authors. Licensee MDPI, Basel, Switzerland. This article is an open access article distributed under the terms and conditions of the Creative Commons Attribution (CC BY) license (http://creativecommons.org/licenses/by/4.0/).