Communication

SNP- and Haplotype-Based GWAS of Flowering-Related Traits in Maize with Network-Assisted Gene Prioritization

by
Carlos Maldonado
1,
Freddy Mora
1,*,
Filipe Augusto Bengosi Bertagna
2,
Maurício Carlos Kuki
2 and
Carlos Alberto Scapim
3
1
Institute of Biological Sciences, University of Talca, 2 Norte 685, Talca 3460000, Chile
2
Genetic and Plant Breeding Post-Graduate Program, Universidade Estadual de Maringá, Maringá PR 87020-900, Brazil
3
Departamento de Agronomia, Universidade Estadual de Maringá, Maringá PR 87020-900, Brazil
*
Author to whom correspondence should be addressed.
Agronomy 2019, 9(11), 725; https://doi.org/10.3390/agronomy9110725
Submission received: 18 September 2019 / Revised: 28 October 2019 / Accepted: 4 November 2019 / Published: 7 November 2019
(This article belongs to the Special Issue Molecular Marker Technology for Crop Improvement)

Abstract

:
Maize (Zea mays L.) is one of the most crucial crops for global food security worldwide. For this reason, many efforts have been undertaken to address the efficient utilization of germplasm collections. In this study, 322 inbred lines were used to link genotypic variations (53,403 haplotype blocks (HBs) and 290,973 single nucleotide polymorphisms (SNPs)) to corresponding differences in flowering-related traits in two locations in Southern Brazil. Additionally, network-assisted gene prioritization (NAGP) was applied in order to better understand the genetic basis of flowering-related traits in tropical maize. According to the results, the linkage disequilibrium (LD) decayed rapidly within 3 kb, with a cut-off value of r2 = 0.11. Total values of 45 and 44 marker-trait associations (SNPs and HBs, respectively) were identified. Another important finding was the identification of HBs, explaining more than 10% of the total variation. NAGP identified 44, 22, and 34 genes that are related to female/male flowering time and anthesis-silking interval, respectively. The co-functional network approach identified four genes directly related to female flowering time (p < 0.0001): GRMZM2G013398, GRMZM2G021614, GRMZM2G152689, and GRMZM2G117057. NAGP provided new insights into the genetic architecture and mechanisms underlying flowering-related traits in tropical maize.

1. Introduction

Maize (Zea mays L.) plays an important role in the human diet and accounts for a large proportion of the global cereal demand. Together with rice and wheat, these three cereals account for more than 40% and 35% of the world’s calorie and protein supply, respectively [1,2]. Maize is among the few crops grown on almost every continent and has diverse uses, including food, animal feed, and ethanol production [3]. The United States, China, and Brazil are the top three largest maize-producing countries in the world, representing more than 70% of total maize production [4].
Since maize is one of the most important crops for global food security, several efforts have been undertaken addressing the efficient utilization of germplasm materials. In fact, the development of maize germplasm collections has been beneficial to capture and maintain the high levels of genetic diversity that exist locally and globally [5,6,7,8,9]. These efforts have allowed the methodical exploration of the genetic architecture of complex traits in maize, which benefit from the high diversity [8]. Liu [10], for instance, performed a genome-wide association study (GWAS; a standard forward genetic technique) using a population comprised of a global core collection of maize inbred lines, and found several candidate genes associated with starch synthesis, of which one gene (Glucose-1-phosphate adenylyltransferase) is known as an important regulator of kernel starch content. Li et al. [11] identified several genetic variants associated with maize flowering time using an extremely large multigenetic background population (>8000 maize lines). The associated single nucleotide polymorphisms (SNPs) detected in this large panel exhibited high accuracy for predicting flowering time.
In an effort to overcome certain limitations present in forward and reverse genetic techniques, for example lacking in functional clues of trait-associated candidate genes derived from forward genetics studies and in silico strategies for candidate gene selection in targeted mutagenesis in reverse genetics approaches, Lee et al. [12] recently presented a network-assisted gene prioritization system (MaizeNet), which facilitates genetic analysis through supporting candidate genes based on network neighbors with known traits or functions, and aids in identifying potential candidate genes that are highly likely to be causal to the phenotype of interest. This network-based resource provides new insights into the genetic architecture and mechanisms underlying complex traits in maize and promises to accelerate the discovery of trait-associated genes for crop improvement. In this study, an integrated approach using GWAS (based on 53,403 haplotype blocks (HBs) and 290,973 SNPs) and network-assisted gene prioritization was applied in order to better understand the genetic basis of flowering-related traits in tropical maize. To this end, marker-trait association analyses were performed using a multigenetic background population comprising 322 inbred lines of field corn, popcorn, and sweet corn.

2. Materials and Methods

2.1. Trial Conditions and Phenotyping

A total of 322 inbred lines of tropical maize were used in this genome-wide association study, which were derived from three genetic backgrounds collected in Brazil: Field corn (178), popcorn (128), and sweet corn (16). This maize panel was evaluated during the growing season of 2017–2018 in two locations (Cambira and Sabaudia) situated in Southern Brazil, Parana State. The experimental design was an alpha-lattice with 24 incomplete blocks and 3 replications per line. Female and male flowering time (FF and MF, respectively) were measured in each line as the number of days from sowing to anther extrusion from the tassel glumes (MF) or to visible silks (FF). Additionally, the anthesis-silking interval (ASI) was calculated as the difference between MF and FF.

2.2. Population Structure, Linkage Disequilibrium (LD), and Haplotype Blocks

Genomic DNA was isolated from young leaves of five plants from each inbred line of tropical maize (319 in Cambira and 293 in Sabaudia), approximately 30 days after germination. The DNA extraction was carried out by Cetyl trimethyl ammonium bromide (CTAB) according to the protocol established by Chen and Ronald [13]. The quality of DNA was evaluated and quantified using 1% agarose gel and Nanodrop, respectively. The DNA samples were sent to the University of Wisconsin-Madison—Biotechnology Center for SNP discovery via genotyping by sequencing (GBS), which is described in Elshire et al. [14] and Glaubitz et al. [15]. The raw database was filtered considering a minor allele frequency (MAF) > 0.05, resulting in a genotype file of 291,633 high-quality SNPs. The LD kNNi imputation (linkage disequilibrium k-nearest neighbor imputation) was performed to impute missing data in the dataset [16]. Finally, SNPs with a MAF < 0.01 and a proportion of missing data per location >90% were eliminated from the imputed dataset [17]. Subsequently, 290,973 SNPs were retained after filtering for MAF and missing data.
The population structure was inferred using the model-based Bayesian clustering approach implemented in the program InStruct [18]. For each K value (where K is the number of genetically differentiated groups, K = 1–6), 10 runs were performed separately, each with 100,000 Monte Carlo Markov Chain replicates and a burn-in period of 10,000 iterations. The optimal K value was determined with the highest ΔK method [19] and the lowest deviance information criterion (DIC).
The extent of LD was estimated using the correlation coefficients of the allelic frequencies (r2) considering all the possible combinations of the alleles. The critical r2 value was calculated according to the method used by Breseghello and Sorells [20].
The HBs were constructed for each chromosome according to the confidence interval algorithm developed by Gabriel [21], implemented in the software Haploview v.4.2 [22]. This method considers the 95% confidence intervals of the disequilibrium coefficient (D’) values and builds a haplotype block if the LD is classified as a “strong LD” type (D′ higher than 0.98 and lower interval limit of >0.7). Finally, HBs were later transformed into multiallelic markers, considering the allelic combinations within each block to be independent alleles [5,23].

2.3. SNP- and Haplotype-Based GWAS

The HB- and SNP-based association analyses were performed using a mixed linear model (MLM) in TASSEL 3.0 and TASSEL 5.2, respectively [24], which considers the effects of the population structure (Q) and genetic relationships or matrix kinship (K) among inbred lines. The kinship matrix was calculated based on identity by state (IBS) [25] in TASSEL. The Adjusted-Entry Means of the general linear model (experimental design) were used as the adjusted phenotypes according to Contreras-Soto et al. [26] and Arriagada et al. [27]. Correlations between each pair of traits were calculated using a Bayesian bi-trait model [28,29,30]. The statistical analysis was performed using the R package MCMCglmm (version 3.6.1; https://www.r-project.org) [31].

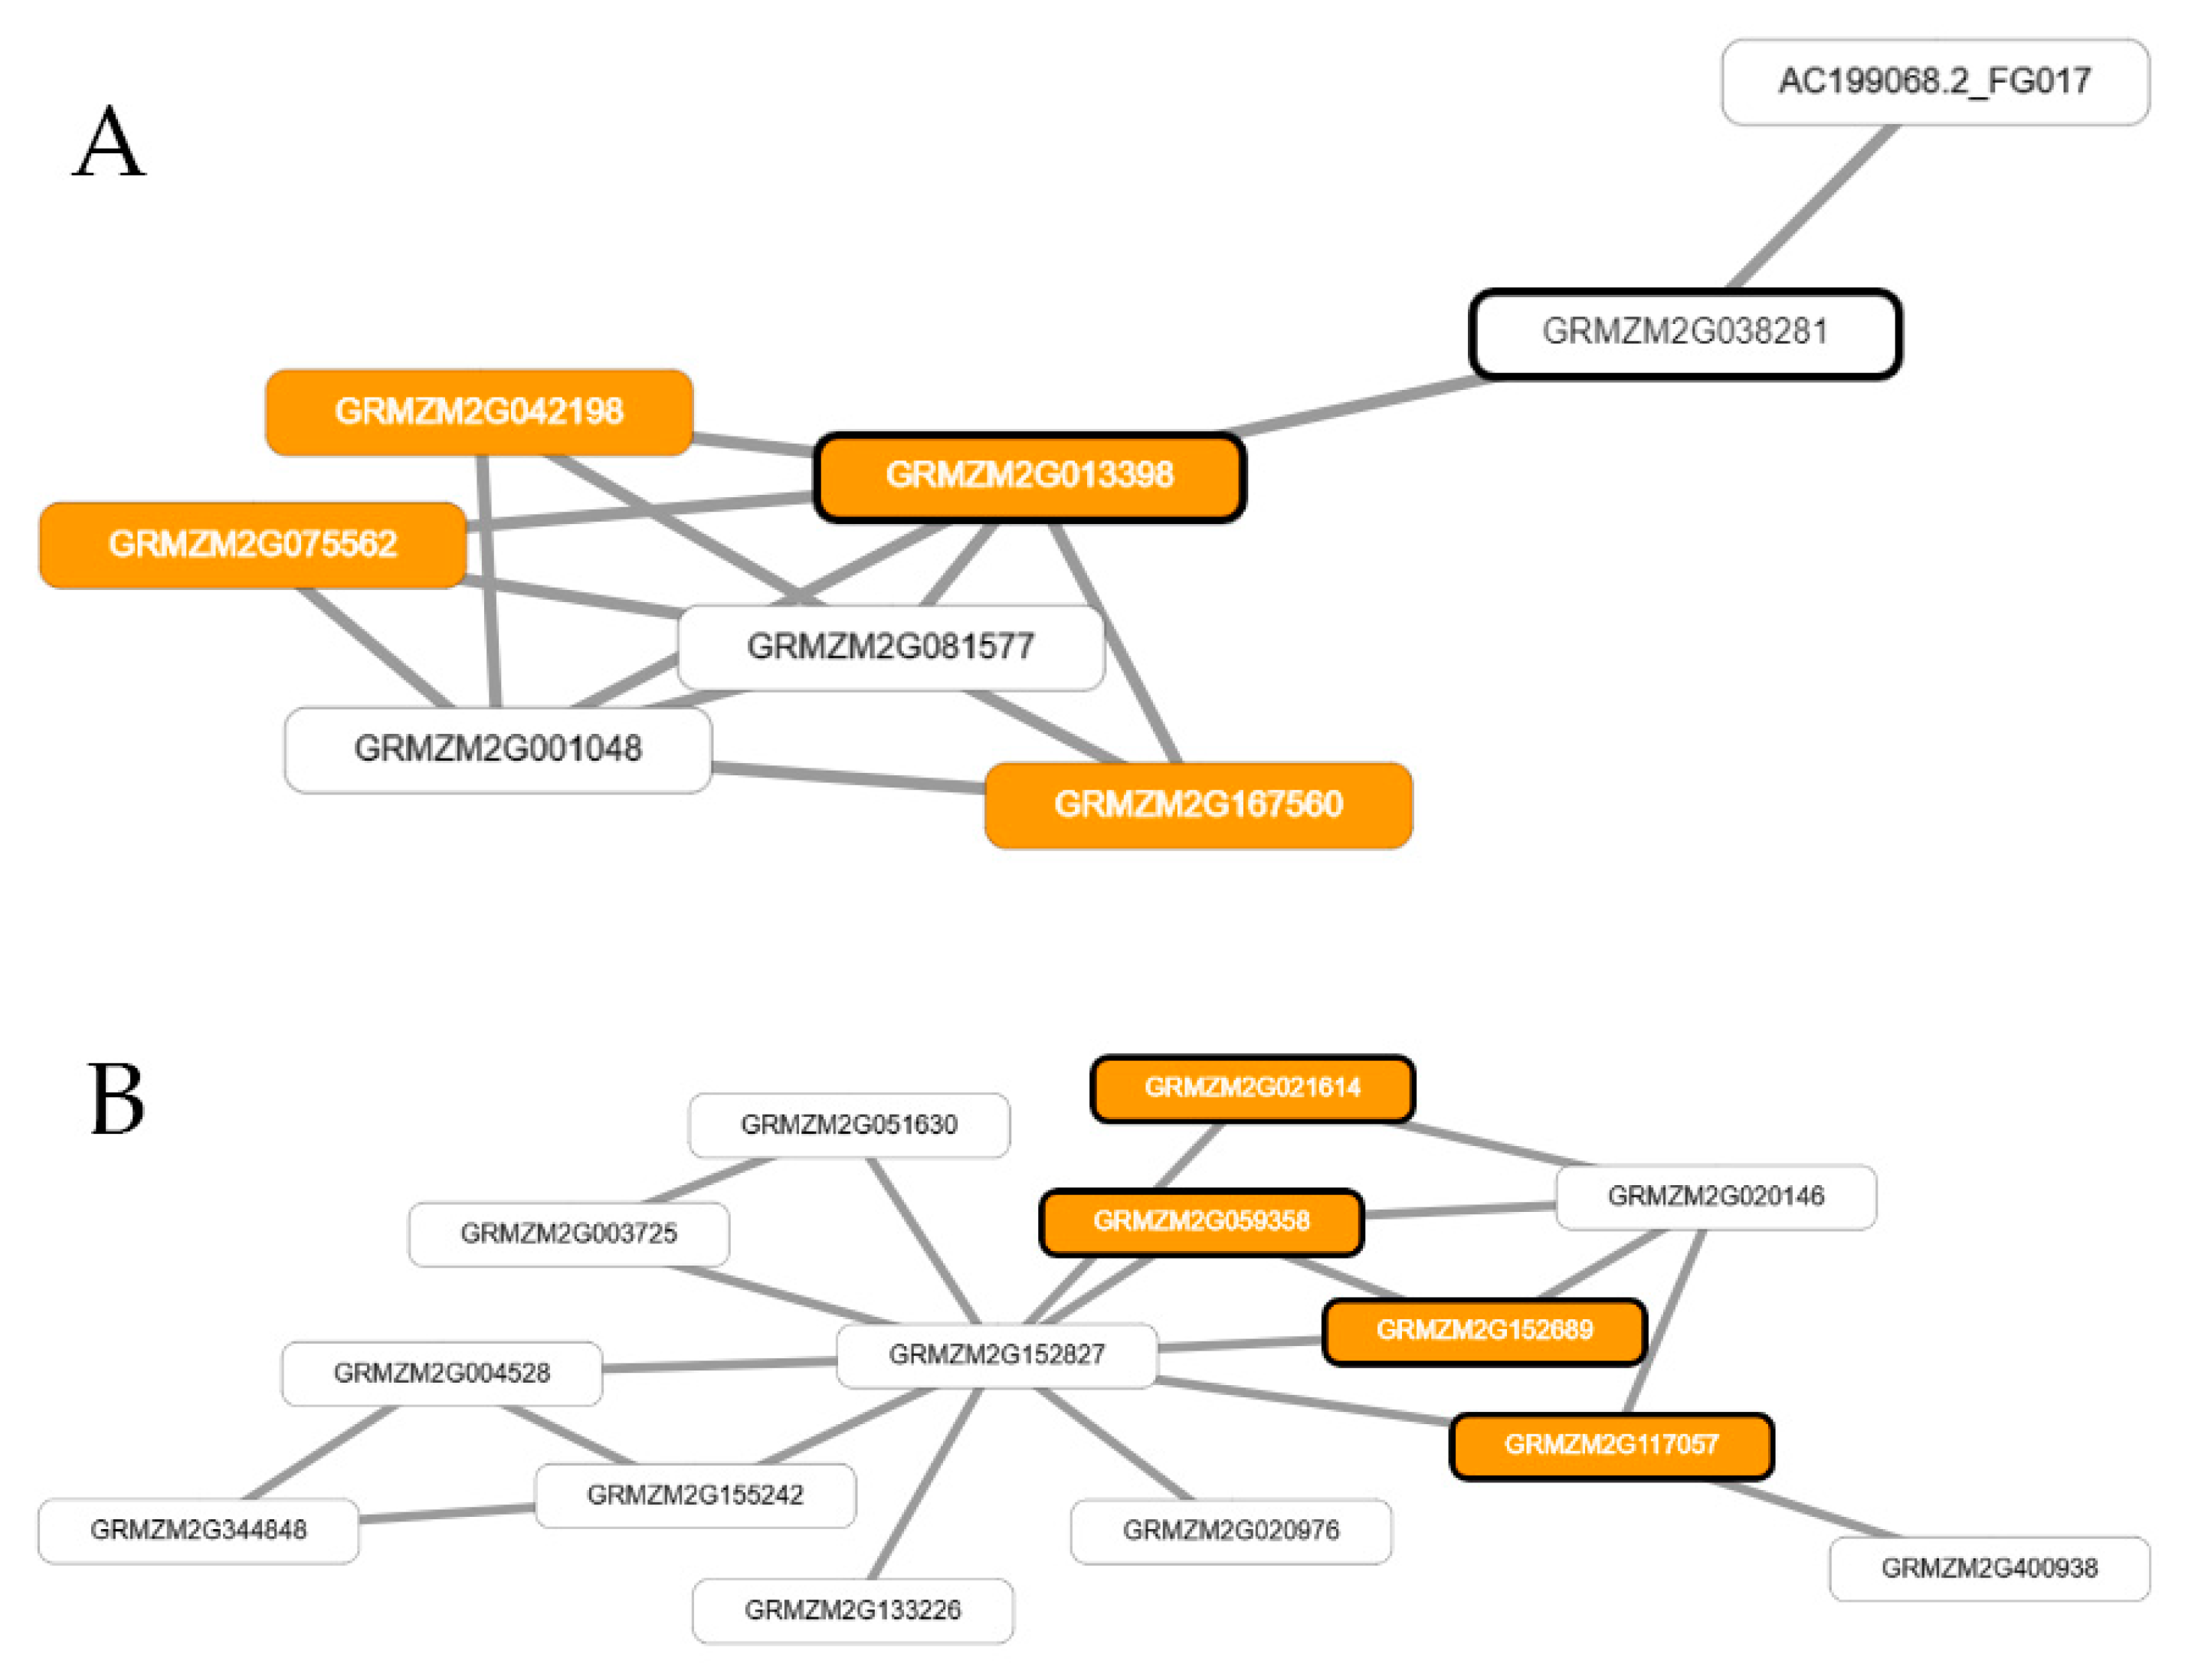
2.4. Prioritization of GWAS Candidate Genes and Inference of Co-Functional Networks for Flowering Traits in Maize

The candidate genes were chosen from the genes around the significant loci (SNP or haplotype blocks) identified by GWAS. To this end, a window (or threshold) of twice the distance indicated by the LD analysis was established, placing the marker in the center of the window. The gene prioritization was performed using MaizeNet [12] based on the connections of the candidate genes to the genes in one estimated network with previously associated genes with flowering-time in Zea mays. New candidate genes were then ranked by closeness to the “guide genes” (derived from estimated network in MaizeNet) measured for each candidate gene (derived from GWAS) as the sum of network edge scores from that gene to the guide genes [12]. The estimated co-functional network was carried out through the association of genes (candidate genes and genes identified in prioritization of MaizeNet) with subnetworks enriched by gene ontology annotations related to the biological processes (GOBP) of flowering in MaizeNet. Finally, the given genes are related to the flowering-time if the subnetworks of MaizeNet significantly associated with these genes, and if are also enriched for on the relevant GOBP term for flowering.

3. Results and Discussion

3.1. Genetic Structure

The Bayesian clustering analysis (InStruct) of the population structure indicated that the 322 inbred lines from the Brazilian germplasm represent two main genetic clusters (k  =  2; Figure S1A), inferred from both the lowest DIC value and the second-order change rate of the probability function with respect to Q (ΔQ) [19]. Cluster I contained 221 lines (68.6%), over 80% (177/221) of which were genotypes of field corn, while all sweet corn lines (16) were within this cluster. On the other hand, cluster II consisted of 101 lines, over 99% (100/101) of which were genotypes of popcorn (Figure S1). Similar results were obtained by the PCA method for this association mapping panel, as shown in Figure S1B. The first component explained 12.1% of the total variation and most of the inbred lines were separated in the same genetically differentiated groups (Figure S1B). These results are in accordance with the previous findings of Maldonado et al. [5] and Coan et al. [6], in which tropical maize inbred lines were grouped into two genetically differentiated clusters, separating field corn and popcorn lines.

3.2. Linkage Disequilibrium

The genome-wide LD decay pattern is shown in Table 1 and Figure S2. The LD statistic r2 showed a clear nonlinear trend with physical distance. According to these results, the LD decayed rapidly within 3 kb, with a cut-off value of r2 = 0.11. The average LD on all chromosomes (Chr) was r2 = 0.09. On the other hand, 0.63% of the total pairs of linked SNPs were in a complete LD (r2 = 1), and 4.4% had an r2 value >0.5 (strong LD). The LD of Chr 3 and 7 decayed faster than the other chromosomes, with ~2.2 kb for a cut-off value of r2 = 0.11. Past studies have found that this LD pattern (i.e., rapid decay with increasing physical distance) is typical in tropical maize germplasms [6,9,32]. The LD decay pattern in this study was similar to the findings of Yan et al. [33] and Coan et al. [6], who reported that the LD pattern (in tropical maize germplasms) decreases rapidly in the range of 0.1–10 kb.

3.3. Haplotype Blocks

Total values of 53,403 and 52,377 HBs were identified in all chromosomes for Cambira and Sabaudia, respectively (Table 1), over 47%, 20%, and 33% of which contained two, three, and four (or more) SNPs, respectively (Figure S3). These HBs were constructed considering 319 and 293 inbred lines in Cambira and Sabaudia (respectively), and 290,973 SNPs distributed on all chromosomes (Table 1). An average of ~20,000 SNPs per chromosome satisfied the criteria of the 95% confidence interval proposed by Gabriel et al. [21]. Particularly, the largest number of HBs in both locations was determined by combinations of SNPs located on Chr 1, while the smaller amount was constructed by SNPs located on Chr 10 (Table 1). In this study, several genomic regions were detected in strong disequilibrium, up to ~0.1 Mb. Therefore, as these regions have a strong LD, it is possible to suggest that they will be inherited together across generations. Moreover, about 2.3% of the HBs formed in both locations had an extension over 0.1 Mb, with a D’ value between 0.7 and 0.98 [21]. Analysis of the LD pattern enabled the identification and characterization of several HBs (or strongly linked genomic regions), because there is a strong LD among the SNPs that compose it. This indicates that recombination events within these HBs are unlikely, thus, these HBs should inherit together across generations.

3.4. Genome-Wide Association Study and Network-Assisted Gene Prioritization

Total values of 45 and 44 associations (SNPs and HBs, respectively) were identified for the studied traits, which are distributed in all chromosomes of maize (Table 2 and Table S1). Four SNPs were jointly associated with the FF and MF traits. In Cambira, four haplotype blocks—two loci on Chr 8 (bin 8.03) and two on Chr 9 (bin 9.06)—were jointly associated with FF and MF. In turn, Chr 3 presented two genomic regions associated with FF in Cambira (one SNP and one HB) and three in Sabaudia (one SNP and two HBs), while various SNPs (five) and HBs (three) were associated with some the three traits on Chr 9 (bin 9.06). Interestingly, all associations were environment-specific, confirming the existence of a significant and complex genetic-by-environment interaction. The results from Bayesian bi-trait analyses showed a high correlation between FF and MF, which was significantly different from zero in both locations (r = 0.94 and 0.92), justifying the fact that FF and MF share significant loci. In accordance with our findings, Xu et al. [34] found a very high amount of quantitative trait loci (QTL) significant on bins 1.03, 8.05, and 9.06 for photoperiod sensitivity and flowering time (traits highly correlated in maize; [35]), while Chardon et al. [36], through a meta-analysis, detected hot-spot QTL regions for flowering time on bins 8.03 and 8.05. On the other hand, 64 QTLs related to maize flowering time were identified by Liu et al. [37], which were distributed on chromosomal bins 1.01, 1.03, 1.1, 2.02, 3.02, 3.04, 4.05, 6.06, 7.02, 7.03, 7.04, 8.03, 8.05, 9.01, and 9.07. Like these previous studies, this study also identified significant marker-trait associations on bins 1.01, 1.03, 1.1, 2.02, 3.02, 3.04, 4.05, 6.06, 7.02, 7.03, 7.04, 8.03, 8.05, 9.01, and 9.07. This result suggests that these regions should contain important genes controlling the flowering time in maize. In addition, chromosomes 8 and 9 had the main associations for all three traits, which is consistent with studies that considered other environments and genetic materials [34,36,37,38].
In Cambira, the proportion of the phenotypic variance (PV%) explained by SNP markers was ~6%, while haplotype blocks explained 6–17%, 5–13%, and 6–8% of the phenotypic variation of FF, MF, and ASI, respectively (Table 2 and Table S1). On the other hand, in Sabaudia, the PV% explained by SNPs was similar to that detected by HBs. In Sabaudia, the PV% values were moderate (either SNPs or HBs), which varied between 5 and 10%, while in Cambira, HBs showed higher PV% values (>10%) in comparison with SNPs. Moreover, the HB HChr9B2943 (in Cambira) was jointly associated with FF and MF, accounting for 17% and 13% of the total variation of FF and MF, respectively (Table 2 and Table S1). Several studies reported PV% values of flowering time smaller than 10% [34,37,39,40]. In fact, numerous QTLs with small effects would be contributing to genetic variation in flowering time across diverse maize germplasms [34,37,41]. In accordance with this, 93% (41/44) of the significant HB and all SNP associations did not explain more than 10% of the total variation. Importantly, three HBs had PV% values higher than 10%, indicating the potential effectiveness of haplotypes over individual SNP analysis, an aspect emphasized by Maldonado et al. [5] and Contreras-Soto et al. [26]. Twenty-five of the 45 SNPs detected by GWAS (i.e., 56%) were found to be part of a haplotype block, which in turn were significantly associated with a given trait. Moreover, 14 HBs contained at least 1 significant SNP, and 9 HBs contained 2 or 3 SNPs significantly associated with some trait. On the other hand, 68% (30/44) of the HBs detected did not contain any associated SNPs, which suggests that haplotype blocks are useful for discovering genomic regions that are not detected by SNP markers. On the other hand, the use of haplotype blocks in GWAS reduces the number of multiple tests, compared with SNP-based association analysis [5]. Moreover, the use of haplotype blocks as multiallelic markers might improve marker-trait association analyses, compensating the biallelic limitation of SNP markers [5,26].
Based on the physical position of the maize reference genome (http://www.maizegdb.org//), 51 candidate genes were identified neighboring the significant SNPs and HBs (Table S1), of which 11 were present in more than one trait (FF and MF) (Table S1). The network-assisted gene prioritization performed by MaizeNet [12] identified 100 additional genes based on biological processes of flowering and reproduction. Forty-four, 22, and 34 genes that were identified by MaizeNet are related to FF, MF, and ASI, respectively (Table S1). Co-functional networks determined by MaizeNet [12] are shown in Figure 1 and Figure S4. The co-functional networks identified the following genes directly related to FF—GRMZM2G013398, GRMZM2G021614, GRMZM2G152689, and GRMZM2G117057—with statistical significance of p < 0.0001 (Figure 1). On the other hand, the co-functional networks of MF presented significances of 2.2 × 10⁻¹¹ and 2.3 × 10⁻⁵ using HBs and SNPs, respectively. The gene GRMZM2G013398 has an ortholog in Arabidopsis thaliana that encodes CONSTANS-LIKE 9 (COL9), which has light-controlled functions and is crucial to inducing the day-length specific expression of the FLOWERING LOCUS T (FT) gene in leaves [42]. FT protein is the main component of florigen that strongly influences the timing of flowering [43]. Notably, the CONSTANS protein strongly influences the performance of maize flowering time in response to photoperiod, directly inducing the transcription of FT genes in Arabidopsis [42,43]. On the other hand, the genes GRMZM2G021614, GRMZM2G152689, and GRMZM2G117057 encode phosphatidylethanolamine-binding proteins (pebp9, pebp10, and pebp11, respectively), which play important roles in floral transition in angiosperms [44]. Moreover, Kikuchi et al. [45] and Wickland and Hanzawa [46] showed that the presence and structure of these genes, together with their roles in the regulation of flowering, are well conserved among cereal plants.

4. Conclusions

In the present study, we identified several loci (SNPs and haplotype blocks) with variable contributions to phenotypic expression, which were located in regions that play important roles in the control of flowering time in maize. The GWAS based on haplotype blocks was beneficial to identify loci with major effects in comparison to SNP-based GWAS. The co-functional network approach identified four genes that strongly influence the timing of flowering in tropical maize. In general, network-assisted gene prioritization provides new insights into the genetic architecture and mechanisms underlying flowering-related traits in tropical maize.

Supplementary Materials

The following are available online at https://www.mdpi.com/2073-4395/9/11/725/s1: Figure S1. Inferred population structure in a collection of maize germplasm (322 inbred lines). (A) Genetic structure inferred by a Bayesian clustering model using InStruct and a dendrogram carried out using the neighbor-joining (Nei’s genetic distances). The light gray and dark gray indicate the proportion of the genome extracted from the two main genetic clusters estimated by InStruct. (B) Principal components analysis (PCA) with two major groups identified, which correspond closely to InStruct results. Values in parentheses indicate the percentage of variation explained by each main component; Figure S2. Linkage disequilibrium (LD) decay pattern in all chromosomes of maize. Chromosomes 3 and 7 decayed faster than the other chromosomes, while chromosome 4 presented the slowest decay (lower and upper margins, respectively); Figure S3. Frequency distribution of the size of haplotype blocks consisting of two or more SNPs, in the locations Cambira and Sabaudia; Figure S4. Co-functional networks estimated using genes identified by SNP- and Haplotype-based GWAS (A and B, respectively), genes identified in prioritization of MaizeNet for flowering time and subnets enriched by gene ontology annotations related to the biological processes of male flowering (MF) in MaizeNet. White nodes represent all the subnetwork genes of MaizeNet, orange nodes are genes associated with the ontology annotations related to flowering time, and nodes highlighted with bold borderline correspond to genes identified by GWAS or the prioritization analysis; Table S1. Details of the associations and candidate genes detected in SNP- and Haplotype-based GWAS for the traits of Female/Male Flowering time (FF and MF, respectively) and Anthesis–Silking Interval (ASI) measured in inbred lines of tropical maize in two locations (Cambira and Sabaudia).

Author Contributions

Conceptualization, F.M., C.M., M.C.K., and F.A.B.B.; methodology, F.M., C.A.S., and C.M.; software, C.M., M.C.K., and F.A.B.B.; validation, F.M., C.M., M.C.K., F.A.B.B., and C.A.S.; formal analysis, F.M., C.A.S., and C.M.; investigation, M.C.K., F.A.B.B., and C.A.S.; resources, F.M. and C.M.; writing—original draft preparation, F.M. and C.M.; writing—review and editing, F.M. and C.M.; visualization, M.C.K., F.A.B.B., and C.A.S.; supervision, F.M.; project administration, C.A.S.; funding acquisition, C.A.S.

Funding

This research was funded by the National Council of Technological and Scientific Development (CNPq) and the Coordination for the Improvement of Higher Education Personnel (CAPES).

Acknowledgments

Freddy Mora thanks FONDECYT (grant number 1170695). Carlos Maldonado thanks CONICYT-PCHA/Doctorado Nacional/2017-21171466.

Conflicts of Interest

The authors declare no conflicts of interest. The funders had no role in the design of the study, in the collection, analyses, or interpretation of data, in the writing of the manuscript, or in the decision to publish the results.

References

  1. FAO. Save and Grow in Practice: Maize, Rice, Wheat—A Guide to Sustainable Production; Food and Agriculture Organization of the United Nations: Rome, Italy, 2016. [Google Scholar]
  2. Begcy, K.; Sandhu, J.; Walia, H. Transient heat stress during early seed development primes germination and seedling establishment in rice. Front. Plant. Sci. 2019, 9, 1768. [Google Scholar] [CrossRef] [PubMed]
  3. Rashid, S.; Rosentrater, K.A.; Bern, C. Effects of deterioration parameters on storage of maize: A review. J. Nat. Sci. Res. 2013, 3, 147. [Google Scholar]
  4. Ranum, P.; Pena-Rosas, J.P.; Garcia-Casal, M.N. Global maize production, utilization, and consumption. Ann. N. Y. Acad. Sci. 2014, 1312, 105–112. [Google Scholar] [CrossRef] [PubMed]
  5. Maldonado, C.; Mora, F.; Scapim, C.A.; Coan, M. Genome-wide haplotype-based association analysis of key traits of plant lodging and architecture of maize identifies major determinants for leaf angle: hapLA4. PLoS ONE 2019, 14, e0212925. [Google Scholar] [CrossRef]
  6. Coan, M.; Senhorinho, H.J.; Pinto, R.J.; Scapim, C.A.; Tessmann, D.J.; Williams, W.P.; Warburton, M.L. Genome-Wide Association Study of Resistance to Ear Rot by Fusarium verticillioides in a Tropical Field Maize and Popcorn Core Collection. Crop. Sci. 2018, 58, 564–578. [Google Scholar] [CrossRef]
  7. Xiao, Y.; Liu, H.; Wu, L.; Warburton, M.; Yan, J. Genome-Wide Association Studies in Maize: Praise and Stargaze. Mol. Plant. 2017, 10, 359–374. [Google Scholar] [CrossRef]
  8. Zhu, X.M.; Shao, X.Y.; Pei, Y.H.; Guo, X.M.; Li, J.; Song, X.Y.; Zhao, M.A. Genetic Diversity and Genome-Wide Association Study of Major Ear Quantitative Traits Using High-Density SNPs in Maize. Front. Plant. Sci. 2018, 9, 966. [Google Scholar] [CrossRef]
  9. Romay, M.C.; Millard, M.J.; Glaubitz, J.C.; Peiffer, J.A.; Swarts, K.L.; Casstevens, T.M.; Elshire, R.J.; Acharya, C.B.; Mitchell, S.E.; Flint-Garcia, S.A.; et al. Comprehensive genotyping of the USA national maize inbred seed bank. Genome Biol. 2013, 14, R55. [Google Scholar] [CrossRef]
  10. Liu, N.; Xue, Y.; Guo, Z.; Li, W.; Tang, J. Genome-Wide Association Study Identifies Candidate Genes for Starch Content Regulation in Maize Kernels. Front. Plant. Sci. 2016, 7, 1046. [Google Scholar] [CrossRef]
  11. Li, Y.; Li, C.; Bradbury, P.; Liu, X.; Lu, F.; Romay, C.; Glaubitz, J.; Wu, X.; Peng, B.; Shi, Y.; et al. Identification of genetic variants associated with maize flowering time using an extremely large multi-genetic background population. Plant. J. 2016, 86, 391–402. [Google Scholar] [CrossRef]
  12. Lee, T.; Lee, S.; Yang, S.; Lee, I. MaizeNet: A co-functional network for network-assisted systems genetics in Zea mays. Plant. J. 2019, 99, 571–582. [Google Scholar] [CrossRef] [PubMed]
  13. Chen, D.H.; Ronald, P.C. A rapid DNA minipreparation method suitable for AFLP and other PCR applications. Plant. Mol. Biol. Rep. 1999, 17, 53–57. [Google Scholar] [CrossRef]
  14. Elshire, R.J.; Glaubitz, J.C.; Sun, Q.; Poland, J.A.; Kawamoto, K.; Buckler, E.S.; Mitchell, S.E. A robust, simple genotyping-by-sequencing (GBS) approach for high diversity species. PLoS ONE 2011, 6, e19379. [Google Scholar] [CrossRef] [PubMed]
  15. Glaubitz, J.C.; Casstevens, T.M.; Lu, F.; Harriman, J.; Elshire, R.J.; Sun, Q.; Buckler, E.S. TASSEL-GBS: A high capacity genotyping by sequencing analysis pipeline. PLoS ONE 2014, 9, e90346. [Google Scholar] [CrossRef]
  16. Money, D.; Gardner, K.; Migicovsky, Z.; Schwaninger, H.; Zhong, G.Y.; Myles, S. LinkImpute: Fast and accurate genotype imputation for nonmodel organisms. G3 Genes Genom. Genet. 2015, 5, 2383–2390. [Google Scholar] [CrossRef]
  17. Yu, L.X.; Zheng, P.; Bhamidimarri, S.; Liu, X.P.; Main, D. The Impact of Genotyping-by-Sequencing Pipelines on SNP Discovery and Identification of Markers Associated with Verticillium Wilt Resistance in Autotetraploid Alfalfa (Medicago sativa L.). Front. Plant. Sci. 2017, 8, 89. [Google Scholar] [CrossRef]
  18. Gao, H.; Williamson, S.; Bustamante, C.D. A Markov chain Monte Carlo approach for joint inference of population structure and inbreeding rates from multilocus genotype data. Genetics 2007, 176, 1635–1651. [Google Scholar] [CrossRef]
  19. Evanno, G.; Regnaut, S.; Goudet, J. Detecting the number of clusters of individuals using the software STRUCTURE: A simulation study. Mol. Ecol. 2005, 14, 2611–2620. [Google Scholar] [CrossRef]
  20. Breseghello, F.; Sorrells, M.E. Association Mapping of Kernel Size and Milling Quality in Wheat (Triticum aestivum L.) Cultivars. Genetics 2006, 172, 1165–1177. [Google Scholar] [CrossRef]
  21. Gabriel, S.B.; Schaffner, S.F.; Nguyen, H.; Moore, J.M.; Roy, J.; Blumenstiel, B.; Higgins, J.; DeFelice, M.; Lochner, A.; Faggart, M.; et al. The structure of haplotype blocks in the human genome. Science 2002, 296, 2225–2229. [Google Scholar] [CrossRef]
  22. Barrett, J.C.; Fry, B.; Maller, J.D.M.J.; Daly, M.J. Haploview: Analysis and visualization of LD and haplotype maps. Bioinformatics 2004, 21, 263–265. [Google Scholar] [CrossRef] [PubMed]
  23. Ballesta, P.; Maldonado, C.; Pérez-Rodríguez, P.; Mora, F. SNP and Haplotype-Based Genomic Selection of Quantitative Traits in Eucalyptus globulus. Plants 2019, 8, 331. [Google Scholar] [CrossRef] [PubMed]
  24. Bradbury, P.J.; Zhang, Z.; Kroon, D.E.; Casstevens, T.M.; Ramdoss, Y.; Buckler, E.S. TASSEL: Software for association mapping of complex traits in diverse samples. Bioinformatics 2007, 23, 2633–2635. [Google Scholar] [CrossRef] [PubMed]
  25. Endelman, J.B.; Jannink, J.L. Shrinkage estimation of the realized relationship matrix. G3 Genes Genom. Genet. 2012, 2, 1405–1413. [Google Scholar] [CrossRef]
  26. Contreras-Soto, R.I.; Mora, F.; de Oliveira, M.A.R.; Higashi, W.; Scapim, C.A.; Schuster, I. A genome-wide association study for agronomic traits in soybean using SNP markers and SNP-based haplotype analysis. PLoS ONE 2017, 12, e0171105. [Google Scholar] [CrossRef]
  27. Arriagada, O.; Amaral-Júnior, A.T.; Mora, F. Thirteen years under arid conditions: Exploring marker-trait associations in Eucalyptus cladocalyx for complex traits related to flowering, stem form and growth. Breed. Sci. 2018, 68, 367–374. [Google Scholar] [CrossRef]
  28. Hadfield, J. MCMCglmm Course Notes. 2012. Available online: http://cran.r-project.org/web/packages/MCMCglmm/vignettes/CourseNotes.pdf (accessed on 7 July 2019).
  29. Mora, F.; Zúñiga, P.E.; Figueroa, C.R. Genetic variation and trait correlations for fruit weight, firmness and color parameters in wild accessions of Fragaria chiloensis. Agronomy 2019, 9, 506. [Google Scholar] [CrossRef]
  30. Mora, F.; Ballesta, P.; Serra, N. Bayesian analysis of growth, stem straightness and branching quality in full-sib families of Eucalyptus globulus. Bragantia 2019, 78. [Google Scholar] [CrossRef]
  31. Hadfield, J.D. MCMC methods for multi-response generalized linear mixed models: The MCMCglmm R package. J. Stat. Softw. 2010, 33, 1–22. [Google Scholar] [CrossRef]
  32. Paes, G.P.; Viana, J.M.S.; Mundim, G.B. Linkage disequilibrium, SNP frequency change due to selection, and association mapping in popcorn chromosome regions containing QTLs for quality traits. Genet. Mol. Biol. 2016, 39, 97–110. [Google Scholar] [CrossRef] [Green Version]
  33. Yan, J.; Shah, T.; Warburton, M.L.; Buckler, E.S.; McMullen, M.D.; Crouch, J. Genetic characterization and linkage disequilibrium estimation of a global maize collection using SNP markers. PLoS ONE 2009, 4, e8451. [Google Scholar] [CrossRef] [PubMed]
  34. Xu, J.; Liu, Y.; Liu, J.; Cao, M.; Wang, J.; Lan, H.; Xu, Y.; Lu, Y.; Pan, G.; Rong, T. The genetic architecture of flowering time and photoperiod sensitivity in maize as revealed by QTL review and meta-analysis. J. Integr. Plant. Biol. 2012, 54, 358–373. [Google Scholar] [CrossRef] [PubMed]
  35. Zhang, X.; Tang, B.; Liang, W.; Zheng, Y.; Qiu, F. Quantitative genetic analysis of flowering time, leaf number and photoperiod sensitivity in maize (Zea mays L.). J. Plant. Breed. Crop. Sci. 2011, 3, 168–184. [Google Scholar]
  36. Chardon, F.; Virlon, B.; Moreau, L.; Falque, M.; Joets, J.; Decousset, L.; Murigneux, A.; Charcosset, A. Genetic architecture of flowering time in maize as inferred from quantitative trait loci meta-analysis and synteny conservation with the rice genome. Genetics 2004, 168, 2169–2185. [Google Scholar] [CrossRef] [PubMed]
  37. Liu, S.; Zenda, T.; Wang, X.; Liu, G.; Jin, H.; Yang, Y.; Dong, A.; Duan, H. Comprehensive Meta-Analysis of Maize QTLs Associated with Grain Yield, Flowering Date and Plant Height Under Drought Conditions. J. Agric. Sci. 2019, 11, 1–19. [Google Scholar] [CrossRef]
  38. Coles, N.D.; McMullen, M.D.; Balint-Kurti, P.J.; Pratt, R.C.; Holland, J.B. Genetic control of photoperiod sensitivity in maize revealed by joint multiple population analysis. Genetics 2010, 184, 799–812. [Google Scholar] [CrossRef]
  39. Salvi, S.; Castelletti, S.; Tuberosa, R. An updated consensus map for flowering time QTLs in maize. Maydica 2009, 54, 501–512. [Google Scholar]
  40. Frey, F.P.; Presterl, T.; Lecoq, P.; Orlik, A.; Stich, B. First steps to understand heat tolerance of temperate maize at adult stage: Identification of QTL across multiple environments with connected segregating populations. Theor. Appl. Genet. 2016, 129, 945–961. [Google Scholar] [CrossRef]
  41. Buckler, E.S.; Holland, J.B.; Bradbury, P.J.; Acharya, C.B.; Brown, P.J.; Browne, C.; Ersoz, E.; Flint-Garcia, S.; Garcia, A.; Glaubitz, J.C.; et al. The genetic architecture of maize flowering time. Science 2009, 325, 714–718. [Google Scholar] [CrossRef]
  42. Song, Y.H.; Shogo, I.; Takato, I. Flowering time regulation: Photoperiod-and temperature-sensing in leaves. Trends Plant Sci. 2013, 18, 575–583. [Google Scholar] [CrossRef]
  43. Pin, P.A.; Nilsson, O. The multifaceted roles of FLOWERING LOCUS T in plant development. Plant. Cell Environ. 2012, 35, 1742–1755. [Google Scholar] [CrossRef] [PubMed]
  44. Liu, Y.Y.; Yang, K.Z.; Wei, X.X.; Wang, X.Q. Revisiting the phosphatidylethanolamine-binding protein (PEBP) gene family reveals cryptic FLOWERING LOCUS T gene homologs in gymnosperms and sheds new light on functional evolution. New Phytol. 2016, 212, 730–744. [Google Scholar] [CrossRef] [PubMed]
  45. Kikuchi, R.; Kawahigashi, H.; Ando, T.; Tonooka, T.; Handa, H. Molecular and functional characterization of PEBP genes in barley reveal the diversification of their roles in flowering. Plant. Physiol. 2009, 149, 1341–1353. [Google Scholar] [CrossRef]
  46. Wickland, D.P.; Hanzawa, Y. The FLOWERING LOCUS T/TERMINAL FLOWER 1 gene family: Functional evolution and molecular mechanisms. Mol. Plant 2015, 8, 983–997. [Google Scholar] [CrossRef] [PubMed]
Figure 1. Co-functional networks estimated using genes identified by SNP- and haplotype-based GWAS (A,B, respectively), genes identified by network-assisted gene prioritization (in MaizeNet) for flowering time and subnets enriched by gene ontology annotations related to the biological processes of female flowering (FF) in MaizeNet. (A) Gene GRMZM2G013398 identified by the prioritization analysis (nodes orange highlighted with bold borderline) connected with all the subnetwork genes of MaizeNet (white nodes) and genes associated with the ontology annotations related to flowering time (orange nodes). (B) Genes GRMZM2G117057, GRMZM2G021614, GRMZM2G059358, and GRMZM2G152689 identified by prioritization analysis (nodes orange highlighted with bold borderline) connected with all the subnetwork genes of MaizeNet (white nodes).
Agronomy 09 00725 g001
Table 1. Summary of information on linkage disequilibrium (LD) and haplotype blocks (HBs) determined in inbred lines of tropical maize. Chr corresponds to the chromosome number; N°SNP indicates the number of single nucleotide polymorphisms (SNPs) detected on each chromosome; N°HB is the number of haplotype blocks; SizeHB and Max(kb) correspond to the maximum number of SNPs forming a haplotype block and the maximum size (in kb) for a haplotype block, respectively.
ChrLDSNPPosition (pb) First-Last SNPCambira Sabaudia
HBSizeHBMax(kb)HBSizeHBMax(kb)
12.8739,14838,222–275,861,066718032498708732497
22.6837,34140,724–244,417,305687435500673036500
32.2134,889191,169–235,520,333637035487625633491
46.5526,908217,040–246,840,261479042500469342499
52.6135,69112,711–223,658,670658433493647232500
63.7523,441169,964–173,881,702436853466431753466
72.2324,958180,204–182,128,999468328500454628500
84.125,537204,228–181,043,617470350498457750498
92.9422,40461,292–159,668,042409135500399136500
102.8520,656128,669–150,847,940376052498369851498
Mean2.9429,097-534040494523839495
Table 2. Summary of the associations detected by a genome-wide association study (GWAS), based on in haplotype blocks and SNP for the traits of female/male flowering time (FF and MF, respectively) and anthesis–silking interval (ASI) measured in inbred lines of tropical maize.
MarkerTraitCambiraSabaudia
NMChr(NM)PV%NMChr(NM)PV%
SNPFF102(2), 3(1), 6(1), 7(4), 8(1), and 9(1)5.6–6.372(1), 3(1), 5(3), and 6(2) 6.5–10.1
MF52(2), 8(1), and 9(2)5.7–6.463(3), 5(1), and 6(2)6.5–8.5
ASI81(2), 3(1), 5(1), 6(1), 7(1), and 8(2)5.6–6.091(2), 3(2), 8(3), 9(1), and 10(1)6.5–9.9
Haplotype BlocksFF111(1), 3(1), 5(1), 6(2), 7(1), 8(3), and 9(2)5.6–17.033(2) and 9(1)6.3–8.6
MF72(1), 4(1), 7(1), 8(2), and 9(2)4.6–13.0121(2), 4(4), 5(1), 7(3), 8(1), and 9(1)5.0–6.9
ASI41(1), 3(1), 8(1), and 10(1)5.6–7.8 72(2), 5(1), 7(2), 8(1), and 9(1) 5.1–9.5
PV%: Percentage of the phenotype variation explained by the marker; NM: Number of significant marker-trait associations.

