A Combined Method of Image Processing and Artificial Neural Network for the Identification of 13 Iranian Rice Cultivars

 ,
,  , , and
Abstract
:1. Introduction
- -
- Using more rice varieties in the form of white rice, brown rice, and paddy compared to other research work.
- -
- Selecting the effective color, morphological, and textural features of the rice varieties’ images using principal component analysis (PCA).
- -
- Classification of the rice varieties in the form of white rice, brown rice, and paddy with backpropagation- artificial neural network (ANN) and linear discriminant analysis (DA).
2. Materials and Methods
2.1. Providing Samples
2.2. Samples Preparation
2.3. Imaging of Samples
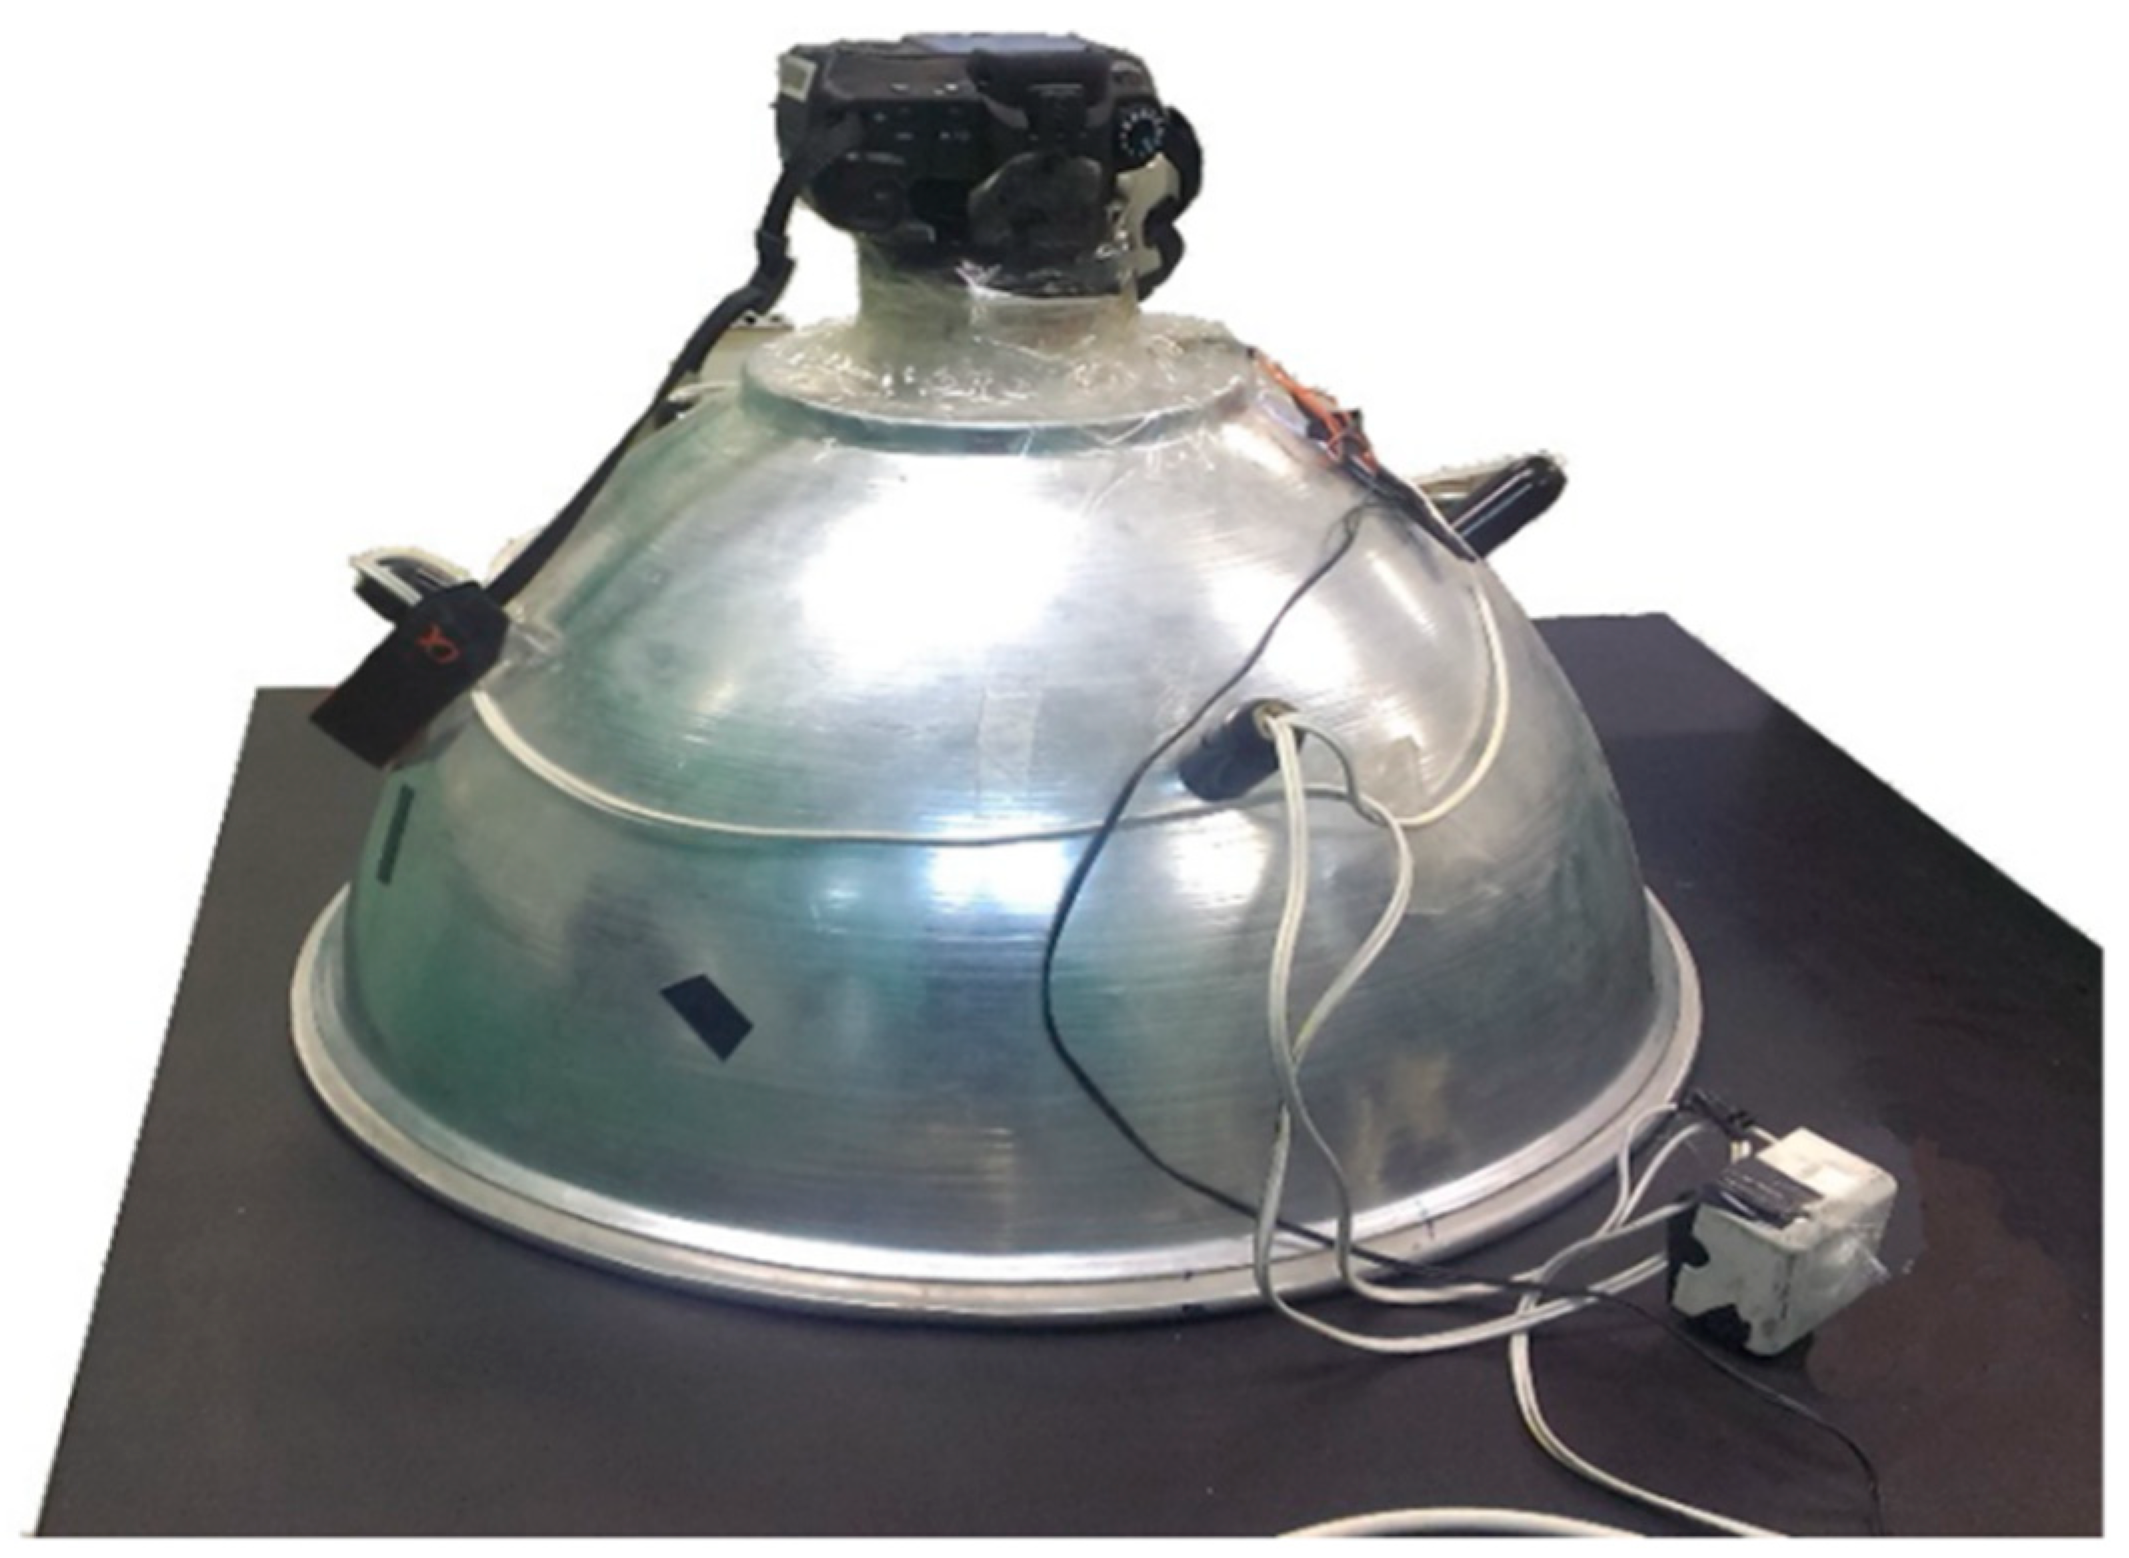
2.3.1. Hardware System
2.3.2. The Number of Samples for Imaging
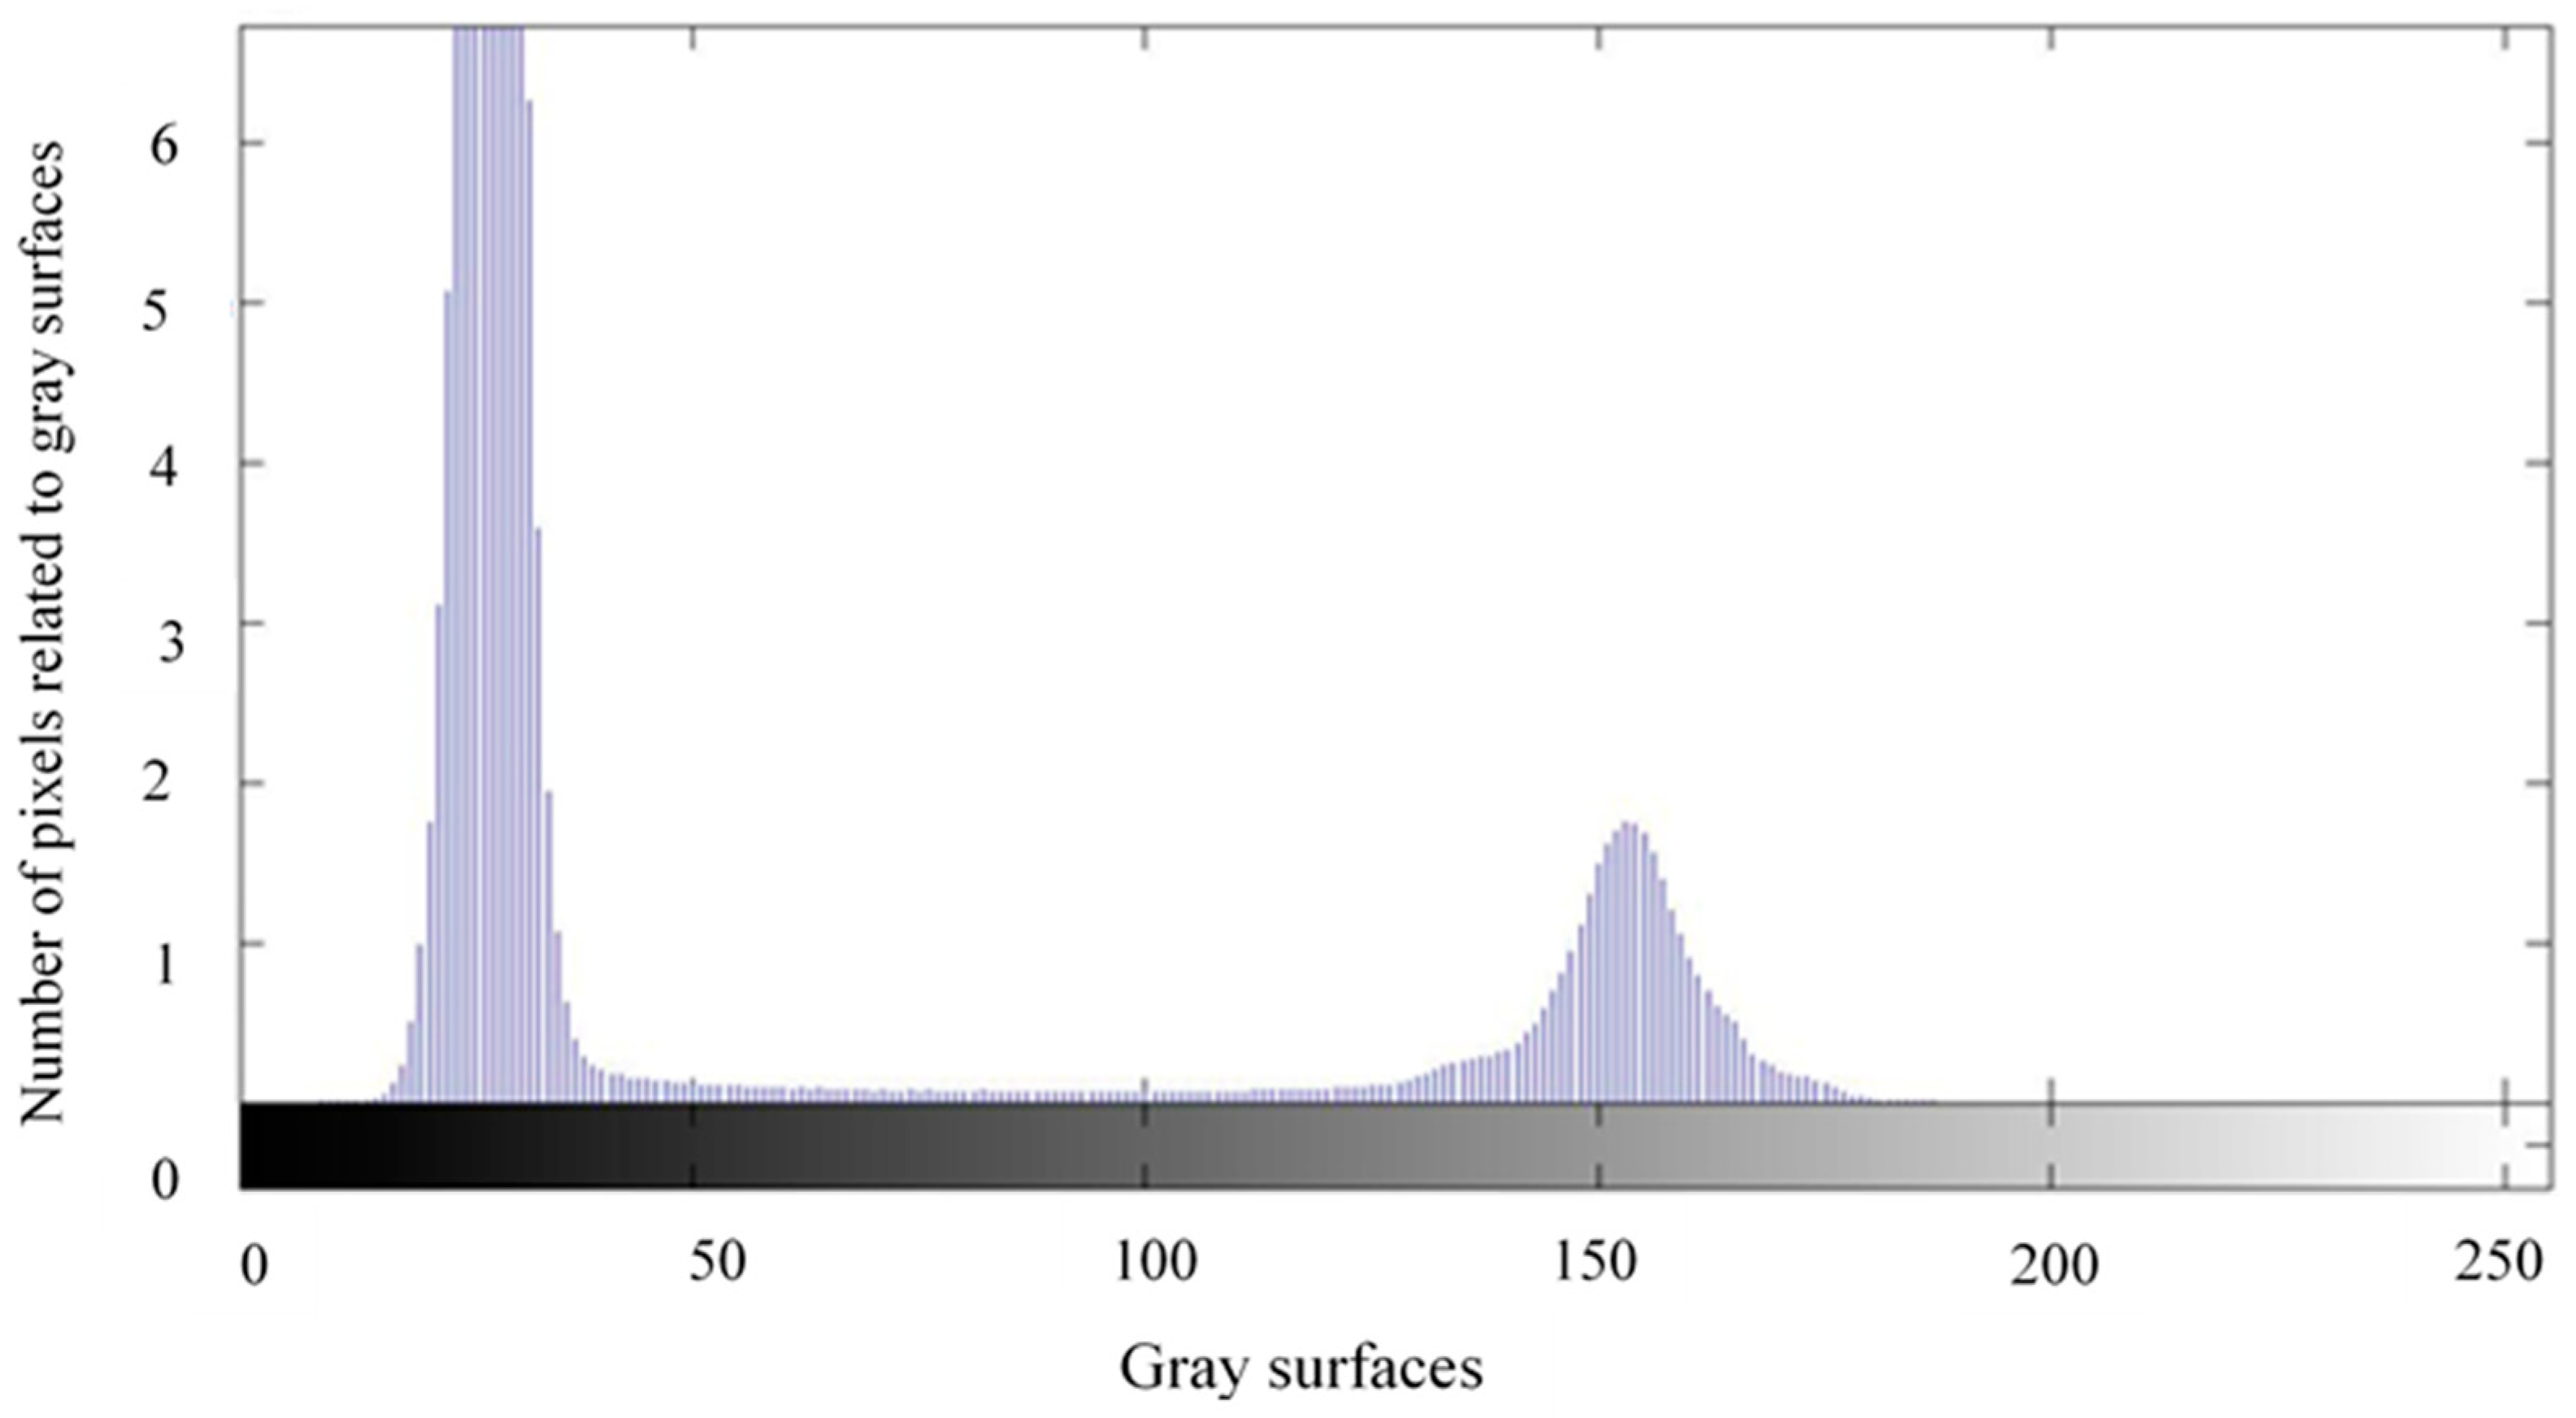
2.3.3. Segmentation
- Otsu’s method: it is an automatic thresholding method that produces a threshold value considering the image histogram. In this step, after thresholding, the image converts to a binary one with only black and white pixels.
- Elimination of objects with less than 100 pixels: due to the noise related to rice powder on the background, objects with less than 100 pixels were removed. This threshold was selected after the evaluation of images of rough, brown, and white rice.
- After the elimination of the aforementioned objects and producing a new binary image, some background-colored cavities were observed on the seeds. This issue can occur due to the unsuitable light reflection, especially on the edges. These very small black spots were observed, especially in rough and brown rice. To fill the cavities, the “imfill” order of the MATLAB software was run.
2.3.4. Extraction Characteristics of Samples
Color Features
Morphological Characteristics
Texture Characteristics
2.4. ANOVA
2.5. Analyzing Principal Components
2.6. Classification
2.6.1. Discriminant Analysis (DA)
2.6.2. Back-Propagation Artificial Neural Network
2.7. Criteria for Performance Evaluation of Classifiers
3. Results and Discussion
3.1. Data Normalization Test
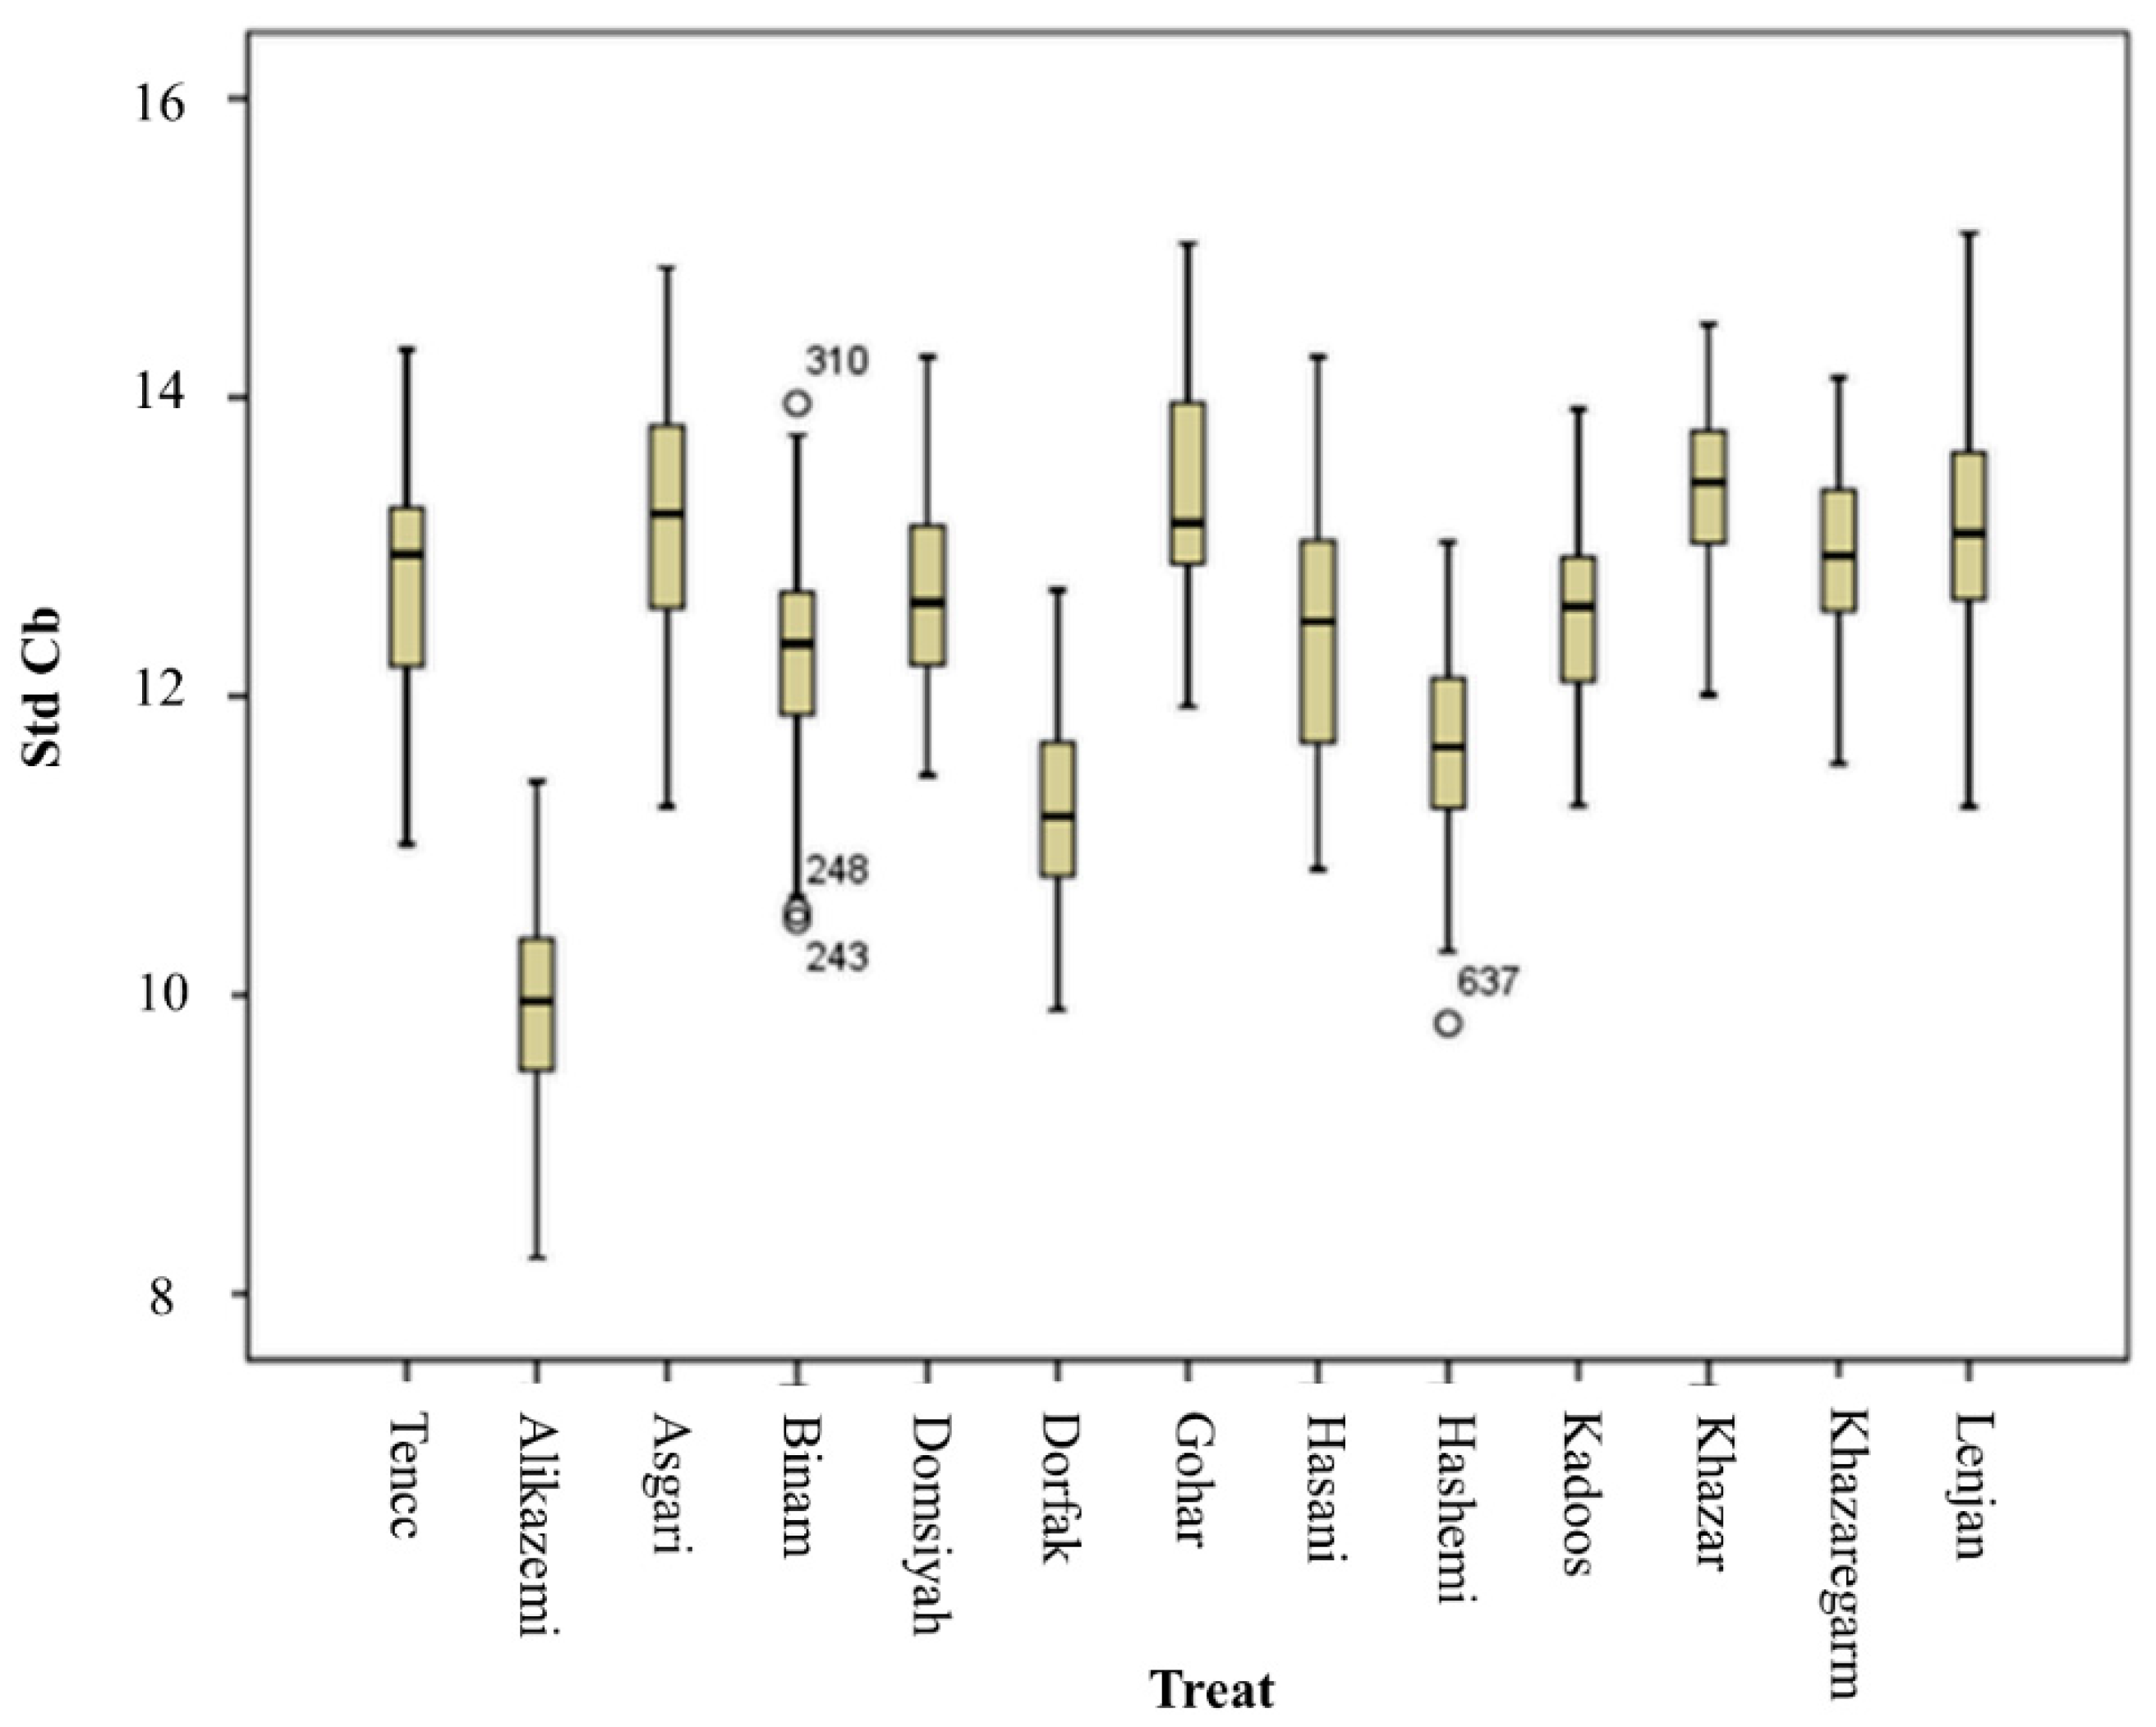
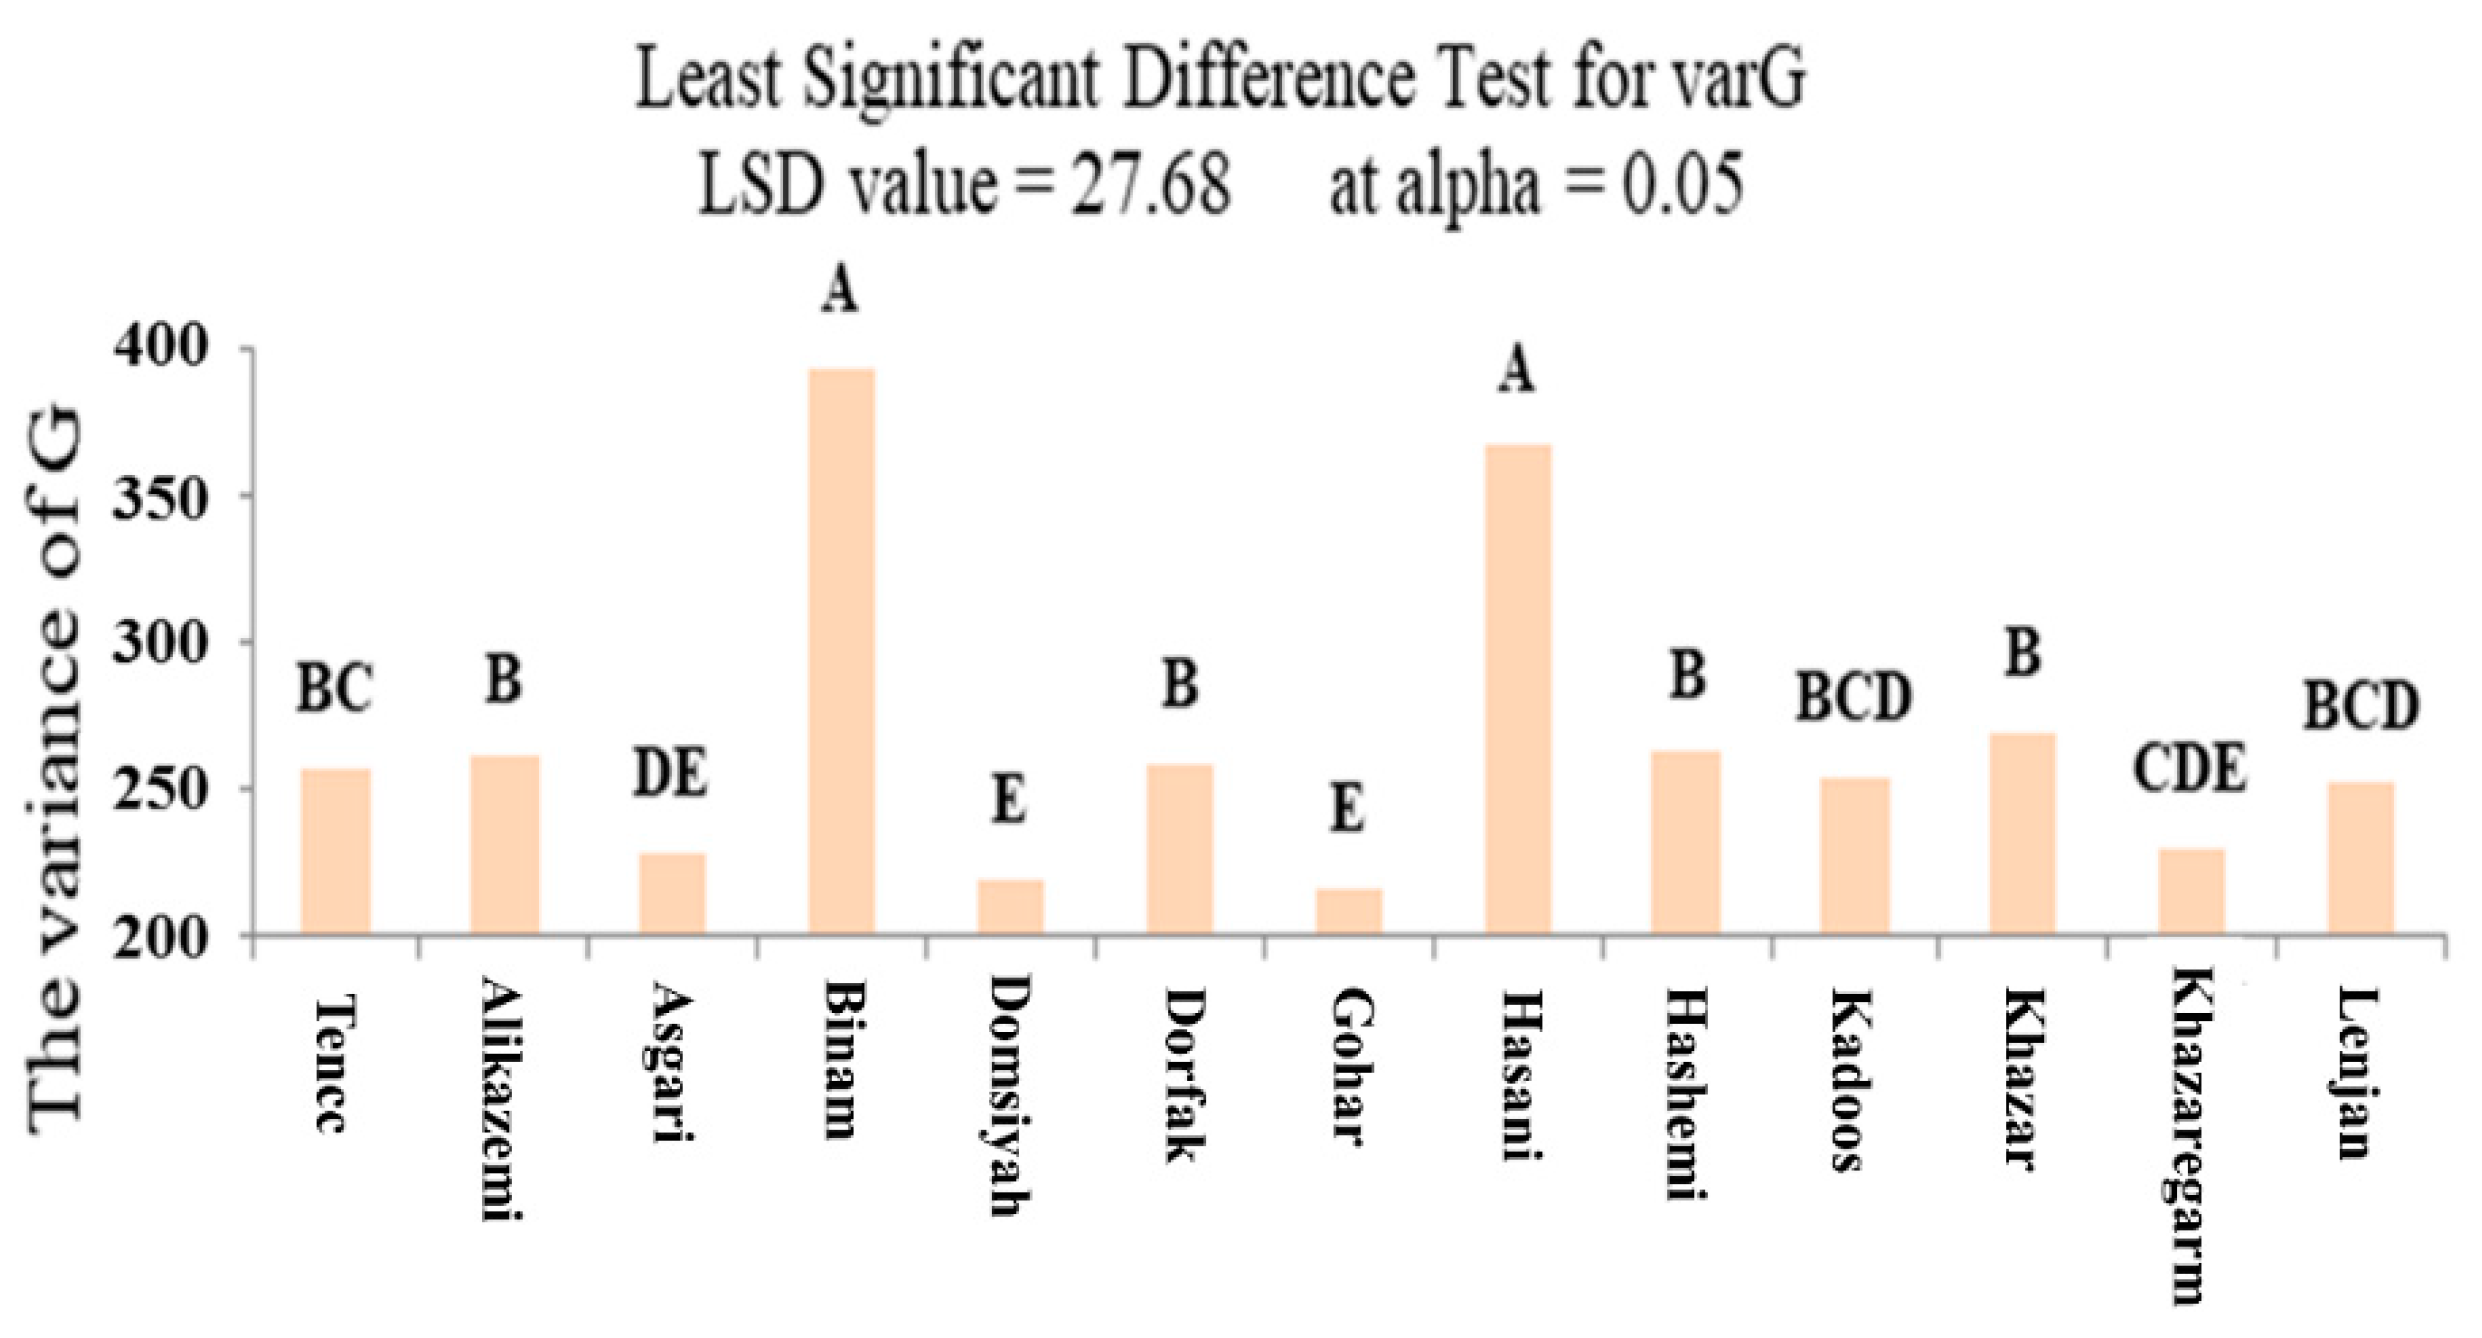
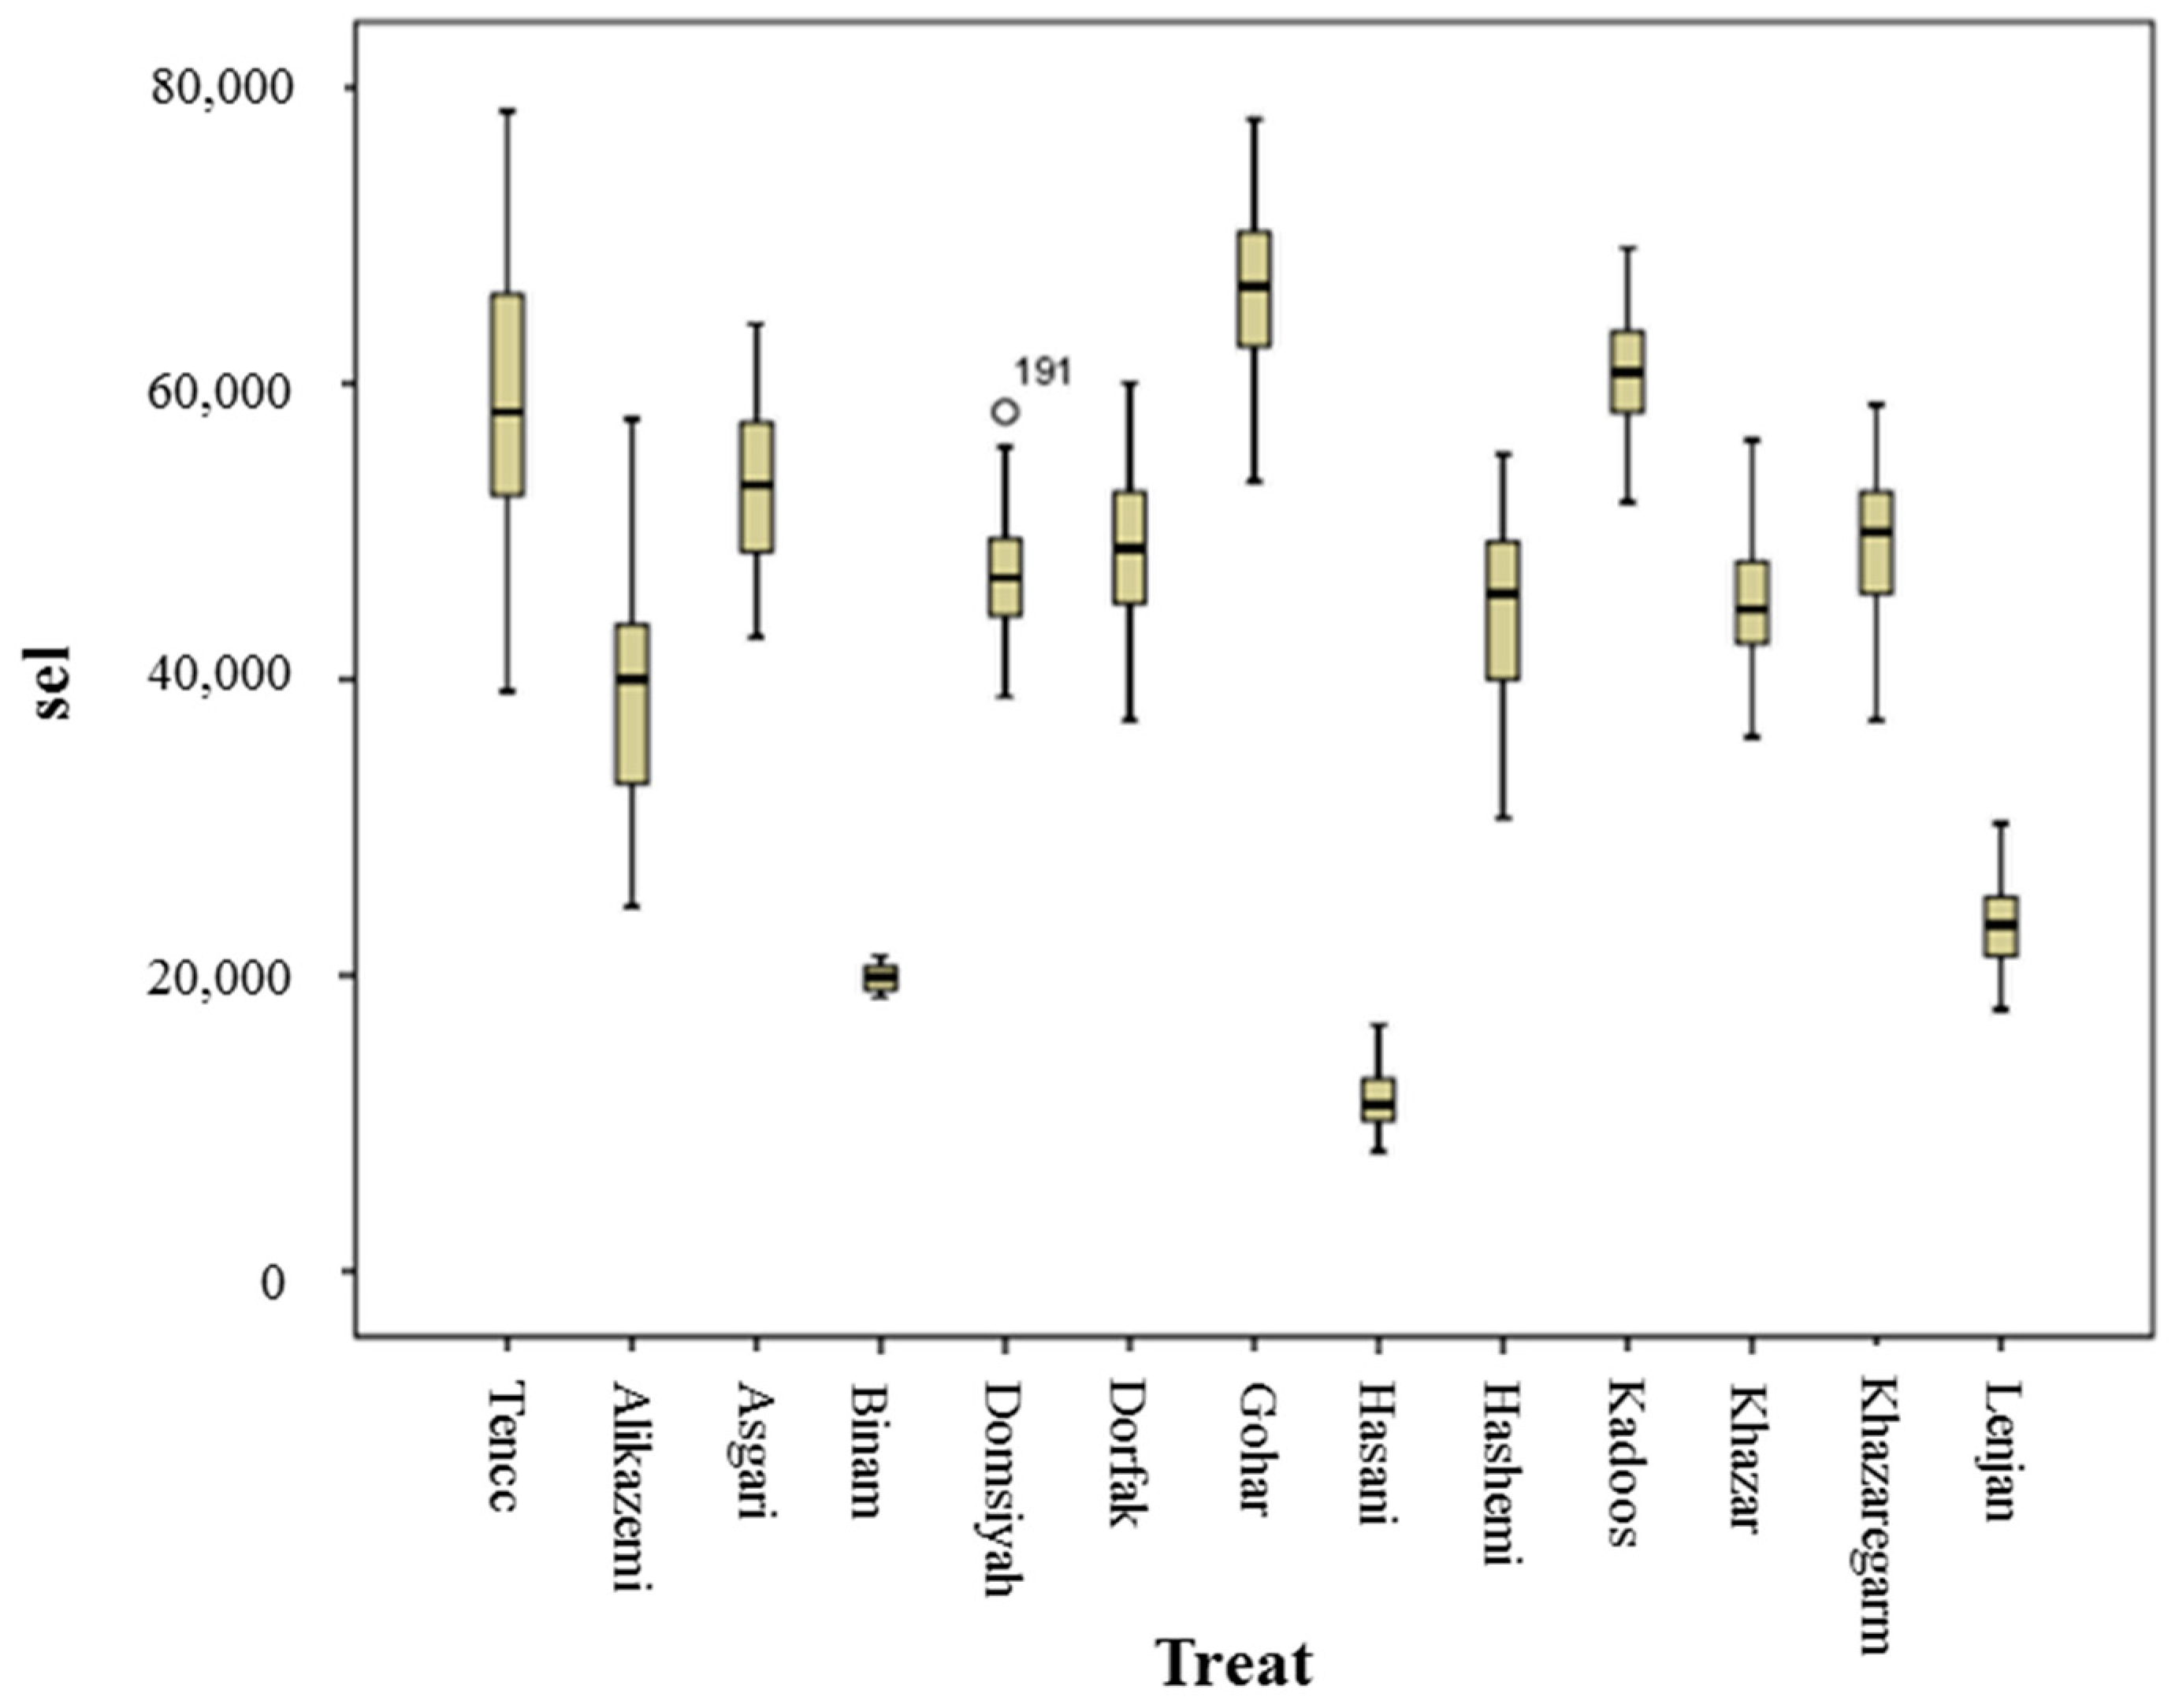
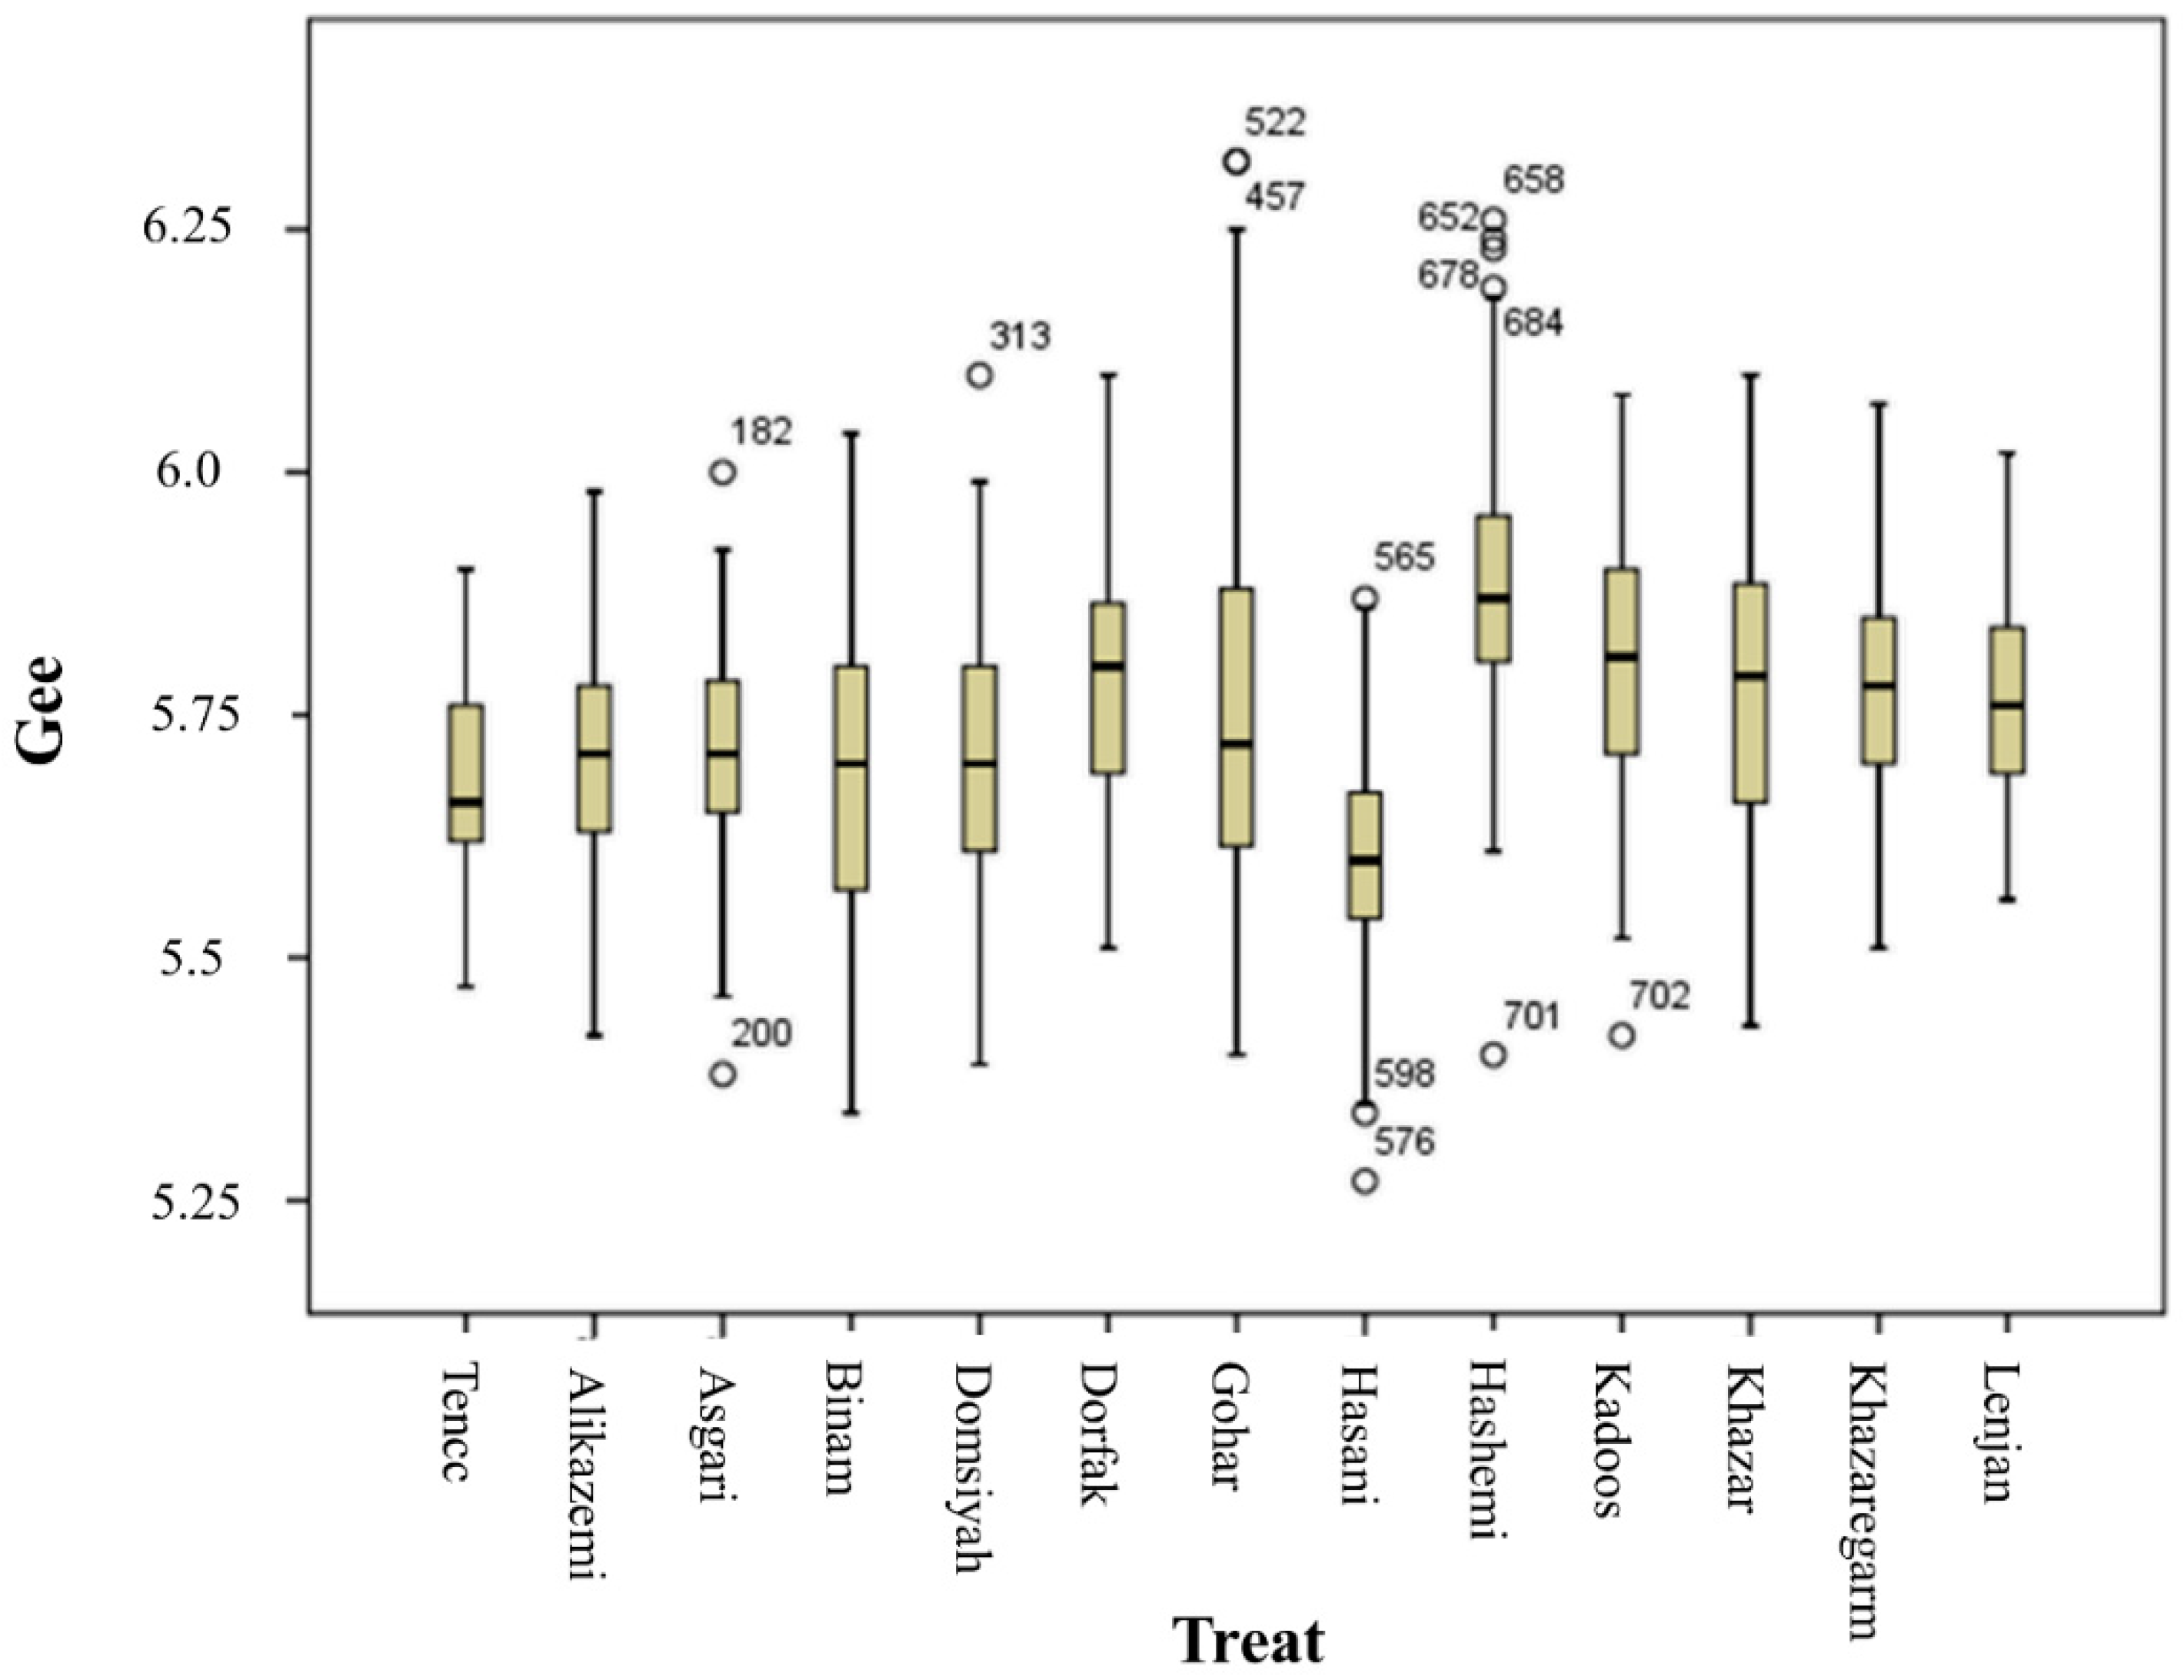
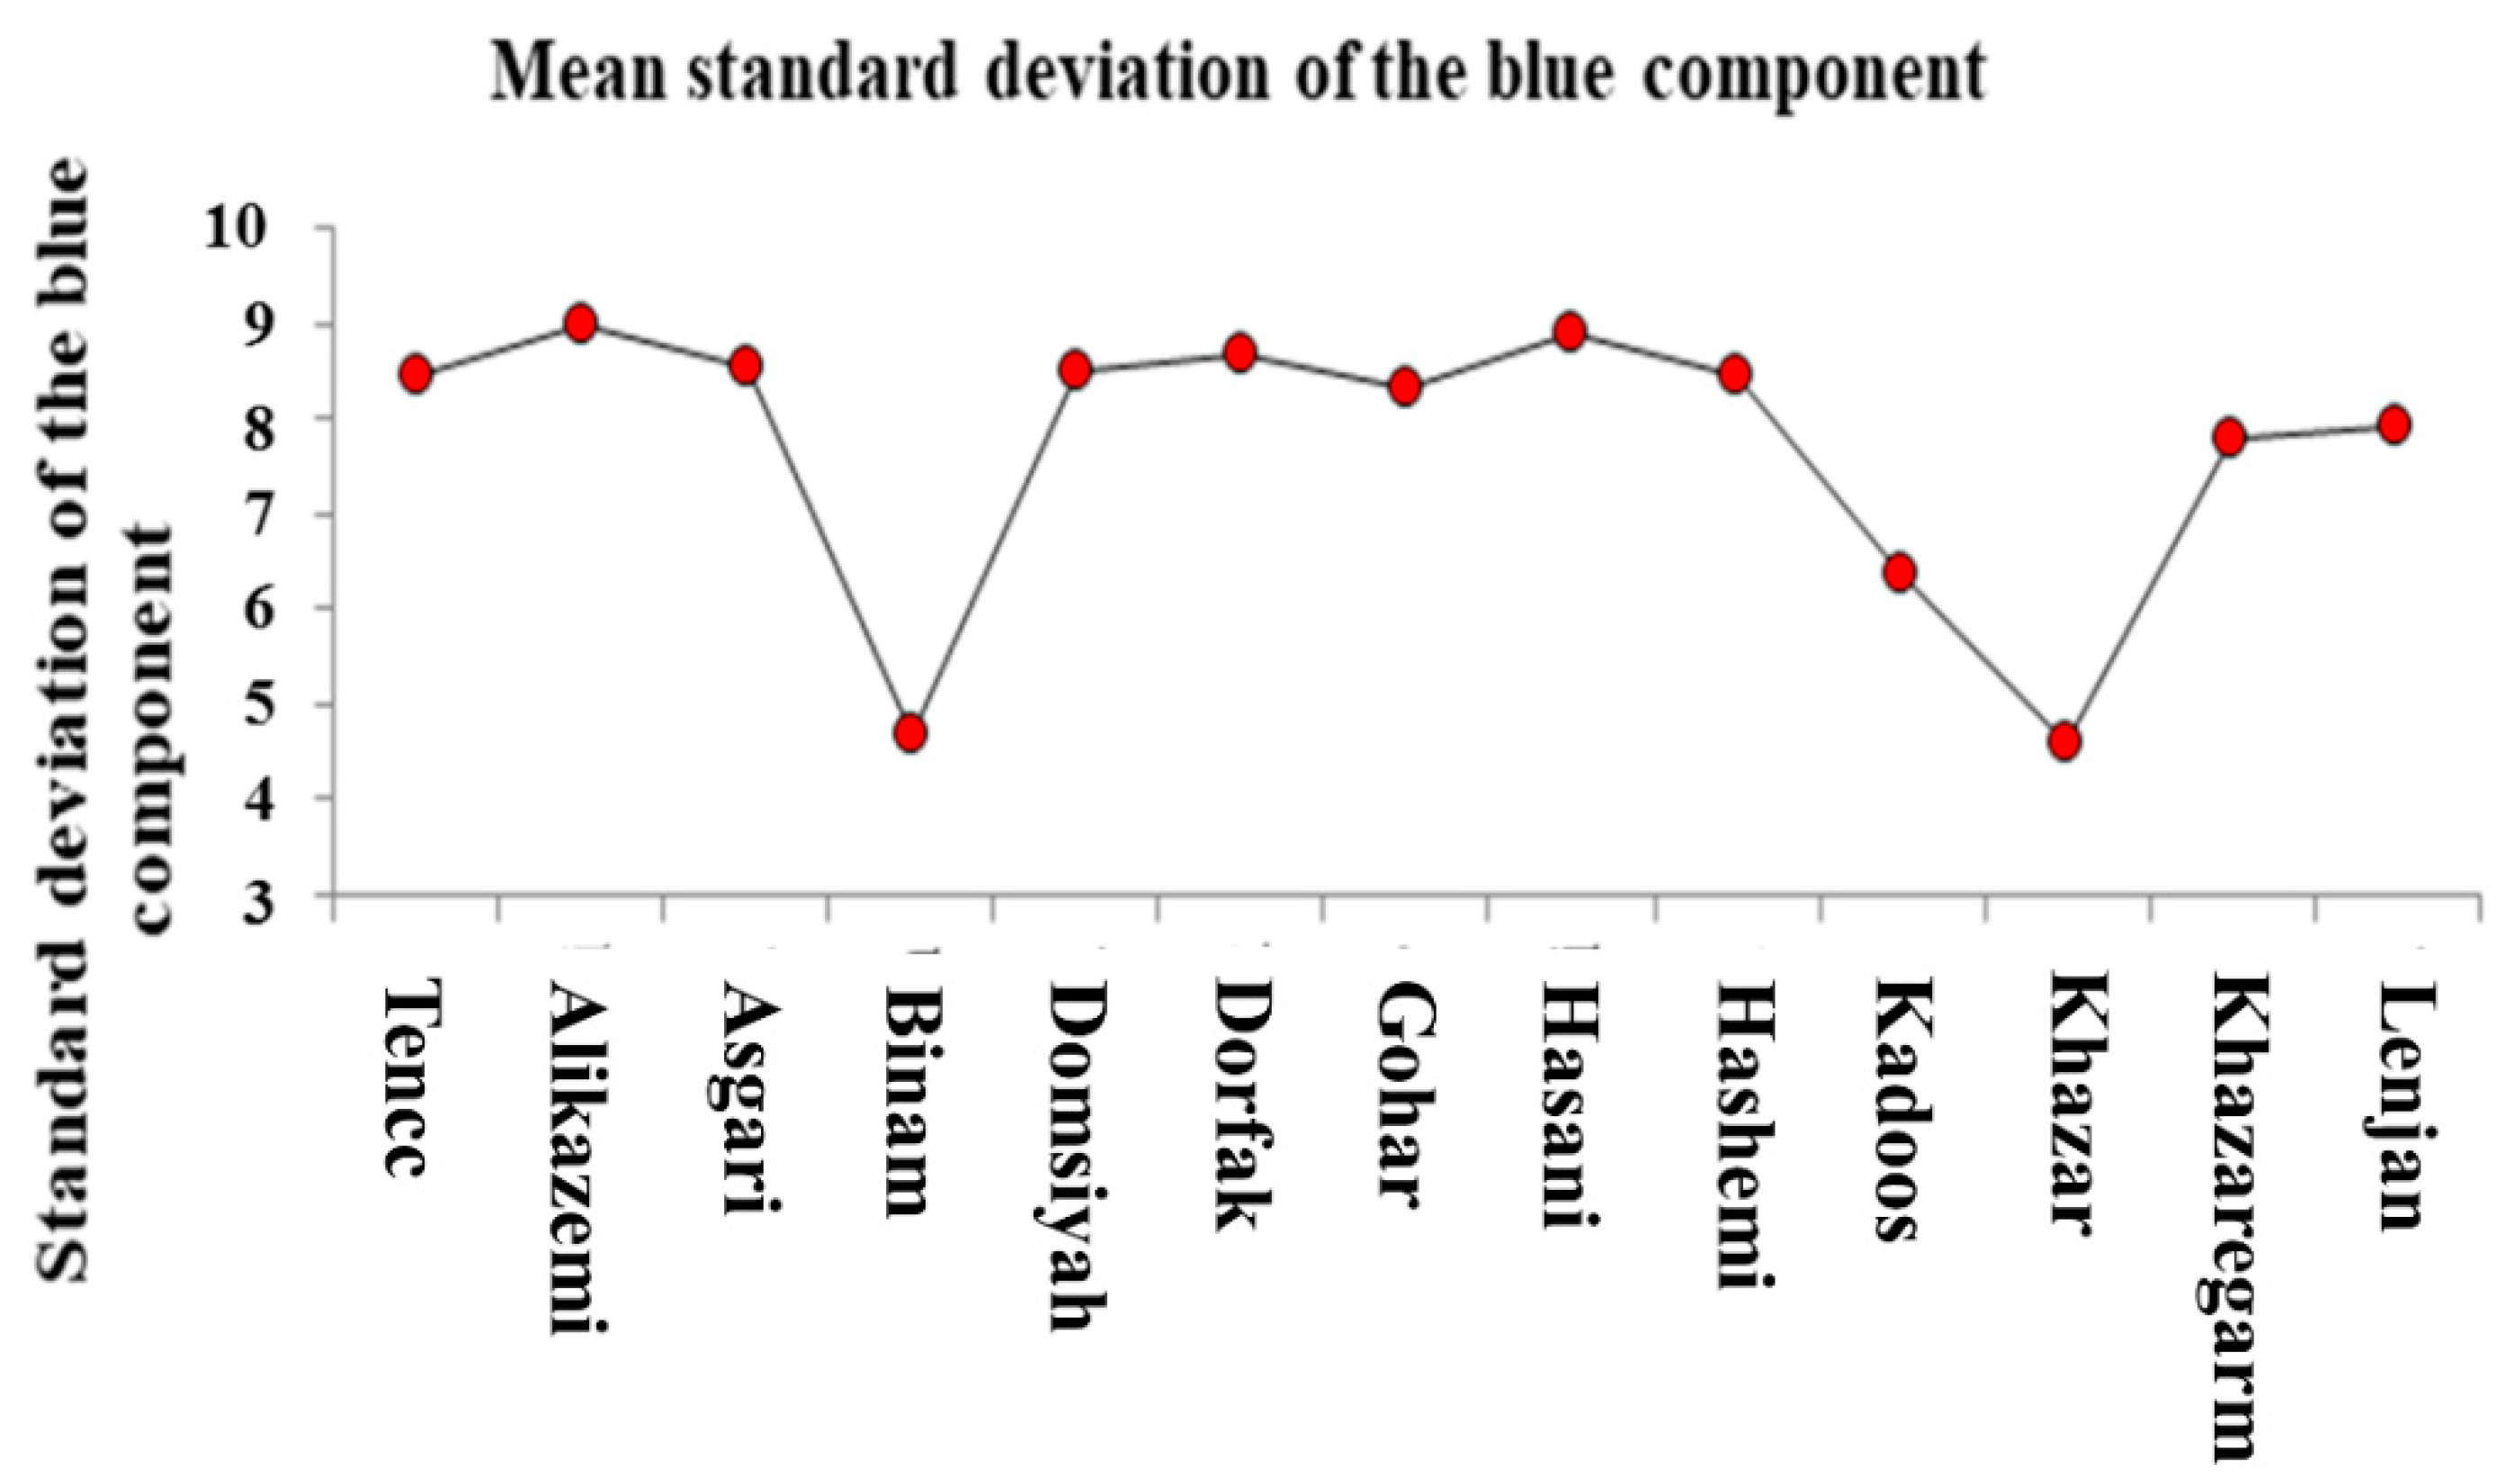
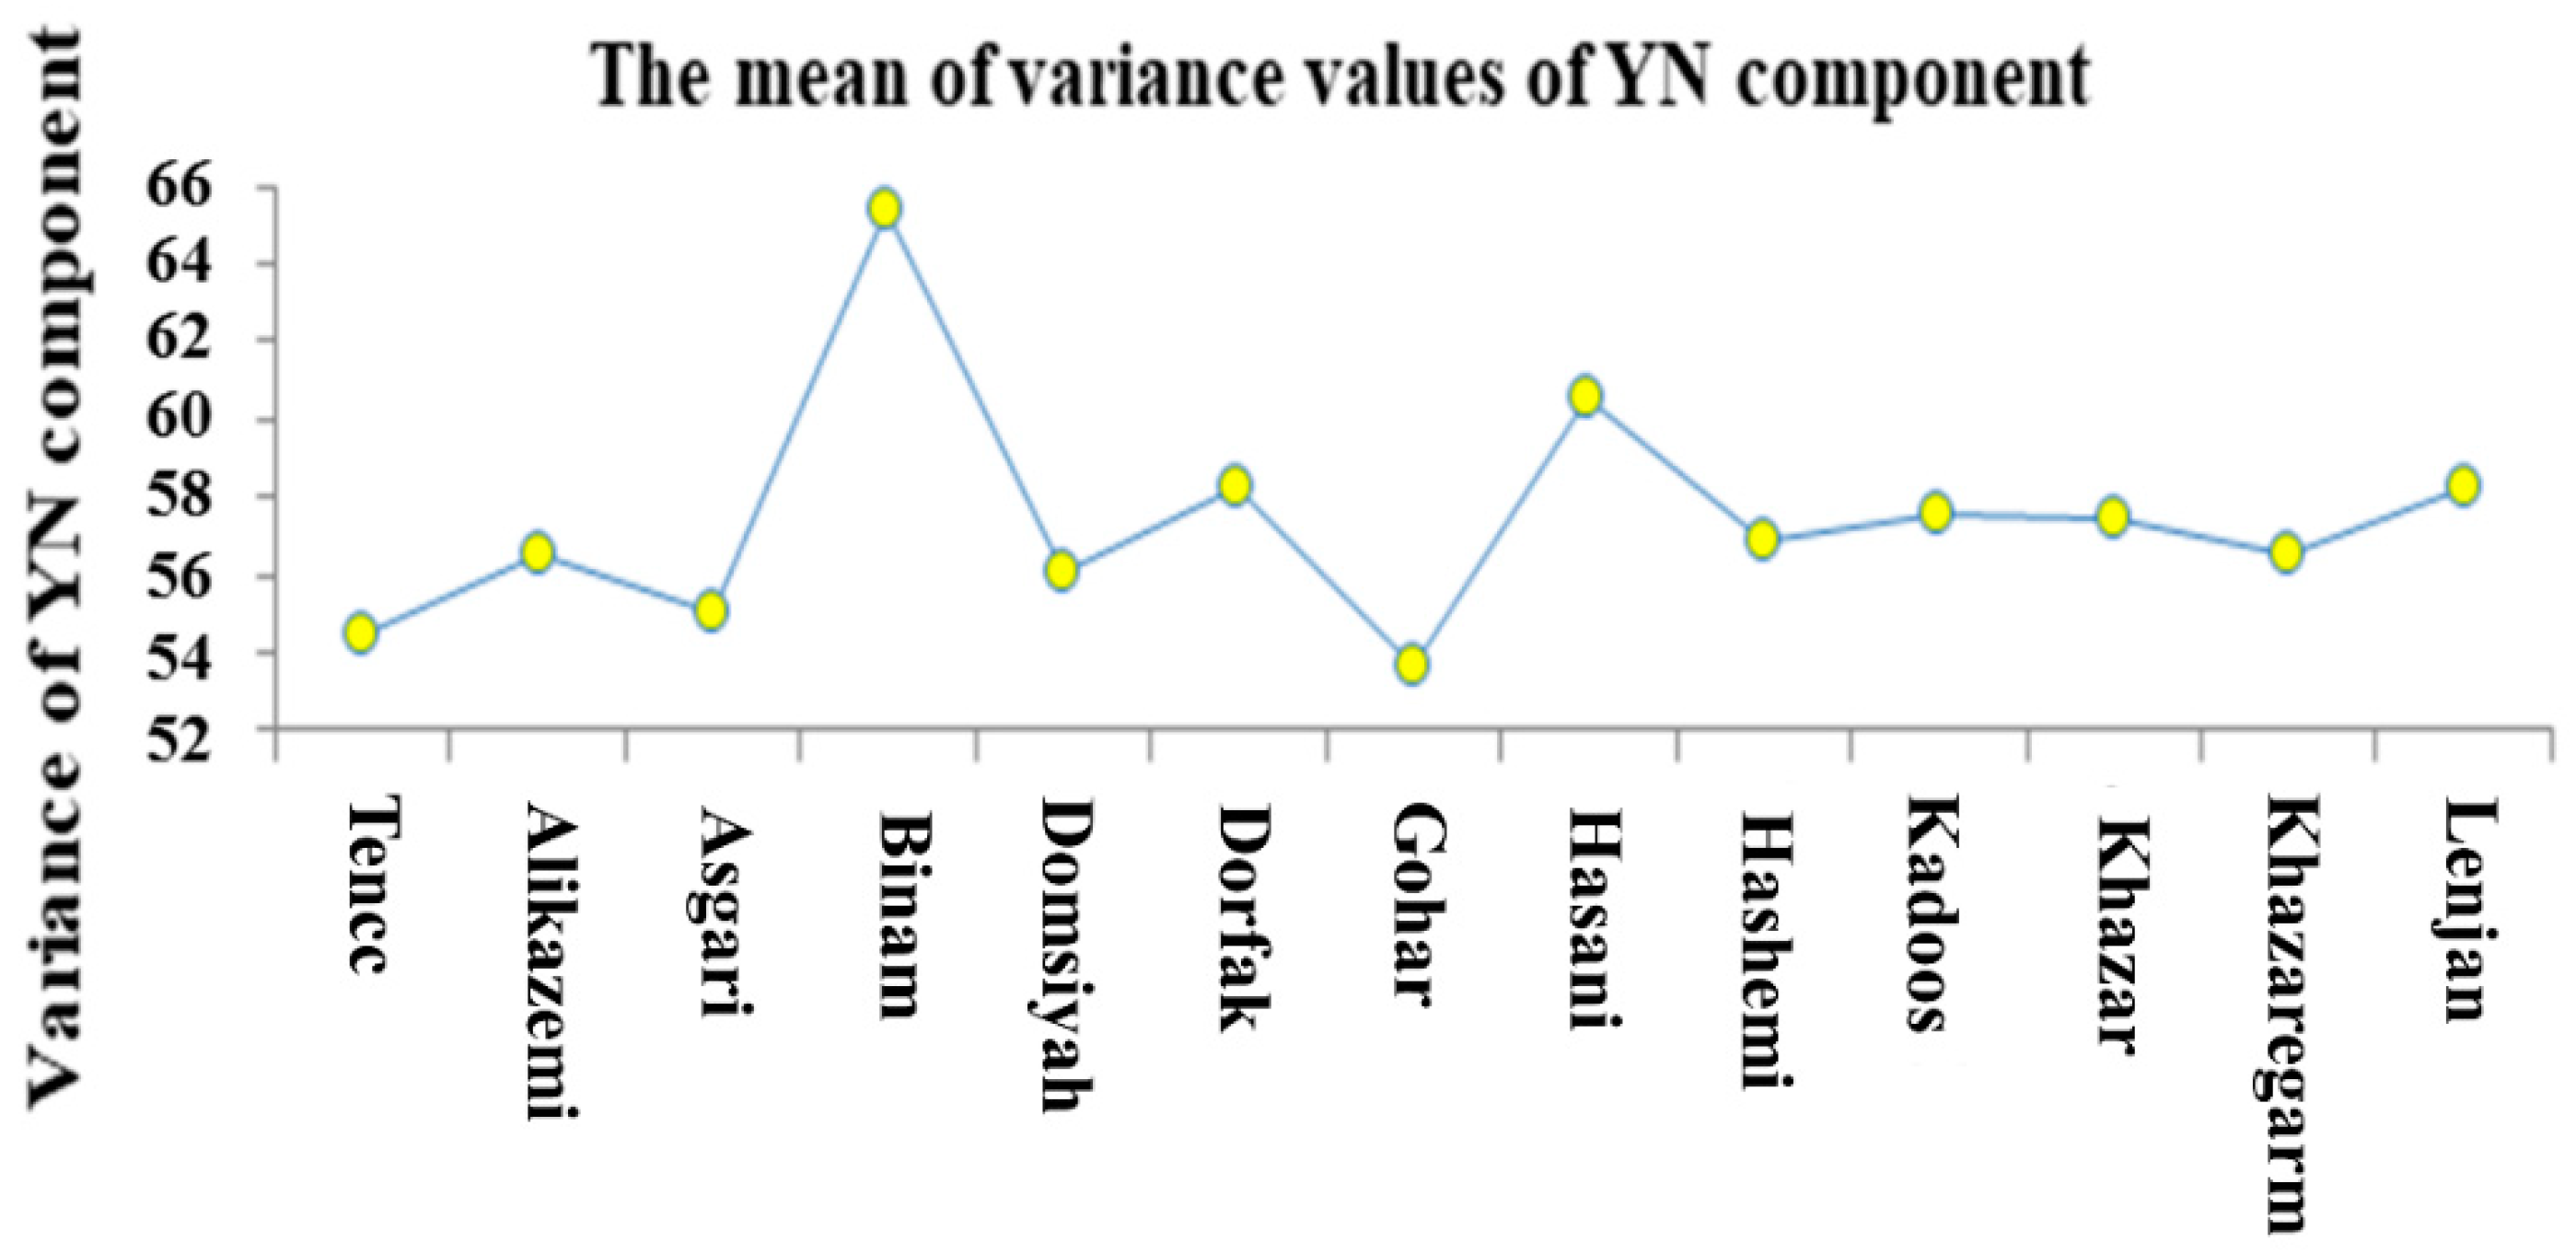
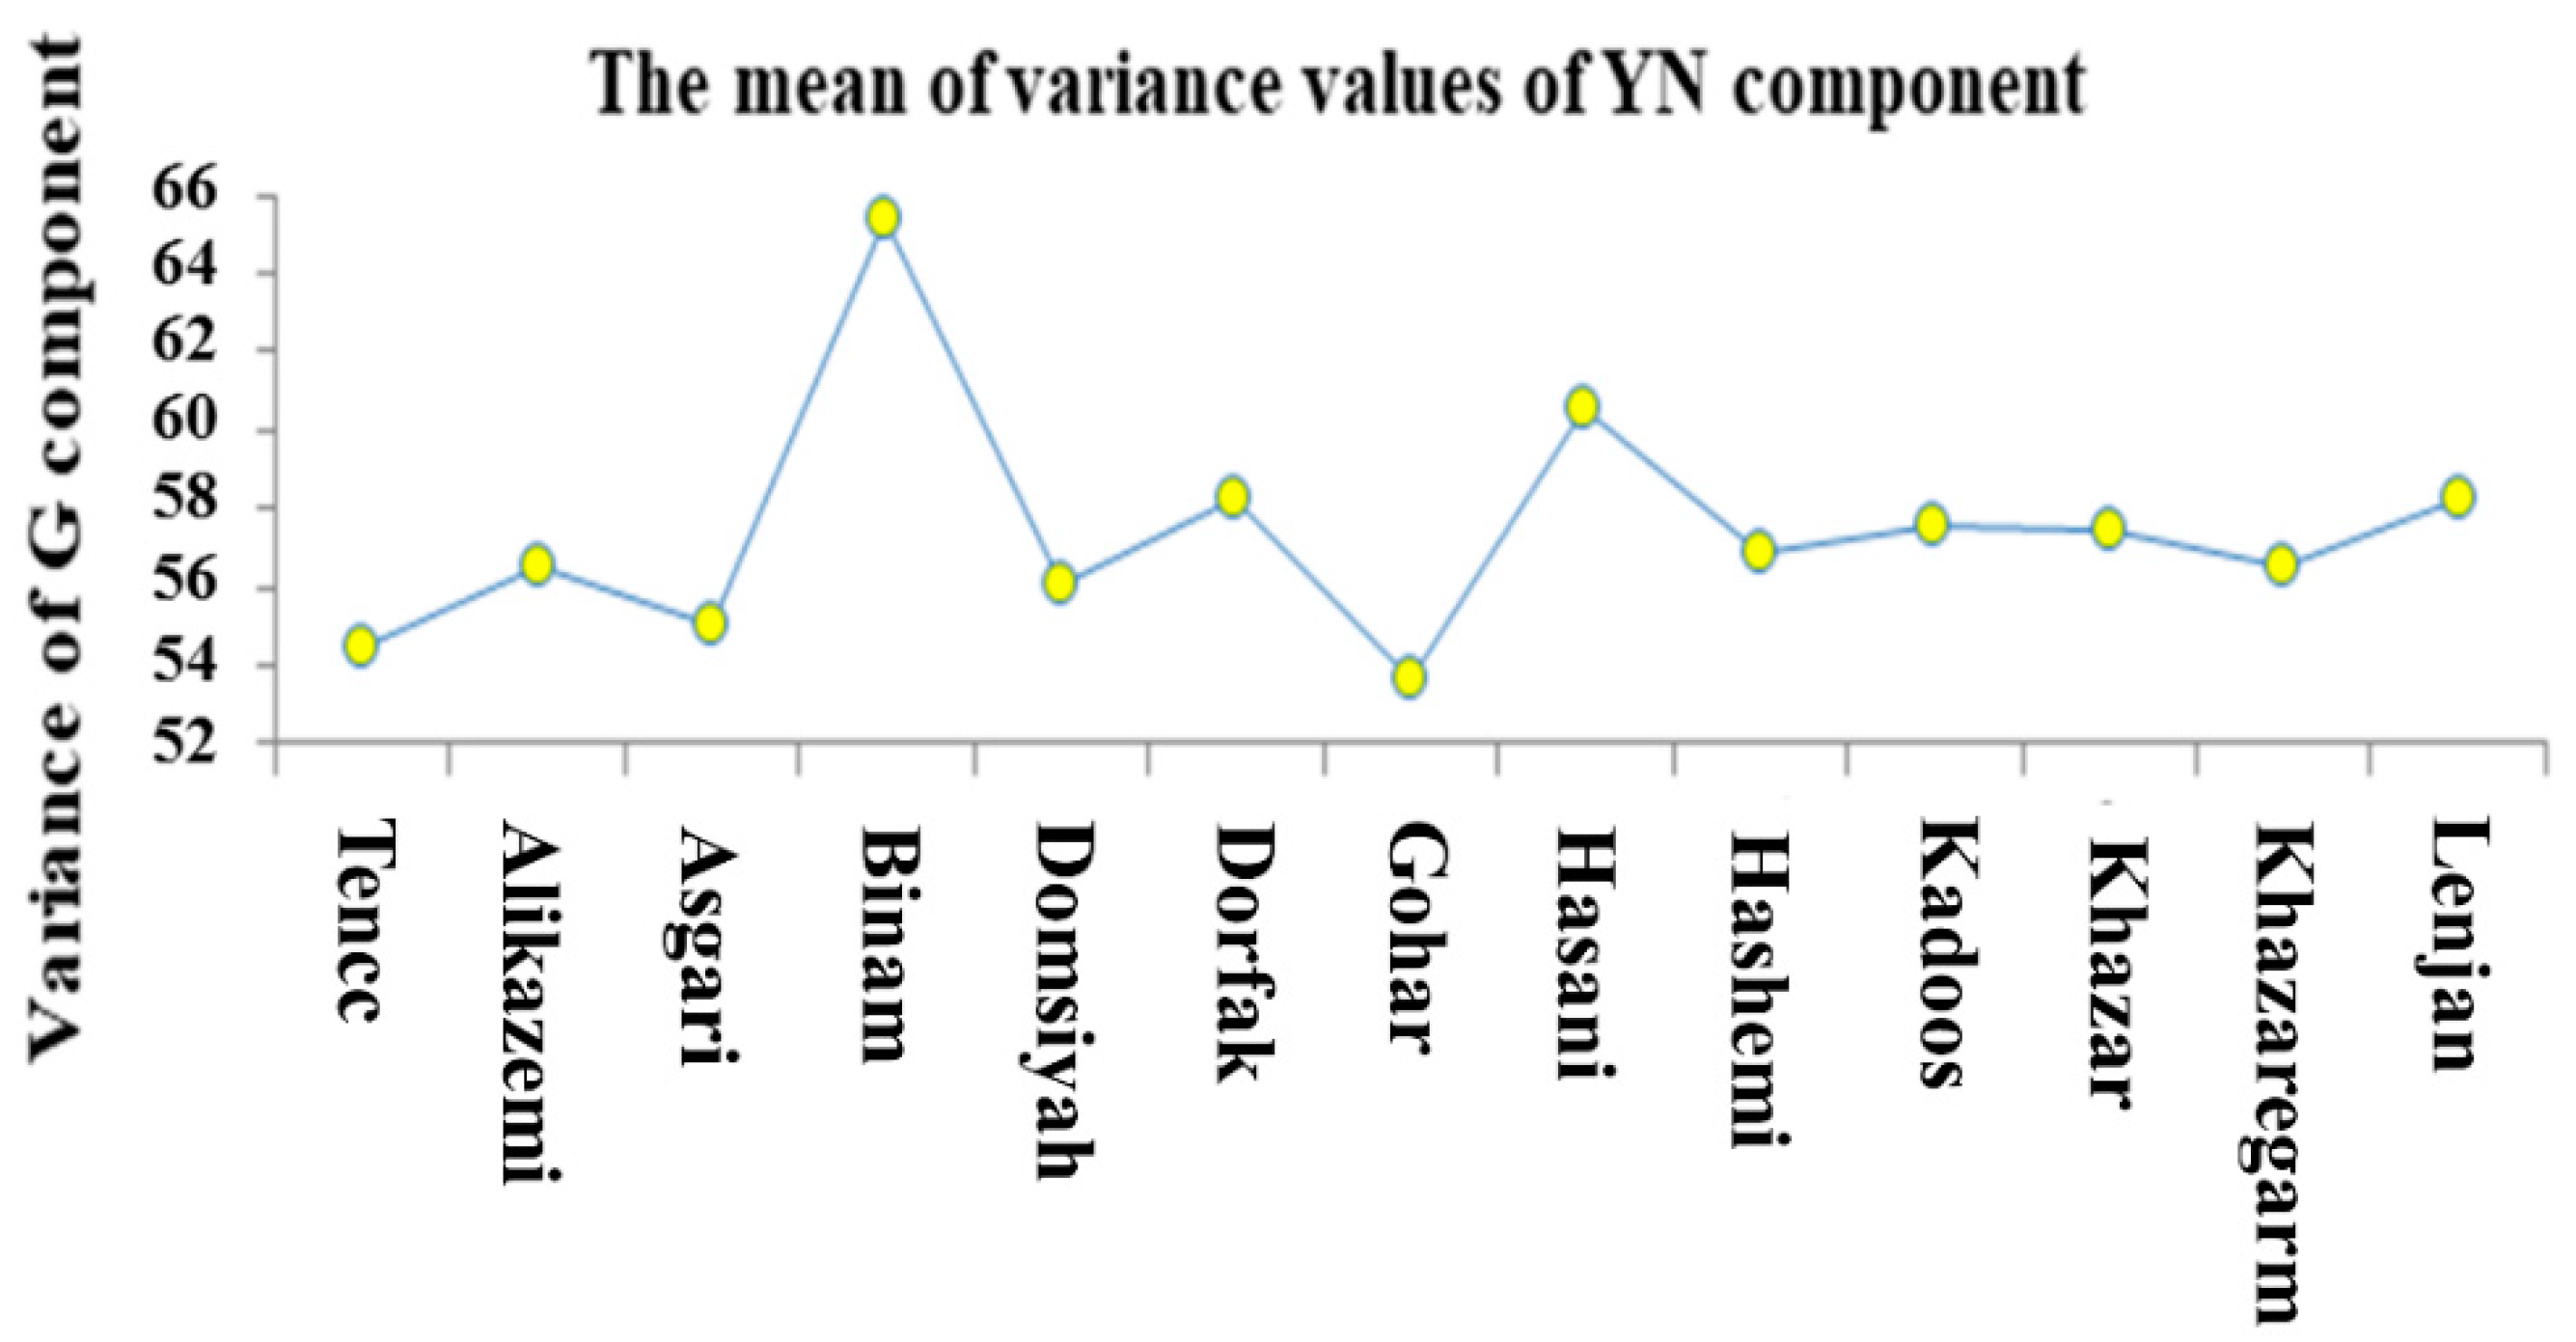
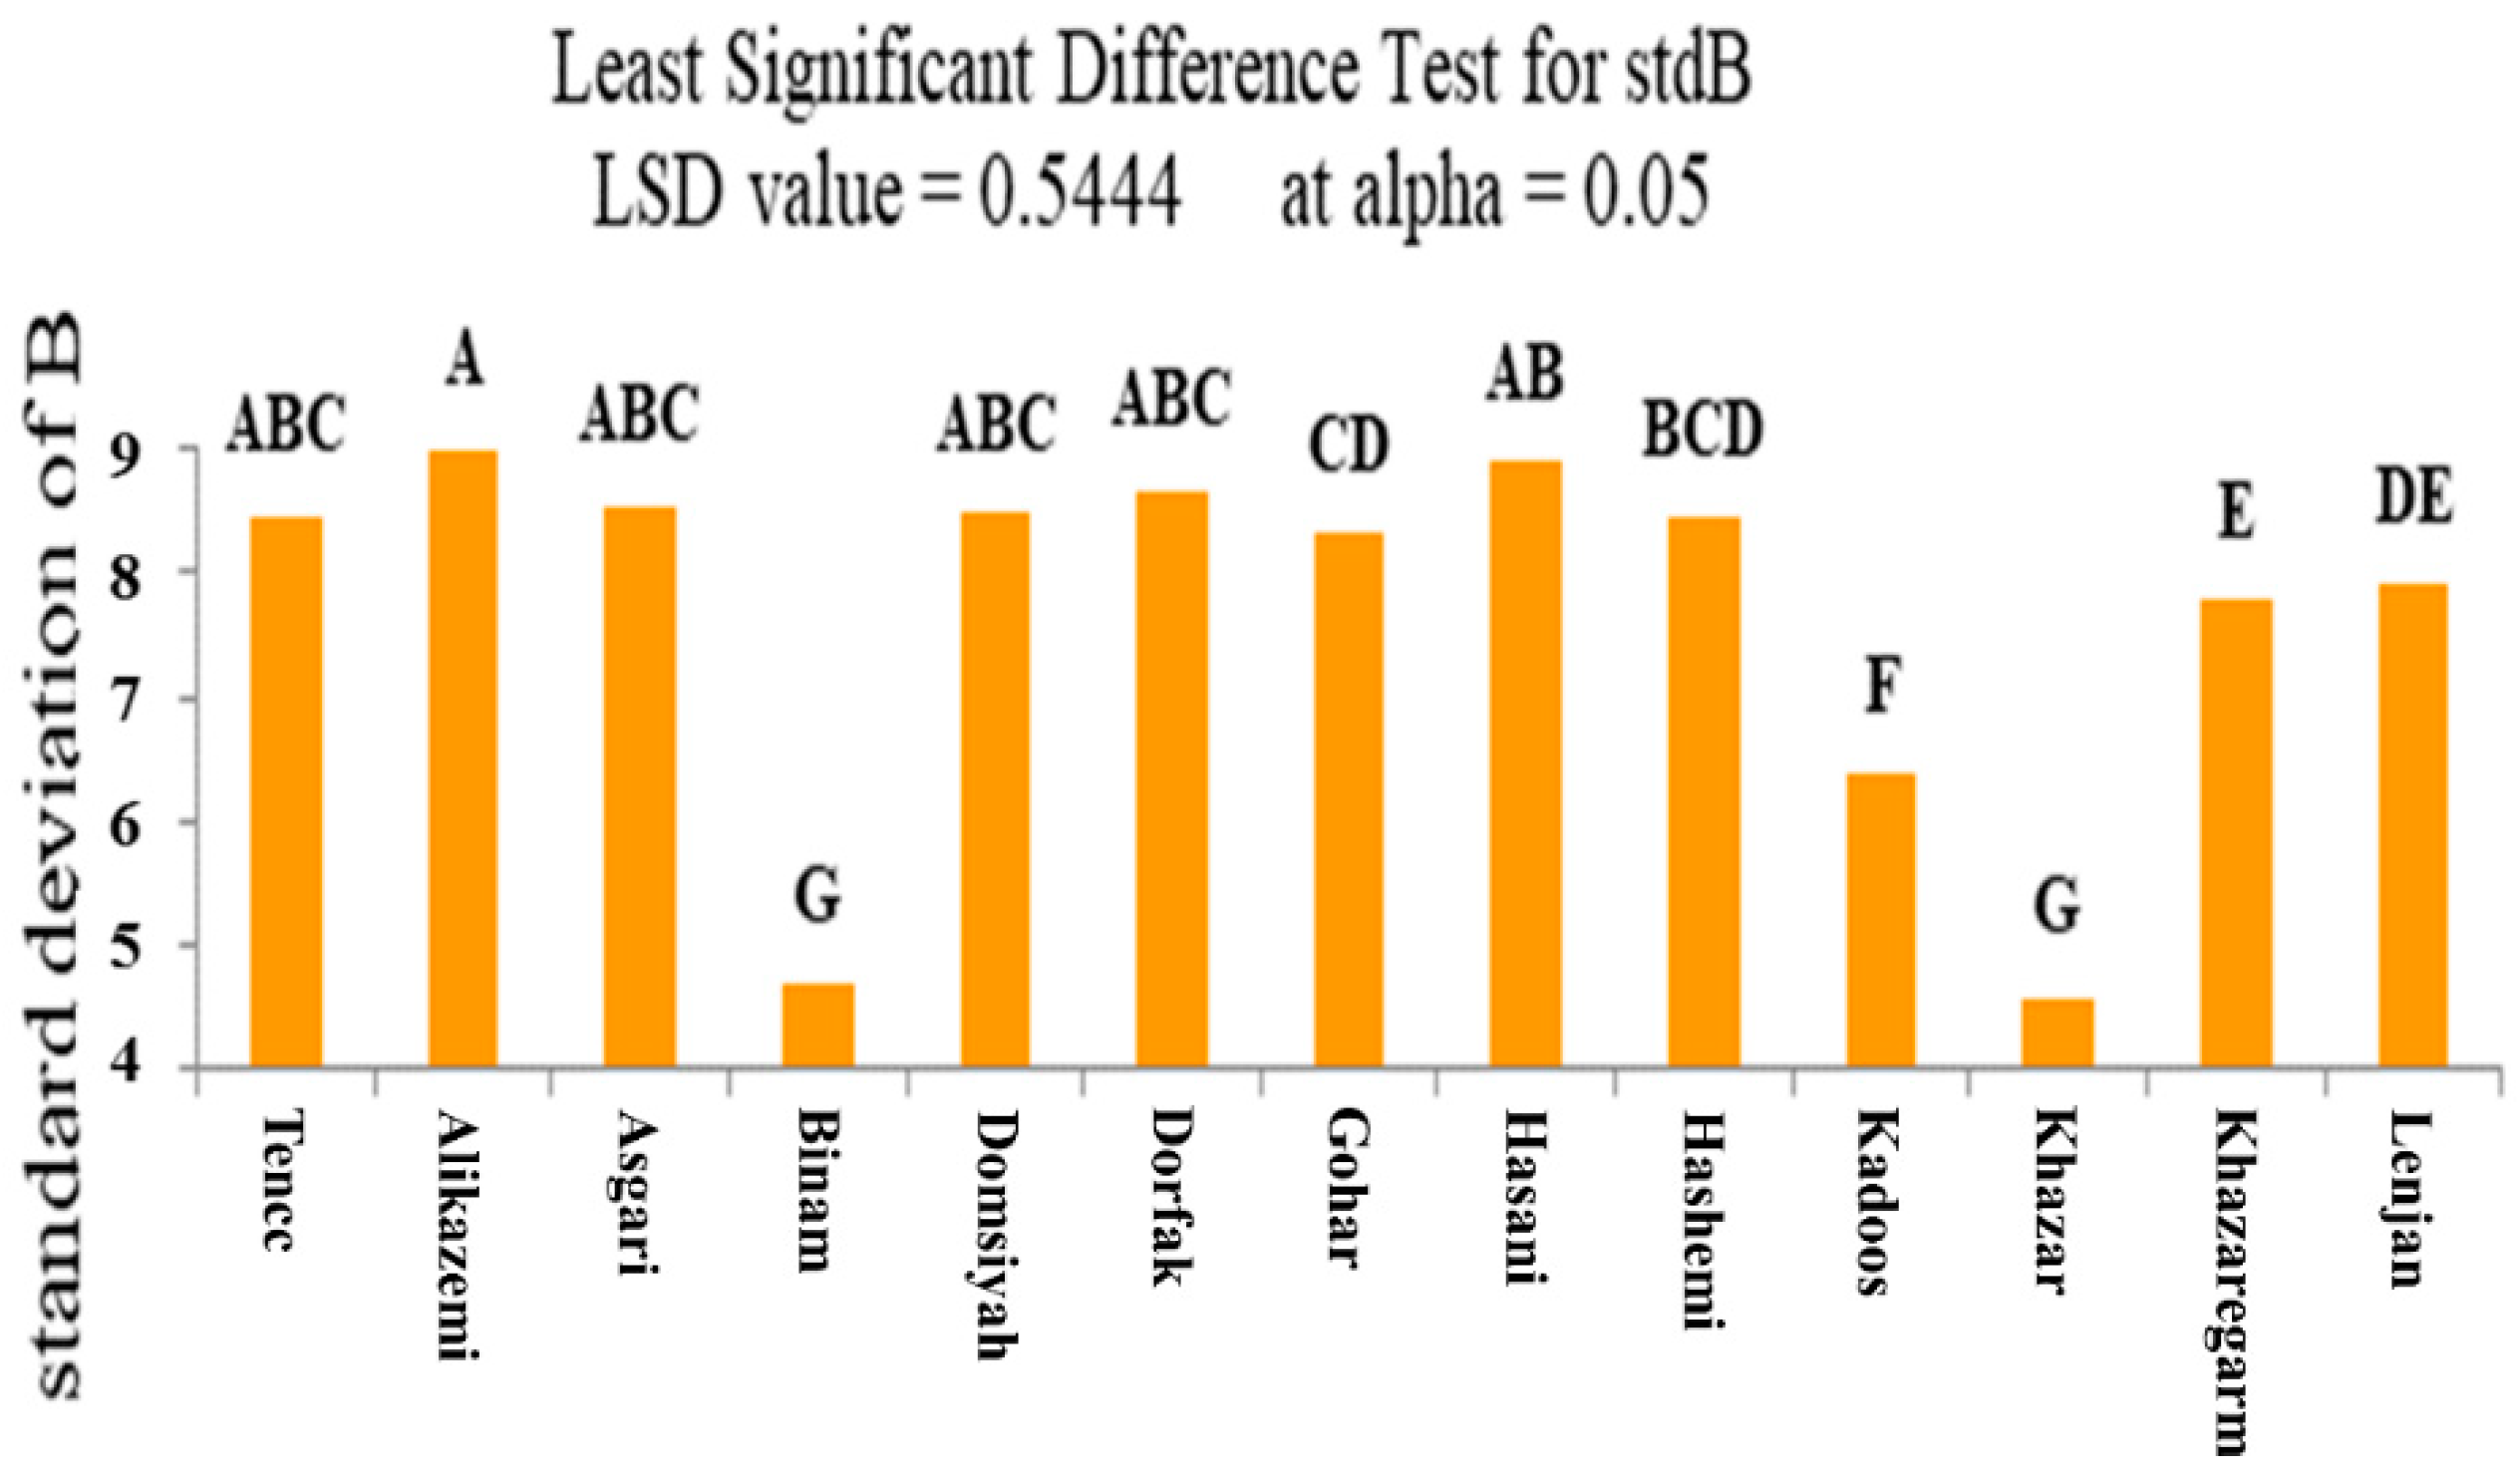
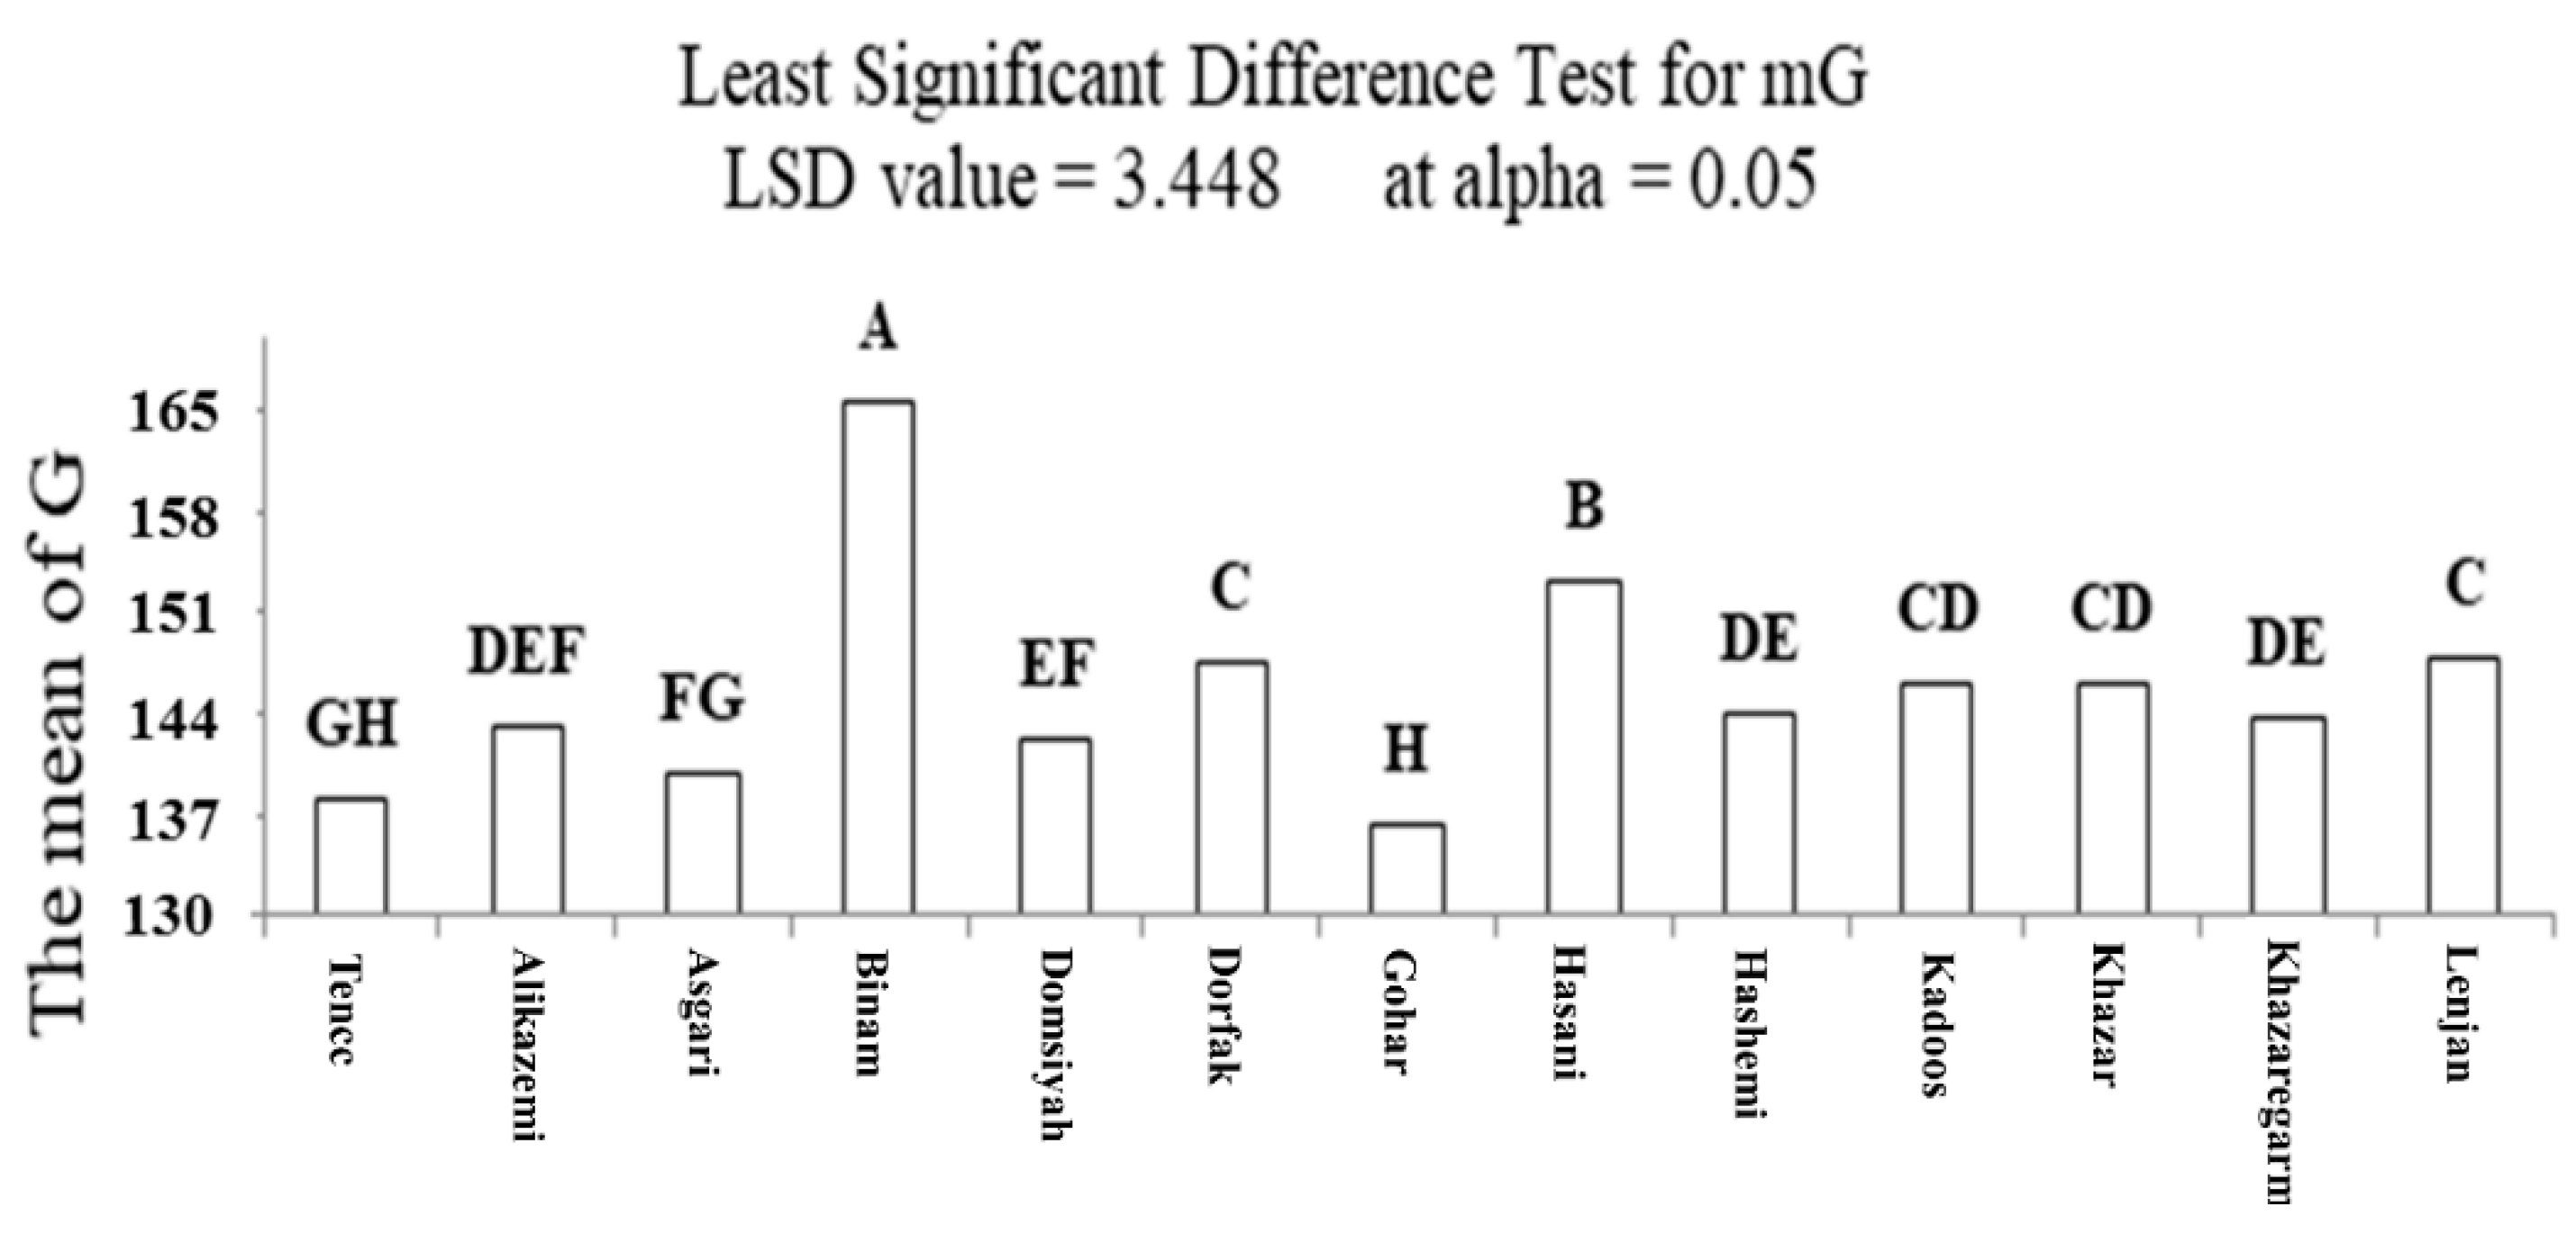
3.2. ANOVA and Mean Comparison
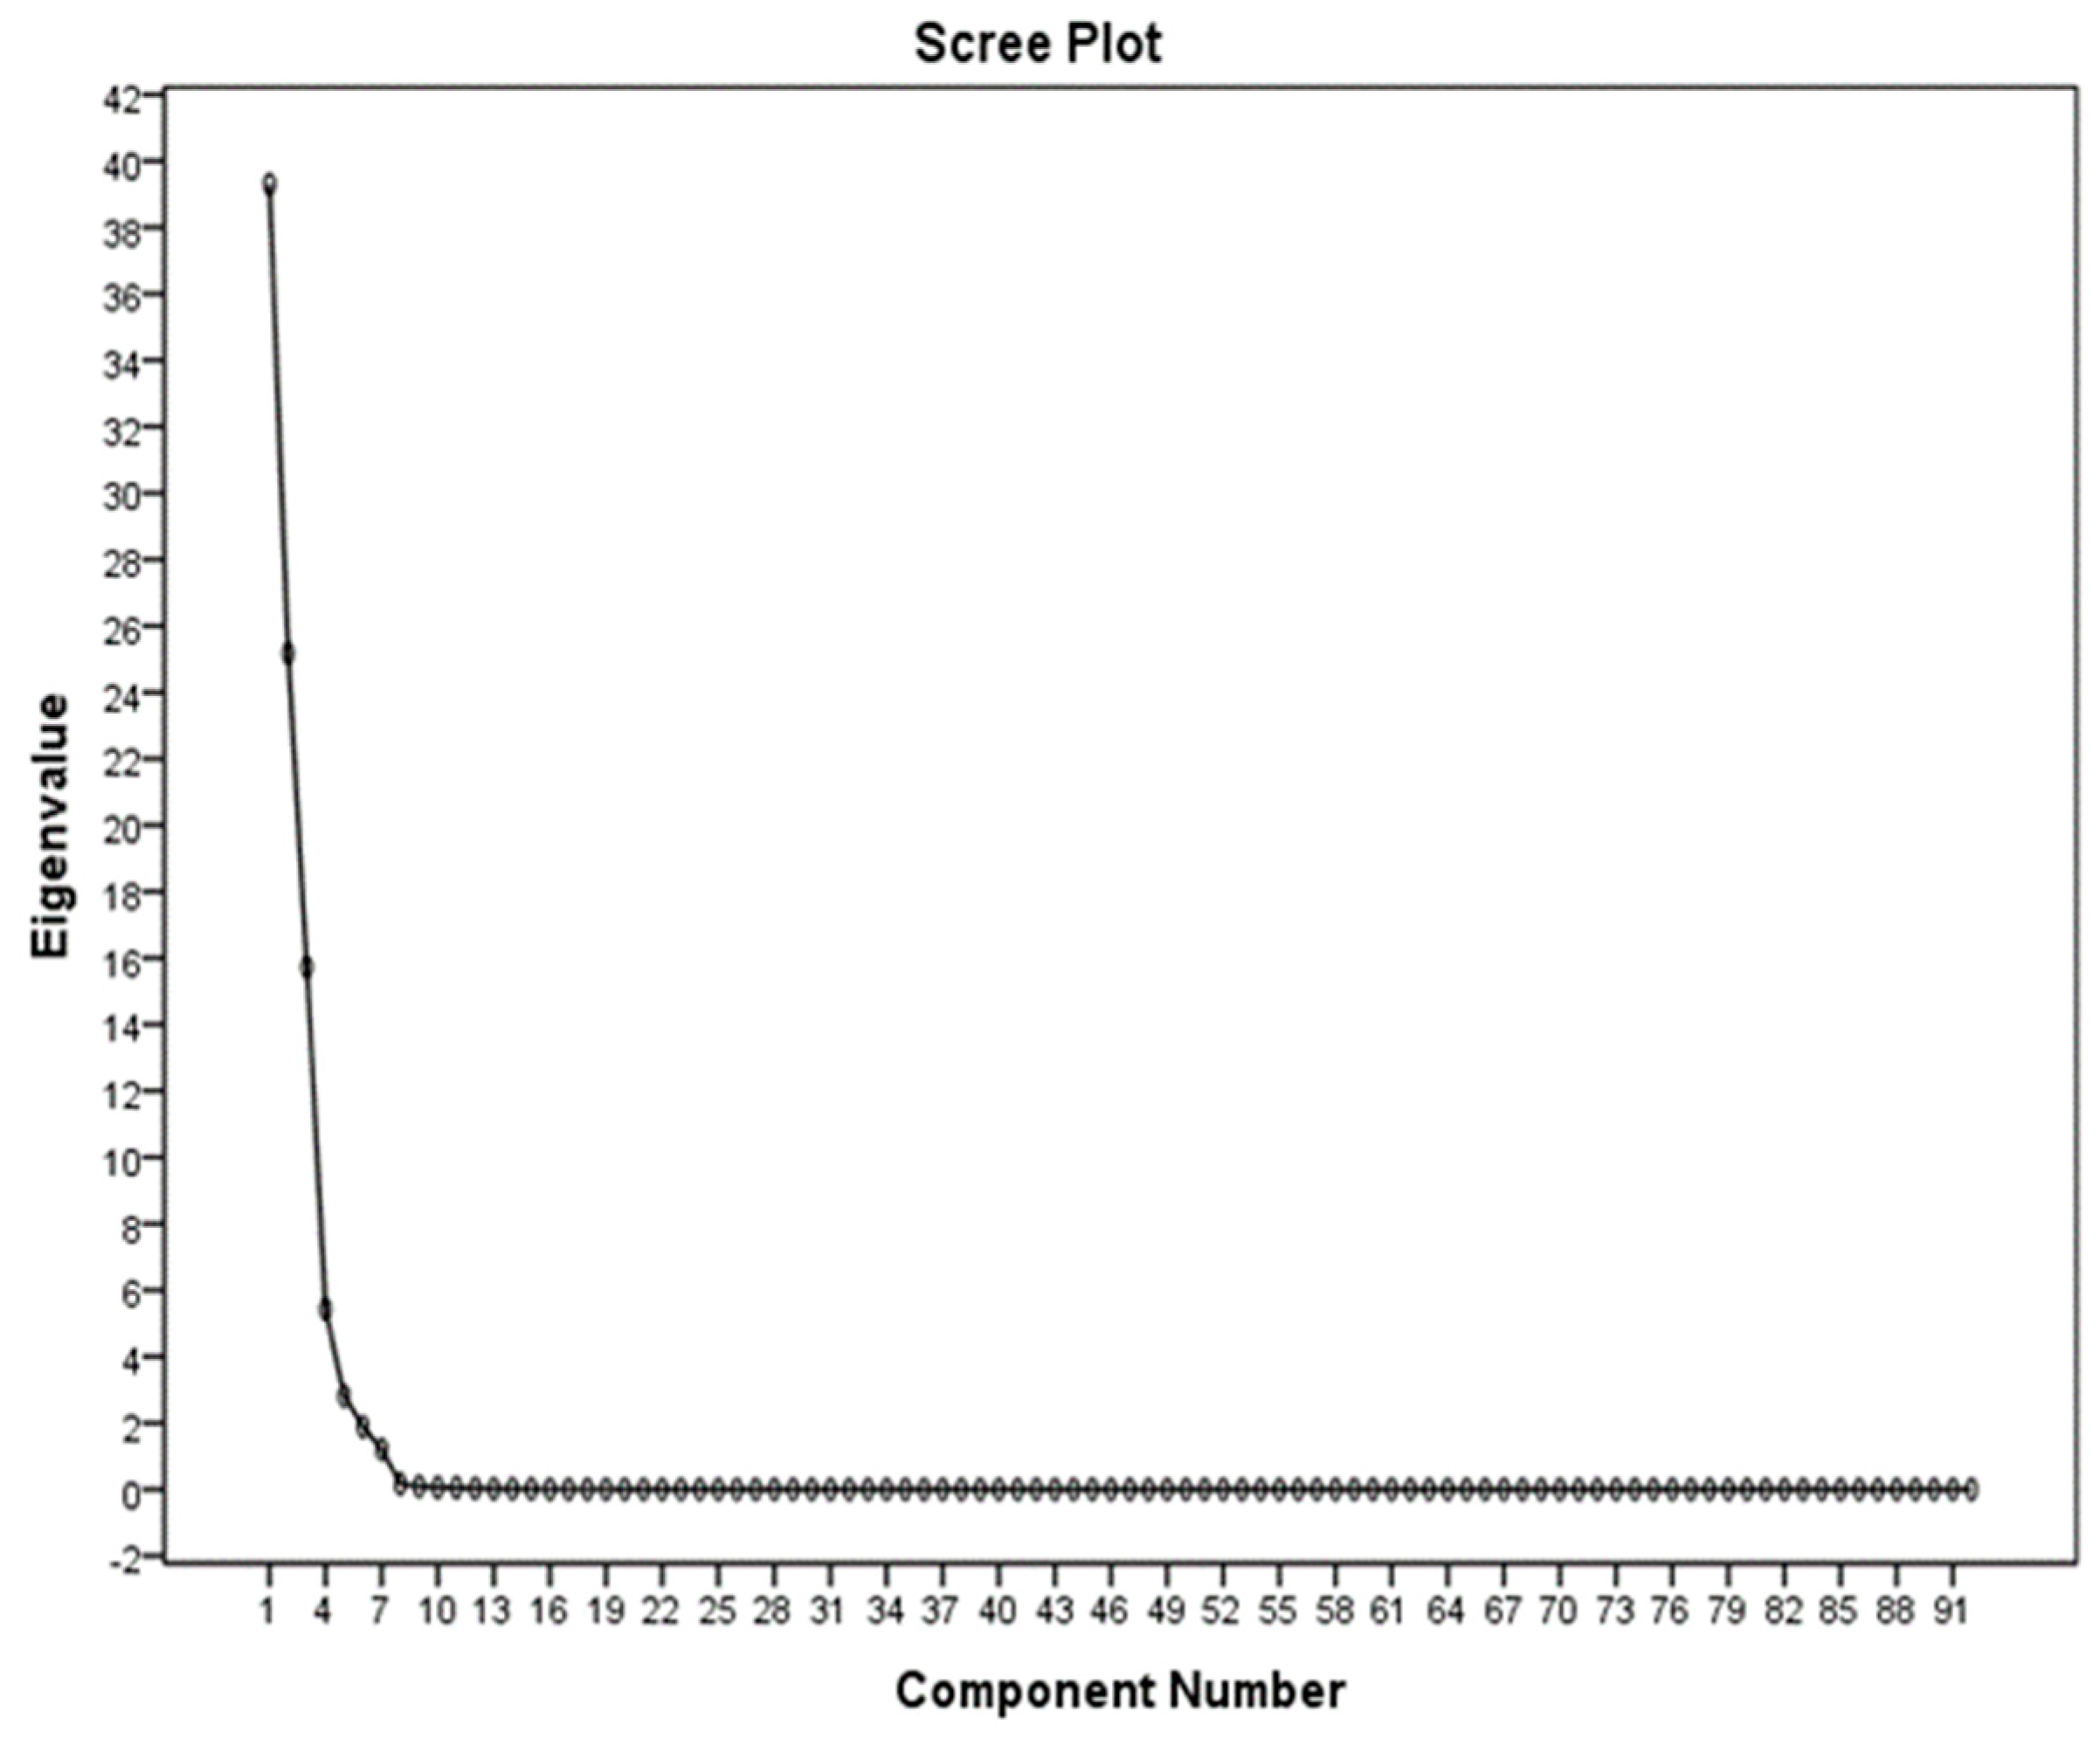
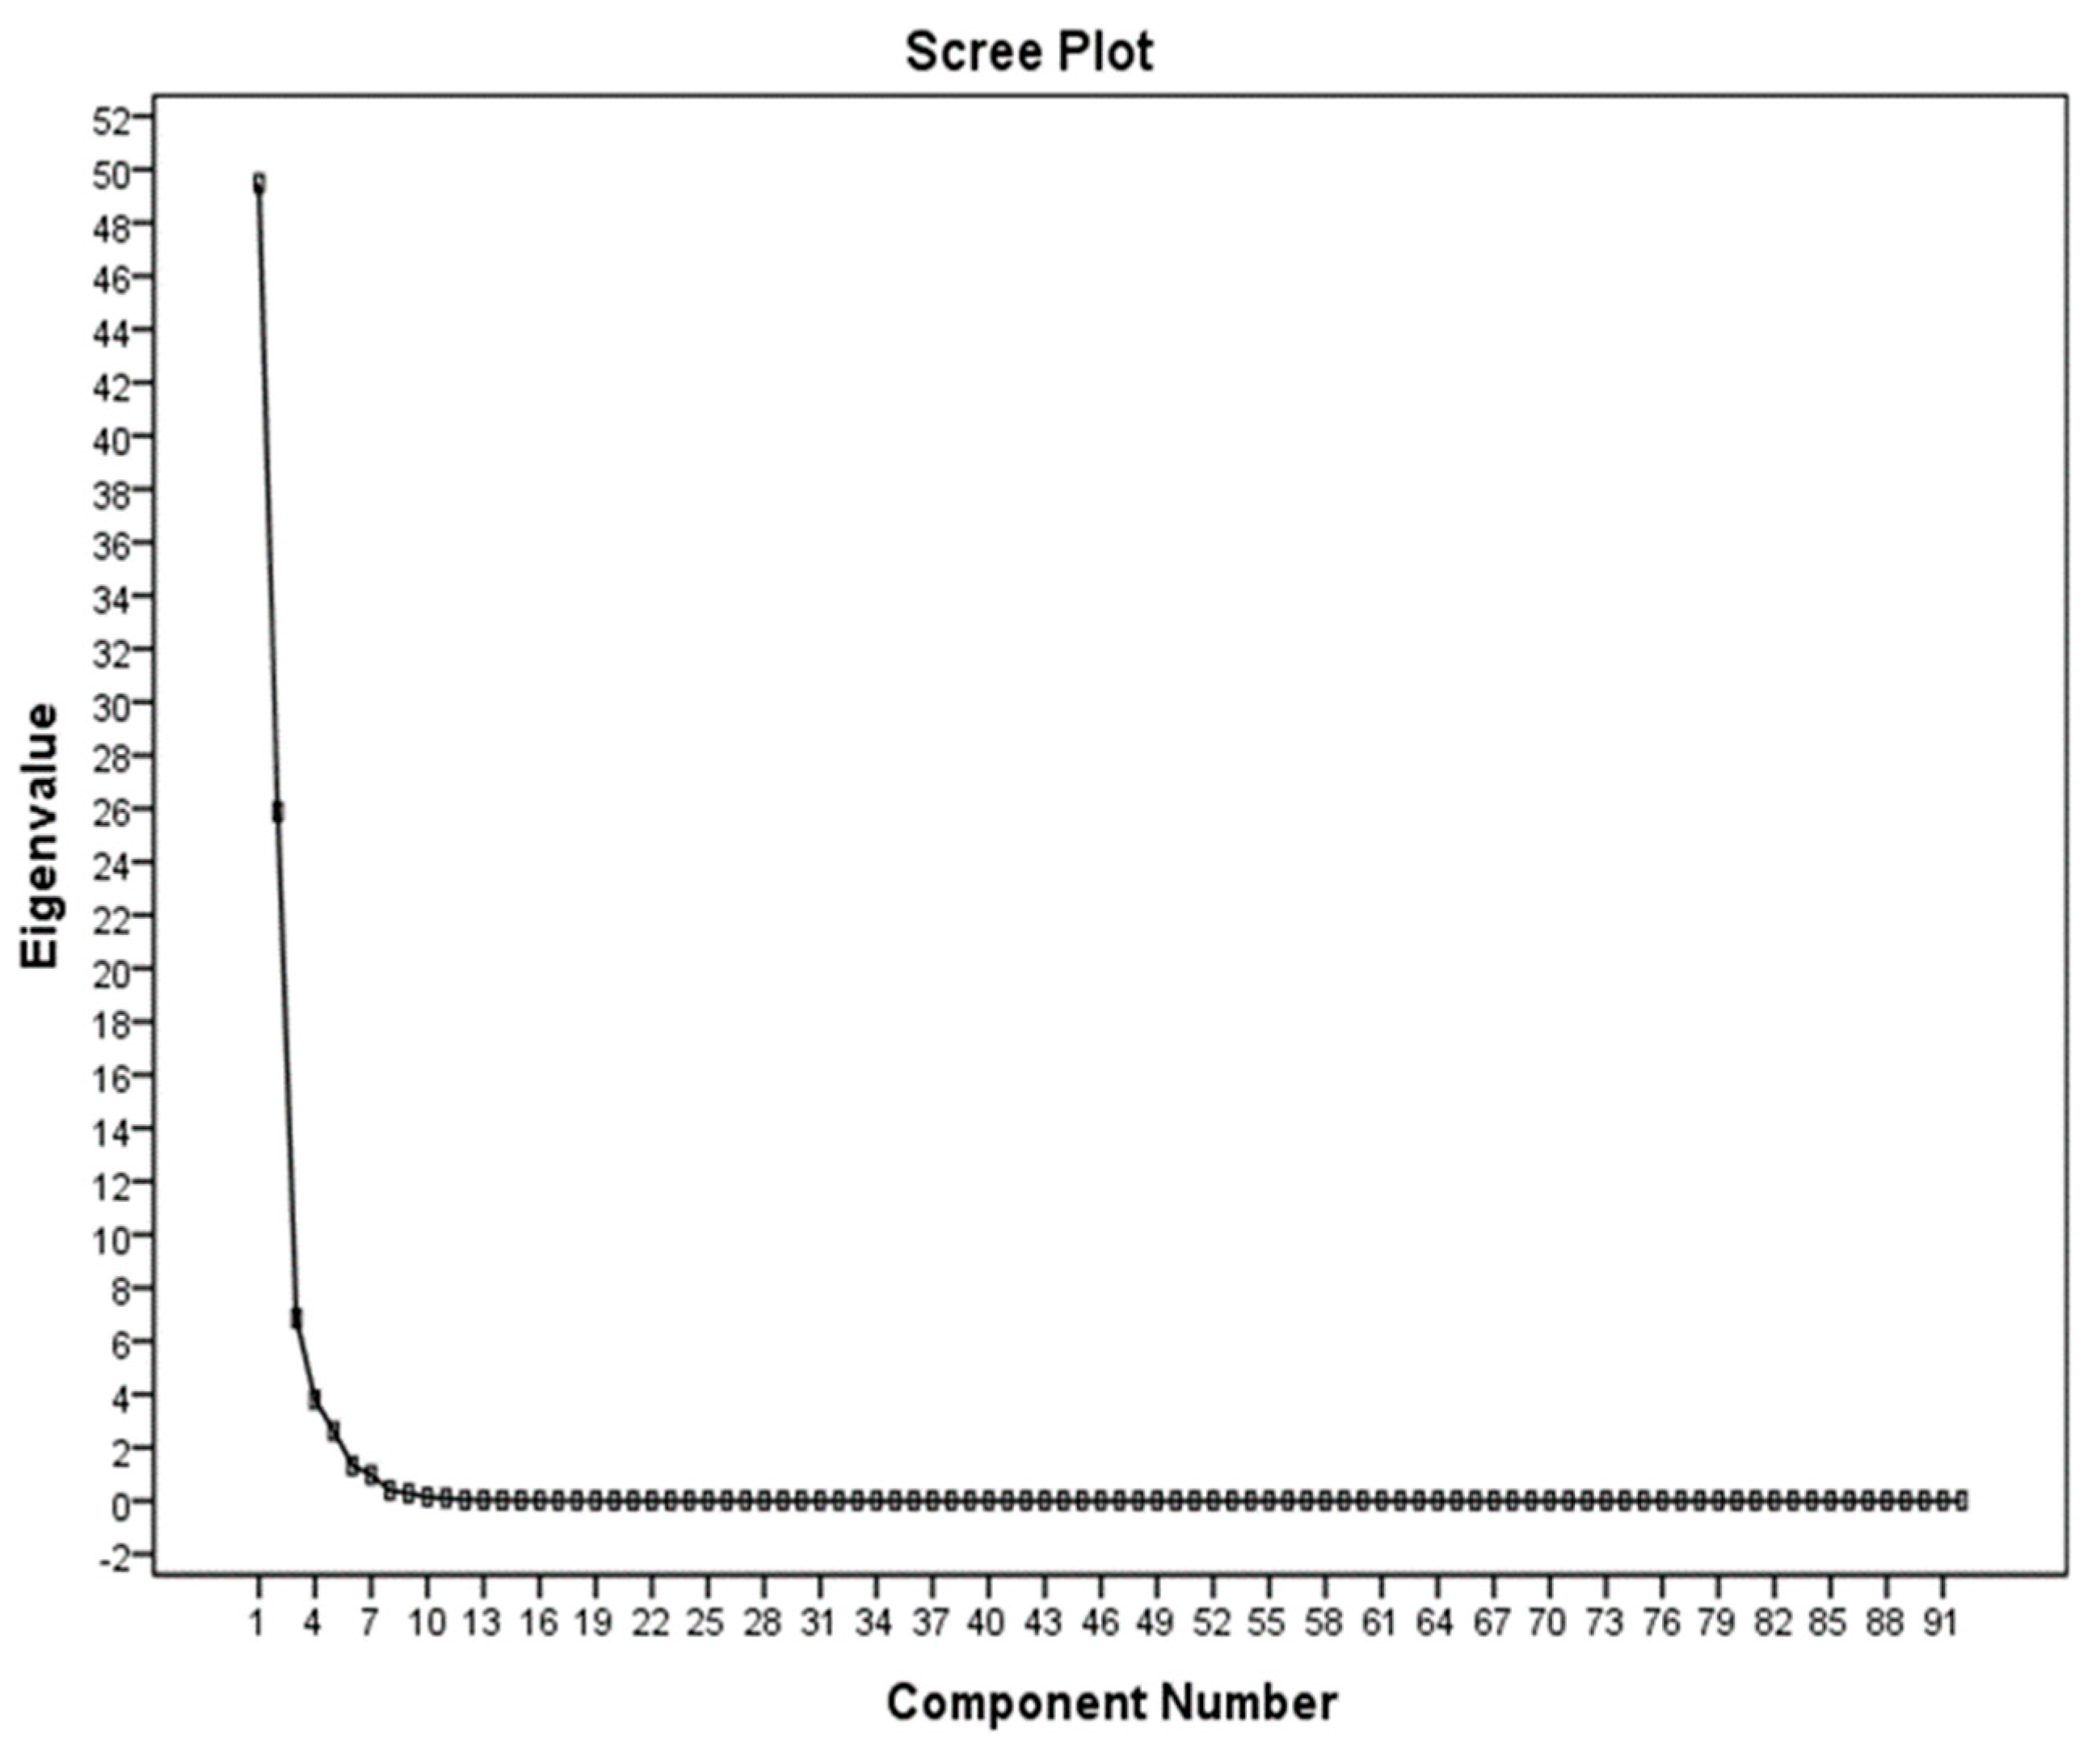
3.3. Application of the PCA Method in the Selection of Effective Properties
3.4. Classification of Various Rice Cultivars
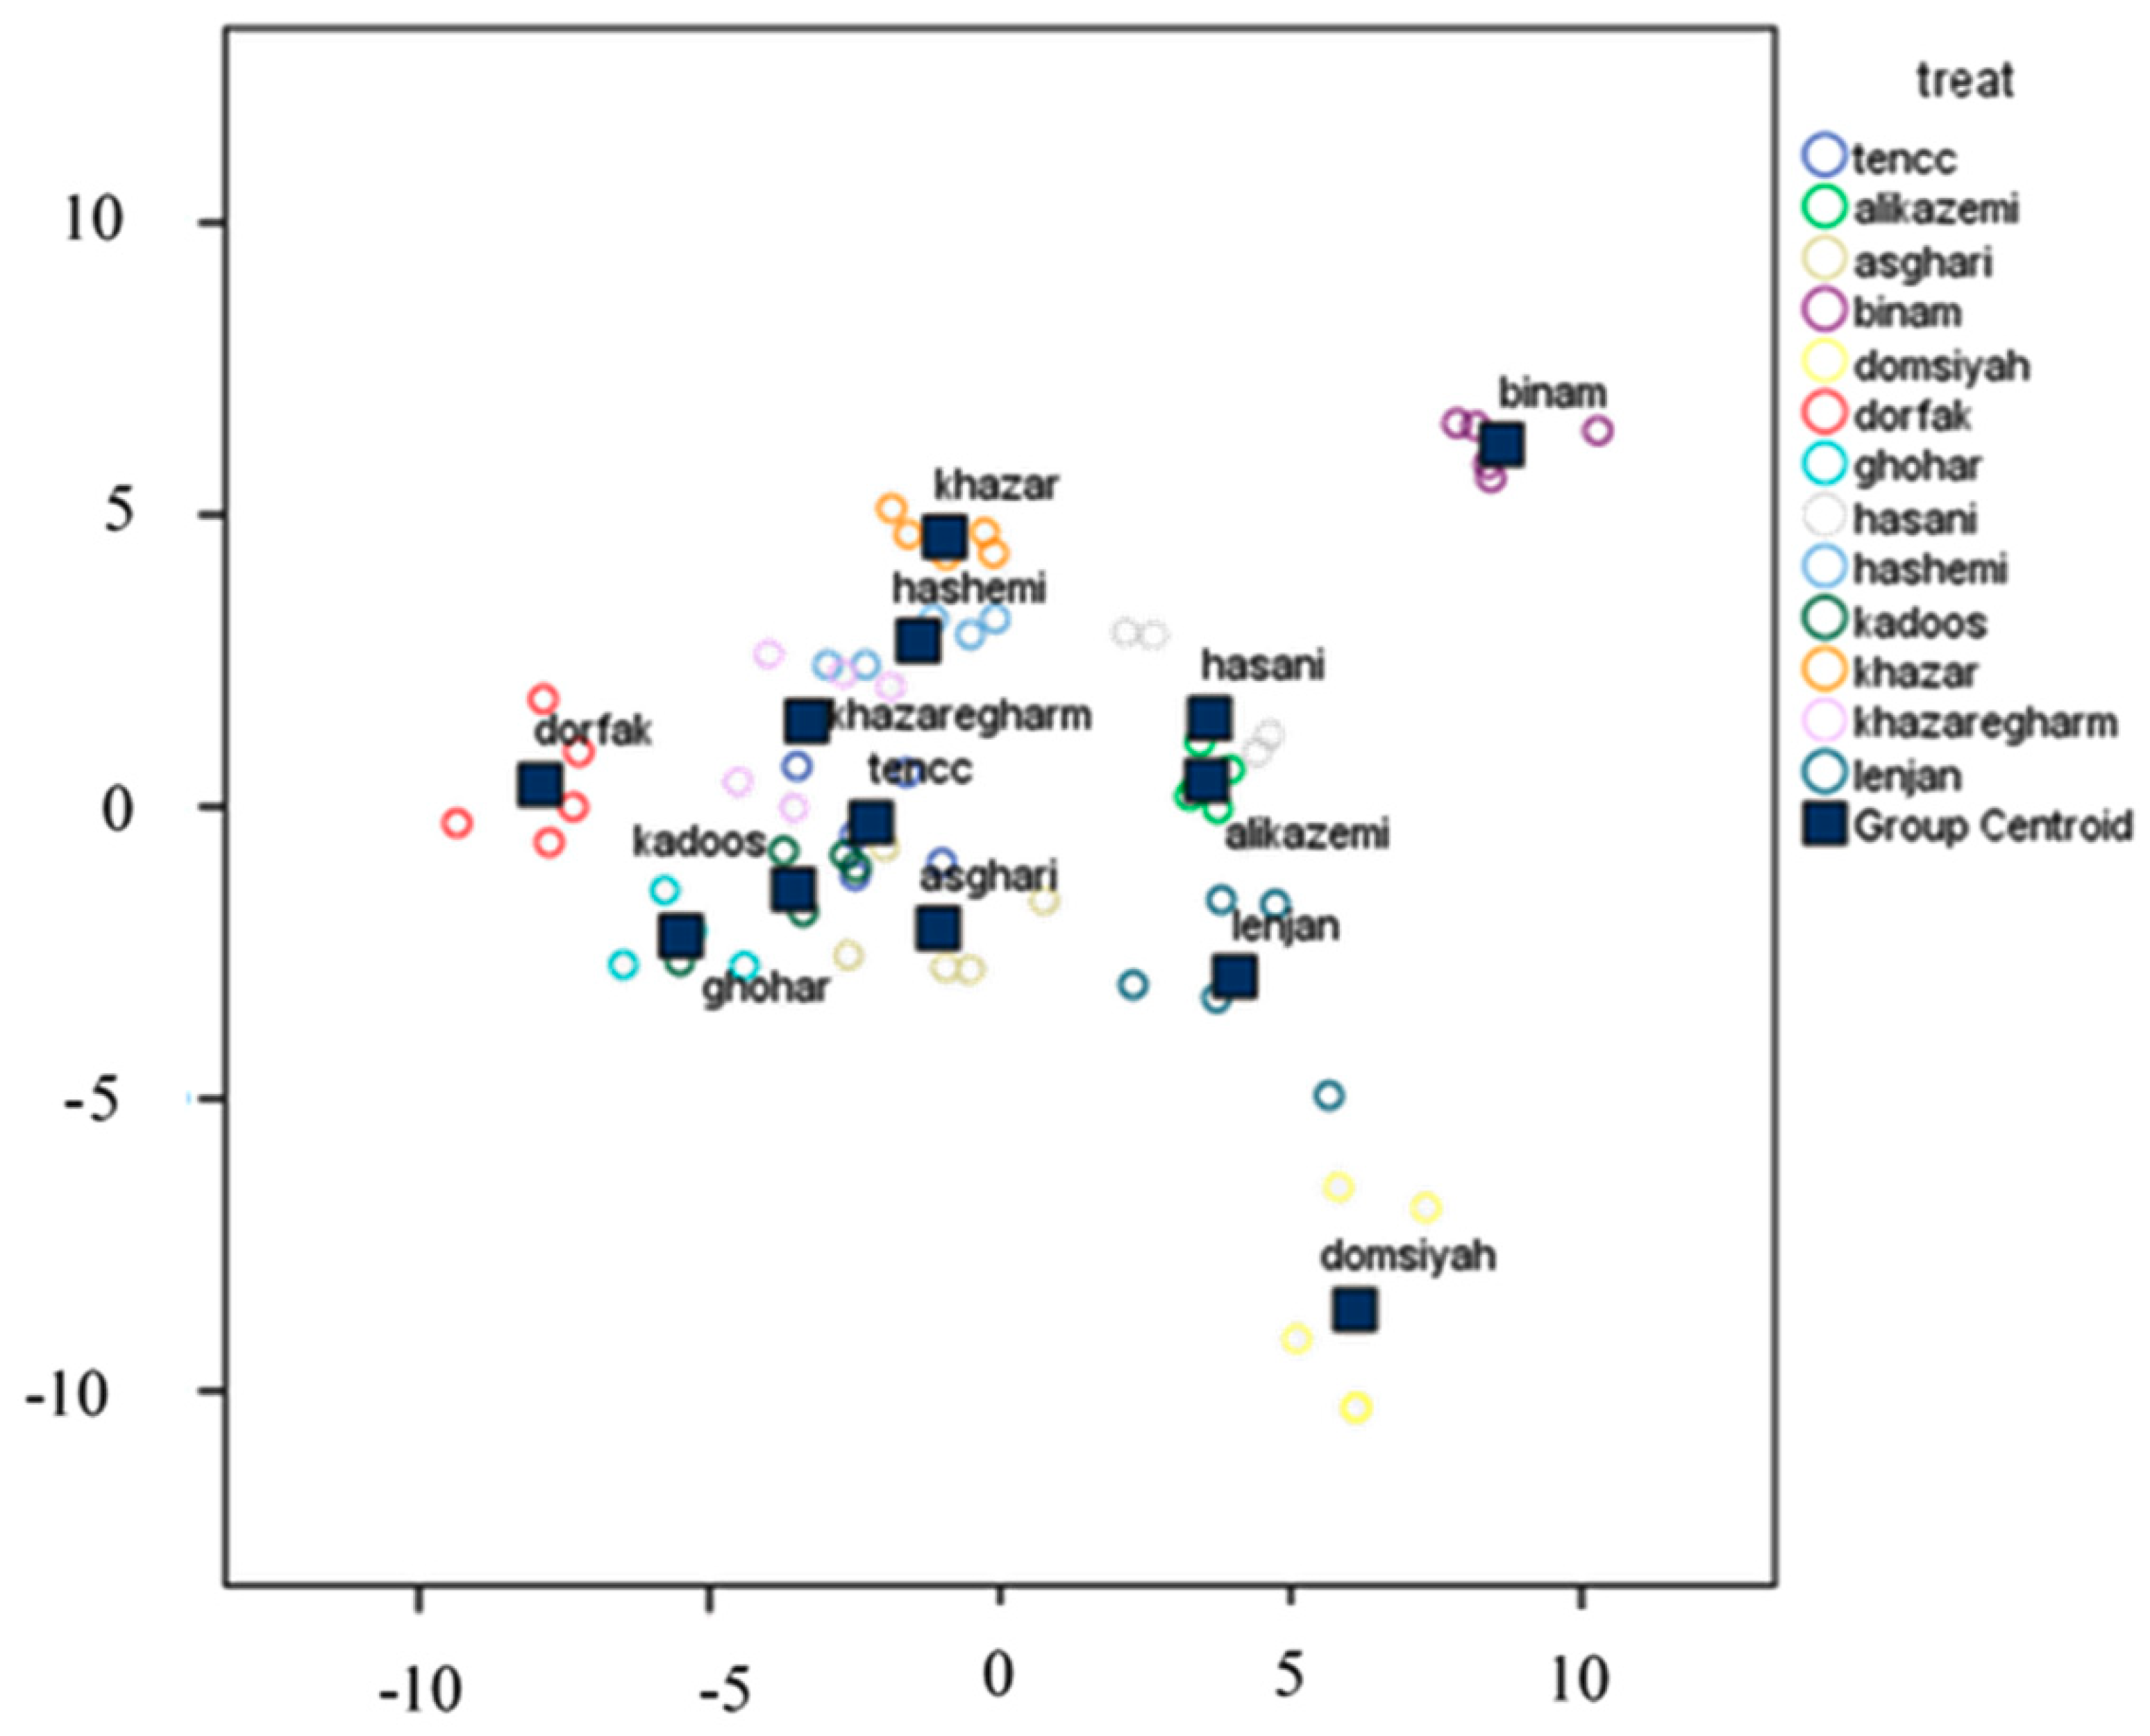
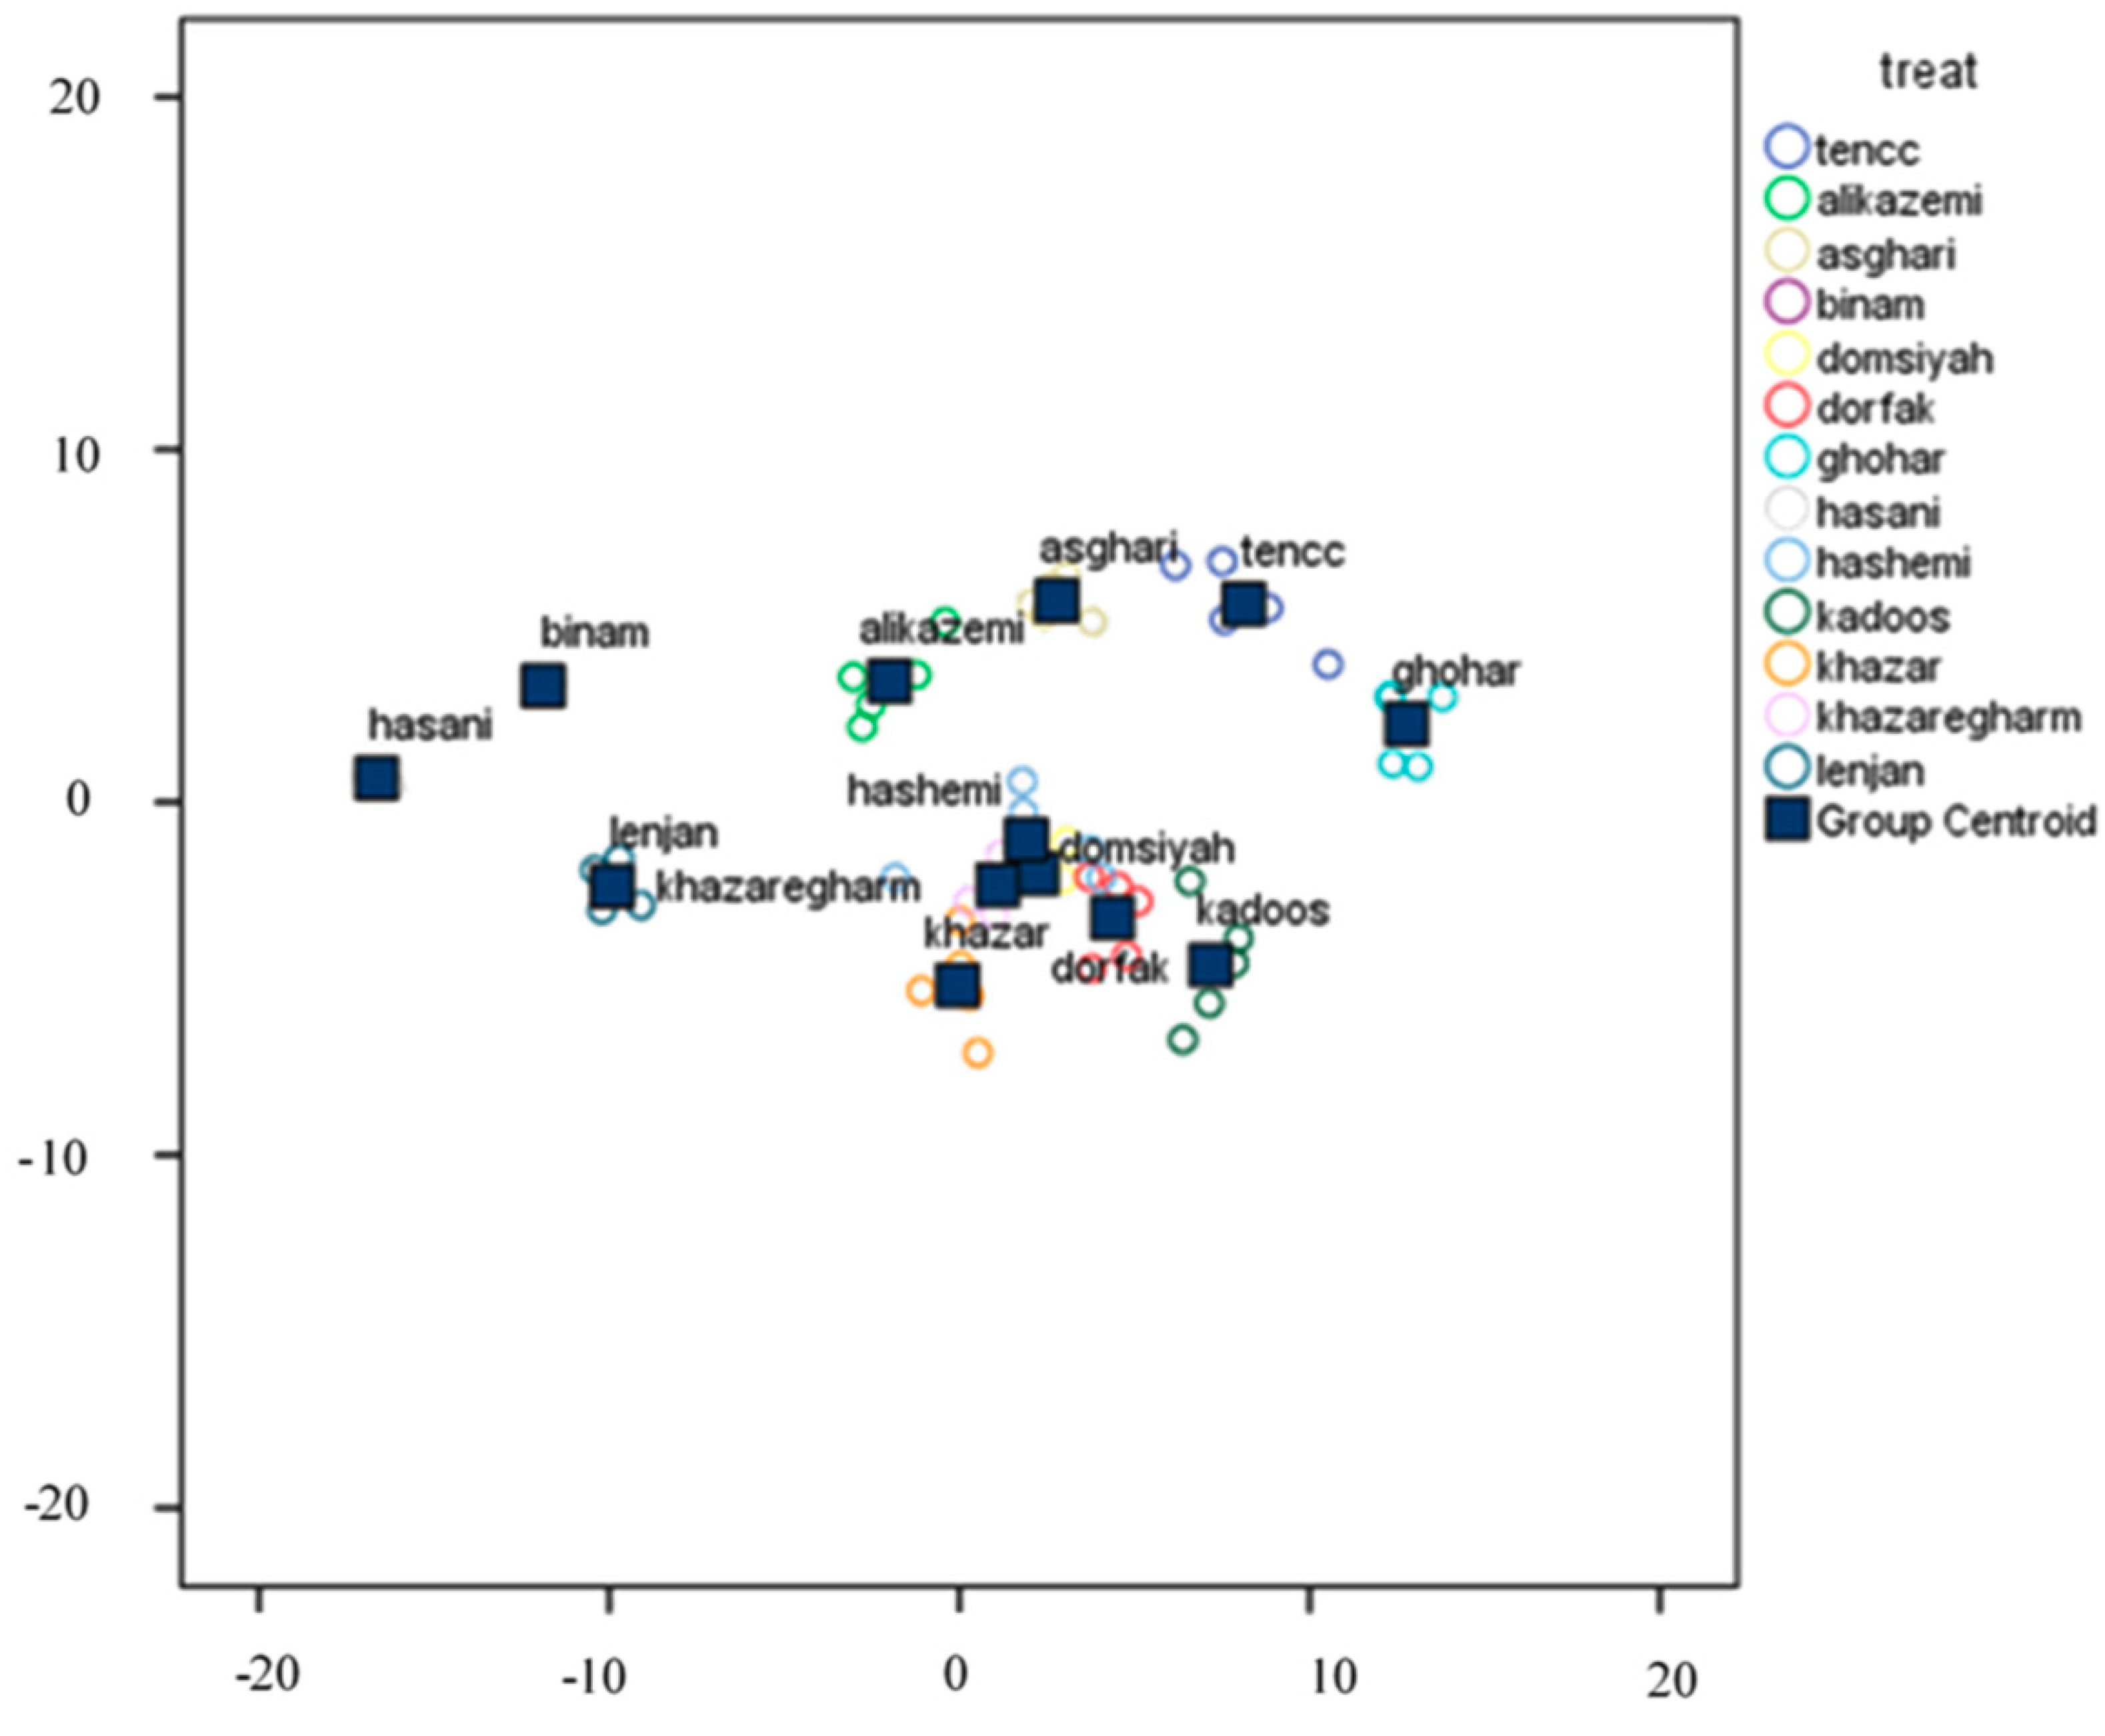
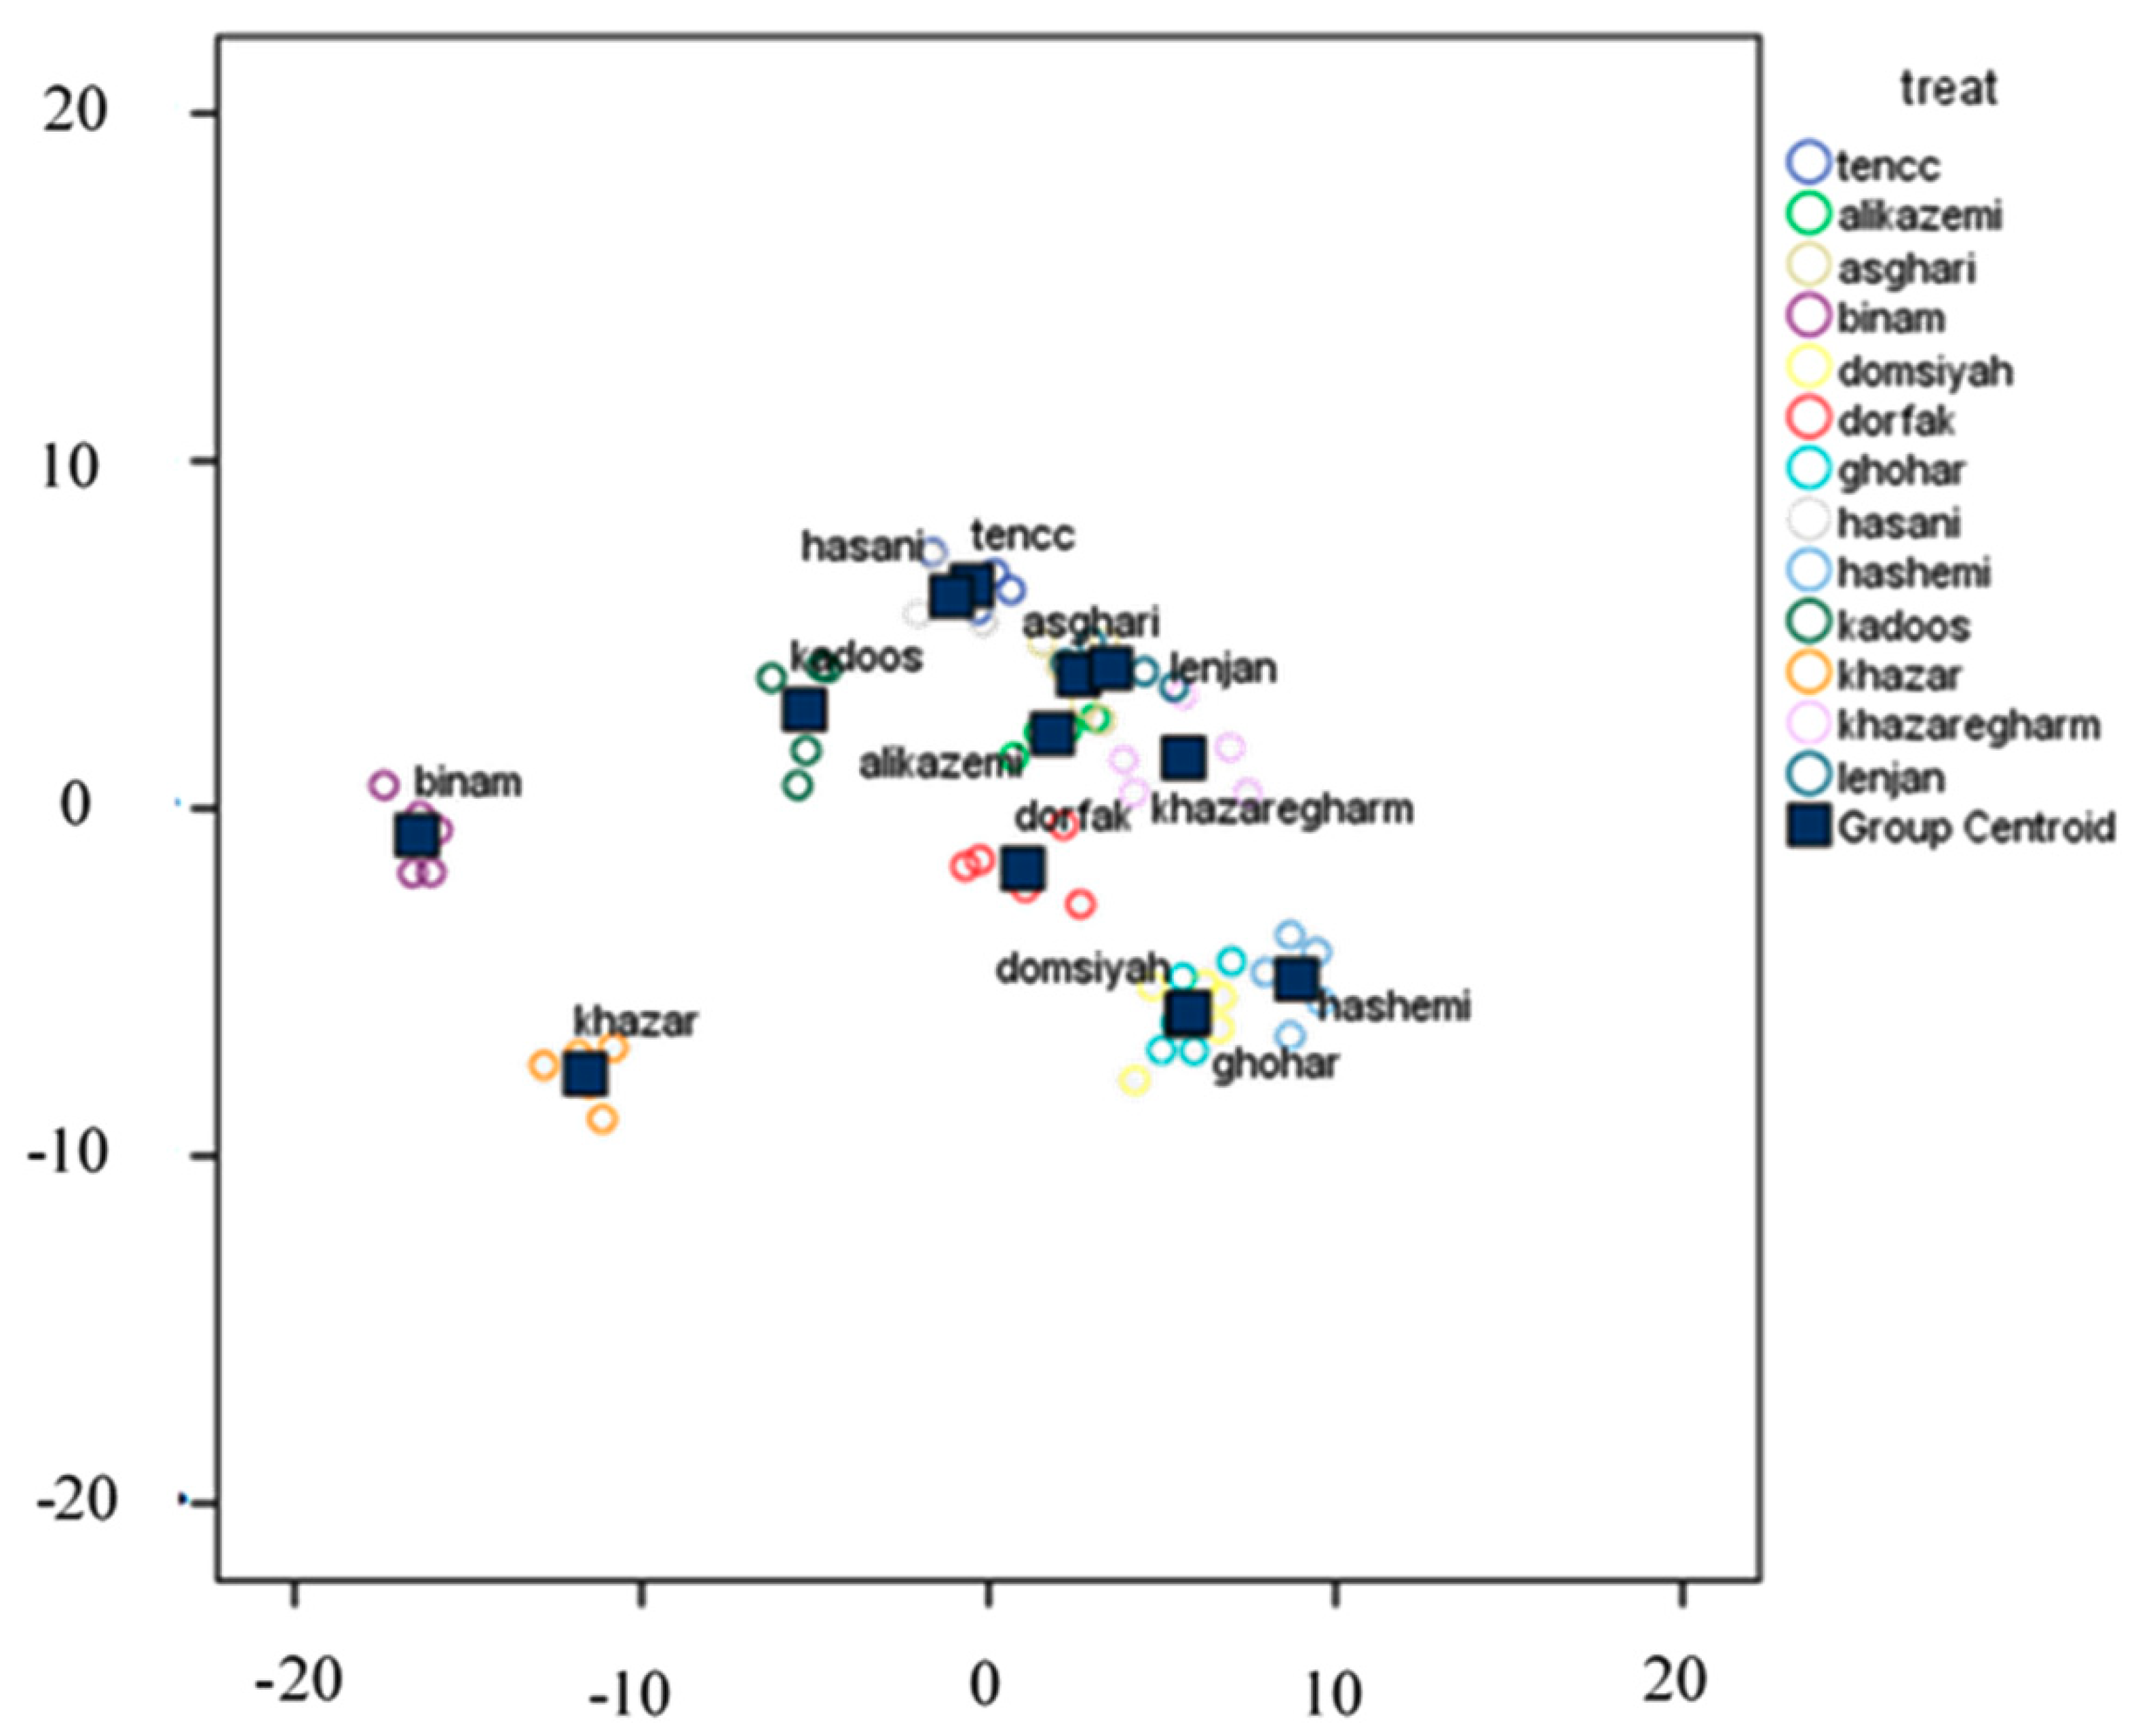
3.4.1. Classification Using Linear DA
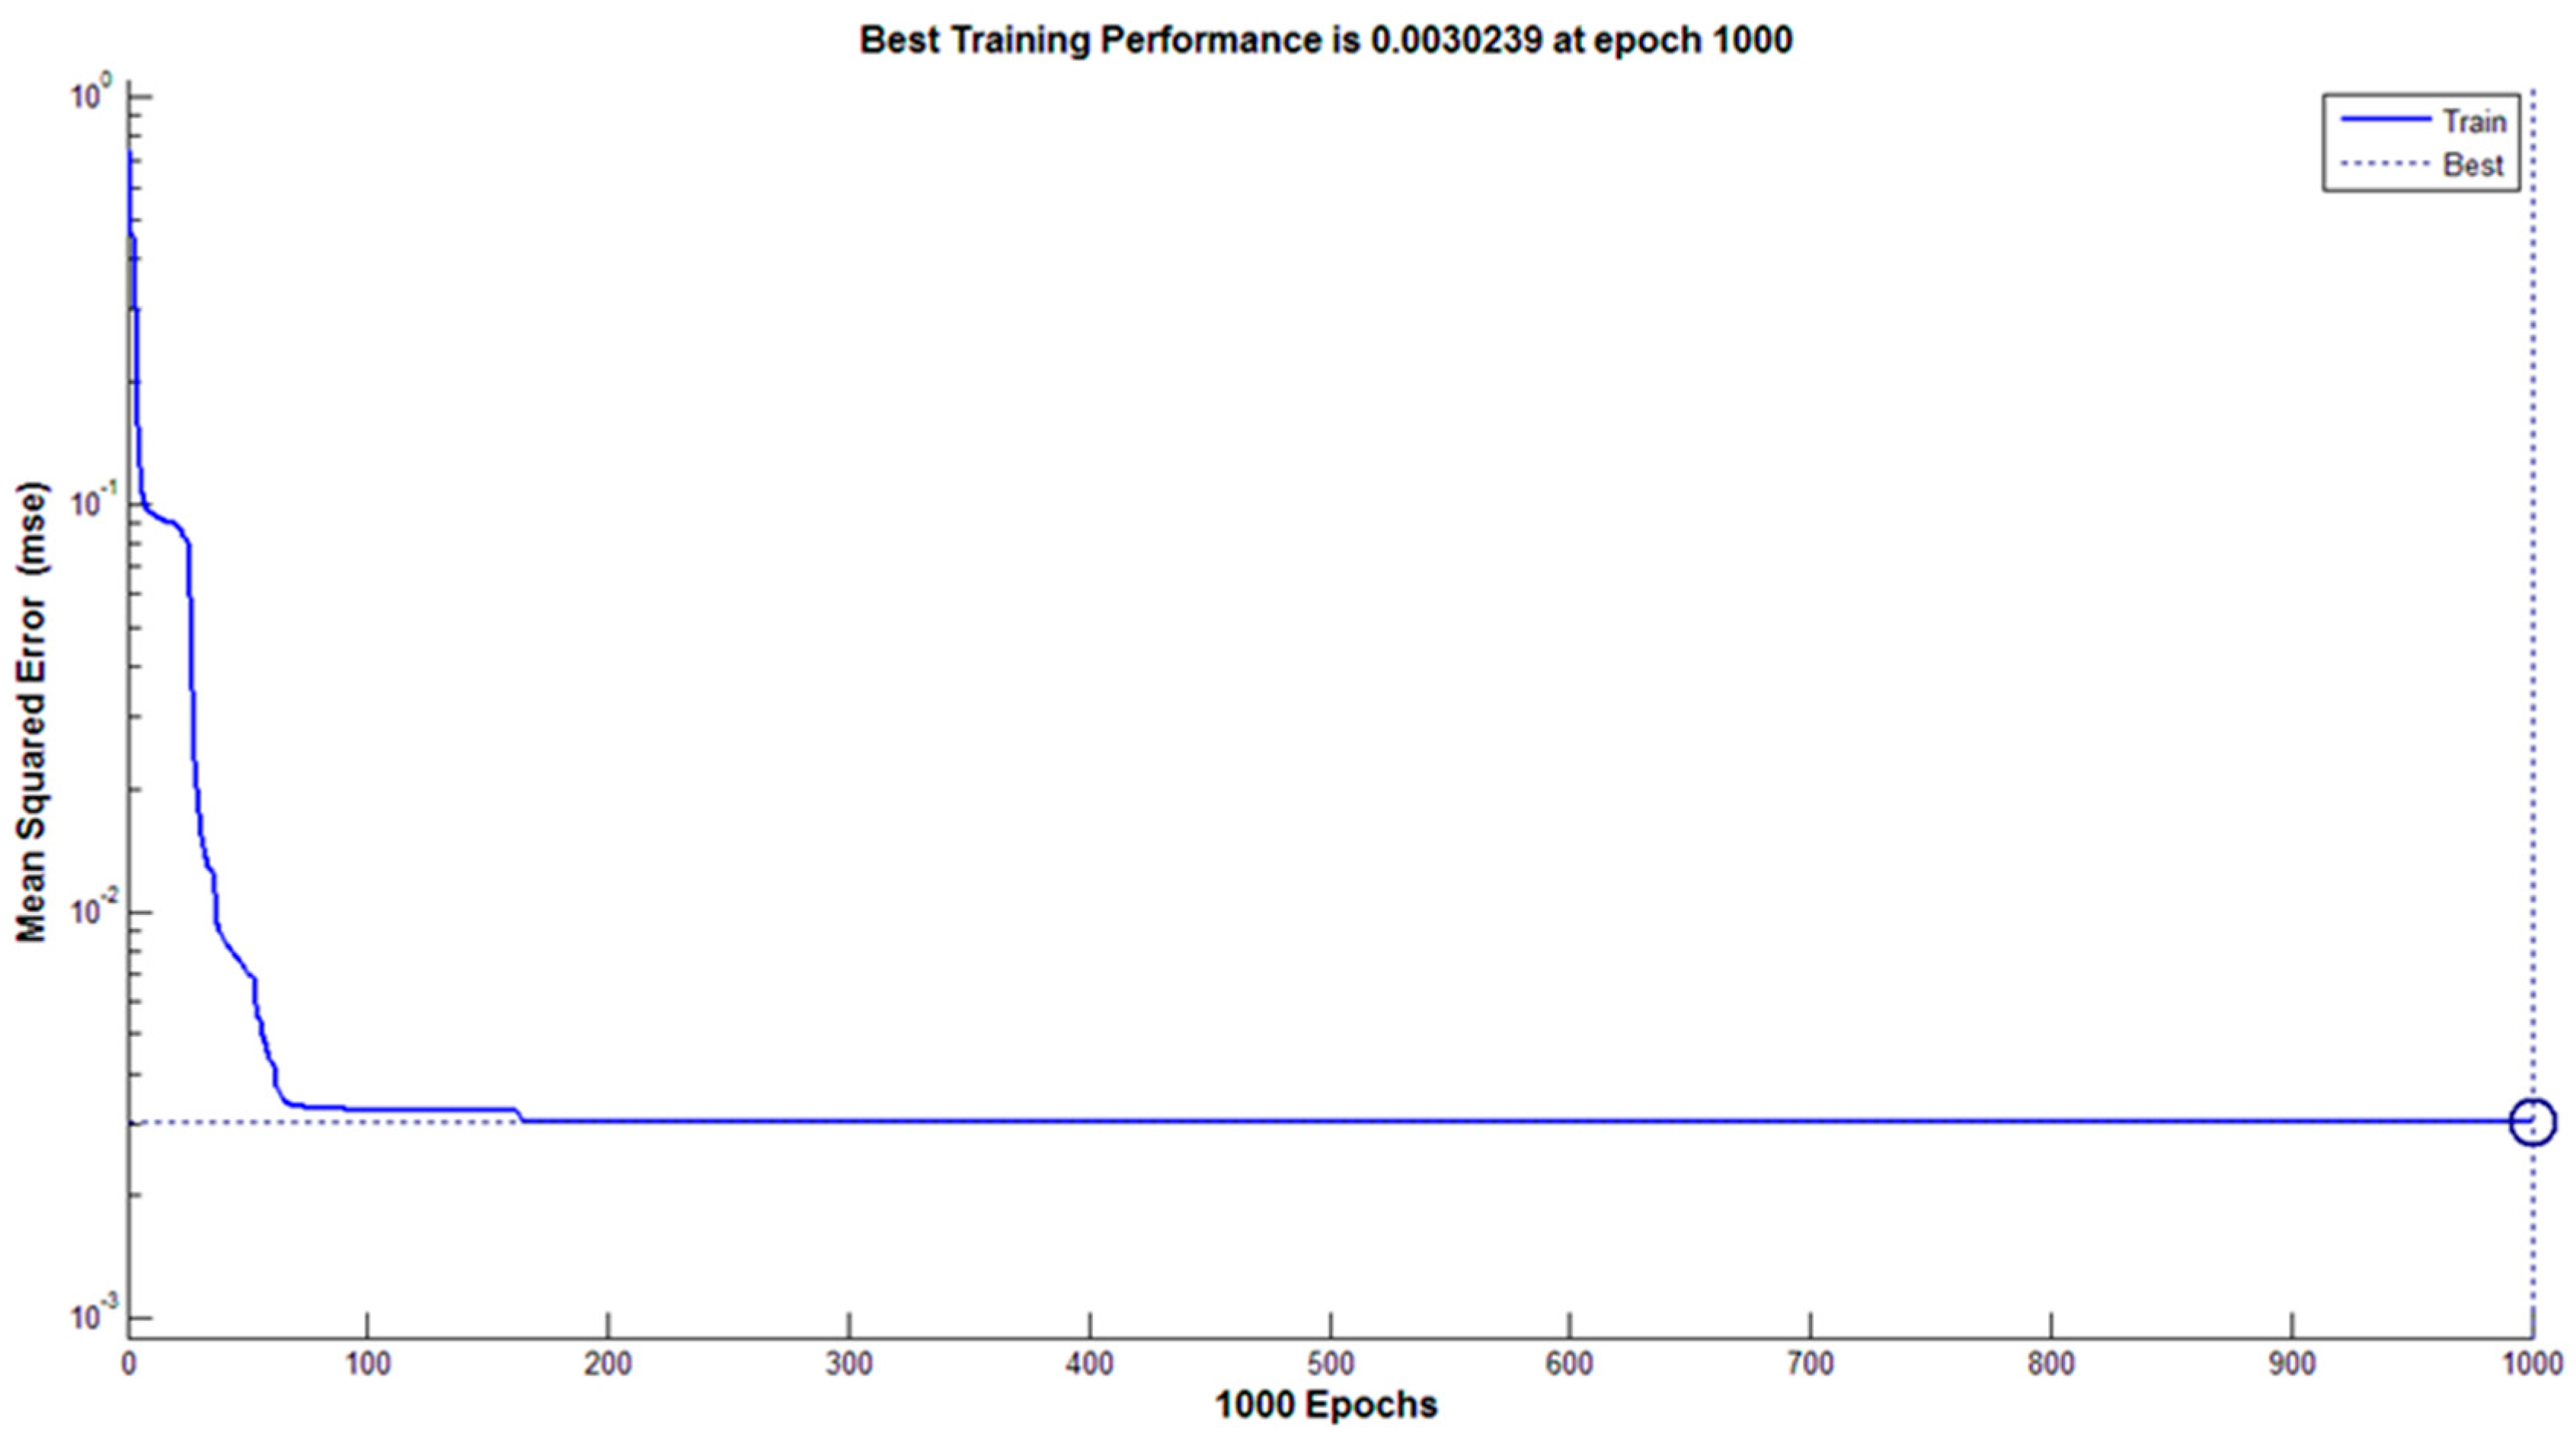
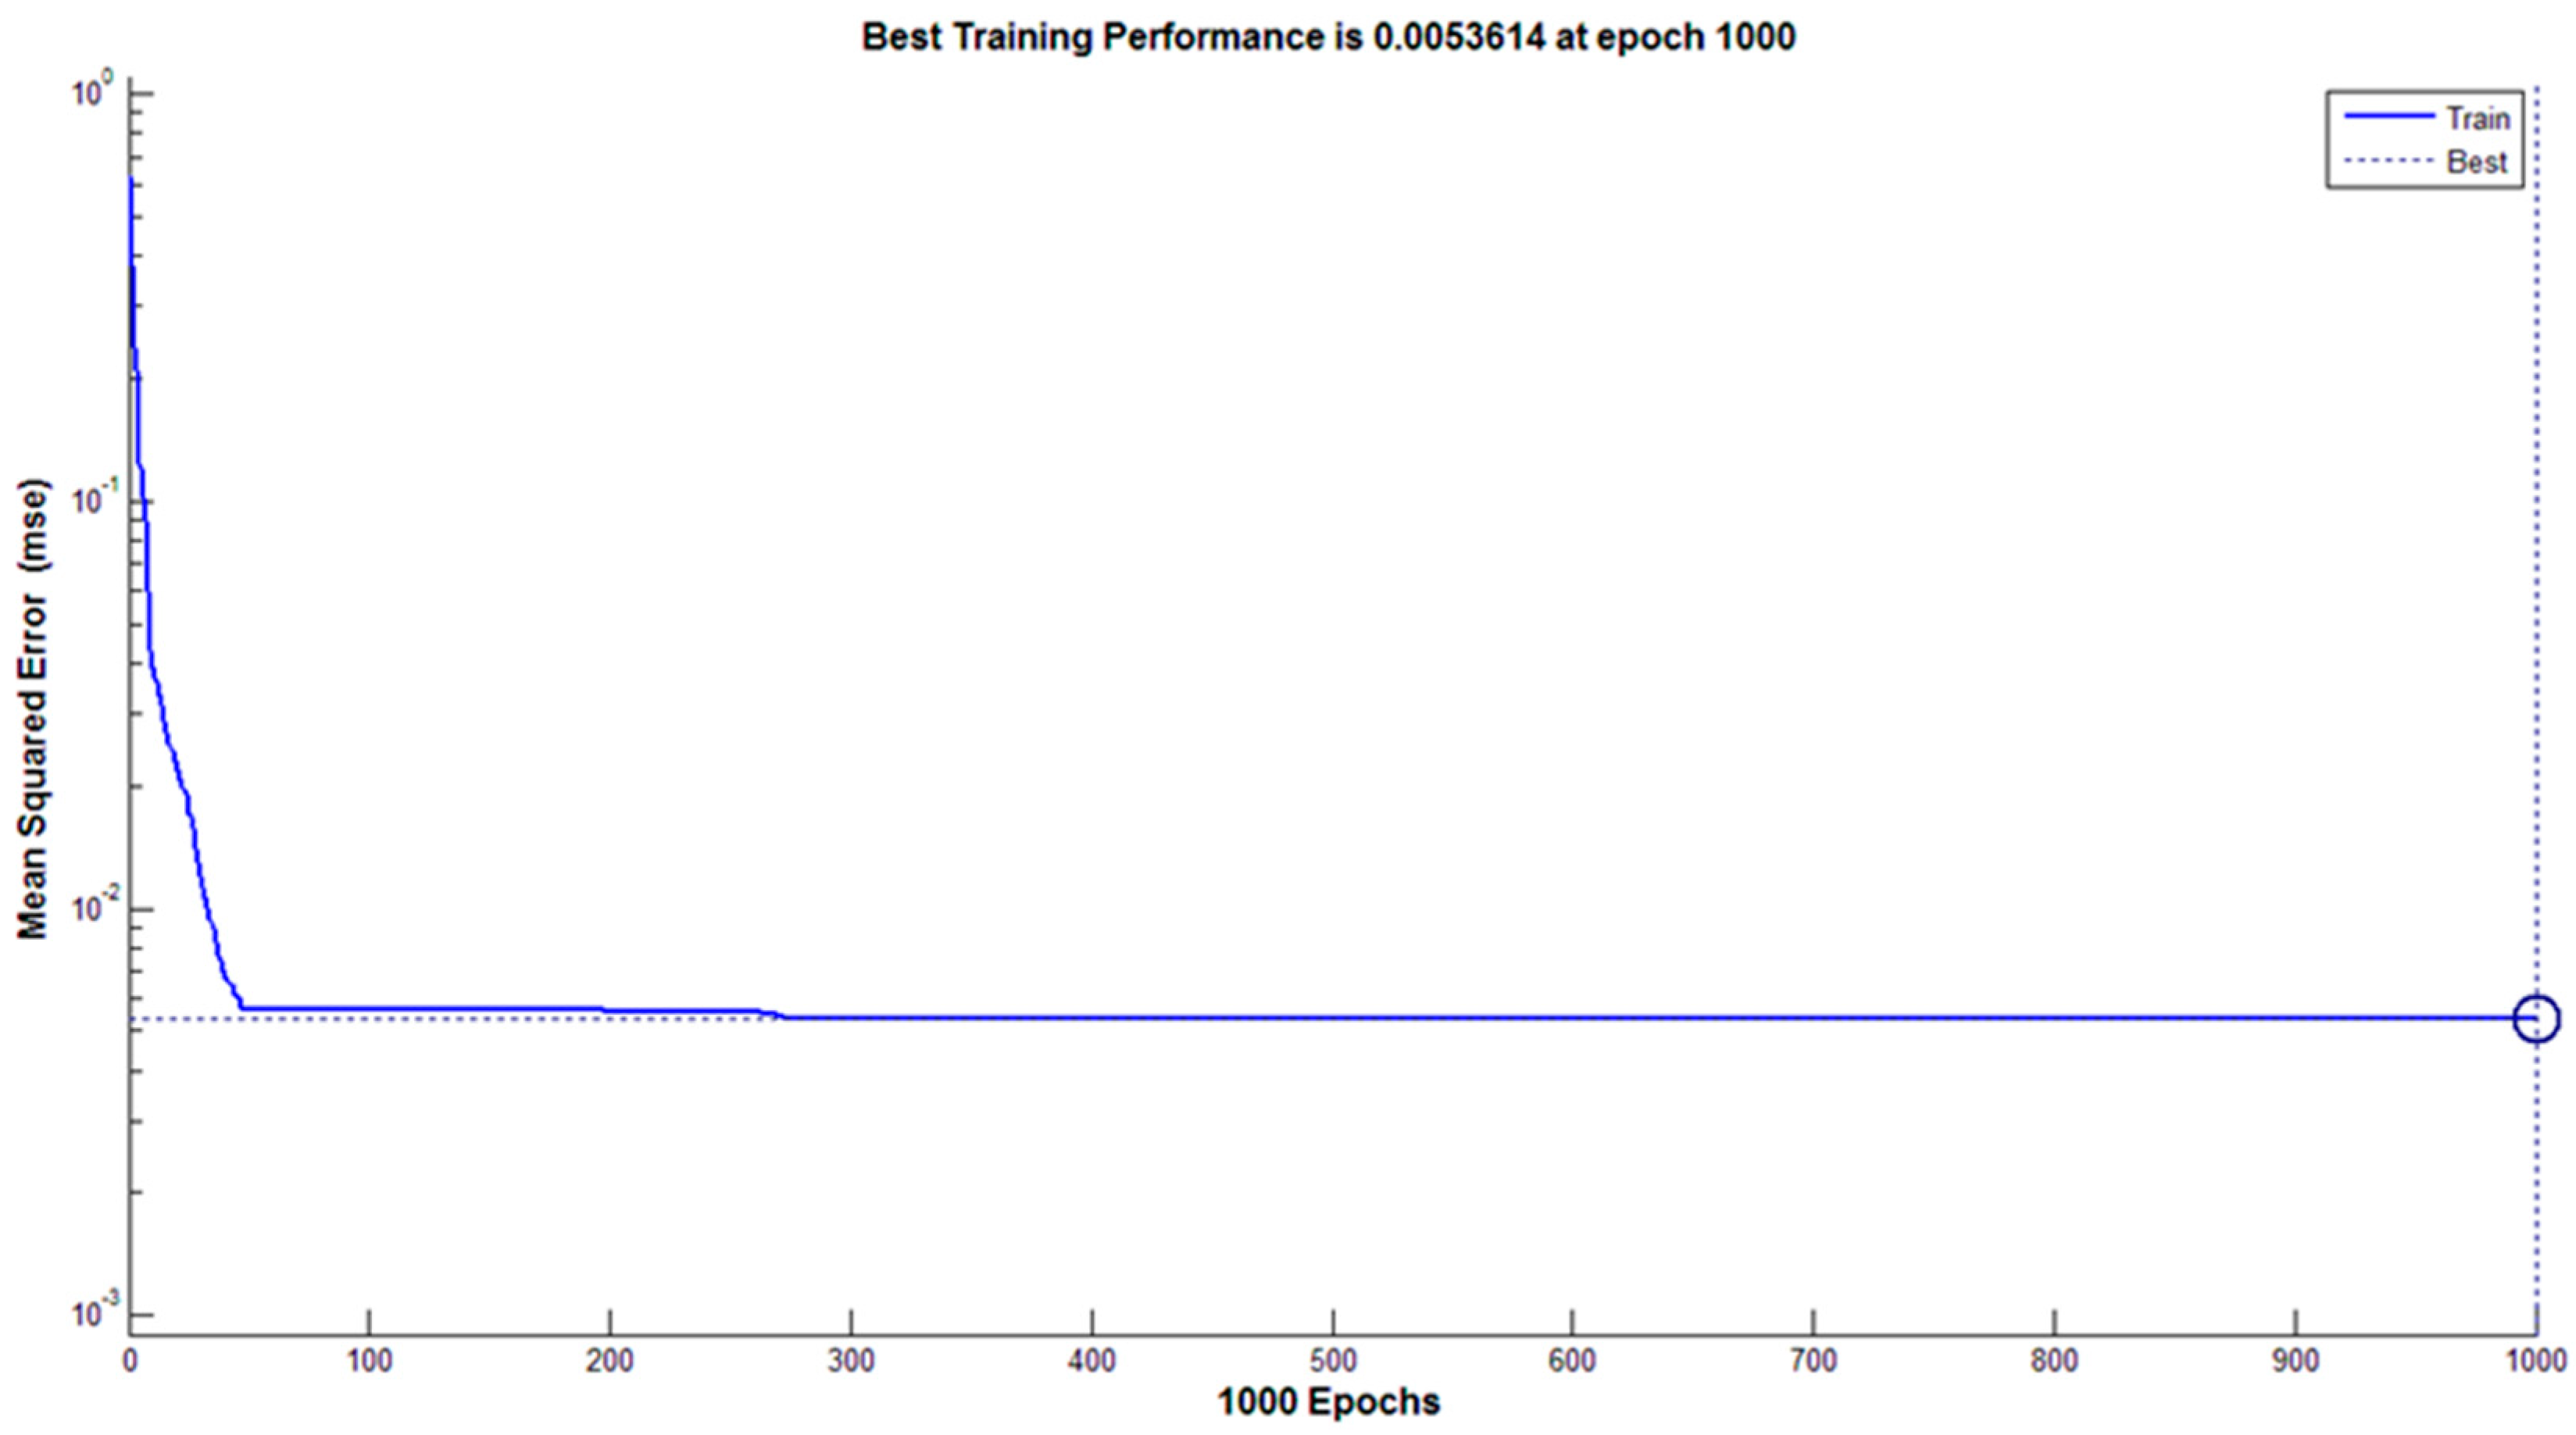
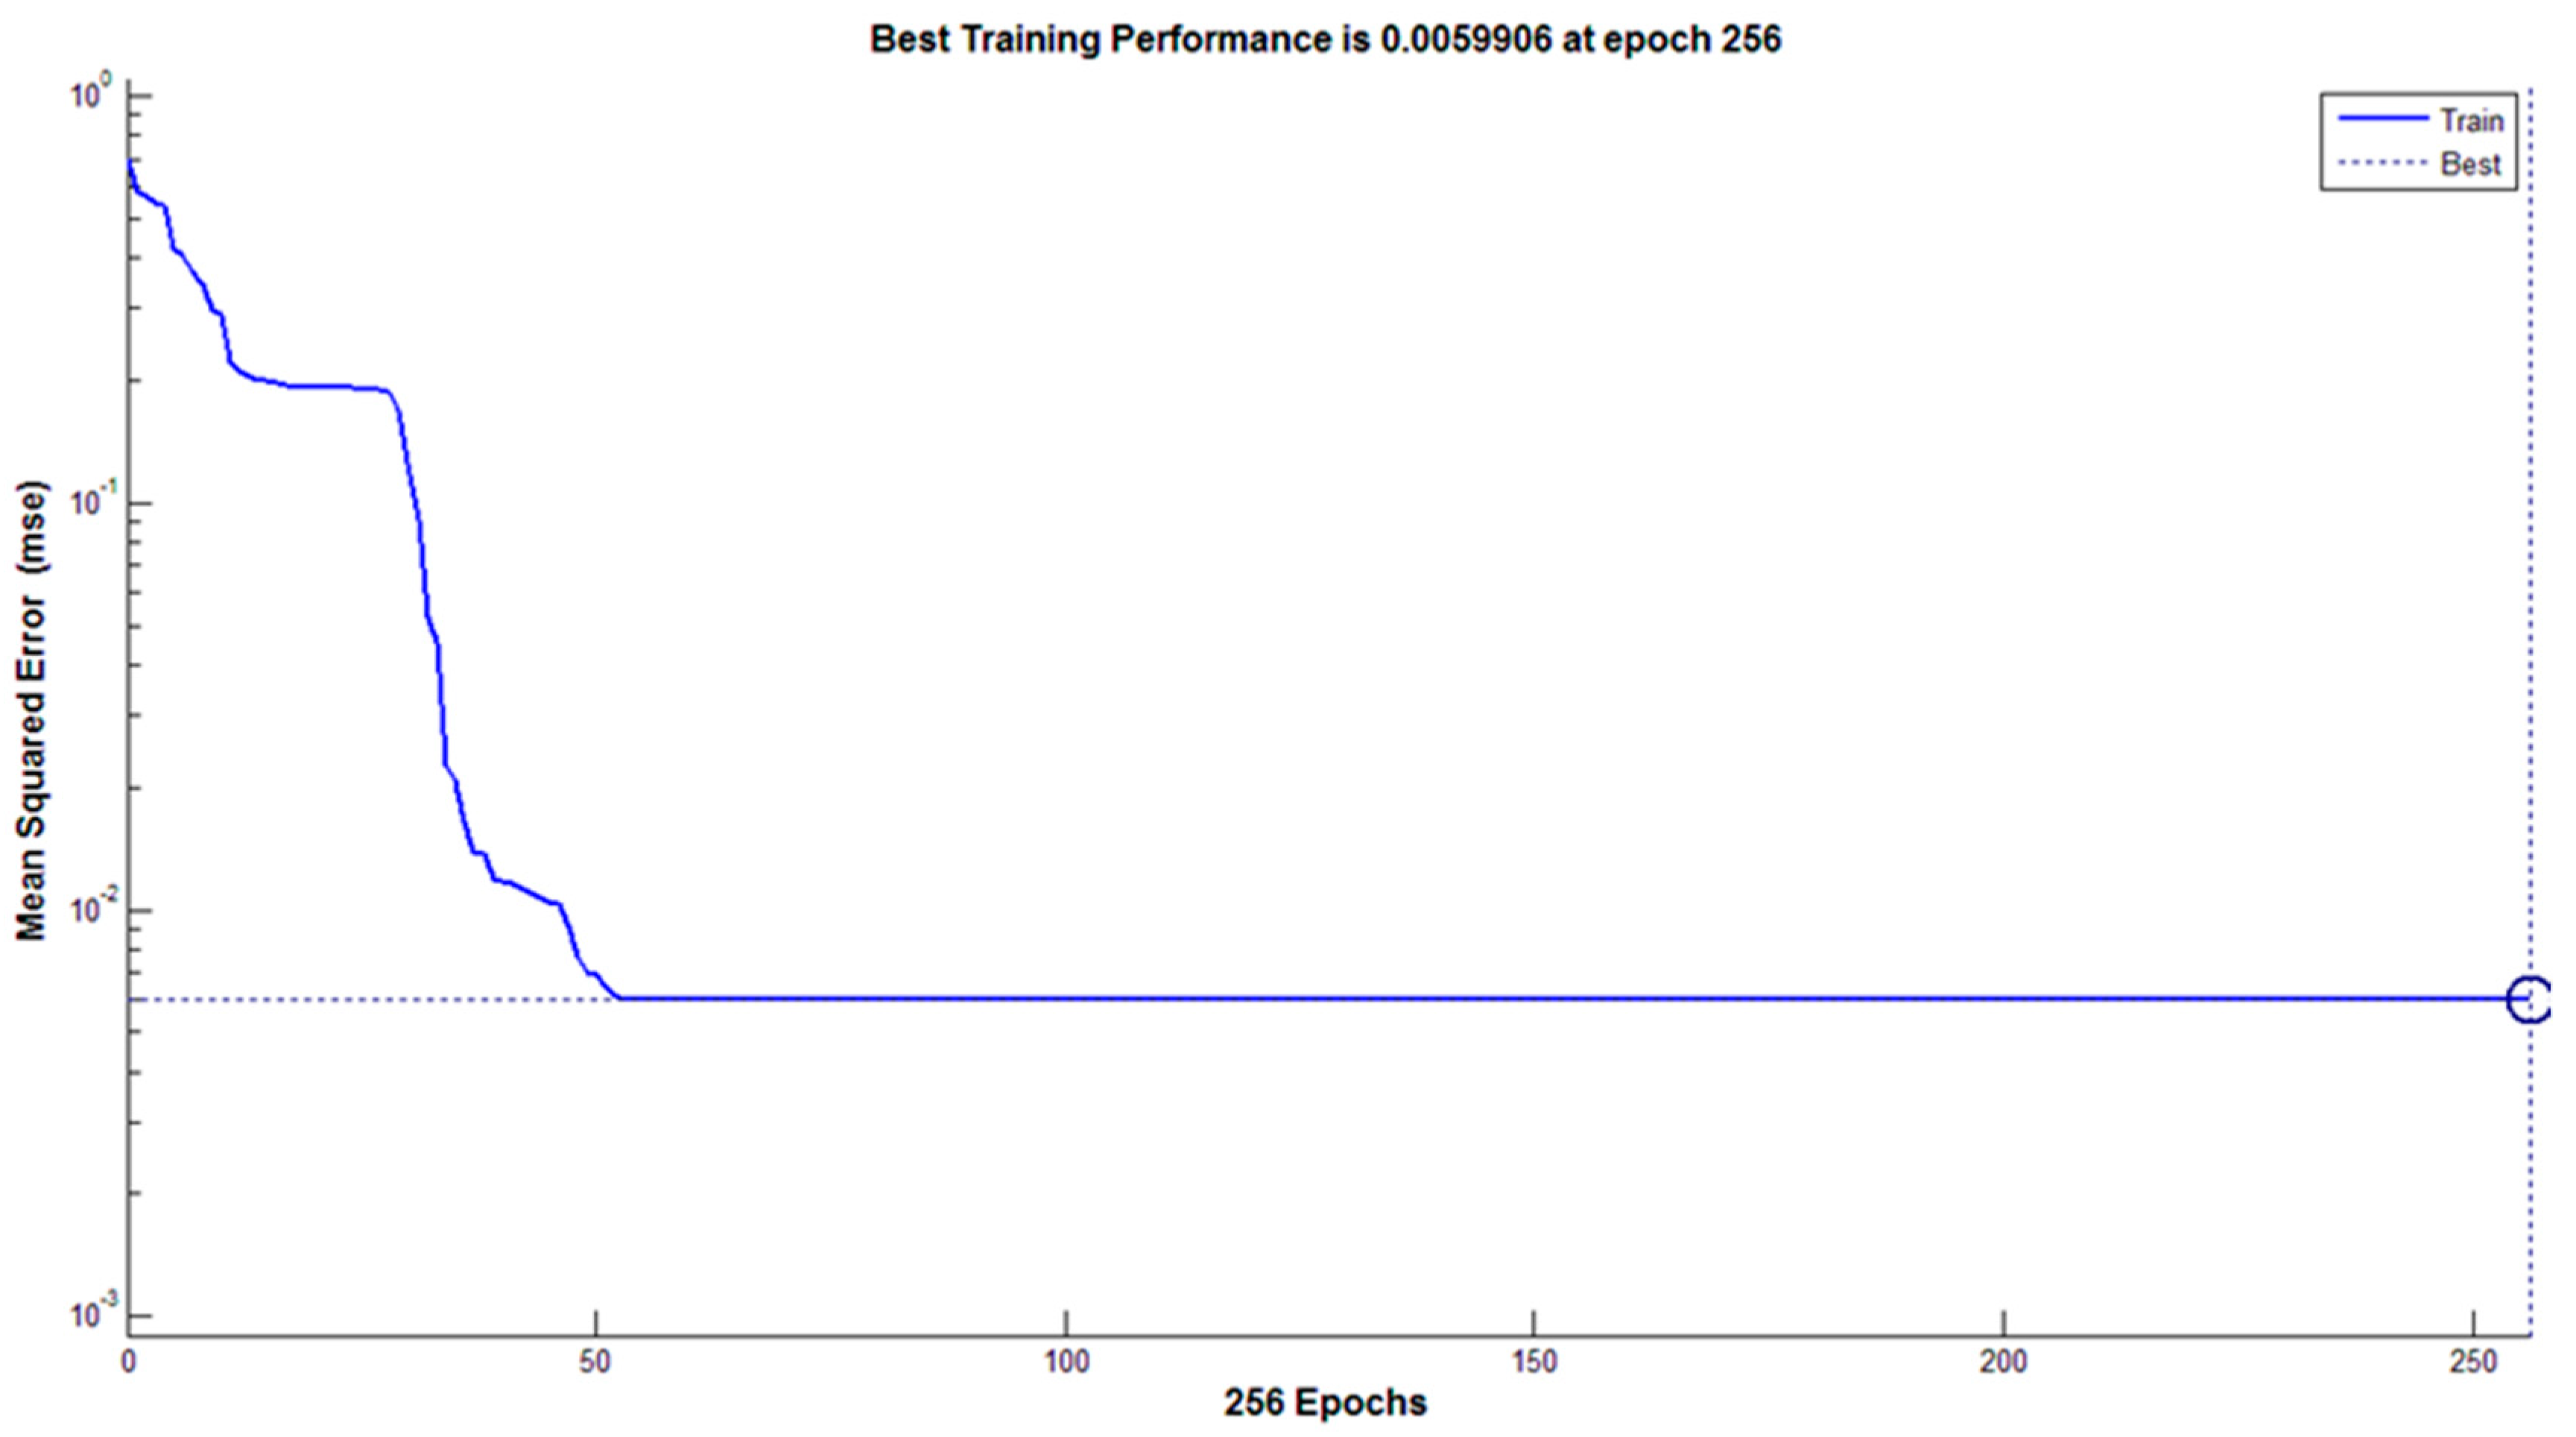
3.4.2. Classification Using Artificial Neural Network
3.4.3. Evaluating the Performance of Cultivars Using Three Properties of Sensitivity, Specificity, and Accuracy
4. Conclusions
Author Contributions
Funding
Acknowledgments
Conflicts of Interest
References
- Lu, Y.; Yi, S.; Zeng, N.; Liu, Y.; Zhang, Y. Identification of rice diseases using deep convolutional neural networks. Neurocomputing 2017, 267, 378–384. [Google Scholar] [CrossRef]
- Mucherino, A.; Papajorgji, P.J.; Pardalos, P.M. Data Mining in Agriculture; Springer: New York, NY, USA, 2009. [Google Scholar]
- Zareiforoush, H.; Minaei, S.; Alizadeh, M.R.; Banakar, A. A hybrid intelligent approach based on computer vision and fuzzy logic for quality measurement of milled rice. Measurement 2015, 66, 26–34. [Google Scholar] [CrossRef]
- Golpour, I.; Parian, J.A.; Chayjan, R.A. Identification and classification of bulk paddy, brown, and white rice cultivars with colour features extraction using image analysis and neural network. Czech J. Food Sci. 2014, 32, 280–287. [Google Scholar] [CrossRef] [Green Version]
- Kuo, T.Y.; Chung, C.L.; Chen, S.Y.; Lin, H.A.; Kuo, Y.F. Identifying rice grains using image analysis and sparse-representation-based classification. Comput. Electron. Agric. 2016, 127, 716–725. [Google Scholar] [CrossRef]
- Liu, J.; Tang, Z.; Gui, W.; Liu, W.; Xu, P.; Zhu, J. Application of statistical modeling of image spatial structures to automated visual inspection of product quality. J. Process. Cont. 2016, 44, 23–40. [Google Scholar] [CrossRef]
- Lurstwut, B.; Pornpanomchai, C. Image analysis based on color, shape and texture for rice seed (Oryza sativa L.) germination evaluation. Agric. Nat. Resour. 2018, 51, 383–389. [Google Scholar] [CrossRef]
- Guzman, J.D.; Peralta, E.K. Classification of Philippine rice grains using machine vision and artificial neural networks. In Proceedings of the World Conference on Agricultural Information and IT, Tokyo, Japan, 23–26 August 2008; Volume 6, pp. 41–48. [Google Scholar]
- Hobson, D.M.; Carter, R.M.; Yan, Y. Characterisation and identification of rice grains through digital image analysis. In Proceedings of the Instrumentation and Measurement Technology Conference, Warsaw, Poland, 1–3 May 2007. [Google Scholar]
- Liu, Z.Y.; Cheng, F.; Ying, Y.B.; Rao, X.Q. Identification of rice seed varieties using neural network. J. Zhejyang Univ. Sci. 2005, 6, 1095–1100. [Google Scholar] [CrossRef] [PubMed] [Green Version]
- Phadikar, S.; Sil, J.; Das, A.K. Rice diseases classification using feature selection and rule generation techniques. Comput. Electron. Agric. 2013, 90, 76–85. [Google Scholar] [CrossRef]
- Silva, C.S.; Sonnadara, U. Classification of rice grains using neural networks. Process. Tech. Sessions 2013, 29, 9–14. [Google Scholar]
- Yang, A.; Gao, R.; Liu, Y.; Sun, X.; Pan, Y. An automatic method for identifying different variety of rice seeds using machine vision technology. In Proceedings of the Sixth International Conference on Natural Computation, Yantai, China, 10–12 August 2010; pp. 84–88. [Google Scholar]
- Yang, P.; Zhu, Y.; Yang, X.; Li, J.; Tang, S.; Hao, Z.; Guo, L.; Li, X.; Zeng, X.; Lu, Y. Evaluation of sample preparation methods for rice geographic origins classification using laserinduced breakdown spectroscopy. J. Cereal Sci. 2018, 80, 111–118. [Google Scholar] [CrossRef]
- Anami, B.S.; Naveen, N.M.; Hanamaratti, N.G. Behavior of HSI color co-occurrence features in variety recognition from bulk paddy grain image samples. Int. J. Signal Process. Image Process. Pattern Recognit. 2015, 8, 19–30. [Google Scholar] [CrossRef]
- Chaugule, A.A.; Mali, S.N. Evaluation of shape and color features for classification of four paddy varieties. Int. J. Image Graph. Signal Process. 2014, 6, 32. [Google Scholar] [CrossRef] [Green Version]
- Kambo, R.; Yerpude, A. Classification of basmati rice grain variety using image processing and principal component analysis. Int. J. Comput. Trends Technol. 2014, 11, 80–85. [Google Scholar] [CrossRef] [Green Version]
- Gonzalez, R.C.; Woods, R.E.; Eddins, S.L. Digital Image Processing Using MATLAB; Prentice Hall: Upper Saddle River, NJ, USA, 2004. [Google Scholar]
- Sabzi, S.; Abbaspour-Gilandeh, Y.; García-Mateos, G. A fast and accurate expert system for weed identification in potato crops using metaheuristic algorithms. Comput. Ind. 2018, 98, 80–89. [Google Scholar] [CrossRef]
- Soille, P. Morphological Image Analysis: Principles and Applications; Springer: Berlin/Heidelberg, Germany, 2002. [Google Scholar]
- Toriwaki, J.; Yoshida, H. Fundamentals of Three-Dimensional Digital Image Processing; Springer: London, UK, 2009. [Google Scholar]
- Meyer, G.E.; Mehta, T.; Kocher, M.F.; Mortensen, D.A.; Samal, A. Textural imaging and discriminant analysis for distinguishing weeds for spot spraying. Trans. ASAE 1998, 41, 1189–1197. [Google Scholar] [CrossRef]
- Bevington, P.R.; Robinson, D.K.; Blair, J.M.; Mallinckrodt, A.J.; McKay, S. Data reduction and error analysis for the physical sciences. Comput. Phys. 1993, 7, 415–416. [Google Scholar] [CrossRef]
- Klecka, W.R.; Iversen, G.R.; Klecka, W.R. Discriminant Analysis; SAGE Publications Ltd.: Thousand Oaks, CA, USA, 1980; Volume 19. [Google Scholar]
- Rojas, R. Neural Networks—A Systematic Introduction; Springer: Berlin, Germany, 1996. [Google Scholar]
- Wisaeng, K. A Comparison of Decision Tree Algorithms for UCI Repository Classification. Int. J. Eng. Trends Technol. 2013, 4, 3393–3397. [Google Scholar]


| Feature | Symbol | Description |
|---|---|---|
| The mean RGB components | Bm, Gm, Rm | Extracted from the original image |
| The mean square of RGB components | Bms, Gms, Rms | |
| The variance of RGB components | Brav, Grav, Rrav | |
| The standard deviation of RGB components | Bdts, Gdts, Rdts | |
| The mean YIQ components | NYm, NIm, Qm, | Using the rgb2ntsc command |
| The mean square of YIQ components | NYms, NIms, Qms | |
| The variance of YIQ components | NYrav, NIrav, Qrav | |
| The standard deviation of YIQ components | YNstd, NIstd, Qstd | |
| The mean YCbCr components | YYm, Cbm, Crm | Using the rgb2 and cbcr command |
| The mean square of YCbCr components | YYsm, Cbsm, Crsm | |
| The variance of YCbCr components | YYvar, Cbvar, Crvar | |
| The standard deviation of YCbCr components | YYstd, Cbstd, Crstc | |
| The mean HSV components | HVm, SVm, Vm | Using the rgb2hsv |
| The mean square of HSV components | HVsm, SVsm, Vsm | |
| The variance of HSV components | HVvar, SVvar, Var | |
| The standard deviation of HSV components | HVstd, SVstd, Vstd | |
| The mean HSI components | HIm, SIm, IIm | Using code written in MATLAB software |
| The mean square of HSI components | HIsm, SIsm, IIsm | |
| The variance of HSI components | HIvar, SIvar, IIvar | |
| The standard deviation of HSI components | HIstd, SIstd, IIstd |
| Feature | Symbol | Description | Units |
|---|---|---|---|
| Area | ar | Using the region props command | Pixel2 |
| Distance from center | ec | Pixel | |
| The length of the large axis | ma | Pixel | |
| The length of the small axis | mi | Pixel | |
| Perimeter | pe | Pixel2 | |
| The square of the area | sar | (area)2 | Pixel2 |
| The square of the distance from the center | sec | (eccentricity)2 | Pixel2 |
| The square of the long axis | sma | (major axis length)2 | Pixel2 |
| The square of the small axis | smi | (minor axis length)2 | Pixel2 |
| The square of perimeter | spe | (perimeter)2 | Pixel4 |
| Aspect ratio | as | Aspect ratio = major axis length/minor axis length | - |
| The square of aspect ratio | sas | (Aspect ratio)2 | - |
| Elliptical | el | Elliptical = major axis length − minor axis length | - |
| The square of Elliptical | sel | (Elliptical)2 | - |
| Feature | Symbol | Description |
|---|---|---|
| The mean of gray level in red, green, and blue bands | Ragl, Gagl, Bagl | |
| The mean contrast in red, green, and blue bands | Rac, Gac, Bac | |
| The smoothness in red, green, and blue bands | Rs, Gs, Bs | |
| The third moment in red, green, and blue bands | Rtm, Gtm, Btm | |
| The homogeneity in red, green, and blue bands | Ru, Gu, Bu | |
| The entropy in red, green, and blue bands | Re, Ge, Be |
| Discriminant Analysis (DA) | Artificial Neural Networks (ANN) | |||||
|---|---|---|---|---|---|---|
| Class | Sensitivity (%) | Accuracy (%) | Specificity (%) | Sensitivity (%) | Accuracy (%) | Specificity (%) |
| 1. Tencc | 100 | 96.61 | 71.43 | 100 | 100 | 100 |
| 2. Alikazemi | 100 | 96.61 | 71.43 | 100 | 100 | 100 |
| 3. Asgari | 100 | 100 | 100 | 100 | 100 | 100 |
| 4. Binam | 100 | 100 | 100 | 100 | 100 | 100 |
| 5. Domsiyab | 100 | 100 | 100 | 100 | 100 | 100 |
| 6. Dorfak | 100 | 100 | 100 | 100 | 100 | 100 |
| 7. Dorfak | 80 | 91.68 | 80 | 100 | 100 | 100 |
| 8. Hasani | 60 | 96.61 | 100 | 100 | 100 | 100 |
| 9. Hashemi | 80 | 91.68 | 80 | 100 | 100 | 100 |
| 10. Kadoos | 40 | 93.44 | 66.66 | 100 | 100 | 100 |
| 11. Khazar | 100 | 100 | 100 | 100 | 100 | 100 |
| 12. Khazaregarm | 80 | 91.68 | 80 | 100 | 100 | 100 |
| 13. Lenjan | 100 | 100 | 100 | 100 | 100 | 100 |
| Discriminant Analysis (DA) | Artificial Neural Networks (ANN) | |||||
|---|---|---|---|---|---|---|
| Class | Sensitivity (%) | Accuracy (%) | Specificity (%) | Sensitivity (%) | Accuracy (%) | Specificity (%) |
| 1. Tencc | 100 | 96.43 | 71.43 | 100 | 100 | 100 |
| 2. Alikazemi | 100 | 100 | 100 | 100 | 100 | 100 |
| 3. Asgari | 80 | 98.18 | 100 | 100 | 100 | 100 |
| 4. Binam | 100 | 100 | 100 | 100 | 100 | 100 |
| 5. Domsiyab | 40 | 91.52 | 50 | 100 | 100 | 100 |
| 6. Dorfak | 100 | 100 | 100 | 100 | 100 | 100 |
| 7. Dorfak | 60 | 90 | 42.83 | 100 | 100 | 100 |
| 8. Hasani | 100 | 100 | 100 | 100 | 100 | 100 |
| 9. Hashemi | 100 | 98.18 | 83.33 | 100 | 100 | 100 |
| 10. Kadoos | 62.5 | 94.73 | 100 | 100 | 100 | 100 |
| 11. Khazar | 100 | 100 | 100 | 100 | 100 | 100 |
| 12. Khazaregarm | 80 | 98.19 | 100 | 100 | 100 | 100 |
| 13. Lenjan | 100 | 98.18 | 50 | 100 | 100 | 100 |
| Discriminant Analysis (DA) | Artificial Neural Networks (ANN) | |||||
|---|---|---|---|---|---|---|
| Class | Sensitivity (%) | Accuracy (%) | Specificity (%) | Sensitivity (%) | Accuracy (%) | Specificity (%) |
| 1. Tencc | 80 | 98.19 | 100 | 100 | 100 | 100 |
| 2. Alikazemi | 100 | 100 | 100 | 100 | 100 | 100 |
| 3. Asgari | 100 | 100 | 100 | 100 | 100 | 100 |
| 4. Binam | 100 | 100 | 100 | 100 | 100 | 100 |
| 5. Domsiyab | 40 | 91.52 | 50 | 100 | 100 | 100 |
| 6. Dorfak | 100 | 96.42 | 71.43 | 100 | 100 | 100 |
| 7. Dorfak | 100 | 96.42 | 71.43 | 100 | 100 | 100 |
| 8. Hasani | 100 | 100 | 100 | 100 | 100 | 100 |
| 9. Hashemi | 40 | 91.52 | 50 | 100 | 100 | 100 |
| 10. Kadoos | 66.66 | 96.43 | 100 | 100 | 100 | 100 |
| 11. Khazar | 80 | 98.18 | 100 | 100 | 100 | 100 |
| 12. Khazaregarm | 60 | 90 | 42.86 | 100 | 100 | 100 |
| 13. Lenjan | 100 | 100 | 100 | 100 | 100 | 100 |
© 2020 by the authors. Licensee MDPI, Basel, Switzerland. This article is an open access article distributed under the terms and conditions of the Creative Commons Attribution (CC BY) license (http://creativecommons.org/licenses/by/4.0/).
Share and Cite
Abbaspour-Gilandeh, Y.; Molaee, A.; Sabzi, S.; Nabipur, N.; Shamshirband, S.; Mosavi, A. A Combined Method of Image Processing and Artificial Neural Network for the Identification of 13 Iranian Rice Cultivars. Agronomy 2020, 10, 117. https://doi.org/10.3390/agronomy10010117
Abbaspour-Gilandeh Y, Molaee A, Sabzi S, Nabipur N, Shamshirband S, Mosavi A. A Combined Method of Image Processing and Artificial Neural Network for the Identification of 13 Iranian Rice Cultivars. Agronomy. 2020; 10(1):117. https://doi.org/10.3390/agronomy10010117
Chicago/Turabian StyleAbbaspour-Gilandeh, Yousef, Amir Molaee, Sajad Sabzi, Narjes Nabipur, Shahaboddin Shamshirband, and Amir Mosavi. 2020. "A Combined Method of Image Processing and Artificial Neural Network for the Identification of 13 Iranian Rice Cultivars" Agronomy 10, no. 1: 117. https://doi.org/10.3390/agronomy10010117
APA StyleAbbaspour-Gilandeh, Y., Molaee, A., Sabzi, S., Nabipur, N., Shamshirband, S., & Mosavi, A. (2020). A Combined Method of Image Processing and Artificial Neural Network for the Identification of 13 Iranian Rice Cultivars. Agronomy, 10(1), 117. https://doi.org/10.3390/agronomy10010117