Article

Quantitative Estimation of the Nutrient Uptake Requirements of Peanut

1
Key Laboratory of Geographical Processes and Ecological Security in Changbai Mountains, Ministry of Education, School of Geographical Sciences, Northeast Normal University, Changchun 130024, China
2
Ministry of Agriculture Key Laboratory of Plant Nutrition and Fertilizer, Institute of Agricultural Resources and Regional Planning, Chinese Academy of Agricultural Sciences (CAAS), Beijing 100081, China
3
Liaoning Research Institute of Sandy Land Control and Utilization, Fuxin 123000, China
*
Author to whom correspondence should be addressed.
Agronomy 2020, 10(1), 119; https://doi.org/10.3390/agronomy10010119
Submission received: 18 December 2019 / Revised: 6 January 2020 / Accepted: 9 January 2020 / Published: 13 January 2020
(This article belongs to the Special Issue Soil Fertility Management for Better Crop Production)

Abstract

:
Understanding the characteristics of the balanced nutrient requirements for peanut to achieve target yields is paramount when formulating fertilizer management strategies to increase yields and avoid fertilizer loss. Nutritional requirement estimation models can provide effective alternatives for the estimation of the optimum crop balanced nutrient requirements under varied agricultural conditions which are less time consuming and expensive. In the present study, the quantitative estimation of the optimum crop balanced nutrient requirements of peanut in China were obtained using quantitative evaluation of fertility of tropical soils (QUEFTS) model. The database covered the main agro-ecological region for peanut crops in China between 1993 and 2018. The predicted results of the QUEFTS model indicated that nutrient uptake requirements increased linearly with increasing pod yields until the yields had reached approximately 60% to 70% of the potential pod yields. It was found that with the increasing pod yields during the nutrient linear absorption stage, the plants had required 38.4 kg N, 4.3 kg P, and 14.0 kg K in total to produce 1000 kg of pods, and the corresponding internal efficiencies were 26.0 kg N/kg, 235.0 kg P/kg, and 71.6 kg K/kg, respectively. In addition, the balance rates of the removal nutrient in the pods were determined to be 29.4 kg N, 2.9 kg P, and 4.9 kg K per 1000 kg of pod yield, or approximately 76.5%, 67.4%, and 34.7% of N, P, and K in the total plants, respectively. This study’s field validation experiments verified the applicability and accuracy of the QUEFTS model. Therefore, it was considered to be an effective alternative for the estimation of the optimal balance N, P, and K uptake requirements for peanut crops. These findings will potentially be helpful when making future decisions regarding fertilizer recommendations for peanut crops in China.

Graphical Abstract

1. Introduction

Peanut (Arachis hypogaea L.) is one of the major global food legume and oilseed crops, and offers multiple benefits to meet human nutritional needs throughout the world [1,2]. As stated by FAO (2017), peanut crops are grown in 118 countries (or regions) around the world using approximately 28 million ha of land [3]. China is currently one of the main peanut producing countries. China has allotted 4.63 million ha of land to peanut production, producing 17.15 million tons of peanut pods, which approximately correspond to 17% and 36% of the global peanut production rates [3,4]. However, peanut crops are mainly cultivated in low fertility soil with small organic matter content and weak nutrient reserves [5]. At the same time, excessive or imbalanced fertilization practices widely exist in China [6]. According to a fertilization survey, 750 kg/ha compound fertilizer were applied in some farming practices, which far exceeded the peanut nutrient requirements [7]. The majority of the excess fertilizer was lost into the environment, where it then posed threats to human and ecosystem health [8]. Therefore, a deeper understanding of the nutrient efficiency and yield-nutrient uptake relationships in cultivated crops is essential for developing more robust fertilizer recommendation algorithms.
Many research studies have been conducted regarding the nutrient uptake dynamics of crops under different agricultural conditions in order to achieve adequate congruence between nutrient supplies and crop nutrient demands [9,10]. For example, Van Keulen [11] pointed out that an upper boundary exists in diluted nutrient concentrations in grain (and straw) when those nutrients are the sole factors limiting crop yields. Janssen et al. [12] developed the Quantitative Evaluation of the Fertility of Tropical Soils (QUEFTS) model and deduced a generic empirical relationship between grain yields and nutrient accumulation in maize using two linear boundaries of a maximum nutrient accumulation (a) and a maximum nutrient dilution (d). Subsequently, in the studies conducted by Smaling and Janssen [13] and Sattari et al. [14], further improvements were made to the QUEFTS model. The QUEFTS model has been successfully applied to various crops in a range of different countries with a variety of soil types and agricultural environments. For instance, the model has been applied to such crops as maize [10,15], rice [16,17], wheat [18,19], soybean [20,21], sweet potato [22], and radish [23]. The QUEFTS model considers the interactions between the N, P, and K for a certain crop yield targets, and has been effectively used in combination with site-specific nutrient management (SSNM) methods in order to determine fertilizer requirements within site-specific areas [16,24].
As mentioned above, studies regarding nutrient uptake requirements and internal nutrient efficiencies were previously conducted on many types of crops, including maize, rice, wheat, and so on. However, little attention had been given to the balanced nutrition requirements of peanut crops. The current study involved a large database of nutrient uptake data collections from the main agro-ecological peanut growing regions of China between 1993 and 2018. The objectives of this study were as follows: (1) The determination of the envelope functions which describe the relationships between the pod yields of peanut crops and the characteristic nutrient uptake across diverse growing environments in China; (2) The achievement of accurate estimation of the balanced requirements of N, P, and K for peanut crops using the aforementioned QUEFTS model; and (3) The evaluation of the suitability of the QUEFTS model as a generic model for estimating the N, P, and K requirements of peanut crops through the use of field experiments.

2. Materials and Methods

2.1. Database Source and Study Sites

The data for this study’s database were collected from numerous published data obtained during field experiments conducted by peers and reviewed in the journals of the China Knowledge Resource Integrated database from 2010 to 2016 (www.cnki.net). In addition, the data accumulated by various studies conducted by the International Plant Nutrition Institute (IPNI) China Program, along with those obtained by this research group, were utilized as valuable data resources. As shown in Figure 1, the geographical distribution of numerous field experiments were covered a wide range of varied environments, soil, climatic conditions, and cropping systems in China. The experimental sites contained variable fertilization treatments, including farmers’ practices, optimal fertilization practices, a series of nutrient omission plots of N, P, or K based on optimal fertilization treatments, and long-term field experiments across China’s peanut-growing regions. The available data from the experiments included such crop parameters as pod yield and biomass rates, as well as the N, P, and K levels in total peanut plant dry matter during the period ranging from 1993 to 2018.

2.2. Model Development

The QUEFTS model was designed as a promising new tool for evaluating the fertility levels of native and tropical soil. It was first developed for maize crops under rain-fed conditions by Janssen et al. [12]. In addition, further improvements were made by Smaling and Janssen [13] and Sattari et al. [14], in which the relationships between grain yields and nutrient accumulations in the total above-ground plant dry matter of crops at maturity were described using a large database. Peanut belong the category of underground crops. During the harvesting processes, the total nutrient of plants (including roots, pods, and haulms) will be removed [25]. In the present study, the nutrient data of the roots were accumulated with the haulm data.
The following were the key steps in this research experiment: (1) The available appropriate data were selected in order to realize the boundary conditions of QUEFTs model, in which the HI less than 0.4 were excluded due to the effects of abiotic or biotic stress conditions, rather than nutrient deficiency conditions; (2) The two boundary lines of N, P, and K for the crop yields at maximum nutrient accumulation (YA) and maximum nutrient dilution (YD) were defined by the maximum nutrient accumulation value (a) and maximum nutrient dilution value (d), which were calculated by the lower and upper 2.5th (Set I), 5th (Set II), and 7.5th (Set III) percentiles of all the nutrient internal efficiencies (IEs) data; (3) The appropriate a and d values for the peanut database were then acquired; (4) Then, the optimal N, P, and K uptake curves for peanut crops in China were simulated; (5) Finally, the applicability of the QUEFTS model for simulating the nutrient uptake requirements in China were validating using field experiments.
The related parameters IE, that was represented the amount of pod yield produced per kg nutrient uptake in total plant matter [15,20]. The reciprocal internal efficiency (RIE) was represented nutrient uptake requirements per 1000 kg of pod yield [15,20]. IE (Equation (1)) and RIE (Equation (2)) using the following formula:
IE ( kg / kg ) = Y pod U plant
RIE ( kg / 1000   kg ) = U plant Y pod × 1000
where Y pod is pod yield and U plant indicates the nutrient uptake of the total plants.

2.3. Model Validation

This study’s field validations were conducted in 2018 across five agro-ecological zones in China (including the provinces of Jilin, Liaoning, Shandong, and Hebei). A completely randomized block design with three replications was applied to all of the experiments, and each plot size measured 30 m2. The peanut crops were sown in May and harvested in September. The fertilizer recommendations were provided by the Nutrient Expert System (NE). The NE was a computer software developed by IPNI based on a SSNM strategy, which included the QUEFTS model’s predicted nutrient uptake data for determining the optimal nutrient requirements of the peanut crops [26]. Adequate measurements were taken in the field experiments in order to control the effects of pests, disease, and weeds.
At maturity, the peanut plants were manually harvested and total weights of the pods and haulm were measured separately. All of the plant parts were oven-dried to a constant weight at 70 °C and then analyzed in order to determine the N, P, and K concentrations. The individual plant parts were digested with H2SO4-H2O2, and the concentrations of N, P, and K were determined adopting the Kjeldahl approach, vanado-molybdate yellow color approach, and flame spectrophotometers, respectively. And, the accumulation of N, P, and K in total plant was calculated by multiplying the matter dry weight by the nutrient concentrations.
The performance of the QUEFTS model was evaluated using coefficient of determination (R2), root-mean-square error (RMSE), and normalized-RMSE (n-RMSE) between the measured and simulated data. The R2 estimates the combined dispersion against the single dispersion of the measured and simulated series [27]. The RMSE measures the mean discrepancy between the simulated and measured data with the same unit and the n-RMSE removed the unit and allowed for comparisons between values with different units [21].
R 2 = 1   i = 1 n ( M i S i ) 2 i = 1 n ( M i M ¯ ) 2
RMSE   ( kg / ha ) = Σ i = 1 n ( S i M i ) 2 n
n RMSE   ( % ) = RMSE M ¯
where M i and M ¯ represent the values of the measured and mean of the measured nutrient uptakes (kg/ha), respectively; S i represents the values of the simulated nutrient uptake (kg/ha); and n indicates the number of values.

3. Results and Discussion

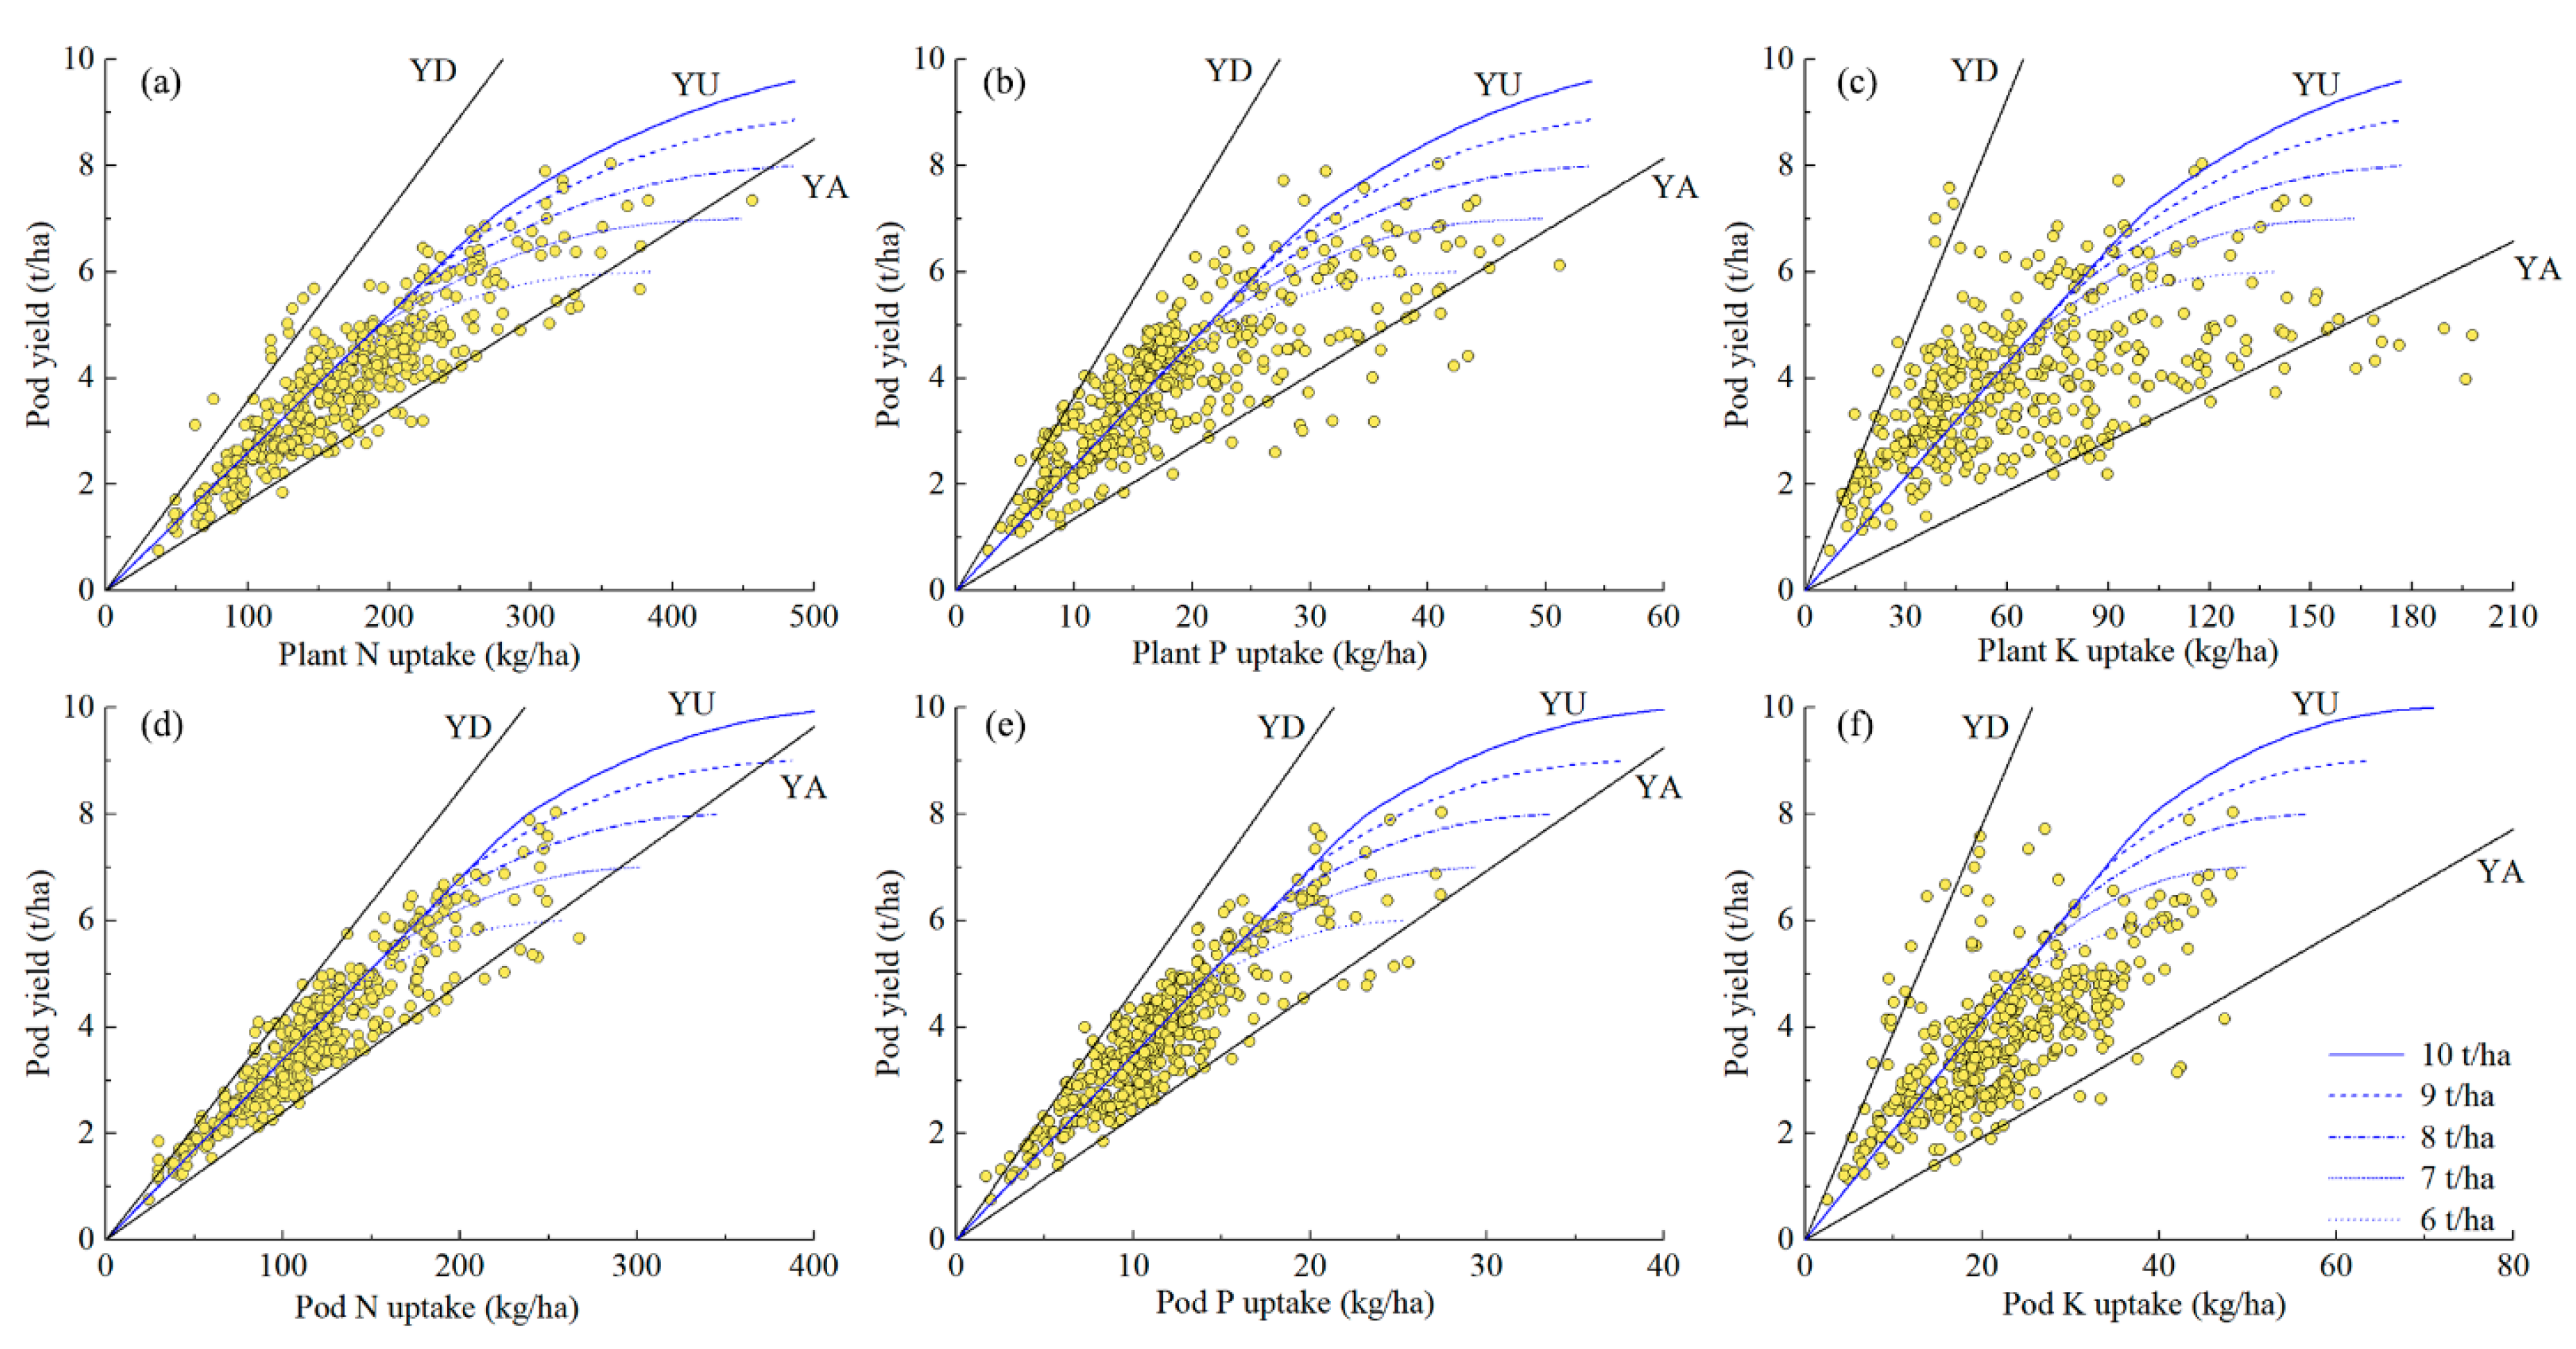
3.1. Pod Yields and Nutrient Uptake Data

The average value of the pod yields (10.0% moisture content) was determined to be 3918 kg/ha in the present peanut database and had ranged from 500 to 8602 kg/ha (Table 1). In addition, it was determined that 95.1% of the pod yield had a centralized distribution in the range from the 2.5th to 97.5th percentile for the present peanut database (Figure 2). The significant variabilities in the peanut pod yields were possibly due to the fact that differences had existed between the different field experiments, including climate conditions, agronomic practices, fertilized treatments, and peanut varieties. Average peanut pod yield in the current database was found to be higher than the 3709 kg/ha in China’s mainland and the 1685 kg/ha for the world [3]. The harvest index (HI) for the entire database ranged from 0.31 to 0.82, with an average value of 0.51. The distributions of the HI and pod yields are shown in Figure 2. It can be seen in the figure that 95.5% of data were centralized distributed in the range of the 2.5th to 97.5th percentiles for the HI of the present peanut database.
The concentrations of N and P in the peanut pods (35.6 g N/kg and 3.6 g P/kg, ranging from 13.9 to 64.5 g N/kg and 1.6 to 8.2 g P/kg, respectively) were found to be higher than the haulm (14.2 g N/kg and 1.7 g P/kg, ranging from 6.9 to 38.4 g N/kg and 0.31 to 4.0 g P/kg, respectively). Meanwhile, the K content in the peanut pods (7.1 g K/kg, ranging from 2.2 to 17.3 g K/kg) was observed to be lower than the haulm (12.9 g K/kg, ranging from 2.1 to 35.8 g K/kg), as detailed in Table 1. The average total plant accumulations were 163.6 kg N/ha, 17.8 kg P/ha, and 59.2 kg K/ha, with accumulation ranges of 30.1 to 456.7 kg N/ha, 2.8 to 51.2 kg P/ha and 7.6 to 228.1 kg K/ha, respectively. The variability of the nutrient distributions reflected the diversity in the environmental conditions and tillage treatments. However, the current database was lower than the N accumulation of 180 to 228 kg/ha under the various tillage treatments [28]. This may be due to that plant macronutrient amounts in underground peanut parts have significant effects by soil bulk density, and tends to be affected by tillage practices [25].
Nutrient harvest indexes (N-HI, P-HI, and K-HI) is defined as kg nutrient in pod per kg nutrient in total plant dry matter at maturity. Average N-HI, P-HI, and K-HI were 0.72, 0.69, and 0.39 kg/kg, respectively. Peanut pod absorbed corresponding proportion of the nutrient, that approximately 72%, 69%, and 39% of the N, P and K distribution in the pods, respectively.

3.2. Internal Efficiency and Reciprocal Internal Efficiency

In the current database, the IE values of N were found to have relatively small variations, and ranged from 14.3 to 49.8 kg pod/kg plant N, with an average value of 24.7 kg/kg. However, the IE values of P and K were observed to widely vary, ranging from 89.8 to 483.1 kg pod/kg plant P (average value of 238.5 kg/kg), and 17.9 to 231.5 kg/kg plant K (average value of 85.1 kg/kg), as detailed in Table 2. It was observed that the IE values were greatly affected by the nutrient management practices. The large variations in the observed IE values in the current peanut database reflected the variations in the field experiments, including season and site specific differences in environmental conditions (for example, temperature), nutrient imbalances, irrigation, weed and pest control measures, continuous cropping practices [29], tillage treatments [25], and so on. The average RIE (reciprocal internal efficiency; nutrient uptake requirements per 1000 kg of pod yield) values of the N, P, and K were 42.2, 4.5, and 15.3 kg, with ranges from 20.1 to 69.9 kg for N; 2.1 to 11.1 kg for P; and 4.3 to 55.9 kg for K, respectively observed, as detailed in Table 2.

3.3. Estimation of the Nutrient Uptake Requirements for Specific Target Pod Yields

3.3.1. Selection of the Data for Adapting the QUEFTS Model

In the present study, the data with HI lower 0.4 was removed due to the fact that the crop yields had been subjected to different constraints, such as disease, pests, and drought, with the exception of N, P, or K supply limitations [23]. The parameters of a and d were calculated using data with HI ranging from 0.4 to 0.82 in order to ensure that the peanut growth had been mainly limited by nutrient constraints rather than biotic or abiotic stress conditions. The constant a and d values of the nutrient were calculated by excluding the upper and lower 2.5th (Set I), 5th (Set II) or 7.5th (Set III) percentiles of the IEs (Table 3), which were indicated by the relationships between the pod yields and nutrient accumulations in the dry plant matter at maturity.
The relationship between the pod yields and the nutrient requirements of the total dry plant matter was simulated by the QUEFTS model using three groups of a and d values under a potential yield of 10 t/ha, respectively. As shown in Figure 3, the N, P, and K uptake requirements (YU) which were simulated by the QUEFTS model were similar under three a and d sets for the different pod yield targets, with the exception being when the yield target approached a potential yield 10 t/ha. This study suggested that Set I should be adopted as the standard parameter set in the QUEFTS model in order to accurately estimate the balanced nutrient requirements of the peanut crops and recognize the relationship between the pod yields and the nutrient accumulations. This was due to the fact that there were large variabilities observed in the IE values among the field experiments.

3.3.2. Estimation of Nutrient Uptake Requirements

In the present study, across the potential pod yields (ranging from 6 to 10 t/ha), the QUEFTS model simulated the balanced nutritional uptake requirements for N, P, and K with the Set I a and d values (17.0 and 35.7 kg pod/kg N; 135.6 and 364.9 kg pod/kg P; 31.3 and 154.4 kg pod/kg K) which were derived from the current database. As shown in Figure 4, the QUEFTS model predicated linear increases in the pod yields if the nutrient were taken up to the balanced amounts until the pod yields reached approximately 60% to 70% of the potential pod yields, and the IE values of the N, P, and K were constant (Table 4). During the constant slope increasing phase, the balanced nutrient uptake requirements to produce 1000 kg of pods were 38.4 kg N, 4.3 kg P, and 14.0 kg K. In addition, the corresponding optimal IE values were 26.0 kg pod/kg N, 235.0 kg pod/kg P, and 71.6 kg pod/kg K for balanced nutrition, respectively. Therefore, the optimal balanced required N: P: K ratio in the total plants were 9.0:1.0:3.3 (Table 4), which was similar to the average of observed nutrient uptake ratio of 9.2:1.0:3.3. The average observed values of N, P, and K were higher than the values simulated by the QUEFTS model. This was determined to be due to the fact that the N, P, and K predicted by the QUEFTS model were the optimal nutrient requirements under the conditions of the balanced absorption of the three nutrient elements (N, P, and K) [15]. As shown in Figure 4a, a large number of data points were concentrated in the locality of the lower boundary, which reflected an excess or luxuriant uptake of N nutrient in the current database. However, Fang and Zhao [30] concluded that the following concentrations were needed in order to produce 1000 kg of pods for the different peanut varieties: 37.4 to 49.1 kg N; 6.8 to 8.7 kg P; and 15.8 to 21.7 kg K. The higher values of the balanced nutrient uptake requirements predicted by the QUEFTS model may have been the results of over fertilization practices in the farmland areas in China.
The removal of the nutrient from the pods or harvested plant parts must be replenished in the soil in order to maintain soil fertility. Guidance for appropriate fertilizer recommendations has been provided in many practical algorithms [31]. The removal of nutrient from the peanut pods was simulated by the QUEFTS model in this study, as shown in Figure 4. It can be seen in the figure that linear increases in pod yields had occurred in the cases where the grain nutrient were balanced until pod yields reached approximately 60% to 70% of the potential pod yield. The balanced N, P, and K removal amounts to produce 1000 kg of pods were determined to be 29.4 kg N, 2.9 kg P, and 4.9 kg K, respectively (N:P:K = 10.2:1.0:1.7). It was found that when compared to balanced nutrient requirements of the total plants, approximately 79.5%, 67.4%, and 34.7% of N, P, and K had accumulated in the pods and were removed. Therefore, these values should be considered in order to sustain soil fertility when formulating fertilizer recommendations for peanut crops.

3.4. Validation of the QUEFTS Model

The validations of the QUEFTS model’s results were evaluated by R2, RMSE, and n-RMSE with respect to the estimation of the nutrient uptake requirements for peanut crops. The data obtained during this study’s 2018 field experiments were analyzed. There was found to be a satisfactory agreement between the simulated values of the QUEFTS model and the observed data from the field experiments of five peanut agro-ecological regions in China. As shown in Figure 5, the scatter plots between the observed and simulated values distributed near the 1:1 line, with R2 of 0.89, 0.64, and 0.32; RMSE of N, P, and K of 34.6, 3.9, and 18.3 kg/ha; and n-RMSE values of N, P, and K of 17.3%, 21.3%, and 29.5%, respectively. However, the restrictions other than the nutritional limitations were determined to be unavoidable in the on-farm field experiments, such as disease, pests, drought, and tillage treatments, which may have accounted for the slight underrating and overrating results obtained by the QUEFTS model. Generally speaking, it was found in this study that the QUEFTS model could be effectively used to predict the nutrient requirements for peanut crops with generic applicability and robust accuracy.

4. Conclusions

In this study, a database for peanut yields and nutrient uptake requirements was preliminarily established, and the results obtained demonstrated that the QUEFTS model could be used as an effective tool to simulate the nutrient uptake requirements for certain peanut pod yield targets. The QUEFTS model had predicted linear increases in pod yields if the nutrient were taken up to the balanced amounts of 38.4 kg N, 4.3 kg P, and 14.0 kg K, in order for the total plants to produce 1000 kg of peanut pods. This was observed to be in effect until the yields reached approximately 60% to 70% of the potential yield, and the corresponding optimal IE values were 26.0 kg pod/kg N, 235.0 kg pod/kg P, and 71.6 kg pod/kg K, respectively, for the balanced nutrition. This study’s field validations verified that the QUEFTS model could potentially be a promising and cost-effective tool to support the future formulations of optimal fertilizer recommendation strategies for peanut crops in China. Therefore, it was recommended that the database should be expanded to include more data, such as increased peanut varieties, agricultural environmental conditions, cropping systems, and so on in future research.

Author Contributions

Conceptualization: M.X. and Z.W.; Methodology: M.X. and X.X.; Validation: M.X.; Data curation: X.Z. and H.L.; Writing, including original draft preparation: M.X.; Writing, including review and editing: Z.W., X.X. and P.S.; Project administration: Z.W.; and funding acquisition: Z.W. All authors have read and agreed to the published version of the manuscript.

Funding

This research was funded by the National Key Research and Development Program of China (Grant number 2016YFD0200102) and the Jilin Province Science and Technology Development Plan (Grant number 20190301057NY).

Conflicts of Interest

The authors declare no conflict of interest in this research study.

References

  1. Akram, N.A.; Shafiq, F.; Ashraf, M. Peanut (Arachis hypogaea L.): A Prospective Legume Crop to Offer Multiple Health Benefits Under Changing Climate. Compr. Rev. Food Sci. Food Saf. 2018, 17, 1325–1338. [Google Scholar] [CrossRef] [Green Version]
  2. Xie, X.-G.; Zhang, F.-M.; Wang, X.-X.; Li, X.-G.; Dai, C.-C. Phomopsis liquidambari colonization promotes continuous cropping peanut growth by improving the rhizosphere microenvironment, nutrient uptake and disease incidence. J. Sci. Food Agric. 2019, 99, 1898–1907. [Google Scholar] [CrossRef]
  3. FAOSTAT. Food and Agriculture Organization of the United Nations. Available online: http://www.fao.org (accessed on 1 November 2019).
  4. Li, Y.; Fang, F.; Wei, J.; Wu, X.; Cui, R.; Li, G.; Zheng, F.; Tan, D. Humic acid fertilizer improved soil properties and soil microbial diversity of continuous cropping peanut: A three-year experiment. Sci. Rep. 2019, 9, 12014. [Google Scholar] [CrossRef] [PubMed] [Green Version]
  5. Basu, M.; Bhadoria, P.B.S.; Mahapatra, S.C. Growth, nitrogen fixation, yield and kernel quality of peanut in response to lime, organic and inorganic fertilizer levels. Bioresour. Technol. 2008, 99, 4675–4683. [Google Scholar] [CrossRef] [PubMed]
  6. Fang, Z.; Zhao, X.; Li, J. The status analysis of fertilizer application on peanut in different region of Shandong province. Chin. Agric. Sci. Bull. 2009, 25, 129–133. [Google Scholar]
  7. Sun, J.; Huang, X.; Zhao, L.; Wang, Y.; Miao, Y. Combined application of N, P and K affecting yield and nutrient absorption of peanut in fluvo-aquic soil. Chin. Agric. Sci. Bull. 2018, 34, 23–26. [Google Scholar]
  8. Zhang, X. A plan for efficient use of nitrogen fertilizers. Nature 2017, 543, 322. [Google Scholar] [CrossRef]
  9. van Noordwijk, M.; Cadisch, G. Access and excess problems in plant nutrition. In Progress in Plant Nutrition: Plenary Lectures of the XIV International Plant Nutrition Colloquium: Food Security and Sustainability of Agro-Ecosystems through Basic and Applied Research; Horst, W.J., Bürkert, A., Claassen, N., Flessa, H., Frommer, W.B., Goldbach, H., Merbach, W., Olfs, H.W., Römheld, V., Sattelmacher, B., et al., Eds.; Springer: Dordrecht, The Netherlands, 2002; pp. 25–40. [Google Scholar] [CrossRef]
  10. Setiyono, T.D.; Walters, D.T.; Cassman, K.G.; Witt, C.; Dobermann, A. Estimating maize nutrient uptake requirements. Field Crop. Res. 2010, 118, 158–168. [Google Scholar] [CrossRef]
  11. Van Keulen, H. Nitrogen Requirements of Rice with Special Reference to JAVA; Ministry of Agriculture, Agricultural Technical Assistance Programme: Bogor, Indonesia, 1977.
  12. Janssen, B.H.; Guiking, F.C.T.; van der Eijk, D.; Smaling, E.M.A.; Wolf, J.; van Reuler, H. A system for quantitative evaluation of the fertility of tropical soils (QUEFTS). Geoderma 1990, 46, 299–318. [Google Scholar] [CrossRef] [Green Version]
  13. Smaling, E.M.A.; Janssen, B.H. Calibration of quefts, a model predicting nutrient uptake and yields from chemical soil fertility indices. Geoderma 1993, 59, 21–44. [Google Scholar] [CrossRef]
  14. Sattari, S.Z.; van Ittersum, M.K.; Bouwman, A.F.; Smit, A.L.; Janssen, B.H. Crop yield response to soil fertility and N, P, K inputs in different environments: Testing and improving the QUEFTS model. Field Crop. Res. 2014, 157, 35–46. [Google Scholar] [CrossRef]
  15. Xu, X.; He, P.; Pampolino, M.F.; Chuan, L.; Johnston, A.M.; Qiu, S.; Zhao, S.; Zhou, W. Nutrient requirements for maize in China based on QUEFTS analysis. Field Crop. Res. 2013, 150, 115–125. [Google Scholar] [CrossRef]
  16. Xu, X.; Xie, J.; Hou, Y.; He, P.; Pampolino, M.F.; Zhao, S.; Qiu, S.; Johnston, A.M.; Zhou, W. Estimating nutrient uptake requirements for rice in China. Field Crop. Res. 2015, 180, 37–45. [Google Scholar] [CrossRef]
  17. Witt, C.; Dobermann, A.; Abdulrachman, S.; Gines, H.C.; Guanghuo, W.; Nagarajan, R.; Satawatananont, S.; Thuc Son, T.; Sy Tan, P.; Van Tiem, L.; et al. Internal nutrient efficiencies of irrigated lowland rice in tropical and subtropical Asia. Field Crop. Res. 1999, 63, 113–138. [Google Scholar] [CrossRef]
  18. Liu, M.; Yu, Z.; Liu, Y.; Konijn, N.T. Fertilizer requirements for wheat and maize in China: The QUEFTS approach. Nutr. Cycl. Agroecosystems 2006, 74, 245–258. [Google Scholar] [CrossRef] [Green Version]
  19. Chuan, L.; He, P.; Jin, J.; Li, S.; Grant, C.; Xu, X.; Qiu, S.; Zhao, S.; Zhou, W. Estimating nutrient uptake requirements for wheat in China. Field Crop. Res. 2013, 146, 96–104. [Google Scholar] [CrossRef]
  20. Jiang, W.; Liu, X.; Wang, X.; Yin, Y. Characteristics of Yield and Harvest Index, and Evaluation of Balanced Nutrient Uptake of Soybean in Northeast China. Agronomy 2019, 9, 310. [Google Scholar] [CrossRef] [Green Version]
  21. Yang, F.; Xu, X.; Wang, W.; Ma, J.; Wei, D.; He, P.; Pampolino, M.F.; Johnston, A.M. Estimating nutrient uptake requirements for soybean using QUEFTS model in China. PLoS ONE 2017, 12, e0177509. [Google Scholar] [CrossRef]
  22. Kumar, P.; Byju, G.; Singh, B.P.; Minhas, J.S.; Dua, V.K. Application of QUEFTS Model for Site-Specific Nutrient Management of NPK in Sweet Potato (Ipomoea batatas L. Lam). Commun. Soil Sci. Plant Anal. 2016, 47, 1599–1611. [Google Scholar] [CrossRef]
  23. Zhang, J.; He, P.; Ding, W.; Xu, X.; Ullah, S.; Abbas, T.; Ai, C.; Li, M.; Cui, R.; Jin, C. Estimating nutrient uptake requirements for radish in China based on QUEFTS model. Sci. Rep. 2019, 9, 1–10. [Google Scholar] [CrossRef] [Green Version]
  24. Xu, X.; He, P.; Pampolino, M.F.; Johnston, A.M.; Qiu, S.; Zhao, S.; Chuan, L.; Zhou, W. Fertilizer recommendation for maize in China based on yield response and agronomic efficiency. Field Crop. Res. 2014, 157, 27–34. [Google Scholar] [CrossRef]
  25. Shen, P.; Wang, C.; Wu, Z.; Wang, C.; Zhao, H.; Shan, S.; Wu, M.; Sun, X.; Yu, T.; Zheng, Y.; et al. Peanut macronutrient absorptions characteristics in response to soil compaction stress in typical brown soils under various tillage systems. Soil Sci. Plant Nutr. 2019, 65, 148–158. [Google Scholar] [CrossRef]
  26. Pampolino, M.F.; Witt, C.; Pasuquin, J.M.; Johnston, A.; Fisher, M.J. Development approach and evaluation of the Nutrient Expert software for nutrient management in cereal crops. Comput. Electron. Agric. 2012, 88, 103–110. [Google Scholar] [CrossRef]
  27. Shehu, B.M.; Lawan, B.A.; Jibrin, J.M.; Kamara, A.Y.; Mohammed, I.B.; Rurinda, J.; Zingore, S.; Craufurd, P.; Vanlauwe, B.; Adam, A.M.; et al. Balanced nutrient requirements for maize in the Northern Nigerian Savanna: Parameterization and validation of QUEFTS model. Field Crops Res. 2019, 241, 107585. [Google Scholar] [CrossRef]
  28. Shen, P.; Wu, Z.; Wang, C.; Luo, S.; Zheng, Y.; Yu, T.; Sun, X.; Sun, X.; Wang, C.; He, X. Contributions of rational soil tillage to compaction stress in main peanut producing areas of China. Sci. Rep. 2016, 6, 38629. [Google Scholar] [CrossRef] [Green Version]
  29. Chen, M.; Li, X.; Yang, Q.; Chi, X.; Pan, L.; Chen, N.; Yang, Z.; Wang, T.; Wang, M.; Yu, S. Dynamic Succession of Soil Bacterial Community during Continuous Cropping of Peanut (Arachis hypogaea L.). PLoS ONE 2014, 9, e101355. [Google Scholar] [CrossRef]
  30. Fang, Z.G.; Zhao, X.F. Nutrient absorption and distribution characteristics of different peanut varieties in Jiaodong peninsula. J. Plant Nutr. Fertil. 2015, 21, 241–250. [Google Scholar]
  31. Dobermann, A.; Cassman, K.G. Plant nutrient management for enhanced productivity in intensive grain production systems of the United States and Asia. Plant Soil 2002, 247, 153–175. [Google Scholar] [CrossRef]
Figure 1. Distribution of experimental plots for peanut in China.
Agronomy 10 00119 g001
Figure 2. Distributions of the pod yields and the harvesting index of peanut crops conducted in China.
Agronomy 10 00119 g002
Figure 3. Peanut pod yields in relation to the plant nutrient uptake at different (a, d) constants. In the figure, the calculations excluded the upper and lower 2.5th (Set I), 5th (Set II), and 7.5th (Set III) percentiles of all the IE data (HI range from 0.4 to 0.82); YD, YA, and YU represent the maximum dilution, maximum accumulation, and balanced uptake of N, P, and K in plant dry matter, respectively; Potential yield was set at 10 t/ha.
Agronomy 10 00119 g003
Figure 4. Relationships between pod yields and the N, P, and K accumulations in the total dry plant matter at maturity (ac), and the N, P, and K removal in the pods (df) under different potential yields predicted by the quantitative evaluation of fertility of tropical soils (QUEFTS) model. In the figure, YD, YA, and YU represent the maximum dilution, maximum accumulation, and balanced uptake of the N, P, and K in the total dry plant matter or in the pod dry matter, respectively; These parameters were calculated by the QUEFTS model after excluding the upper and lower 2.5th percentiles of all the internal efficiency data (HI range: 0.4 to 0.82; and potential pod yield range: 6 to 10 t/ha.
Agronomy 10 00119 g004
Figure 5. Comparisons of the simulated and observed data of the N, P, and K uptake in the total peanut dry plant matter in 2018. The observed data were obtained from the experimental field plots where a Nutrient Expert (NE) Decision Support System was applied; and the simulated nutrient uptake data were estimated using the QUEFTS model.
Agronomy 10 00119 g005
Table 1. Characteristic statistics of the pod yields (10.0% moisture content) and nutrient uptake data at maturity for China’s peanut crops.
ParameterUnitN 1SDMeanMin.25% Q 2Med.75% QMax.
Pod yieldkg/ha251312783918 500 3018 3864 4650 8602
Haulmkg/ha593 1557 3328 687 2202 2979 4208 8879
Harvest Indexkg/kg593 0.08 0.51 0.31 0.46 0.51 0.56 0.82
[N] in podg/kg590 6.1 35.6 13.9 31.5 34.9 39.6 64.5
[P] in podg/kg530 0.98 3.6 1.6 3.0 3.4 4.0 8.2
[K] in podg/kg515 2.4 7.1 2.2 5.5 6.8 8.2 17.3
[N] in haulmg/kg502 3.7 14.2 6.9 11.8 14.0 16.2 38.4
[P] in haulmg/kg486 0.69 1.7 0.31 1.2 1.5 2.2 4.0
[K] in haulmg/kg472 6.8 12.9 2.1 7.7 11.5 17.0 35.8
N uptake podkg/ha481 45.2 120.3 24.5 91.2 115.5 144.5 267.6
P uptake podkg/ha458 4.5 11.6 1.7 9.0 11.0 13.7 27.4
K uptake podkg/ha466 9.0 22.6 2.6 17.1 21.7 28.2 48.4
N uptake haulmkg/ha421 27.7 49.1 7.7 29.1 42.1 65.4 209.1
P uptake haulmkg/ha407 3.7 5.7 0.75 3.0 4.6 7.3 24.5
K uptake haulmkg/ha401 29.8 42.0 3.6 21.2 35.5 55.7 193.9
N uptake totalkg/ha586 64.6 163.6 30.1 117.9 155.1 203.5 456.7
P uptake totalkg/ha530 8.8 17.8 2.8 11.5 15.9 21.8 51.2
K uptake totalkg/ha515 36.6 59.2 7.6 31.4 50.5 79.8 228.1
N-HI 3kg/kg421 0.09 0.72 0.24 0.66 0.73 0.77 0.90
P-HIkg/kg407 0.10 0.69 0.42 0.62 0.69 0.76 0.93
K-HIkg/kg401 0.13 0.39 0.13 0.29 0.37 0.48 0.76
1 Number of observations; 2 25% Q, Med., and 75% Q represent the 25th, 50th, and 75th percentiles of the database, respectively; 3 N-HI, nutrient harvest index of N; P-HI, nutrient harvest index of P; K-HI, nutrient harvest index of K.
Table 2. Internal efficiency (IE, kg pod/kg nutrient) and reciprocal internal efficiency (RIE, kg nutrient/t pod) values of N, P, and K in China’s peanut crops from 1993 to 2018.
ParameterUnitN 1SDMeanMin.25% Q 2Med.75% QMax.
IE-Nkg/kg5865.2 24.7 14.3 21.0 24.2 27.2 49.8
IE-Pkg/kg53066.8 238.5 89.8 199.1 230.9 271.9 483.1
IE-Kkg/kg51545.1 85.1 17.9 52.2 72.9 104.8 231.5
RIE-Nkg/t5868.3 42.2 20.1 36.8 41.4 47.6 69.9
RIE-Pkg/t5301.4 4.5 2.1 3.7 4.3 5.0 11.1
RIE-Kkg/t5157.9 15.3 4.3 9.5 13.7 19.2 55.9
1 Number of observations; 2 25% Q, Med., and 75% Q represent the 25th, 50th, and 75th percentiles of the database, respectively.
Table 3. Envelope coefficients of the maximum accumulation (a) and dilution (d) of the N, P, and K in the total peanut plants for the period ranging from 1993 to 2018 in China.
NutrientsSet ISet IISet III
a (2.5th)d (97.5th)a (5th)d (95th)a (7.5th)d (92.5th)
N17.0 35.7 17.9 30.3 18.6 29.5
P135.6 364.9 144.0 339.3 149.8 314.9
K31.3 154.4 32.4 137.4 34.2123.2
In the table, the constants a and d were calculated by excluding the upper and lower 2.5th (Set I), 5.0th (Set II), and 7.5th (Set III) percentiles of all nutrient efficiency data (HI range from 0.4 to 0.82).
Table 4. Internal efficiency, balanced nutrient requirements of N, P, and K in total plants and pods, and removal ratios at different targeted pod yields simulated by the QUEFTS model for peanut crops in China with the potential yield set at 10 t/ha.
Pod Yields (kg/ha)Plant IEs (kg/kg) 1Plant RIEs (kg/t) 2Pod RIEs (kg/t) 3Ratios in Pod (%) 4
NPKNPKNPKNPK
0 0.00 0.00 0.00 0.00 0.00 0.00 0.00 0.00 0.00 0.000.000.00
1000 26.0 235.0 71.6 38.4 4.3 14.0 29.4 2.94.9 76.567.434.7
2000 26.0 235.0 71.6 38.4 4.3 14.0 29.4 2.94.9 76.567.434.7
3000 26.0 235.0 71.6 38.4 4.3 14.0 29.4 2.94.9 76.567.434.7
4000 26.0 235.0 71.6 38.4 4.3 14.0 29.4 2.94.9 76.567.434.7
5000 26.0 235.0 71.6 38.4 4.3 14.0 29.4 2.94.9 76.567.434.7
6000 26.0 235.0 71.6 38.4 4.3 14.0 29.4 2.94.9 76.567.434.7
7000 25.8 232.8 70.9 38.8 4.3 14.1 29.4 2.94.9 75.866.834.4
8000 24.3 219.0 66.7 41.2 4.6 15.0 29.8 2.94.9 72.263.632.7
9000 21.9 197.6 60.2 45.7 5.1 16.6 32.6 3.25.4 71.462.932.4
10,000 20.6 185.7 56.6 48.6 5.4 17.7 43.1 4.27.1 88.678.040.2
1 Amount of pod yield produced per unit of nutrient accumulated in the plant dry matter; 2 Expressed as kilogram of total plant nutrient requirement (including roots, pods, and haulms) to produce per ton of pod yield; 3 Expressed as kilogram of pod nutrient requirements to produce per ton of pod yield; 4 Expressed as the ratios of nutrient in the pods of the total plants

