
Polyelectrolyte Threading through a Nanopore


Abstract
:1. Introduction
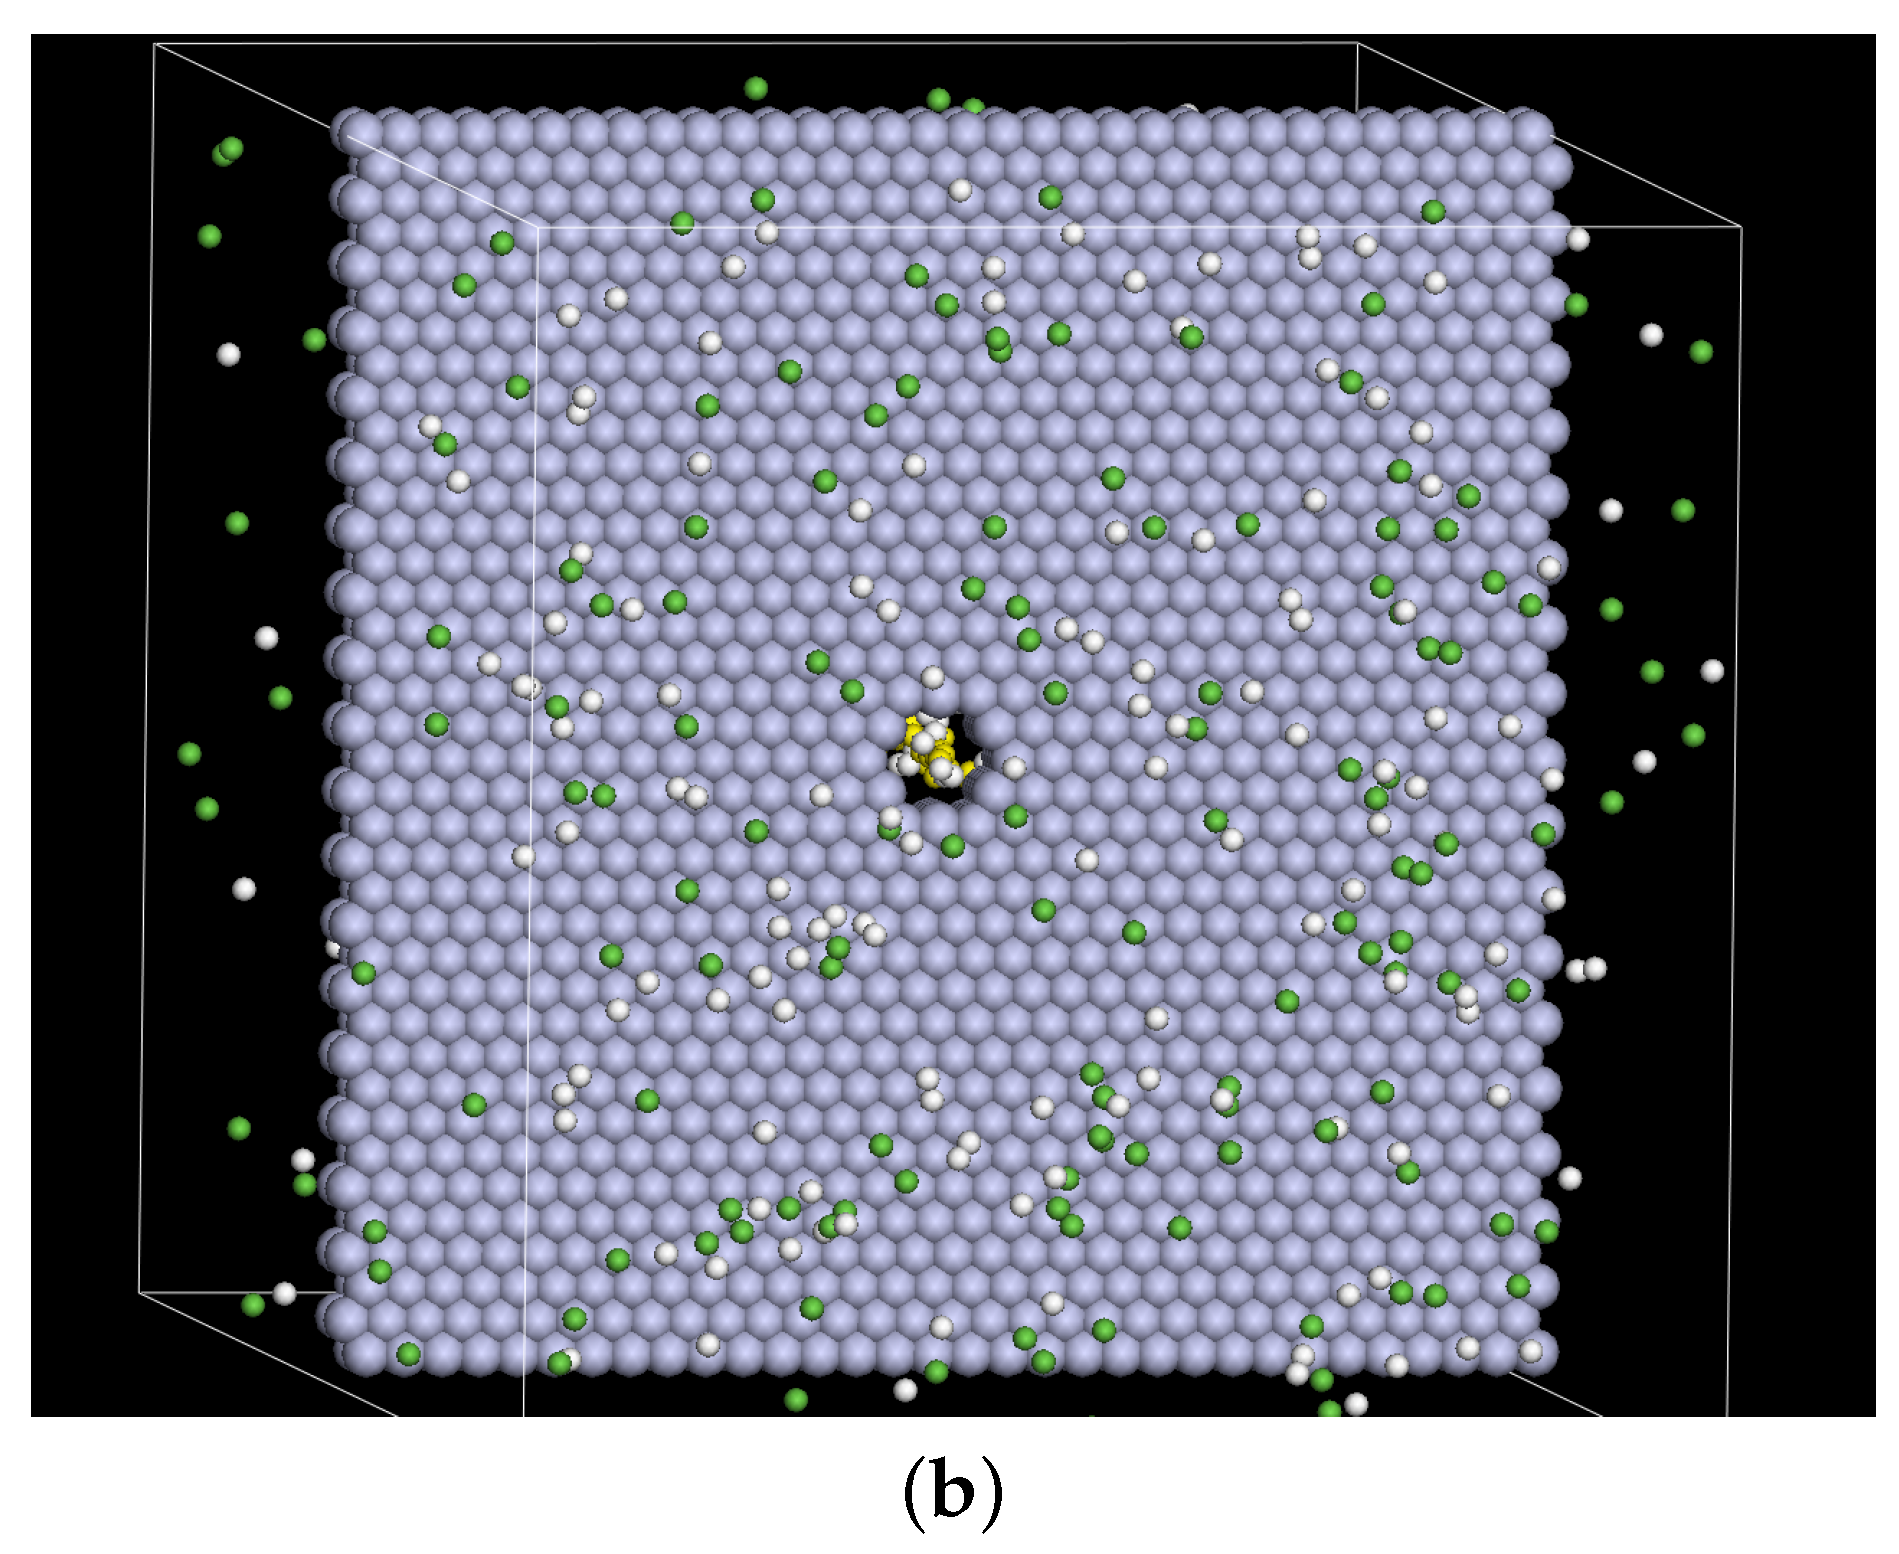
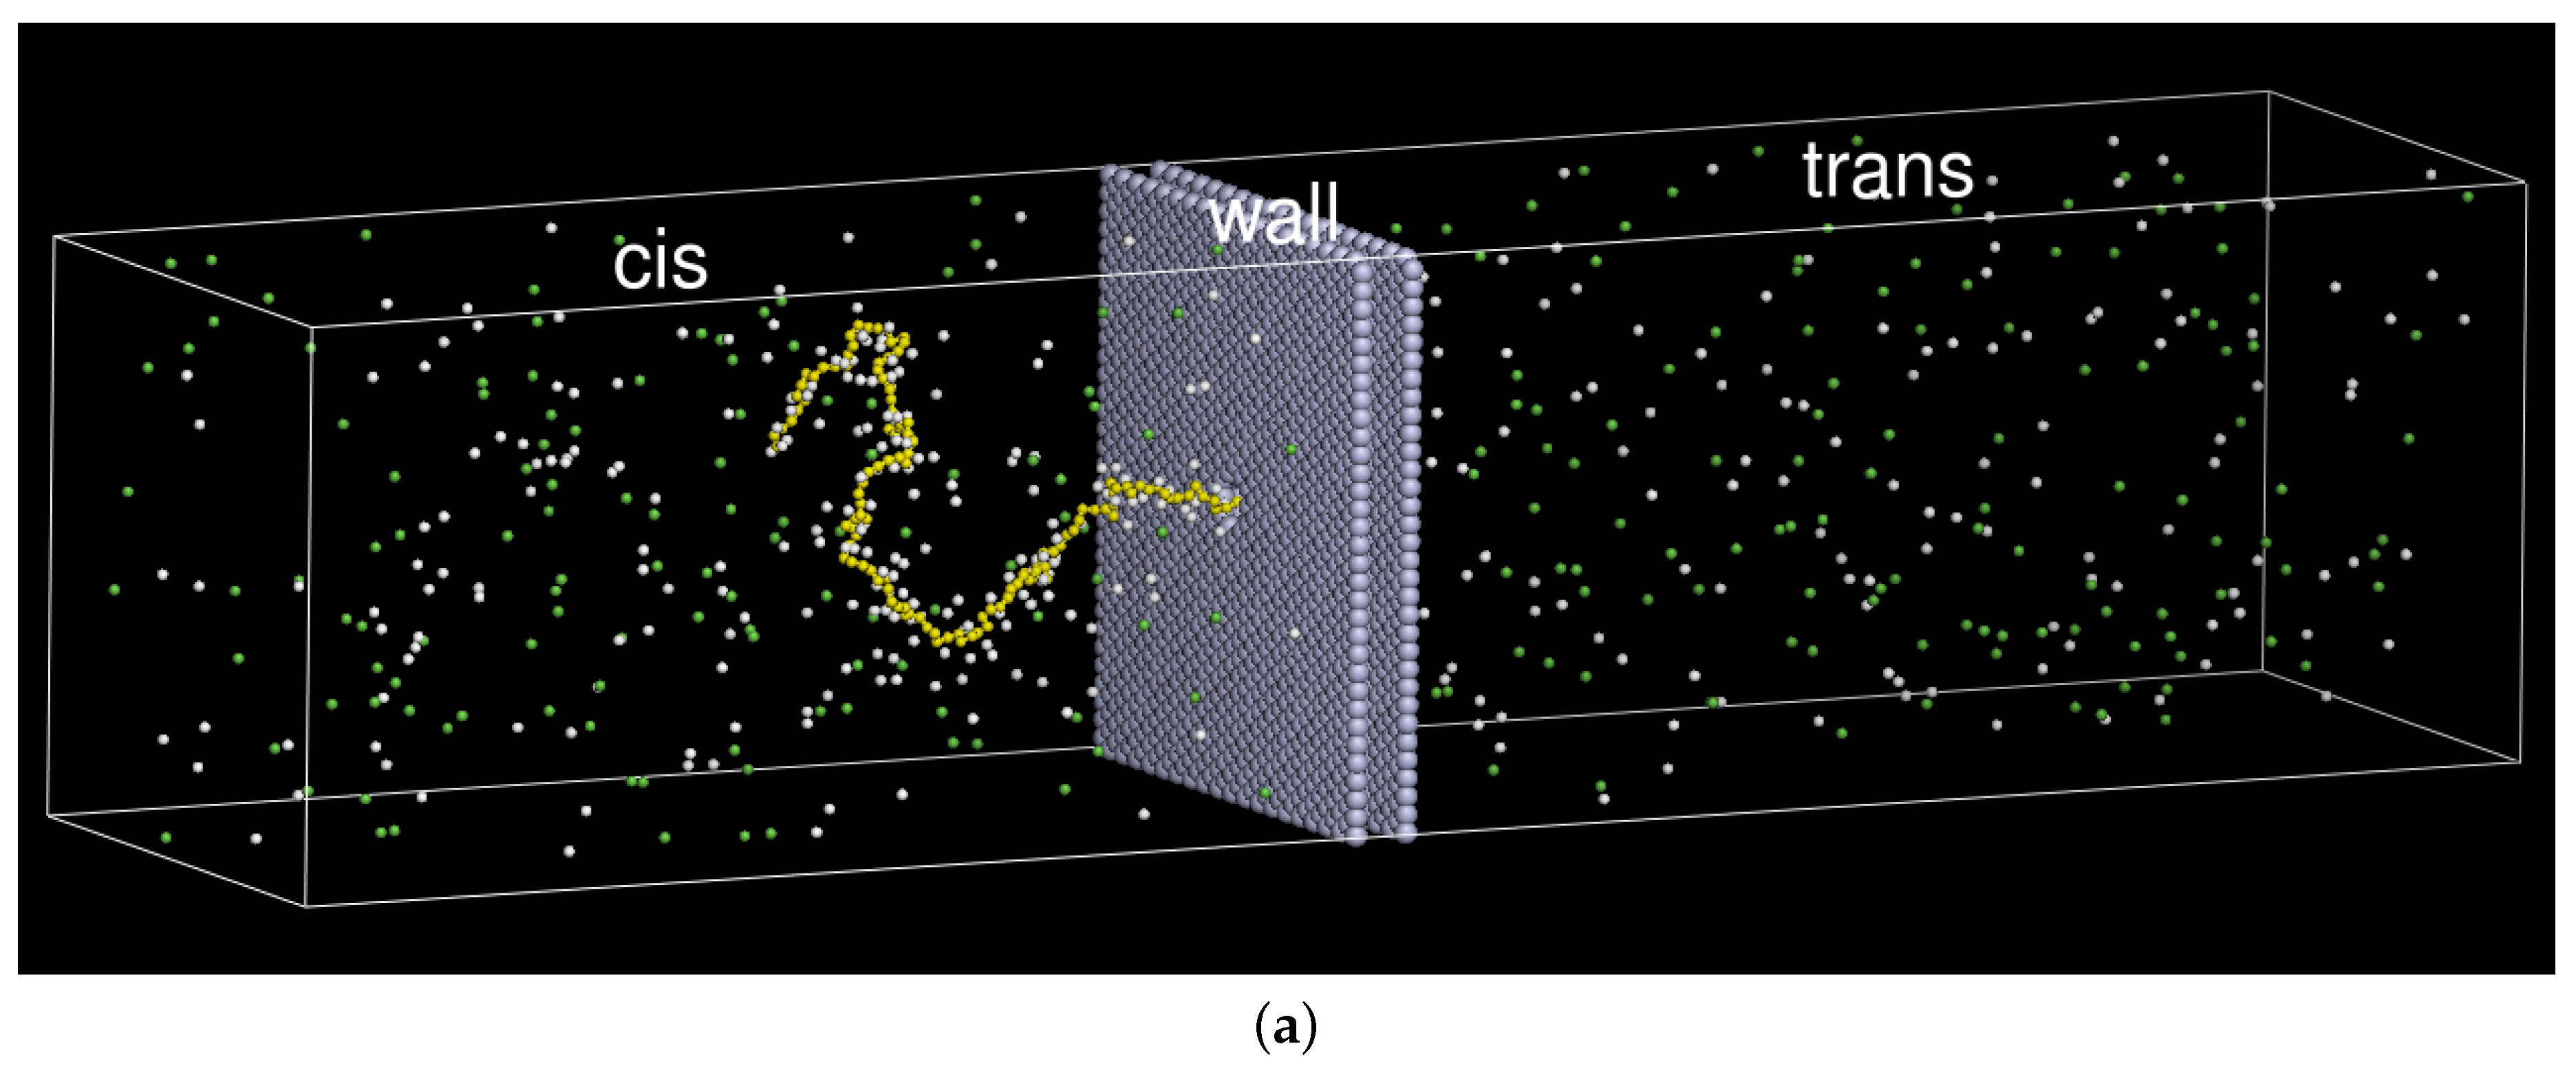
2. Model and Setup
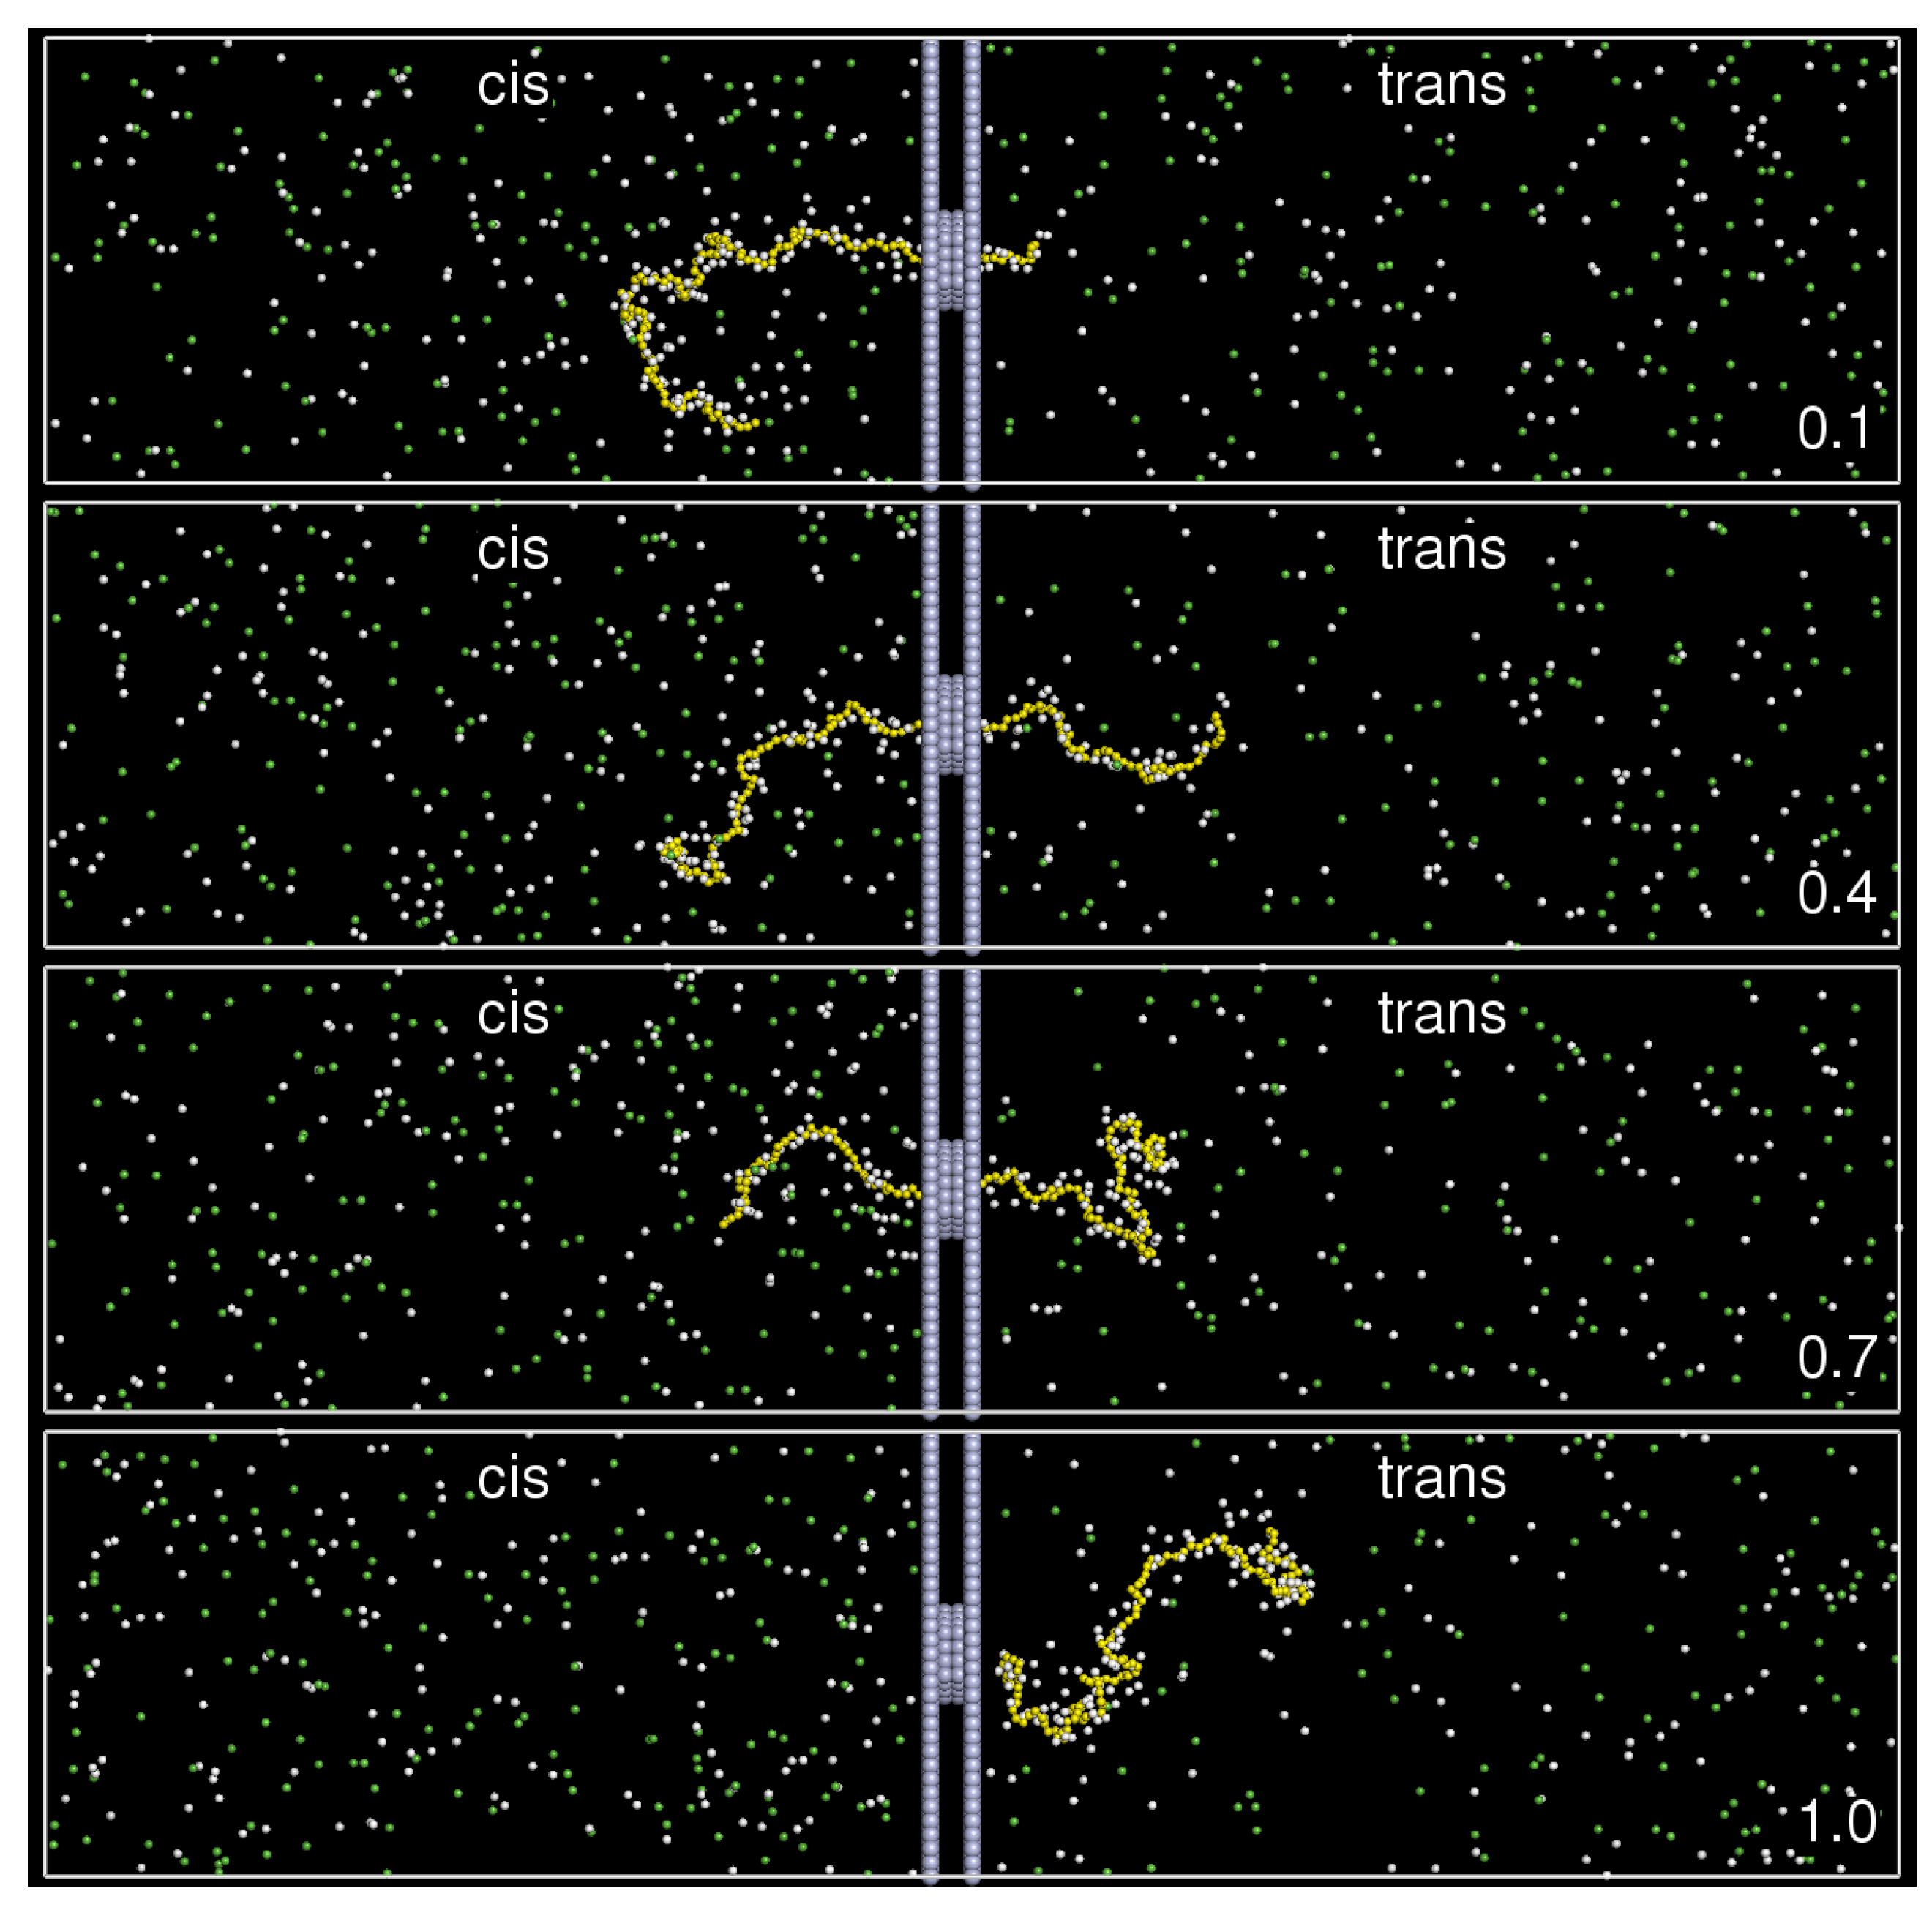
3. Results and Discussion
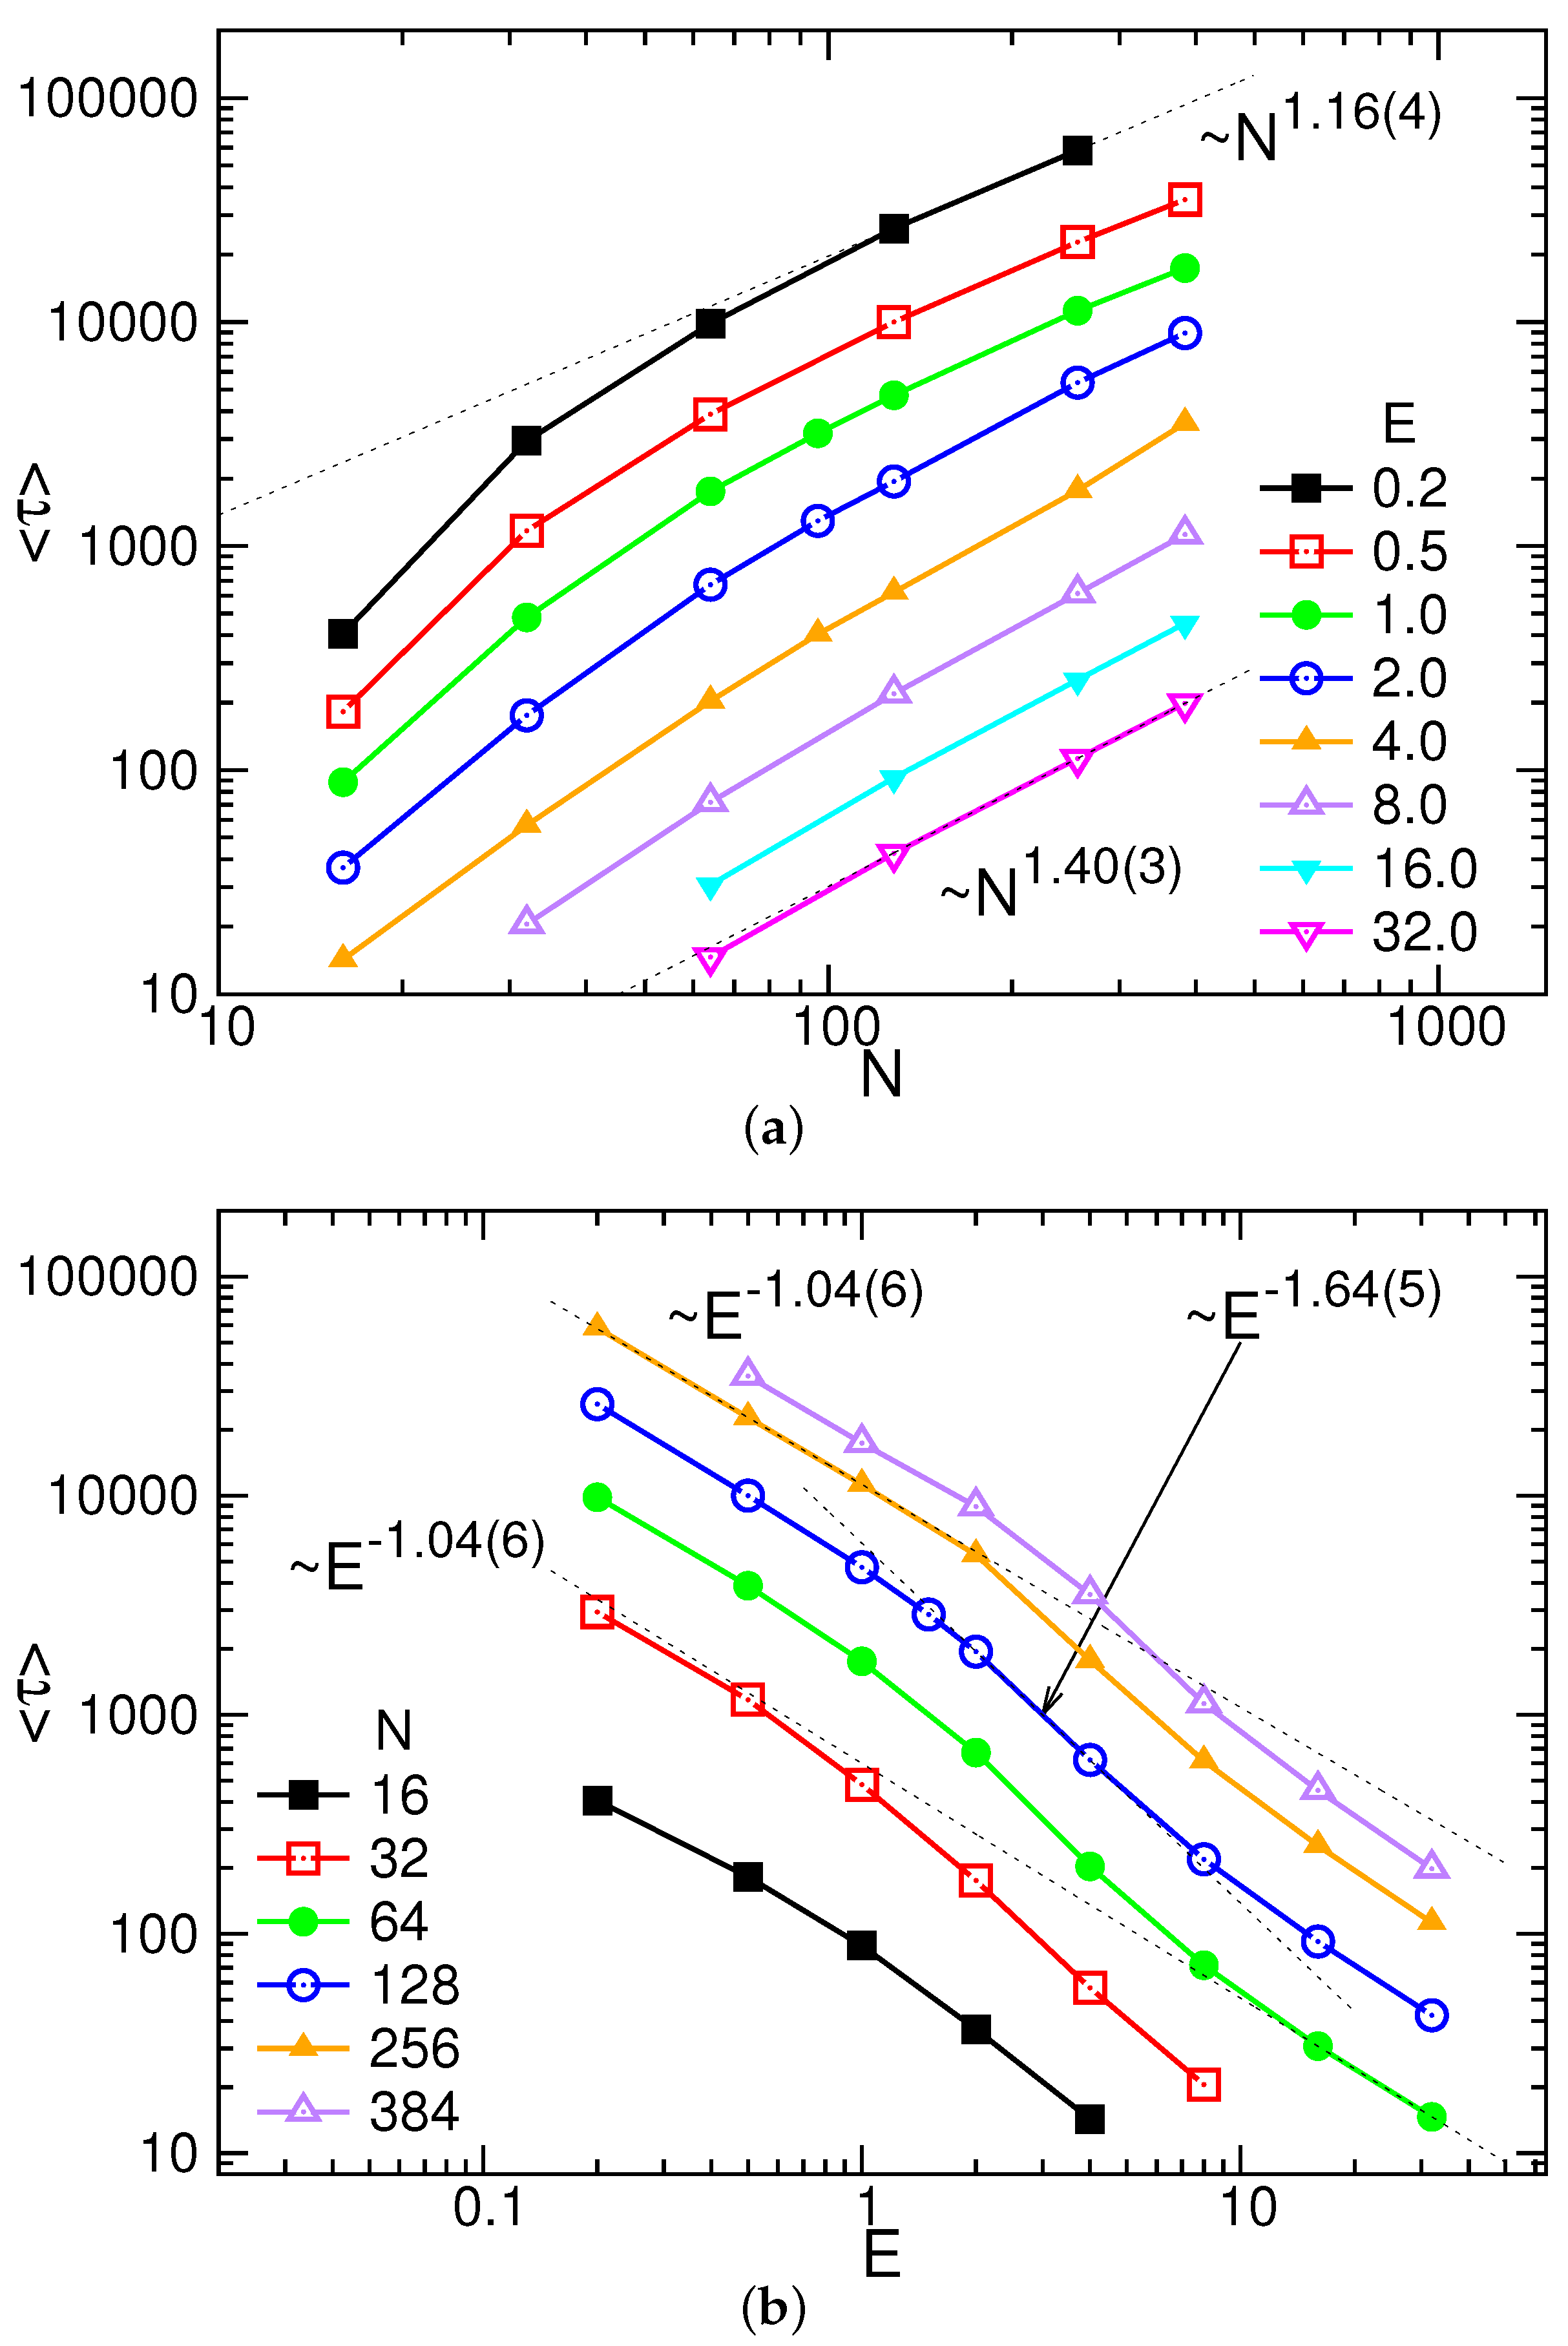
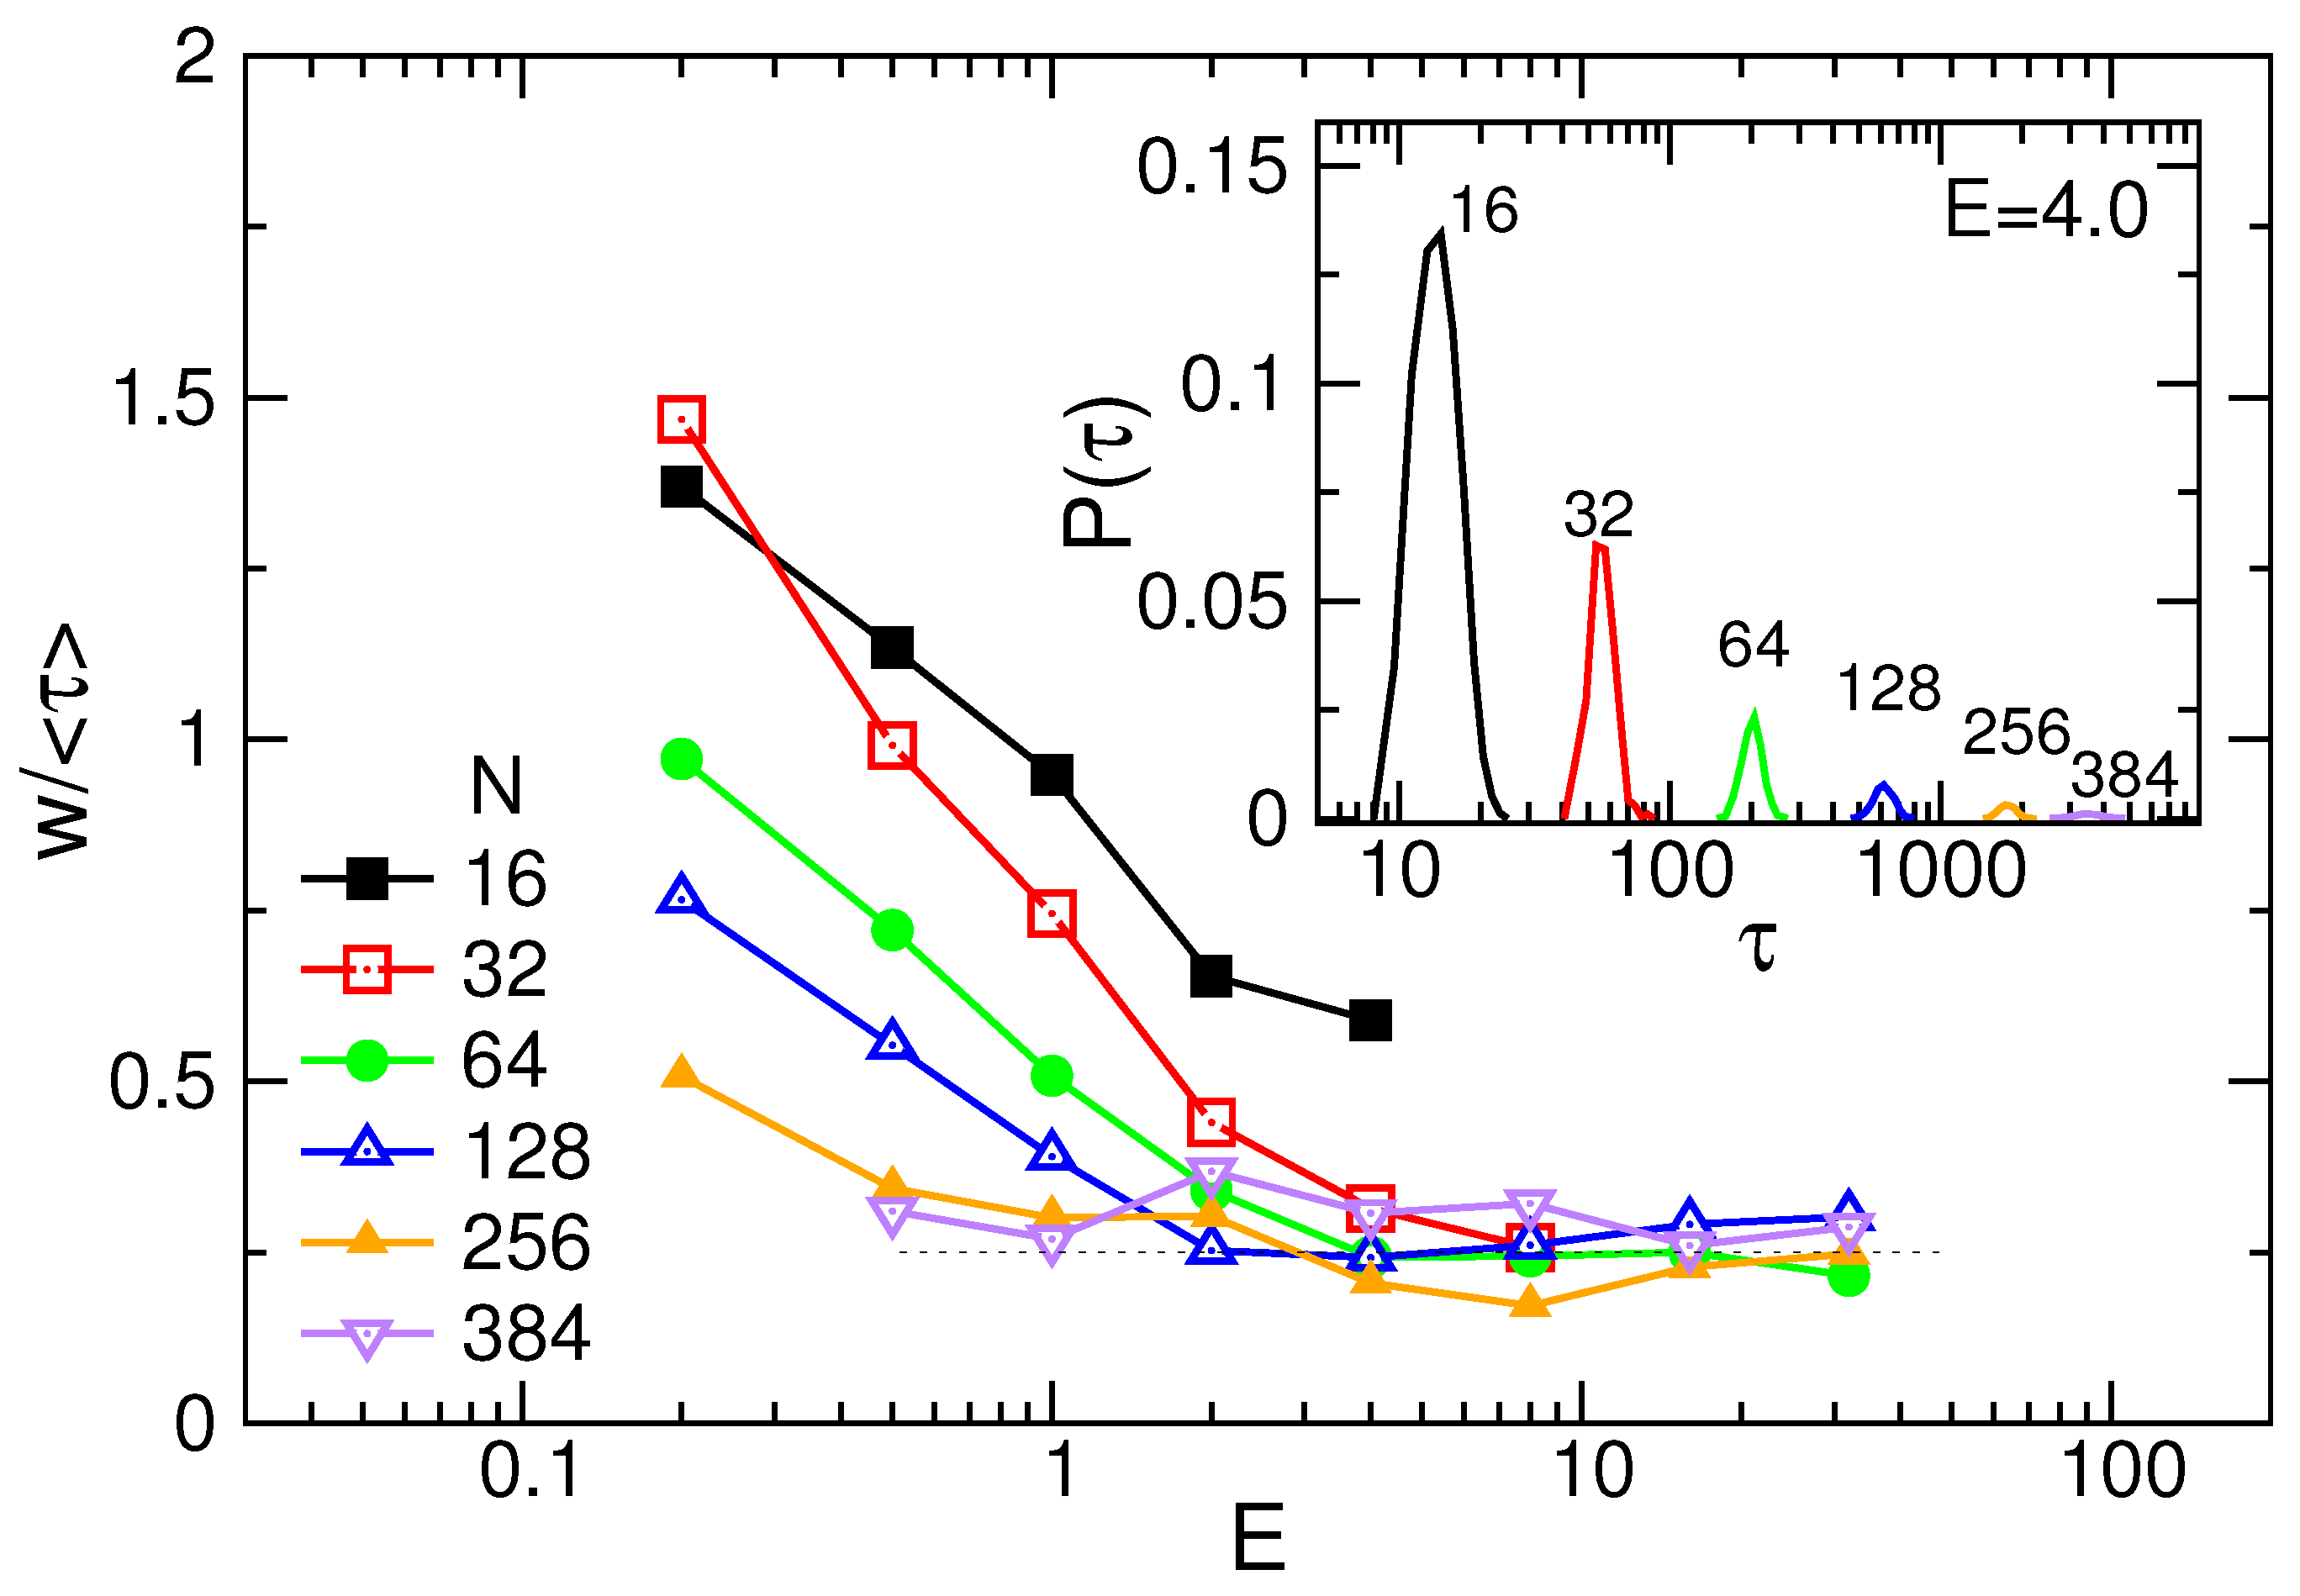
3.1. Translocation Time
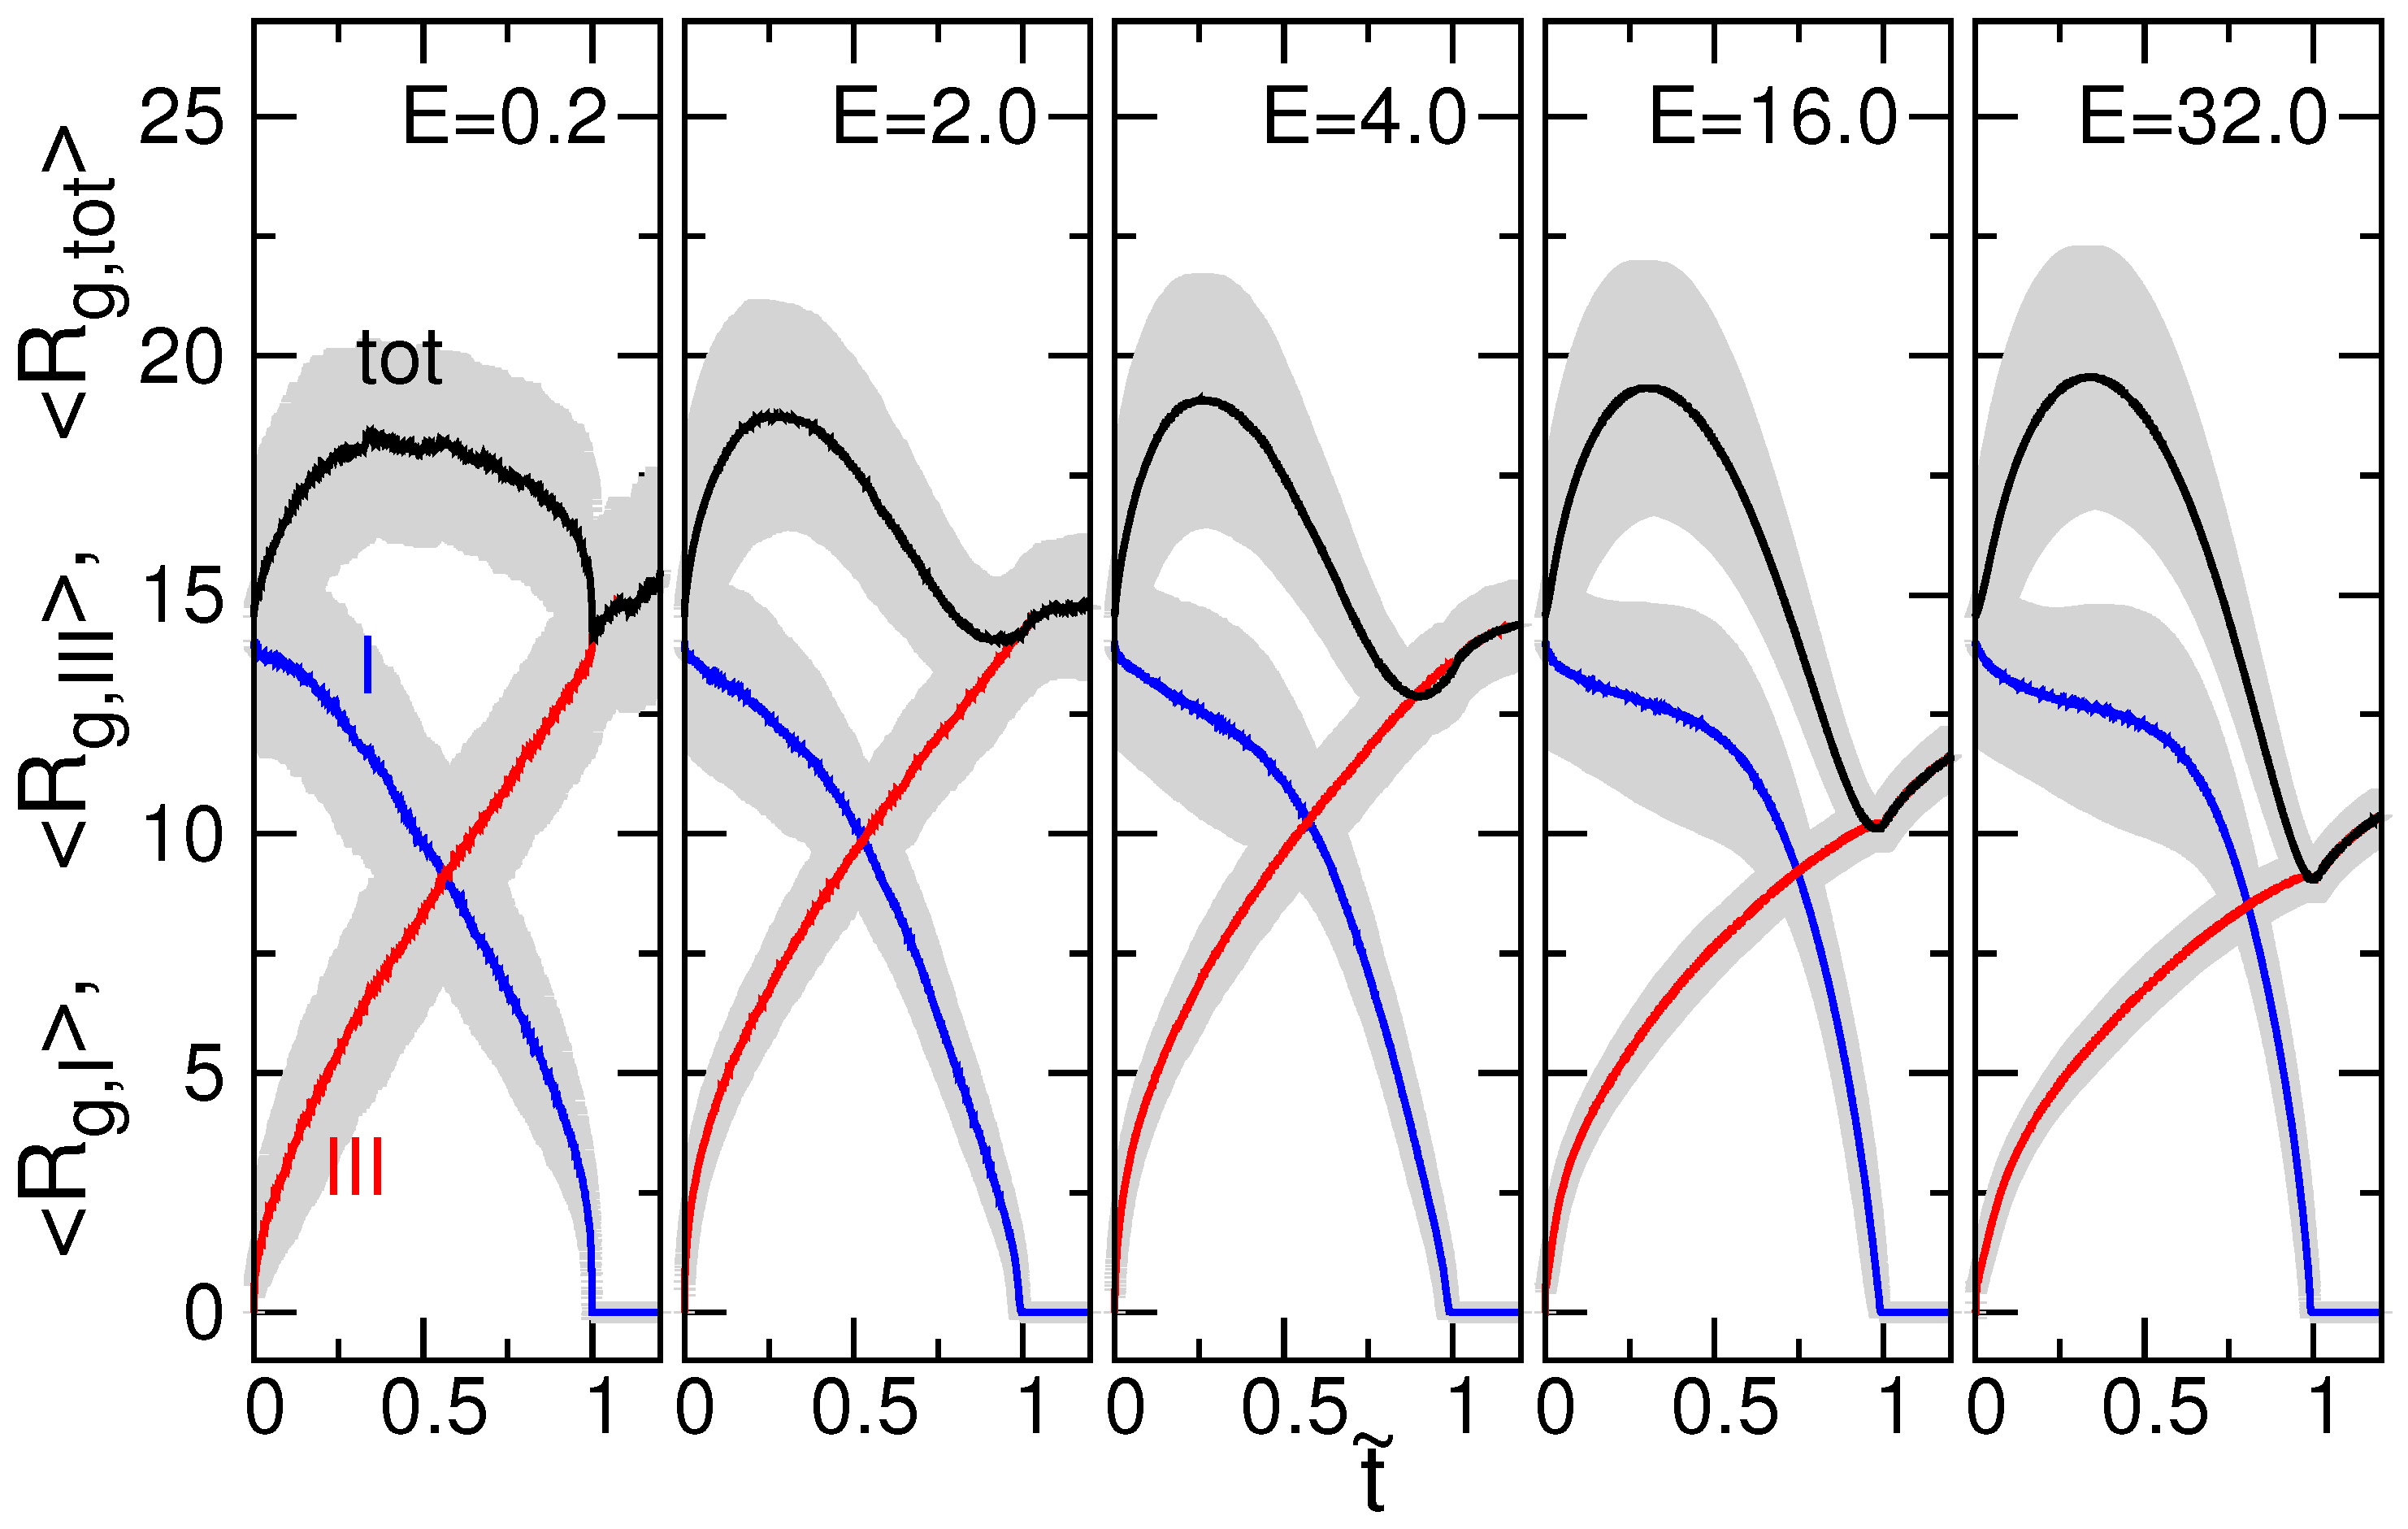
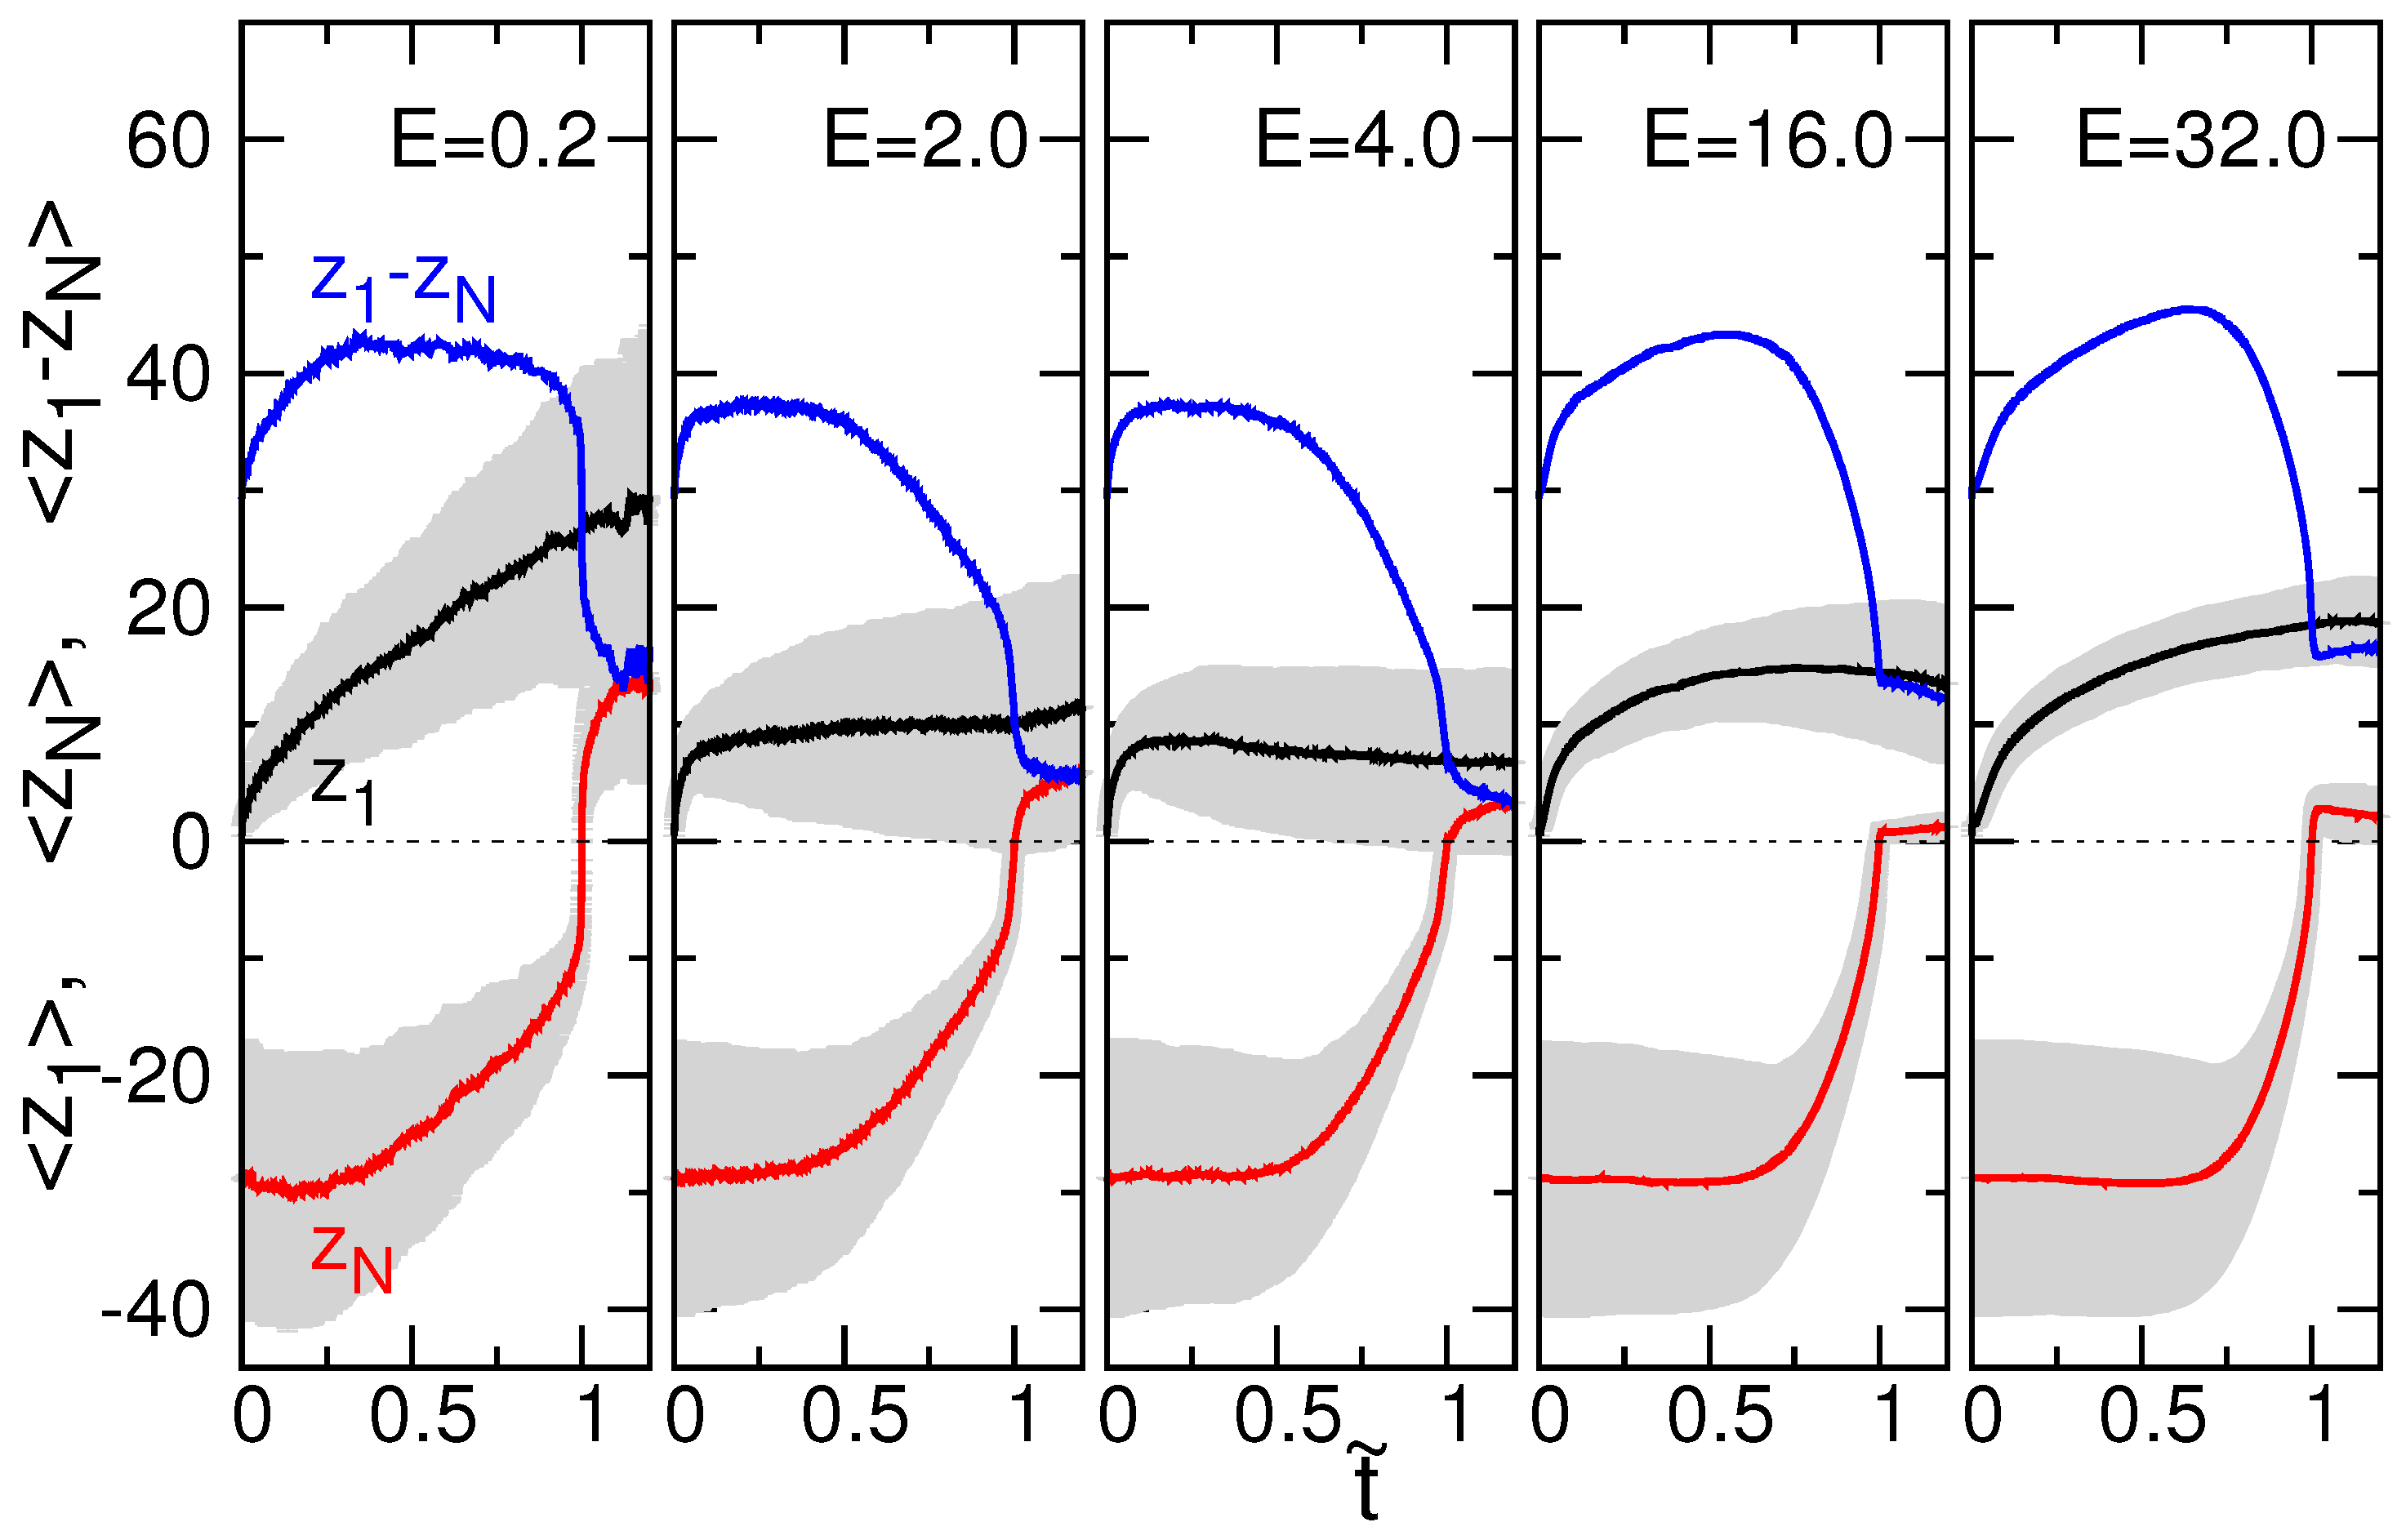
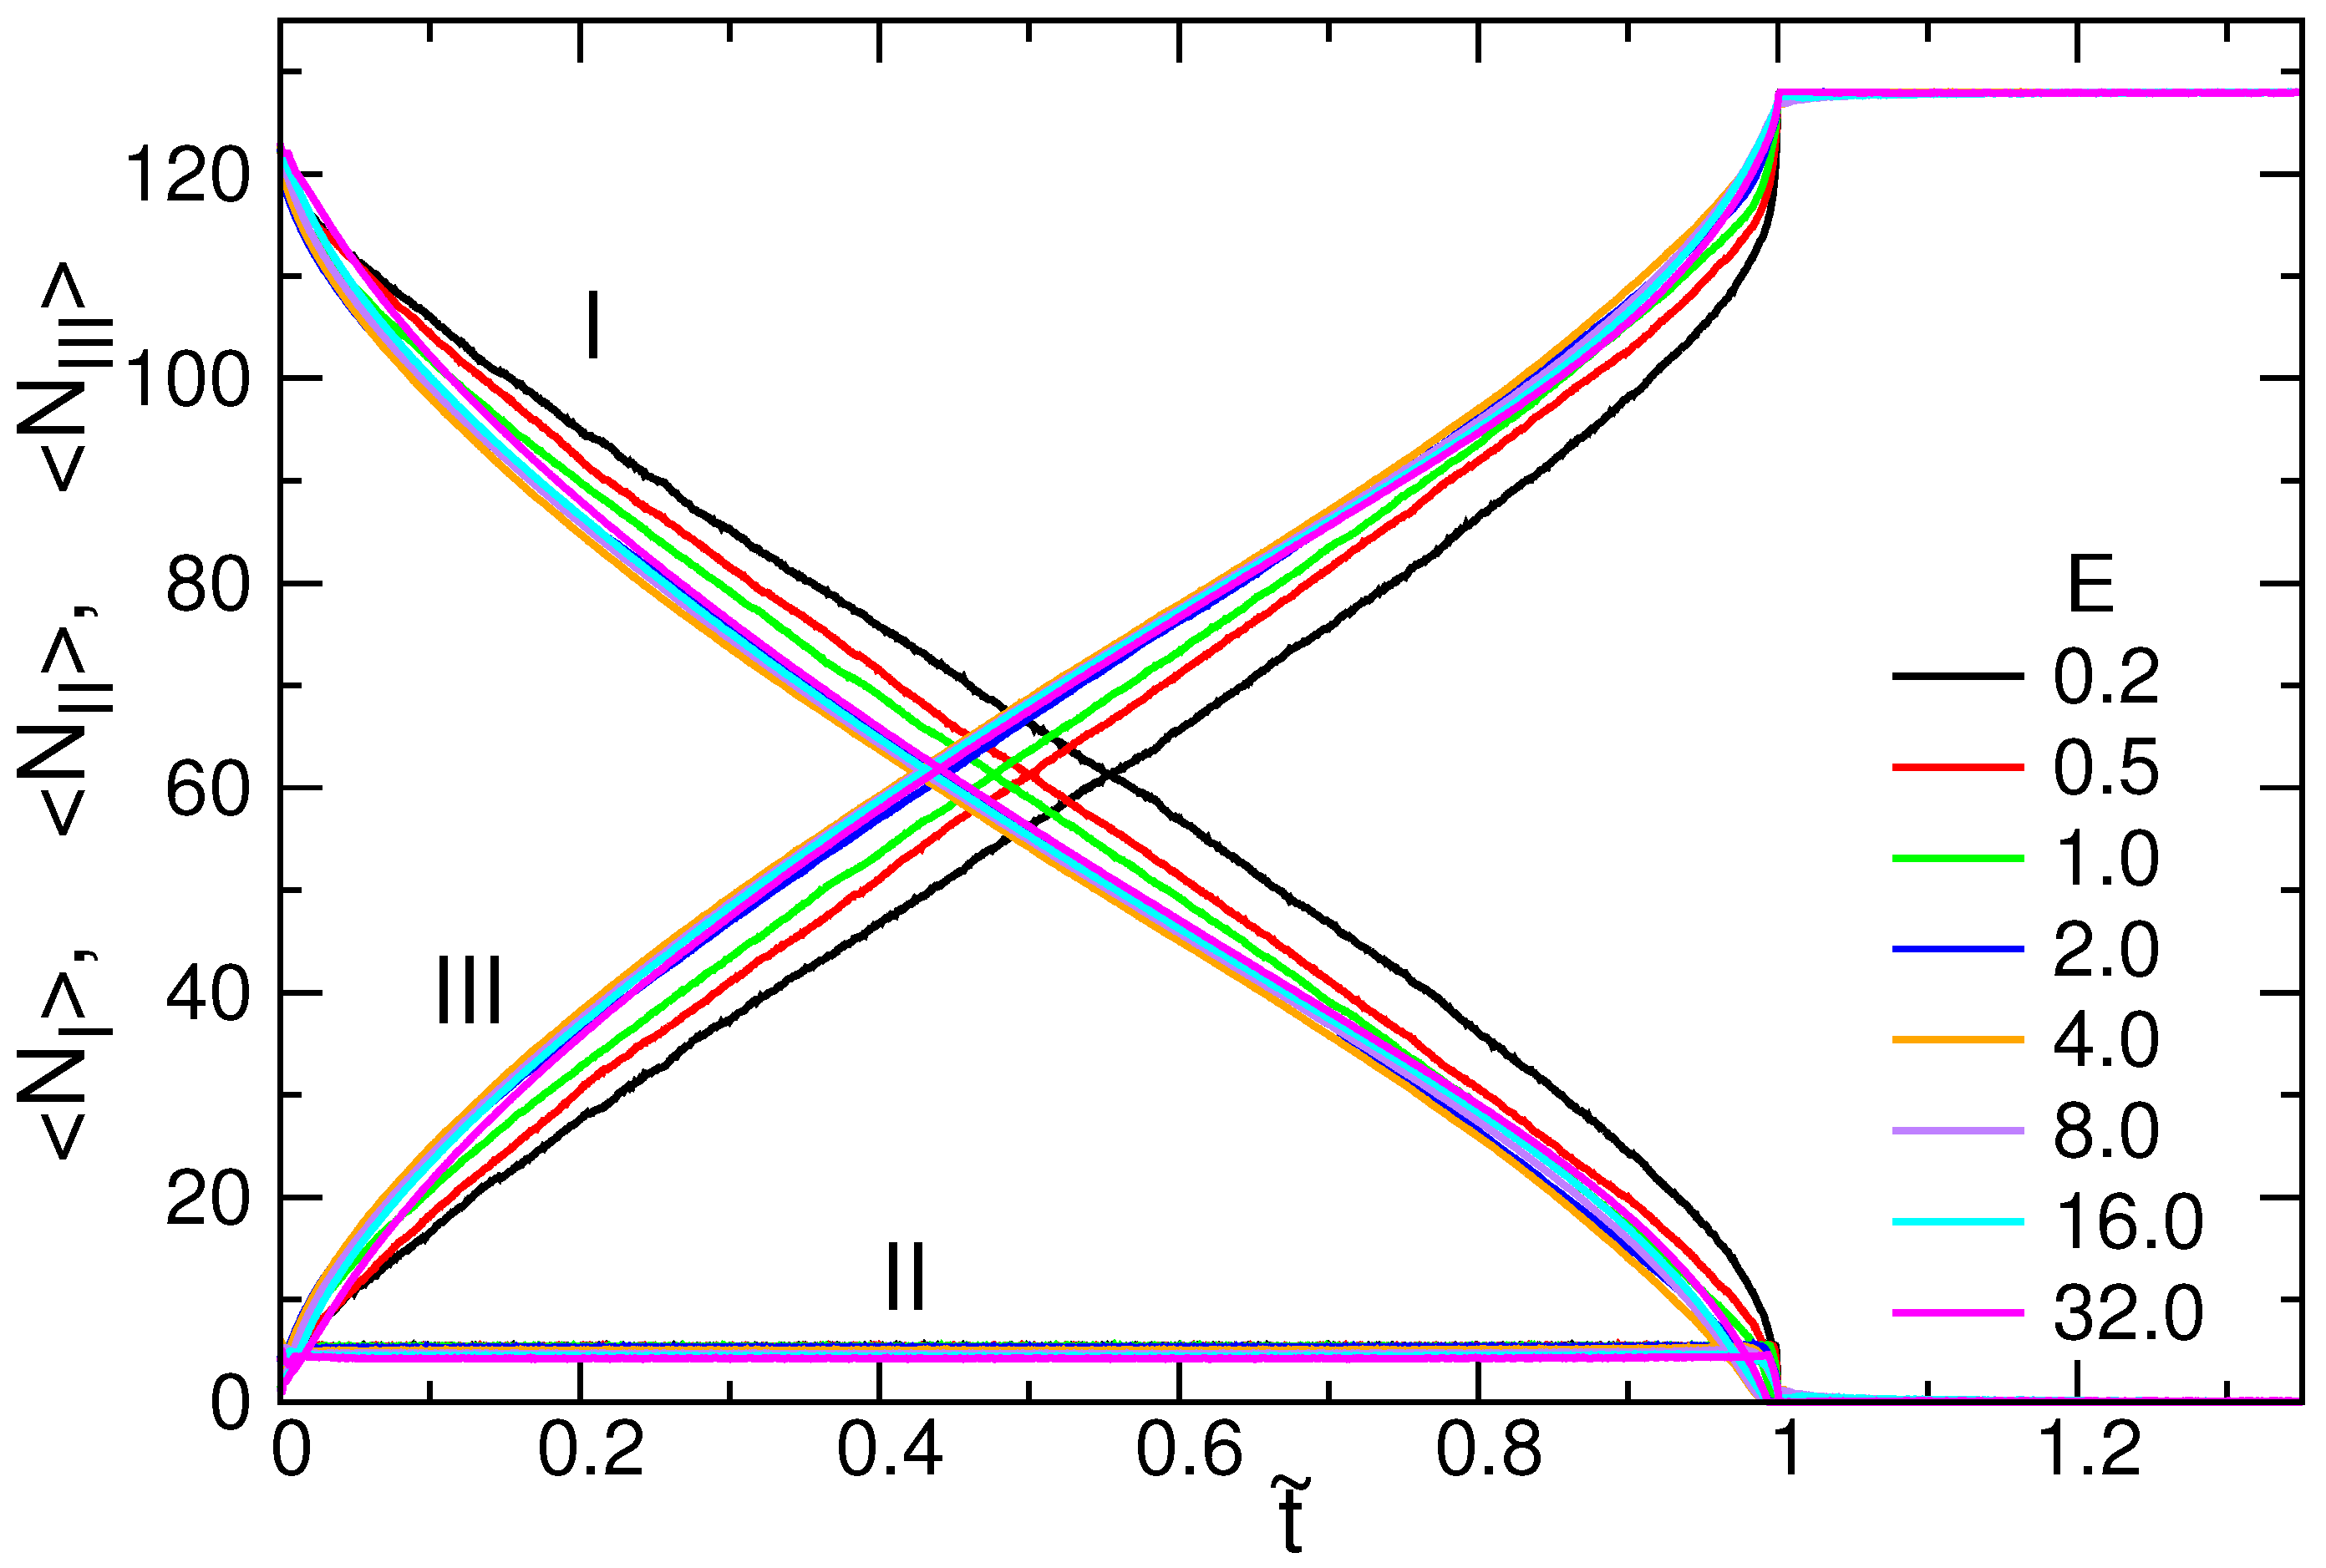
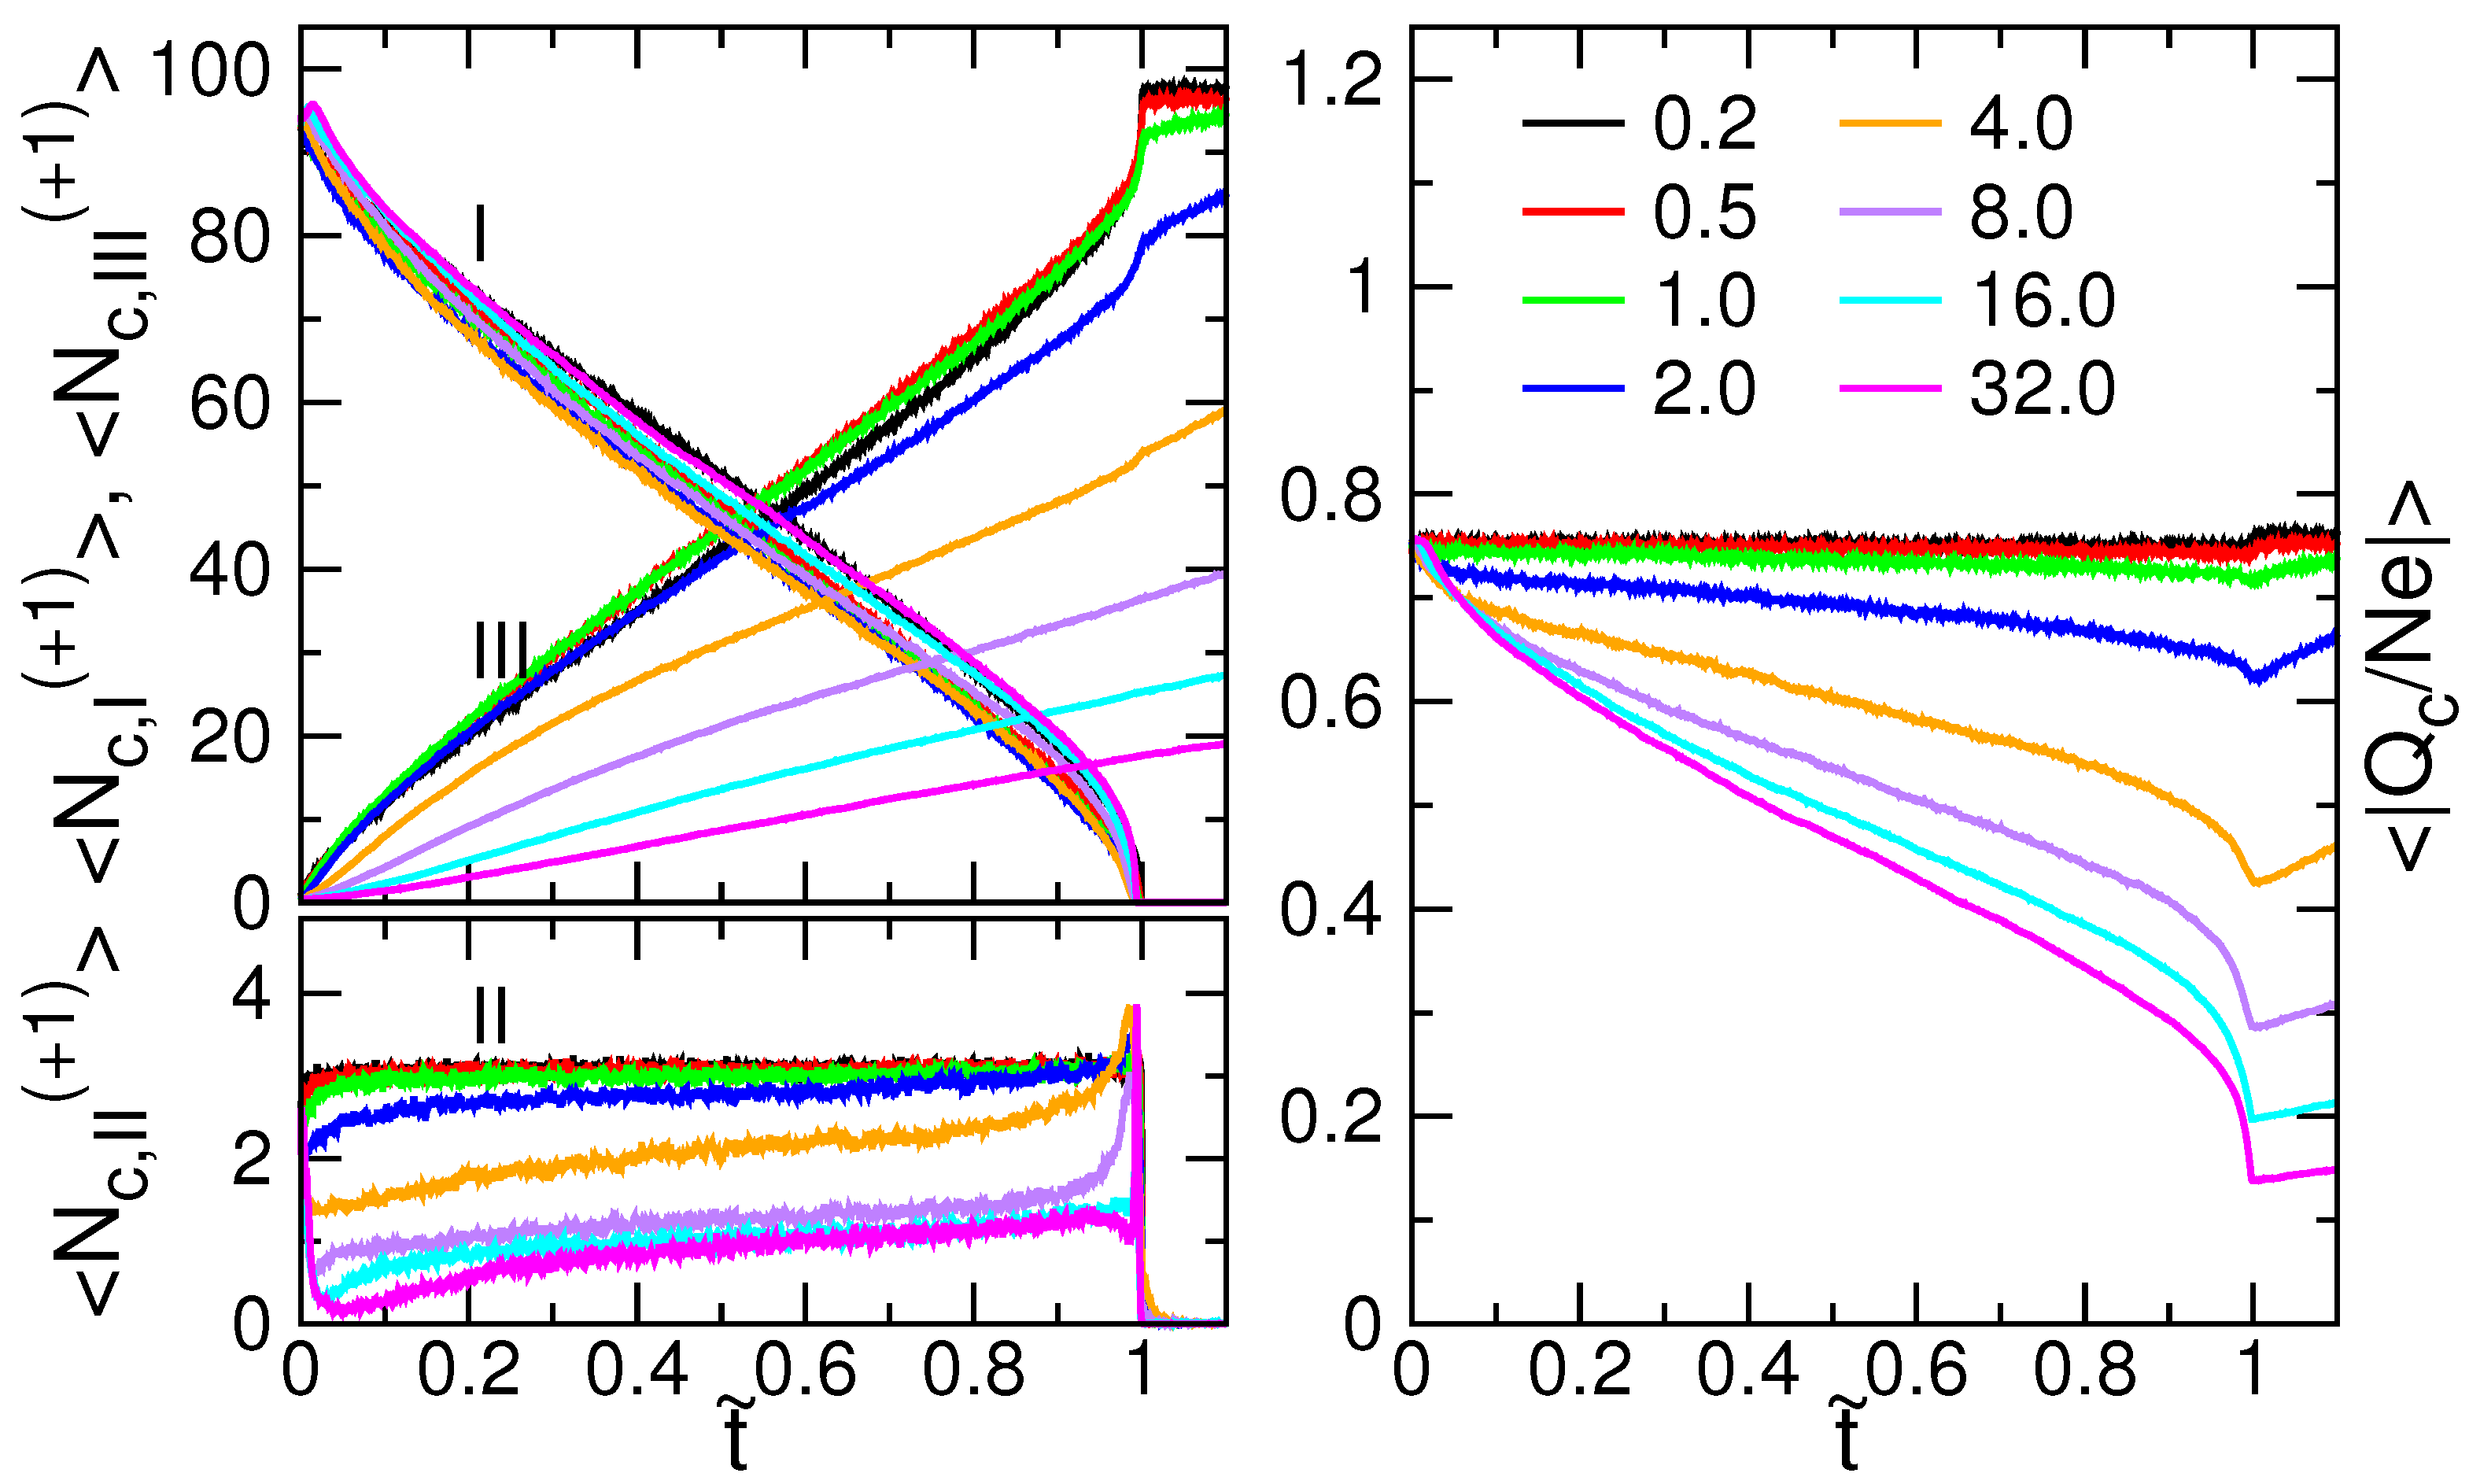
3.2. Chain Size and Positions of Chain Ends
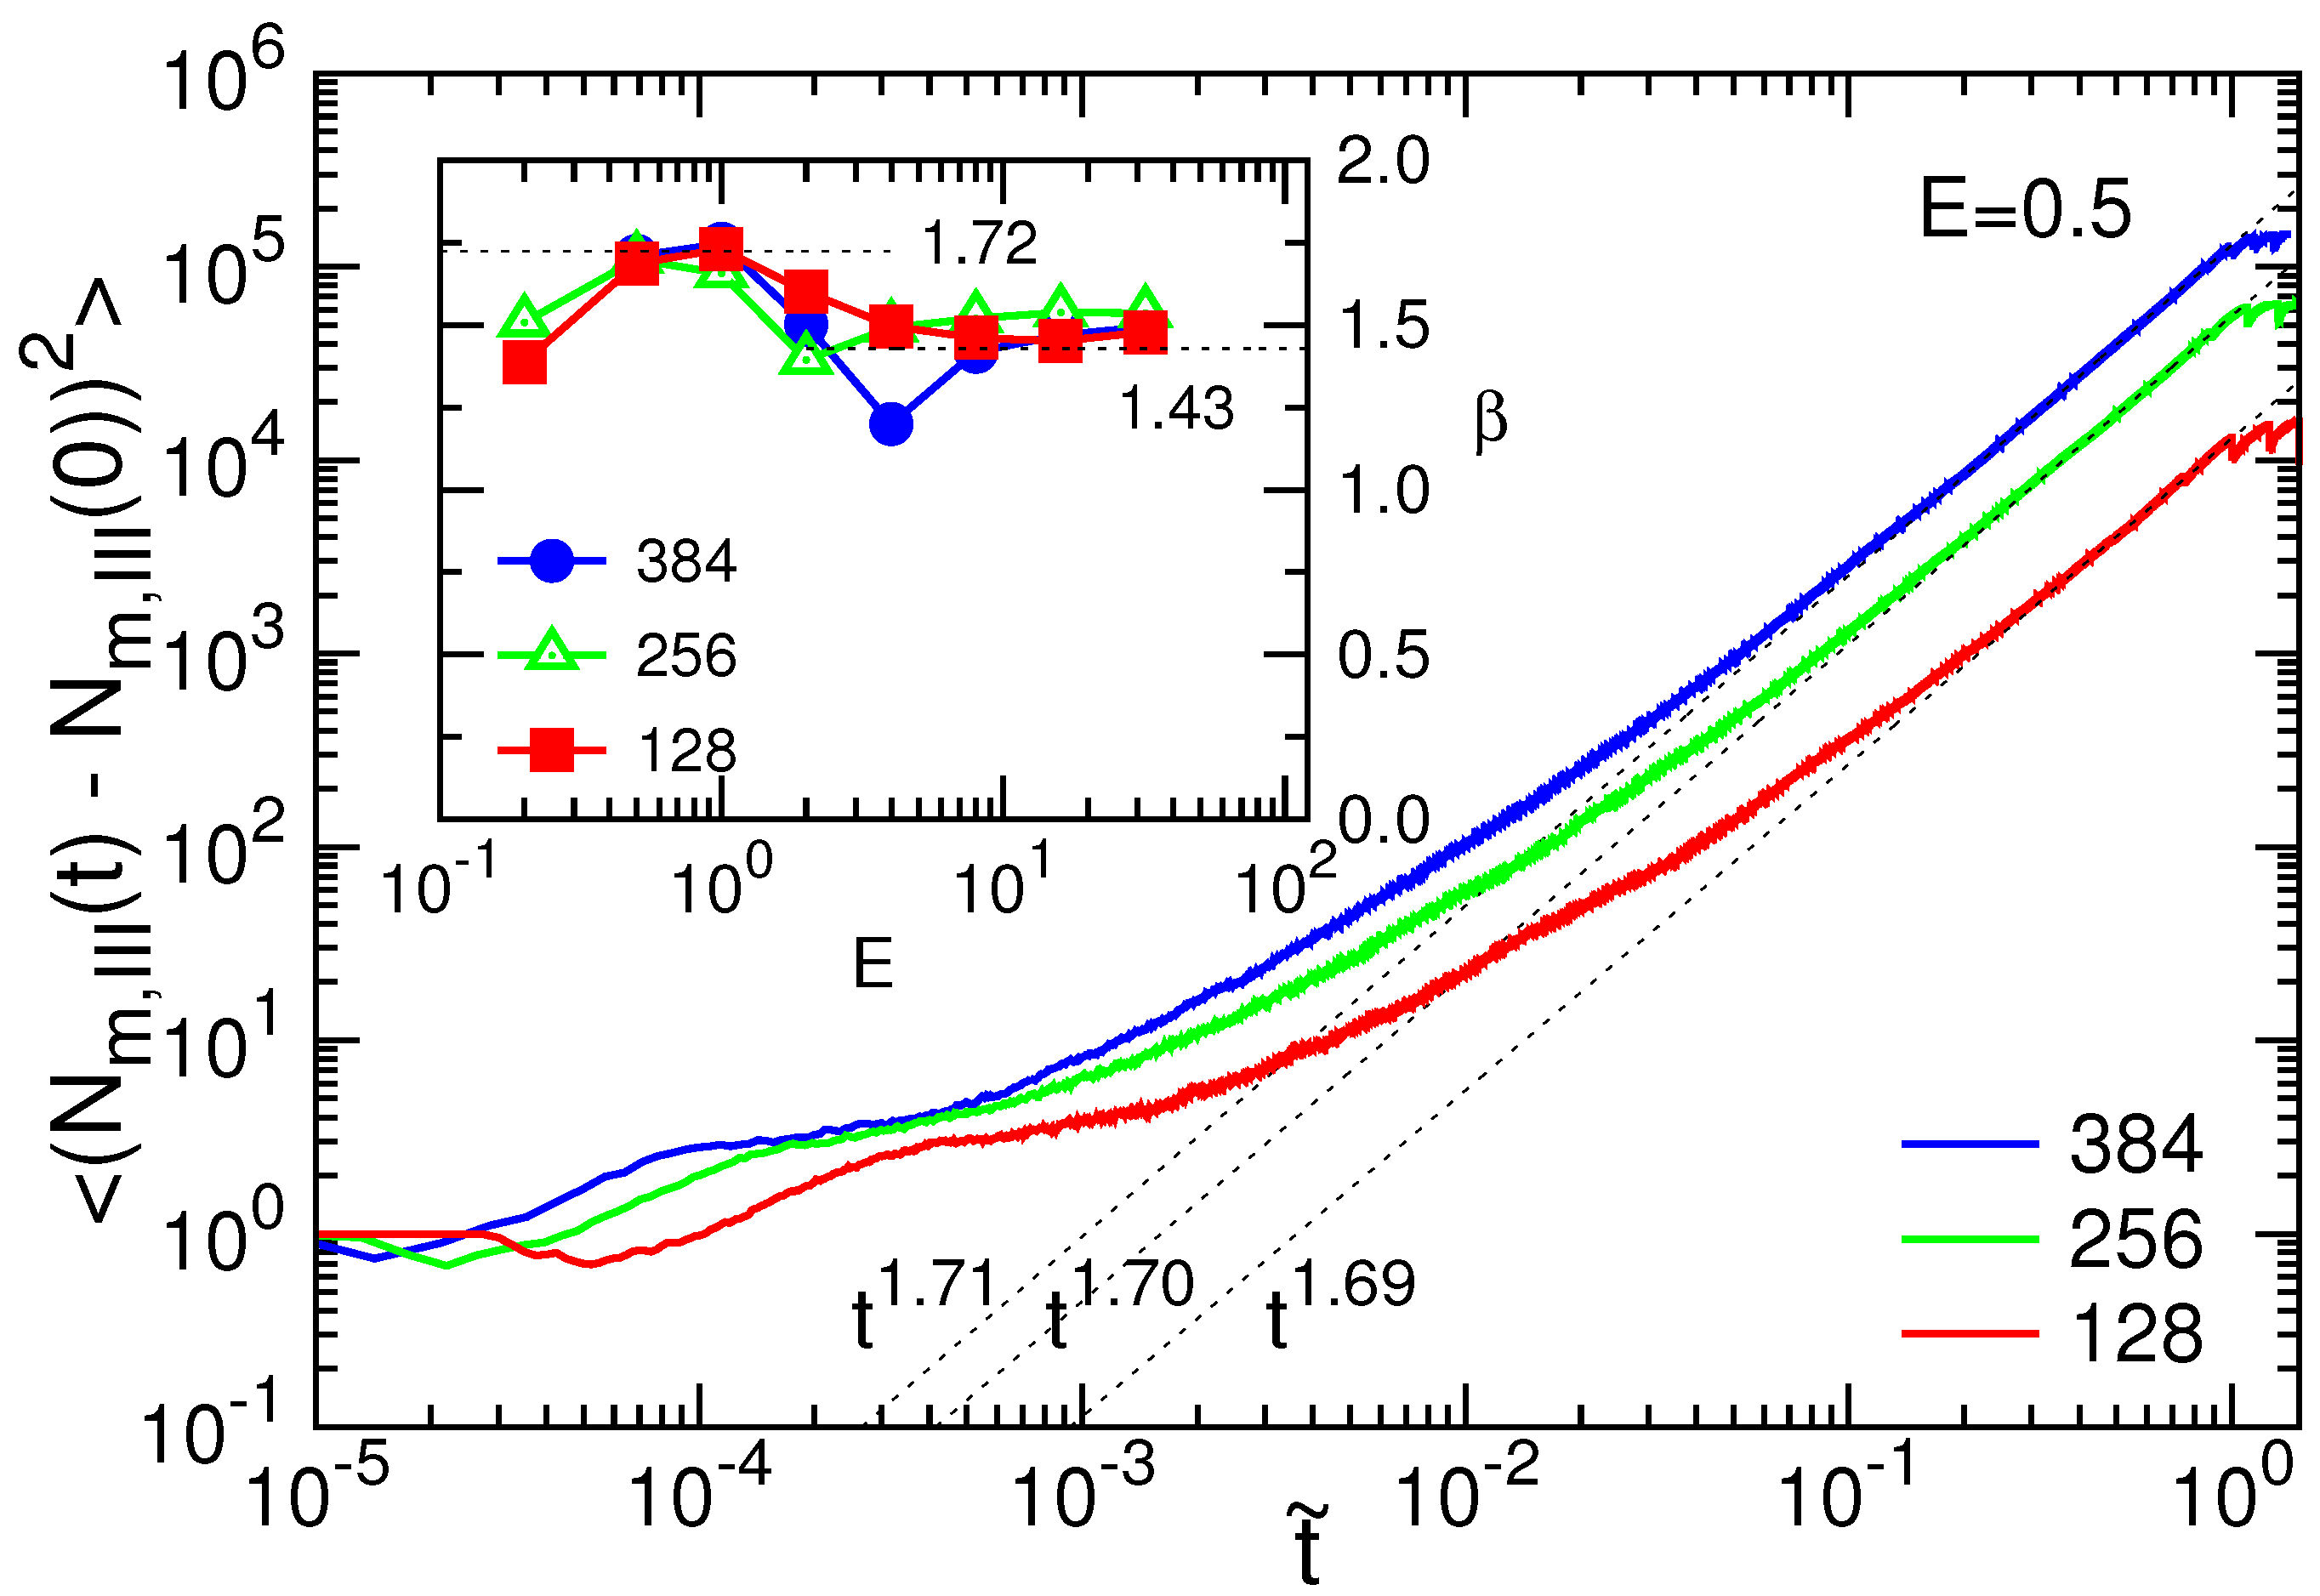
3.3. Translocation Coordinate
3.4. Ion Condensation
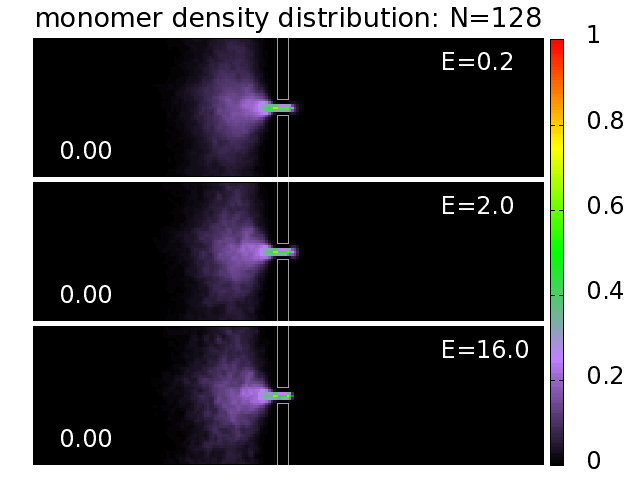
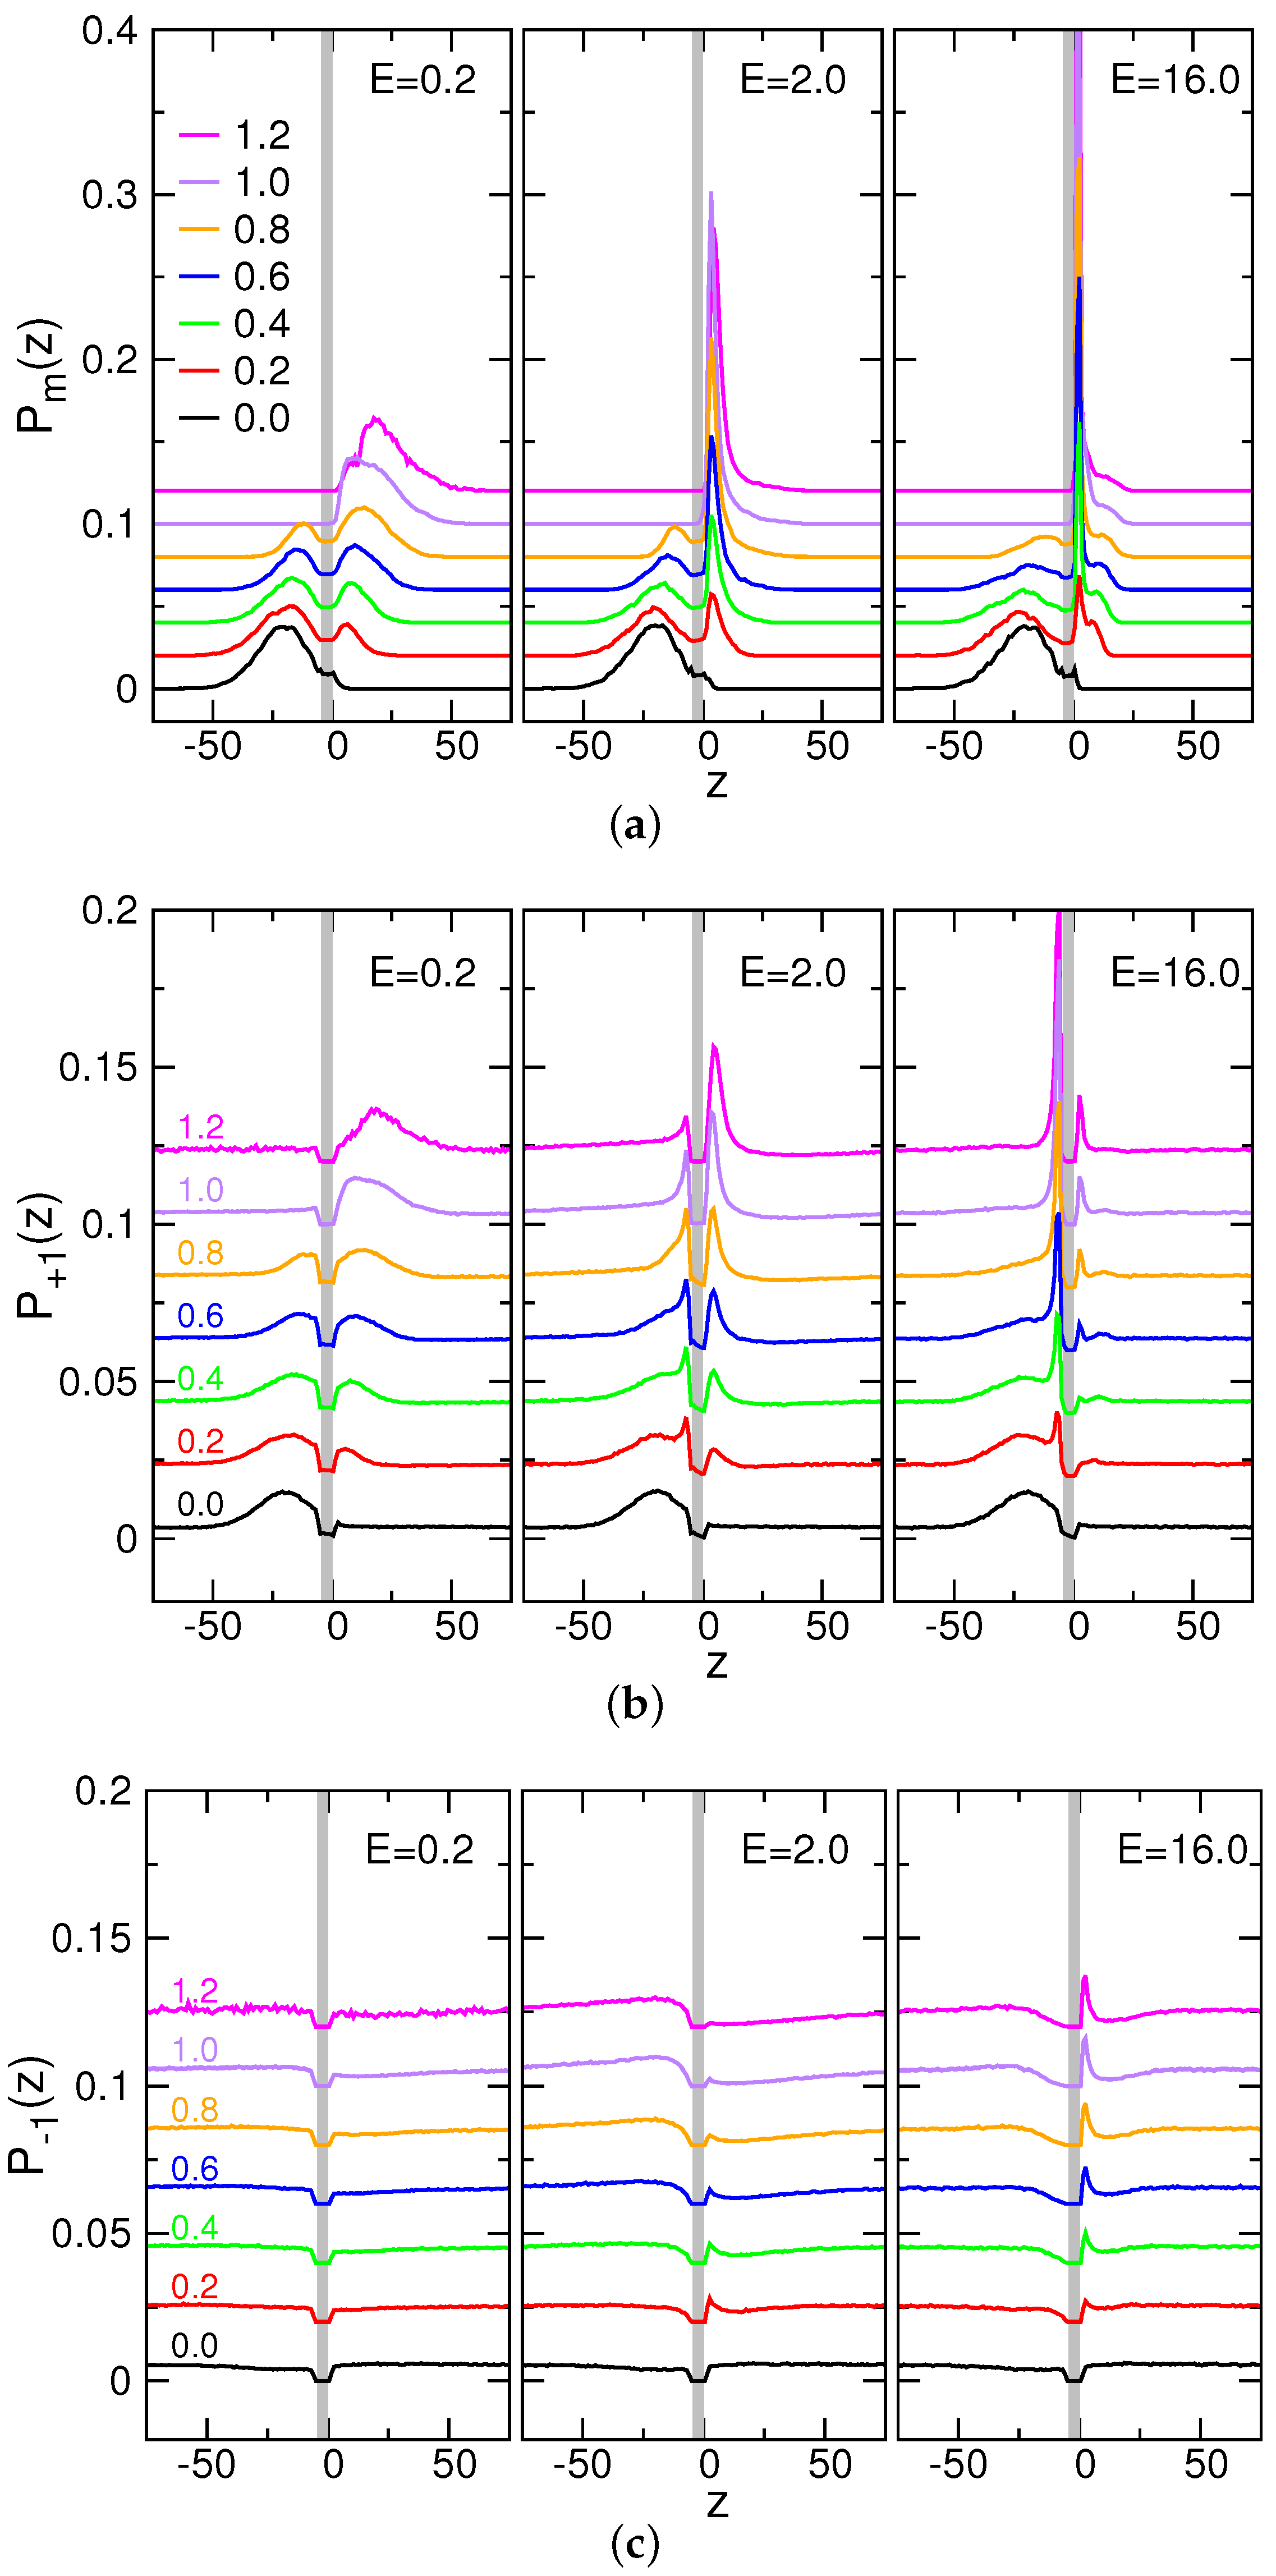
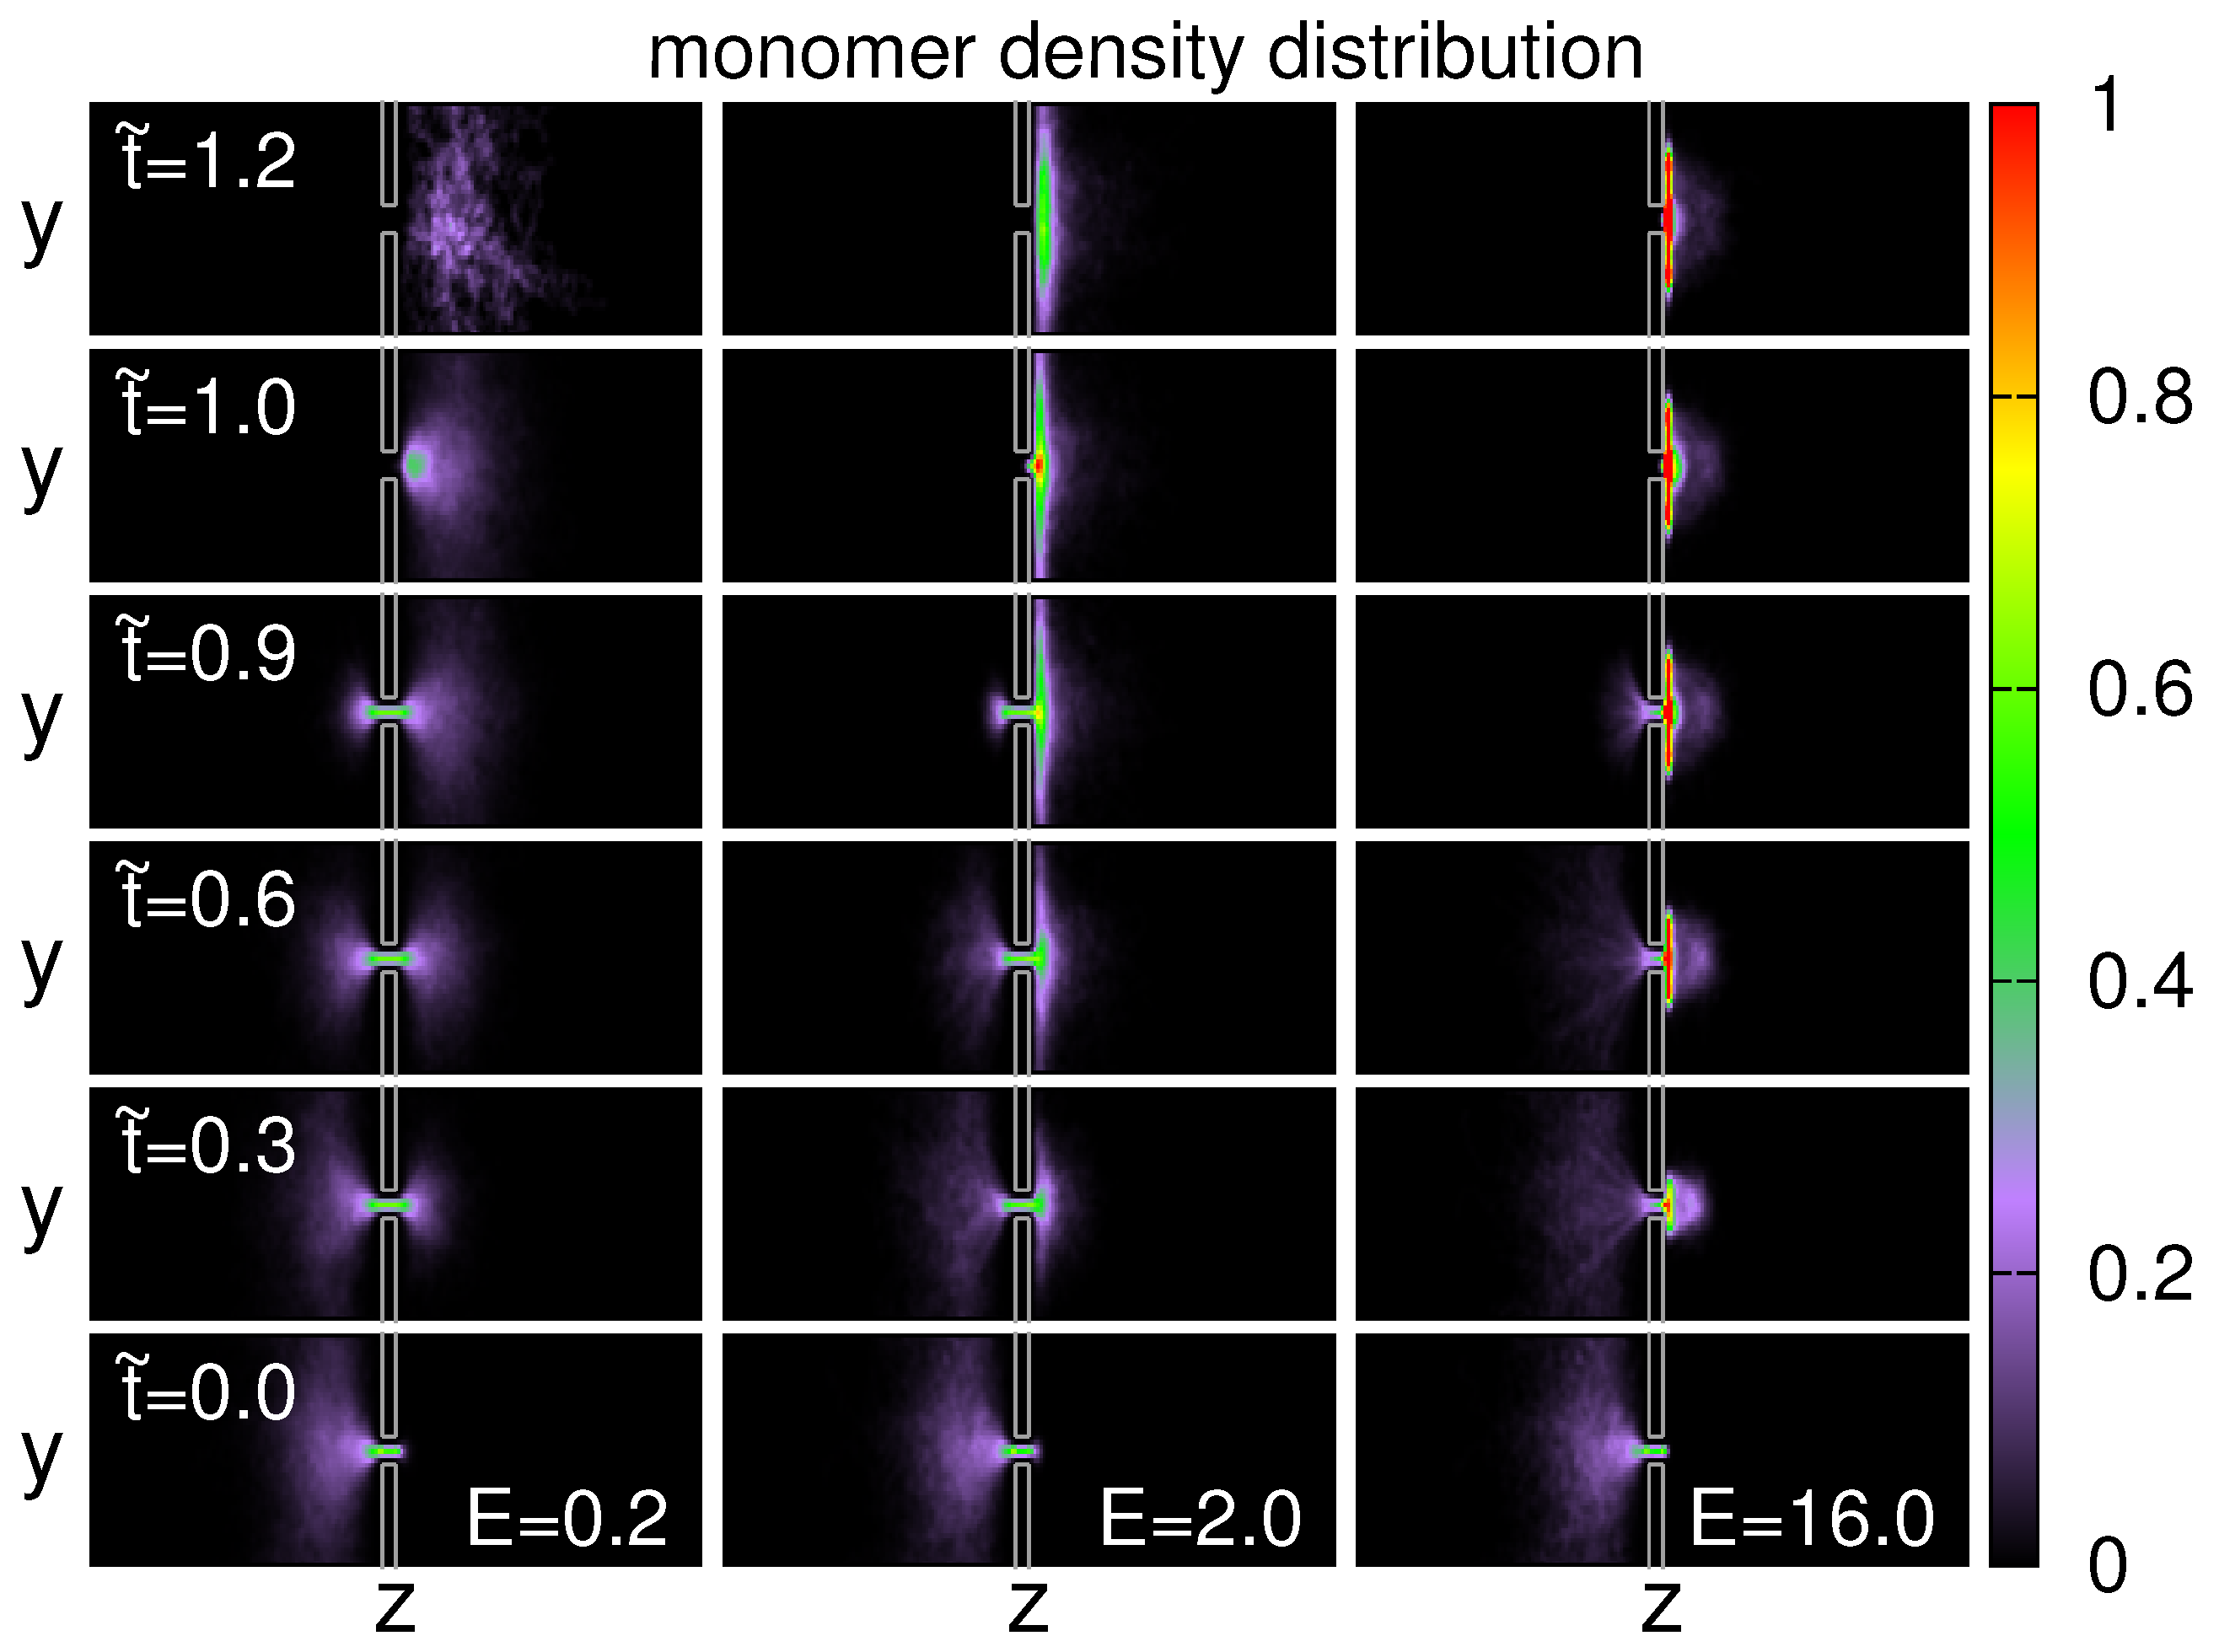
3.5. Probability Distributions and Density Distributions
4. Conclusions
Supplementary Materials
Acknowledgments
Conflicts of Interest
List of Symbols:
| Mean value of physical quantity X | |
| , , | Values of physical quantity X in the cis-region (I), pore-region (II), trans-region(III) |
| α | Exponent of the scaling behavior |
| β | Exponent of the scaling behavior |
| δ | Exponent of the scaling behavior |
| E | Strength of electric field (applied only in the pore region) |
| e | Elementary charge |
| ϵ | Dielectric constant of solvent |
| , | Energy parameters of Lennard-Jones potential for bead-bead (bb) and bead-wall (bw) interactions |
| Stochastic force acting on the bead i | |
| k | Spring constant of bond |
| Boltzmann constant | |
| ℓ | Contour length of chain |
| Bjerrum length | |
| m | Mass unit of simulation |
| N | Chain length |
| , | Numbers of condensed -ions, condensed -ions |
| Number of monomers | |
| ν | Flory exponent |
| Probability distribution of translocation time | |
| , , | Probability density distributions in z-direction for monomer, -ions, -ions |
| Total charges of condensed ions | |
| Radius of gyration | |
| r | Distance between two beads |
| Equilibrium length of bond | |
| Position vector of the bead i | |
| σ | Length unit of simulation |
| , | Length parameters of Lennard-Jones potential for bead-bead (bb) and bead-wall (bw) interactions |
| T | Temperature |
| t | Time |
| Normalized time | |
| τ | Translocation time |
| Time unit of simulation | |
| w | Width of |
| Valence of the bead i | |
| , | z-coordinates of chain head-end and tail-end |
| ζ | Friction coefficient |
References
- Kasianowicz, J.J.; Robertson, J.W.; Chan, E.R.; Reiner, J.E.; Stanford, V.M. Nanoscopic porous sensors. Annu. Rev. Anal. Chem. 2008, 1, 737–766. [Google Scholar] [CrossRef] [PubMed]
- Zwolak, M.; Di Ventra, M. Colloquium: Physical approaches to DNA sequencing and detection. Rev. Mod. Phys. 2008, 80, 141. [Google Scholar] [CrossRef]
- Milchev, A. Single-polymer dynamics under constraints: Scaling theory and computer experiment. J. Phys. Condens. Matter 2011, 23, 103101. [Google Scholar] [CrossRef] [PubMed]
- Venkatesan, B.M.; Bashir, R. Nanopore sensors for nucleic acid analysis. Nat. Nanotechnol. 2011, 6, 615–624. [Google Scholar] [CrossRef] [PubMed]
- Reiner, J.E.; Balijepalli, A.; Robertson, J.W.; Campbell, J.; Suehle, J.; Kasianowicz, J.J. Disease detection and management via single nanopore-based sensors. Chem. Rev. 2012, 112, 6431–6451. [Google Scholar] [CrossRef] [PubMed]
- Panja, D.; Barkema, G.T.; Kolomeisky, A.B. Through the eye of the needle: Recent advances in understanding biopolymer translocation. J. Phys. Condens. Matter 2013, 25, 413101. [Google Scholar] [CrossRef] [PubMed]
- Palyulin, V.V.; Ala-Nissila, T.; Metzler, R. Polymer translocation: The first two decades and the recent diversification. Soft Matter 2014, 10, 9016–9037. [Google Scholar] [CrossRef] [PubMed]
- Fyta, M. Threading DNA through nanopores for biosensing applications. J. Phys. Condens. Matter 2015, 27, 273101. [Google Scholar] [CrossRef] [PubMed]
- Bezrukov, S.M.; Vodyanoy, I.; Parsegian, V.A. Counting polymers moving through a single ion channel. Nature 1994, 370, 279. [Google Scholar] [CrossRef] [PubMed]
- Kasianowicz, J.J.; Brandin, E.; Branton, D.; Deamer, D.W. Characterization of individual polynucleotide molecules using a membrane channel. Proc. Natl. Acad. Sci. USA 1996, 93, 13770–13773. [Google Scholar] [CrossRef] [PubMed]
- Demming, A. Nanopores—The “Holey grail” in nanotechnology research. Nanotechnology 2012, 23, 250201. [Google Scholar] [CrossRef] [PubMed]
- Sung, W.; Park, P. Polymer translocation through a pore in a membrane. Phys. Rev. Lett. 1996, 77, 783. [Google Scholar] [CrossRef] [PubMed]
- Muthukumar, M. Polymer translocation through a hole. J. Chem. Phys. 1999, 111, 10371–10374. [Google Scholar] [CrossRef]
- Lubensky, D.K.; Nelson, D.R. Driven polymer translocation through a narrow pore. Biophys. J. 1999, 77, 1824–1838. [Google Scholar] [CrossRef]
- Chuang, J.; Kantor, Y.; Kardar, M. Anomalous dynamics of translocation. Phys. Rev. E 2001, 65, 011802. [Google Scholar] [CrossRef] [PubMed]
- Dubbeldam, J.; Milchev, A.; Rostiashvili, V.; Vilgis, T.A. Polymer translocation through a nanopore: A showcase of anomalous diffusion. Phys. Rev. E 2007, 76, 010801. [Google Scholar] [CrossRef] [PubMed]
- Panja, D.; Barkema, G.T.; Ball, R.C. Anomalous dynamics of unbiased polymer translocation through a narrow pore. J. Phys. Condens. Matter 2007, 19, 432202. [Google Scholar] [CrossRef]
- Panja, D.; Barkema, G.T.; Ball, R.C. Polymer translocation out of planar confinements. J. Phys. Condens. Matter 2008, 20, 075101. [Google Scholar] [CrossRef]
- Panja, D. Response of single polymers to localized step strains. Phys. Rev. E 2009, 79, 011803. [Google Scholar] [CrossRef] [PubMed]
- Gauthier, M.; Slater, G. Molecular dynamics simulation of a polymer chain translocating through a nanoscopic pore. Eur. Phys. J. E 2008, 25, 17–23. [Google Scholar] [CrossRef] [PubMed]
- de Haan, H.W.; Slater, G.W. Mapping the variation of the translocation α scaling exponent with nanopore width. Phys. Rev. E 2010, 81, 051802. [Google Scholar] [CrossRef] [PubMed]
- de Haan, H.W.; Slater, G.W. Memory effects during the unbiased translocation of a polymer through a nanopore. J. Chem. Phys. 2012, 136, 154903. [Google Scholar] [CrossRef] [PubMed]
- Storm, A.J.; Chen, J.; Zandbergen, H.; Dekker, C. Translocation of double-strand DNA through a silicon oxide nanopore. Phys. Rev. E 2005, 71, 051903. [Google Scholar] [CrossRef] [PubMed]
- Storm, A.J.; Storm, C.; Chen, J.; Zandbergen, H.; Joanny, J.F.; Dekker, C. Fast DNA translocation through a solid-state nanopore. Nano Lett. 2005, 5, 1193–1197. [Google Scholar] [CrossRef] [PubMed]
- Fologea, D.; Brandin, E.; Uplinger, J.; Branton, D.; Li, J. DNA conformation and base number simultaneously determined in a nanopore. Electrophoresis 2007, 28, 3186–3192. [Google Scholar] [CrossRef] [PubMed]
- Wanunu, M.; Sutin, J.; McNally, B.; Chow, A.; Meller, A. DNA translocation governed by interactions with solid-state nanopores. Biophys. J. 2008, 95, 4716–4725. [Google Scholar] [CrossRef] [PubMed]
- Meller, A.; Nivon, L.; Branton, D. Voltage-driven DNA translocations through a nanopore. Phys. Rev. Lett. 2001, 86, 3435. [Google Scholar] [CrossRef] [PubMed]
- Fologea, D.; Uplinger, J.; Thomas, B.; McNabb, D.S.; Li, J. Slowing DNA translocation in a solid-state nanopore. Nano Lett. 2005, 5, 1734–1737. [Google Scholar] [CrossRef] [PubMed]
- Meller, A.; Branton, D. Single molecule measurements of DNA transport through a nanopore. Electrophoresis 2002, 23, 2583–2591. [Google Scholar] [CrossRef]
- Payet, L.; Martinho, M.; Merstorf, C.; Pastoriza-Gallego, M.; Pelta, J.; Viasnoff, V.; Auvray, L.; Muthukumar, M.; Mathé, J. Temperature effect on ionic current and ssDNA transport through nanopores. Biophys. J. 2015, 109, 1600–1607. [Google Scholar] [CrossRef] [PubMed]
- Kantor, Y.; Kardar, M. Anomalous dynamics of forced translocation. Phys. Rev. E 2004, 69, 021806. [Google Scholar] [CrossRef] [PubMed]
- Vocks, H.; Panja, D.; Barkema, G.T.; Ball, R.C. Pore-blockade times for field-driven polymer translocation. J. Phys. Condens. Matter 2008, 20, 095224. [Google Scholar] [CrossRef]
- Sakaue, T. Sucking genes into pores: Insight into driven translocation. Phys. Rev. E 2010, 81, 041808. [Google Scholar] [CrossRef] [PubMed]
- Saito, T.; Sakaue, T. Dynamical diagram and scaling in polymer driven translocation. Eur. Phys. J. E 2011, 34, 1–8. [Google Scholar] [CrossRef] [PubMed]
- Saito, T.; Sakaue, T. Process time distribution of driven polymer transport. Phys. Rev. E 2012, 85, 061803. [Google Scholar] [CrossRef] [PubMed]
- Rowghanian, P.; Grosberg, A.Y. Force-driven polymer translocation through a nanopore: An old problem revisited. J. Phys. Chem. B 2011, 115, 14127–14135. [Google Scholar] [CrossRef] [PubMed]
- Dubbeldam, J.; Rostiashvili, V.; Milchev, A.; Vilgis, T.A. Forced translocation of a polymer: Dynamical scaling versus molecular dynamics simulation. Phys. Rev. E 2012, 85, 041801. [Google Scholar] [CrossRef] [PubMed]
- Saito, T.; Sakaue, T. Cis-trans dynamical asymmetry in driven polymer translocation. Phys. Rev. E 2013, 88, 042606. [Google Scholar] [CrossRef] [PubMed]
- Luo, K.; Ala-Nissila, T.; Ying, S.C. Polymer translocation through a nanopore: A two-dimensional Monte Carlo study. J. Chem. Phys. 2006, 124, 034714. [Google Scholar] [CrossRef] [PubMed]
- Wei, D.; Yang, W.; Jin, X.; Liao, Q. Unforced translocation of a polymer chain through a nanopore: The solvent effect. J. Chem. Phys. 2007, 126, 204901. [Google Scholar] [CrossRef] [PubMed]
- Luo, K.; Ollila, S.T.; Huopaniemi, I.; Ala-Nissila, T.; Pomorski, P.; Karttunen, M.; Ying, S.C.; Bhattacharya, A. Dynamical scaling exponents for polymer translocation through a nanopore. Phys. Rev. E 2008, 78, 050901. [Google Scholar] [CrossRef] [PubMed]
- Yu, W.; Ma, Y.; Luo, K. Translocation of stiff polymers through a nanopore driven by binding particles. J. Chem. Phys. 2012, 137, 244905. [Google Scholar] [CrossRef] [PubMed]
- Adhikari, R.; Bhattacharya, A. Driven translocation of a semi-flexible chain through a nanopore: A Brownian dynamics simulation study in two dimensions. J. Chem. Phys. 2013, 138, 204909. [Google Scholar] [CrossRef] [PubMed]
- Piguet, F.; Foster, D. Translocation of short and long polymers through an interacting pore. J. Chem. Phys. 2013, 138, 084902. [Google Scholar] [CrossRef] [PubMed]
- Milchev, A.; Binder, K.; Bhattacharya, A. Polymer translocation through a nanopore induced by adsorption: Monte Carlo simulation of a coarse-grained model. J. Chem. Phys. 2004, 121, 6042–6051. [Google Scholar] [CrossRef] [PubMed]
- Wolterink, J.K.; Barkema, G.T.; Panja, D. Passage times for unbiased polymer translocation through a narrow pore. Phys. Rev. Lett. 2006, 96, 208301. [Google Scholar] [CrossRef] [PubMed]
- Forrey, C.; Muthukumar, M. Langevin dynamics simulations of ds-DNA translocation through synthetic nanopores. J. Chem. Phys. 2007, 127, 015102. [Google Scholar] [CrossRef] [PubMed]
- Hernandez-Ortiz, J.P.; Chopra, M.; Geier, S.; de Pablo, J.J. Hydrodynamic effects on the translocation rate of a polymer through a pore. J. Chem. Phys. 2009, 131, 044904. [Google Scholar] [CrossRef] [PubMed]
- Bhattacharya, A.; Morrison, W.H.; Luo, K.; Ala-Nissila, T.; Ying, S.C.; Milchev, A.; Binder, K. Scaling exponents of forced polymer translocation through a nanopore. Eur. Phys. J. E 2009, 29, 423–429. [Google Scholar] [CrossRef] [PubMed]
- Sun, L.Z.; Luo, M.B. Study on the polymer translocation induced blockade ionic current inside a nanopore by Langevin dynamics simulation. J. Phys. Condens. Matter 2013, 25, 465101. [Google Scholar] [CrossRef] [PubMed]
- Qian, W.; Doi, K.; Uehara, S.; Morita, K.; Kawano, S. Theoretical Study of the Transpore velocity control of single-stranded DNA. Int. J. Mol. Sci. 2014, 15, 13817–13832. [Google Scholar] [CrossRef] [PubMed]
- Li, J.; Zhang, Y.; Yang, J.; Bi, K.; Ni, Z.; Li, D.; Chen, Y. Molecular dynamics study of DNA translocation through graphene nanopores. Phys. Rev. E 2013, 87, 062707. [Google Scholar] [CrossRef] [PubMed]
- Lehtola, V.; Linna, R.; Kaski, K. Dynamics of forced biopolymer translocation. Europhys. Lett. 2009, 85, 58006. [Google Scholar] [CrossRef]
- Lehtola, V.; Linna, R.; Kaski, K. Unforced polymer translocation compared to the forced case. Phys. Rev. E 2010, 81, 031803. [Google Scholar] [CrossRef] [PubMed]
- Kapahnke, F.; Schmidt, U.; Heermann, D.W.; Weiss, M. Polymer translocation through a nanopore: The effect of solvent conditions. J. Chem. Phys. 2010, 132, 164904. [Google Scholar] [CrossRef] [PubMed]
- Yang, K.; Vishnyakov, A.; Neimark, A.V. Polymer translocation through a nanopore: DPD study. J. Phys. Chem. B 2013, 117, 3648–3658. [Google Scholar] [CrossRef] [PubMed]
- Li, X.; Pivkin, I.V.; Liang, H. Hydrodynamic effects on flow-induced polymer translocation through a microfluidic channel. Polymer 2013, 54, 4309–4317. [Google Scholar] [CrossRef]
- Reboux, S.; Capuani, F.; González-Segredo, N.; Frenkel, D. Lattice-Boltzmann simulations of ionic current modulation by DNA translocation. J. Chem. Theory Comput. 2006, 2, 495–503. [Google Scholar] [CrossRef] [PubMed]
- Fyta, M.G.; Melchionna, S.; Kaxiras, E.; Succi, S. Multiscale coupling of molecular dynamics and hydrodynamics: Application to DNA translocation through a nanopore. Multiscale Model. Sim. 2006, 5, 1156–1173. [Google Scholar] [CrossRef]
- Succi, S. Lattice Boltzmann across scales: from turbulence to DNA translocation. Eur. Phys. J. B 2008, 64, 471–479. [Google Scholar] [CrossRef]
- Ledesma-Aguilar, R.; Sakaue, T.; Yeomans, J.M. Length-dependent translocation of polymers through nanochannels. Soft Matter 2012, 8, 1884–1892. [Google Scholar] [CrossRef]
- Farahpour, F.; Maleknejad, A.; Varnik, F.; Ejtehadi, M.R. Chain deformation in translocation phenomena. Soft Matter 2013, 9, 2750–2759. [Google Scholar] [CrossRef]
- Mathé, J.; Aksimentiev, A.; Nelson, D.R.; Schulten, K.; Meller, A. Orientation discrimination of single-stranded DNA inside the α-hemolysin membrane channel. Proc. Natl. Acad. Sci. USA 2005, 102, 12377–12382. [Google Scholar] [CrossRef] [PubMed]
- Bhattacharya, S.; Derrington, I.M.; Pavlenok, M.; Niederweis, M.; Gundlach, J.H.; Aksimentiev, A. Molecular dynamics study of mspa arginine mutants predicts slow DNA translocations and ion current blockades indicative of DNA sequence. ACS Nano 2012, 6, 6960–6968. [Google Scholar] [CrossRef] [PubMed]
- Avdoshenko, S.M.; Nozaki, D.; Gomes da Rocha, C.; Gonzalez, J.W.; Lee, M.H.; Gutierrez, R.; Cuniberti, G. Dynamic and electronic transport properties of DNA translocation through graphene nanopores. Nano Lett. 2013, 13, 1969–1976. [Google Scholar] [CrossRef] [PubMed]
- De Haan, H.W.; Slater, G.W. Using an incremental mean first passage approach to explore the viscosity dependent dynamics of the unbiased translocation of a polymer through a nanopore. J. Chem. Phys. 2012, 136, 204902. [Google Scholar] [CrossRef] [PubMed]
- Huopaniemi, I.; Luo, K.; Ala-Nissila, T.; Ying, S.C. Langevin dynamics simulations of polymer translocation through nanopores. J. Chem. Phys. 2006, 125, 124901. [Google Scholar] [CrossRef] [PubMed]
- Ledesma-Aguilar, R.; Sakaue, T.; Yeomans, J.M. Easier sieving through narrower pores: Fluctuations and barrier crossing in flow-driven polymer translocation. Soft Matter 2012, 8, 4306–4309. [Google Scholar] [CrossRef]
- Huopaniemi, I.; Luo, K.; Ala-Nissila, T.; Ying, S.C. Polymer translocation through a nanopore under a pulling force. Phys. Rev. E 2007, 75, 061912. [Google Scholar] [CrossRef] [PubMed]
- Ollila, S.T.; Luo, K.; Ala-Nissila, T.; Ying, S.C. Polymer translocation in a double-force arrangement. Eur. Phys. J. E 2009, 28, 385–393. [Google Scholar] [CrossRef] [PubMed]
- Edmonds, C.M.; Hudiono, Y.C.; Ahmadi, A.G.; Hesketh, P.J.; Nair, S. Polymer translocation in solid-state nanopores: Dependence of scaling behavior on pore dimensions and applied voltage. J. Chem. Phys. 2012, 136, 065105. [Google Scholar] [CrossRef] [PubMed]
- Ikonen, T.; Bhattacharya, A.; Ala-Nissila, T.; Sung, W. Influence of pore friction on the universal aspects of driven polymer translocation. Europhys. Lett. 2013, 103, 38001. [Google Scholar] [CrossRef]
- Katkar, H.; Muthukumar, M. Effect of charge patterns along a solid-state nanopore on polyelectrolyte translocation. J. Chem. Phys. 2014, 140, 135102. [Google Scholar] [CrossRef] [PubMed]
- Loebl, H.C.; Randel, R.; Goodwin, S.P.; Matthai, C.C. Simulation studies of polymer translocation through a channel. Phys. Rev. E 2003, 67, 041913. [Google Scholar] [CrossRef] [PubMed]
- Matysiak, S.; Montesi, A.; Pasquali, M.; Kolomeisky, A.B.; Clementi, C. Dynamics of polymer translocation through nanopores: theory meets experiment. Phys. Rev. Lett. 2006, 96, 118103. [Google Scholar] [CrossRef] [PubMed]
- Cacciuto, A.; Luijten, E. Confinement-driven translocation of a flexible polymer. Phys. Rev. Lett. 2006, 96, 238104. [Google Scholar] [CrossRef] [PubMed]
- Xia, K.; Novak, B.R.; Weerakoon-Ratnayake, K.M.; Soper, S.A.; Nikitopoulos, D.E.; Moldovan, D. Electrophoretic Transport of Single DNA Nucleotides through Nanoslits: A Molecular Dynamics Simulation Study. J. Phys. Chem. B 2015, 119, 11443–11458. [Google Scholar] [CrossRef] [PubMed]
- Polson, J.M. Polymer translocation into and out of an ellipsoidal cavity. J. Chem. Phys. 2015, 142, 174903. [Google Scholar] [CrossRef] [PubMed]
- Sean, D.; Haan, H.W.; Slater, G.W. Translocation of a polymer through a nanopore starting from a confining nanotube. Electrophoresis 2015, 36, 682–691. [Google Scholar] [CrossRef] [PubMed]
- Garaj, S.; Hubbard, W.; Reina, A.; Kong, J.; Branton, D.; Golovchenko, J. Graphene as a subnanometre trans-electrode membrane. Nature 2010, 467, 190–193. [Google Scholar] [CrossRef] [PubMed]
- Schneider, G.F.; Kowalczyk, S.W.; Calado, V.E.; Pandraud, G.; Zandbergen, H.W.; Vandersypen, L.M.; Dekker, C. DNA translocation through graphene nanopores. Nano Lett. 2010, 10, 3163–3167. [Google Scholar] [CrossRef] [PubMed]
- Merchant, C.A.; Healy, K.; Wanunu, M.; Ray, V.; Peterman, N.; Bartel, J.; Fischbein, M.D.; Venta, K.; Luo, Z.; Johnson, A.C.; et al. DNA translocation through graphene nanopores. Nano Lett. 2010, 10, 2915–2921. [Google Scholar] [CrossRef] [PubMed]
- Shankla, M.; Aksimentiev, A. Conformational transitions and stop-and-go nanopore transport of single-stranded DNA on charged graphene. Nat. Commun. 2014, 5, 5171. [Google Scholar] [CrossRef] [PubMed]
- Shi, C.; Kong, Z.; Sun, T.; Liang, L.; Shen, J.; Zhao, Z.; Wang, Q.; Kang, Z.; Ågren, H.; Tu, Y. Molecular dynamics simulations indicate that DNA bases using graphene nanopores can be identified by their translocation times. R. Soc. Chem. Adv. 2015, 5, 9389–9395. [Google Scholar] [CrossRef]
- Kim, H.S.; Kim, Y.H. Recent progress in atomistic simulation of electrical current DNA sequencing. Biosens. Bioelectron. 2015, 69, 186–198. [Google Scholar] [CrossRef] [PubMed]
- Kowalczyk, S.W.; Blosser, T.R.; Dekker, C. Biomimetic nanopores: Learning from and about nature. Trends Biotechnol. 2011, 29, 607–614. [Google Scholar] [CrossRef] [PubMed]
- Niedringhaus, T.P.; Milanova, D.; Kerby, M.B.; Snyder, M.P.; Barron, A.E. Landscape of next-generation sequencing technologies. Anal. Chem. 2011, 83, 4327–4341. [Google Scholar] [CrossRef] [PubMed]
- Stoloff, D.H.; Wanunu, M. Recent trends in nanopores for biotechnology. Curr. Opin. Biotechnol. 2013, 24, 699–704. [Google Scholar] [CrossRef] [PubMed]
- Kudr, J.; Skalickova, S.; Nejdl, L.; Moulick, A.; Ruttkay-Nedecky, B.; Adam, V.; Kizek, R. Fabrication of solid-state nanopores and its perspectives. Electrophoresis 2015, 36, 2367–2379. [Google Scholar] [CrossRef] [PubMed]
- Manning, G.S. Limiting laws and counterion condensation in polyelectrolyte solutions I. Colligative properties. J. Chem. Phys. 1969, 51, 924–933. [Google Scholar] [CrossRef]
- Manning, G. Counterion condensation theory of attraction between like charges in the absence of multivalent counterions. Eur. Phys. J. E 2011, 34, 1–18. [Google Scholar] [CrossRef] [PubMed]
- Bloomfield, V.A. DNA condensation. Curr. Opin. Struct. Biol. 1996, 6, 334–341. [Google Scholar] [CrossRef]
- Hsiao, P.Y. Chain morphology, swelling exponent, persistence length, like-charge attraction, and charge distribution around a chain in polyelectrolyte solutions: Effects of salt concentration and ion size studied by molecular dynamics simulations. Macromolecules 2006, 39, 7125–7137. [Google Scholar] [CrossRef]
- Hsiao, P.Y. Overcharging, charge inversion, and reentrant condensation: Using highly charged polyelectrolytes in tetravalent salt solutions as an example of study. J. Phys. Chem. B 2008, 112, 7347–7350. [Google Scholar] [CrossRef] [PubMed]
- Carnal, F.; Stoll, S. Explicit ions condensation around strongly charged polyelectrolytes and spherical macroions: the influence of salt concentration and chain linear charge density. Monte Carlo simulations. J. Phys. Chem. A 2012, 116, 6600–6608. [Google Scholar] [CrossRef] [PubMed]
- Carrillo, J.M.Y.; Dobrynin, A.V. Salt effect on osmotic pressure of polyelectrolyte solutions: simulation study. Polymers 2014, 6, 1897–1913. [Google Scholar] [CrossRef]
- Plimpton, S. Fast parallel algorithms for short-range molecular dynamics. J. Comput. Phys. 1995, 117, 1–19. [Google Scholar]
- Pathria, R. Statistical Mechanics, 2nd ed.; Elsevier (Singapore) Pte Ltd.: Singapore, 2006. [Google Scholar]
- Allen, M.P.; Tildesley, D.J. Computer Simulation of Liquids; Oxford University Press: Oxford, UK, 1989. [Google Scholar]
- Frenkel, D.; Smit, B. Understanding Molecular Simulation: From Algorithms to Applications; Academic Press: San Diego, CA, USA, 2002. [Google Scholar]
- Muthukumar, M. Polymer Translocation; CRC Press: Boca Raton, FL, USA, 2011. [Google Scholar]
- Oosawa, F. Polyelectrolytes; Marcel Dekker: New York, NY, USA, 1971. [Google Scholar]
- Netz, R. Polyelectrolytes in electric fields. J. Phys. Chem. B 2003, 107, 8208–8217. [Google Scholar] [CrossRef]
- Hsiao, P.Y. Linear polyelectrolytes in tetravalent salt solutions. J. Chem. Phys. 2006, 124, 044904. [Google Scholar] [CrossRef] [PubMed]
- Grass, K.; Holm, C. Polyelectrolytes in electric fields: Measuring the dynamical effective charge and effective friction. Soft Matter 2009, 5, 2079–2092. [Google Scholar] [CrossRef]
- Hsiao, P.Y.; Wei, Y.F.; Chang, H.C. Unfolding collapsed polyelectrolytes in alternating-current electric fields. Soft Matter 2011, 7, 1207–1213. [Google Scholar] [CrossRef]
- Xiong, W.W.; Miao, J.; Ye, K.; Wang, Y.; Liu, B.; Zhang, Q. Threading chalcogenide layers with polymer chains. Angew. Chem. Int. Ed. 2015, 127, 556–560. [Google Scholar] [CrossRef]
- Uemura, T.; Kaseda, T.; Sasaki, Y.; Inukai, M.; Toriyama, T.; Takahara, A.; Jinnai, H.; Kitagawa, S. Mixing of immiscible polymers using nanoporous coordination templates. Nat. Commun. 2015, 6, 7473. [Google Scholar] [CrossRef] [PubMed]


| Parameter | Value | Description |
|---|---|---|
| (, ) | (, ) | Excluded volume interaction |
| (, ) | (, ) | Excluded volume interaction |
| (k, ) | (, ) | Bond connectivity |
| Bjerrum length (for the Coulomb interaction) | ||
| (ζ, T) | (, ) | Settings for the Langevin equation |
| N | 16–384 | Number of monomers on a chain |
| E | – | Strength of the applied electric field |
| — | Radius of pore | |
| — | Length of pore | |
| — | Dimension of box |
© 2016 by the author. Licensee MDPI, Basel, Switzerland. This article is an open access article distributed under the terms and conditions of the Creative Commons by Attribution (CC-BY) license ( http://creativecommons.org/licenses/by/4.0/).
Share and Cite
Hsiao, P.-Y. Polyelectrolyte Threading through a Nanopore. Polymers 2016, 8, 73. https://doi.org/10.3390/polym8030073
Hsiao P-Y. Polyelectrolyte Threading through a Nanopore. Polymers. 2016; 8(3):73. https://doi.org/10.3390/polym8030073
Chicago/Turabian StyleHsiao, Pai-Yi. 2016. "Polyelectrolyte Threading through a Nanopore" Polymers 8, no. 3: 73. https://doi.org/10.3390/polym8030073
APA StyleHsiao, P.-Y. (2016). Polyelectrolyte Threading through a Nanopore. Polymers, 8(3), 73. https://doi.org/10.3390/polym8030073