
Effect of the Statistical Nature of Fiber Strength on the Predictability of Tensile Properties of Polymer Composites Reinforced with Bamboo Fibers: Comparison of Linear- and Power-Law Weibull Models


Abstract
:
1. Introduction
2. Experimental Details
2.1. Materials

| Gauge length (mm) | Number of available specimens, N | Average diameter (μm) |
|---|---|---|
| 20 | 45 | 366.8 (20.5) |
| 30 | 49 | 394.7 (22.4) |
| 40 | 39 | 413.4 (26.2) |
| 50 | 42 | 389.7 (23.0) |
| 60 | 39 | 386.3 (28.8) |
2.2. Tensile Tests
3. Theoretical Model
3.1. Weibull Distribution
3.2. Characterization of Stress Profiles
3.3. Monte-Carlo Simulation
- (a)
- In view of the facts of the use of a MDS weak-link scaling method and the strength variability caused by the random distribution of flaw density due to inner geometrical structure and composition, it is reasonable to assume that each fiber element is independent and its strength identically follows a Weibull distribution when the discretization length is sufficiently small [34]. Then, assign a tensile strength to each fiber element according to LLW and PLW expressions.
- (b)
- For a given applied load, the axial stress acting on the segments of the fiber and the matrix and the shear stress on the interface can be availably calculated by classical mechanical approach. Due to non-uniform fiber strength distribution, new fiber breakage happens in any position once the fiber stress is equal to corresponding strength.
- (c)
- After the first fiber break takes place at early loading stage, the load carried by the broken fiber is redistributed, and it induces stress concentration close to the broken site. Thus, matrix transverse cracking will occur when the matrix stress reaches its tensile strength. Similarly, for interface, the interfacial splitting happens when the shear stress exceeds the shear strength on the segment of the interface. If the interface is split, a constant frictional stress is considered to act along the interface in the splitting zone, and then the interfacial shear stress will reduce to this friction stress [35]. Once any damage arises, stress distribution in the composite is recalculated and this step will be repeated until occurrence of new damage is terminated under the present loading level [34]. Afterwards, we calculate the composite stresses and go to step (d).
- (d)
- Increase a new loading level and repeat steps (b) and (c). With a continuous accumulation of fiber breaks and the associated local damage events, the composite specimen will no longer be able to bear the externally applied load. Composite failure will occur when the tensile load is reduced to 85% of the maximum stress.
4. Results and Discussion
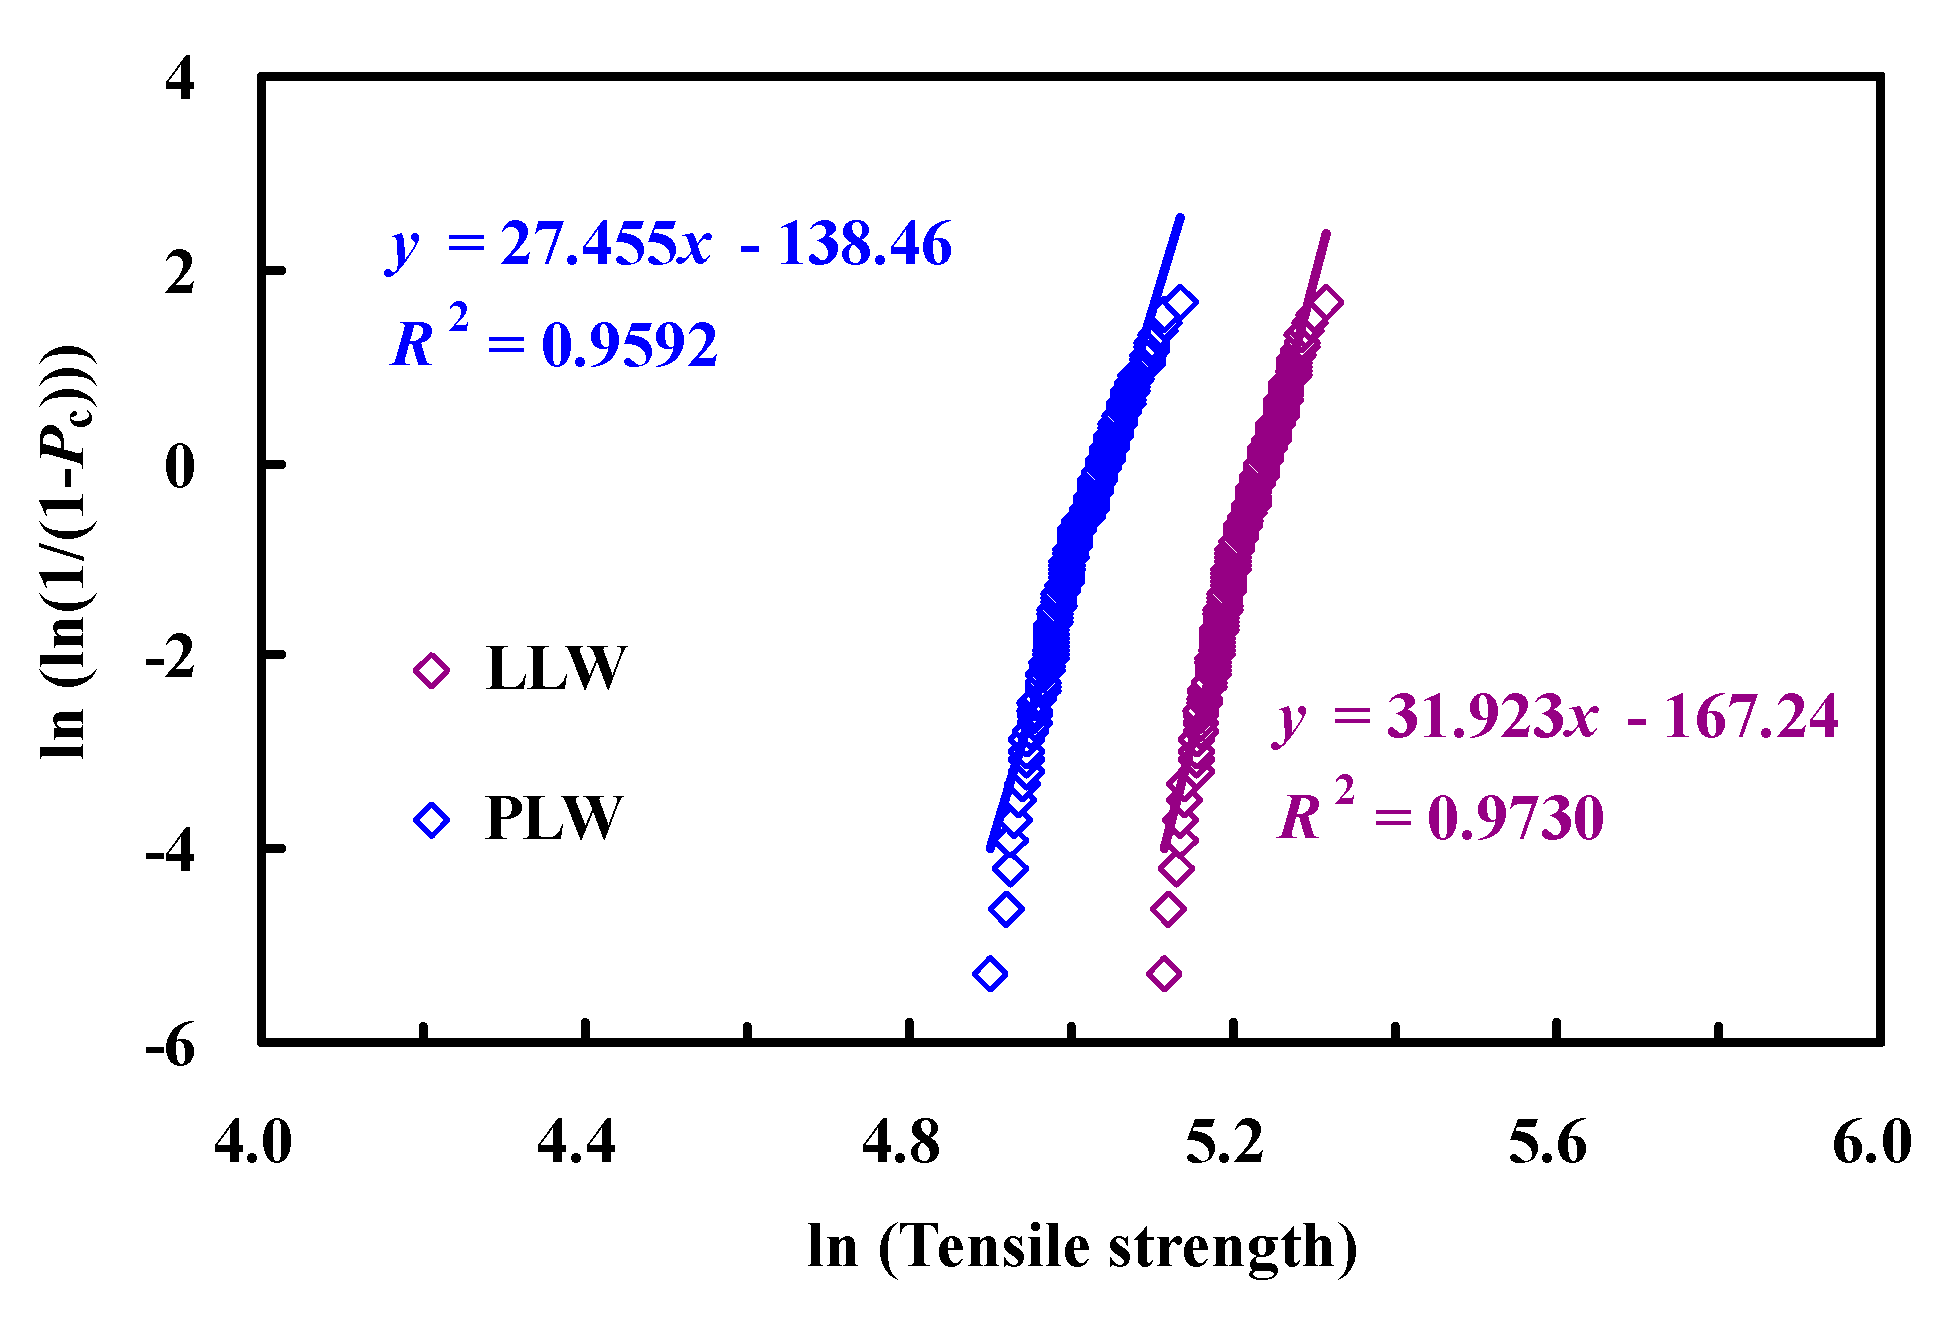
4.1. Analysis of Fiber Strength Distribution
- 20 mm (to provide the shortest gauge length)
- 20 and 60 mm (to provide the extreme of gauge lengths)
- All gauge lengths (to provide all gauge lengths)
| Gauge length (mm) | Linear-law model | Power-law model | |||
|---|---|---|---|---|---|
| γ | σ0 (MPa) | γ | σ0 (MPa) | λ | |
| 20 | 5.2 | 11,00 | 4.8 | 692 | 0.19 |
| 20 and 60 | 5.3 | 1,093 | 4.2 | 1,115 | 0.85 |
| All | 5.1 | 1,109 | 4.2 | 1,087 | 0.85 |
| Gauge length (mm) | Predicted strength (MPa) | Experimental data ** (MPa) | |||||
|---|---|---|---|---|---|---|---|
| L = 20 mm | L = 20, 60 mm | All lengths | |||||
| LLW * | PLW * | LLW * | PLW * | LLW * | PLW * | ||
| 20 | 569 (4.2) | 564 (3.3) | 572 (4.8) | 553 (1.4) | 567 (3.8) | 542 (0.8) | 546 (145) |
| 30 | 526 (4.2) | 555 (9.9) | 530 (4.9) | 510 (1.0) | 523 (3.6) | 500 (1.0) | 505 (130) |
| 40 | 498 (4.2) | 549 (14.8) | 502 (5.0) | 481 (0.6) | 495 (3.5) | 472 (1.4) | 478 (122) |
| 50 | 477 (9.4) | 544 (2.7) | 481 (10.4) | 460 (5.5) | 473 (8.6) | 451 (3.4) | 436 (115) |
| 60 | 461 (9.9) | 540 (28.9) | 465 (11.0) | 443 (5.8) | 457 (9.0) | 435 (3.7) | 419 (112) |
| Gauge length (mm) | Tensile strength (MPa) | |||
|---|---|---|---|---|
| Linear-law model | Power-law model | |||
| Mean value using Equation (3) | Standard deviation using Equation (5) | Mean value using Equation (4) | Standard deviation using Equation (6) | |
| 20 | 567 | 127 | 542 | 144 |
| 30 | 523 | 118 | 500 | 133 |
| 40 | 495 | 111 | 472 | 126 |
| 50 | 473 | 106 | 451 | 120 |
| 60 | 457 | 103 | 435 | 116 |
| 150 | 382 | 86 | 362 | 96 |
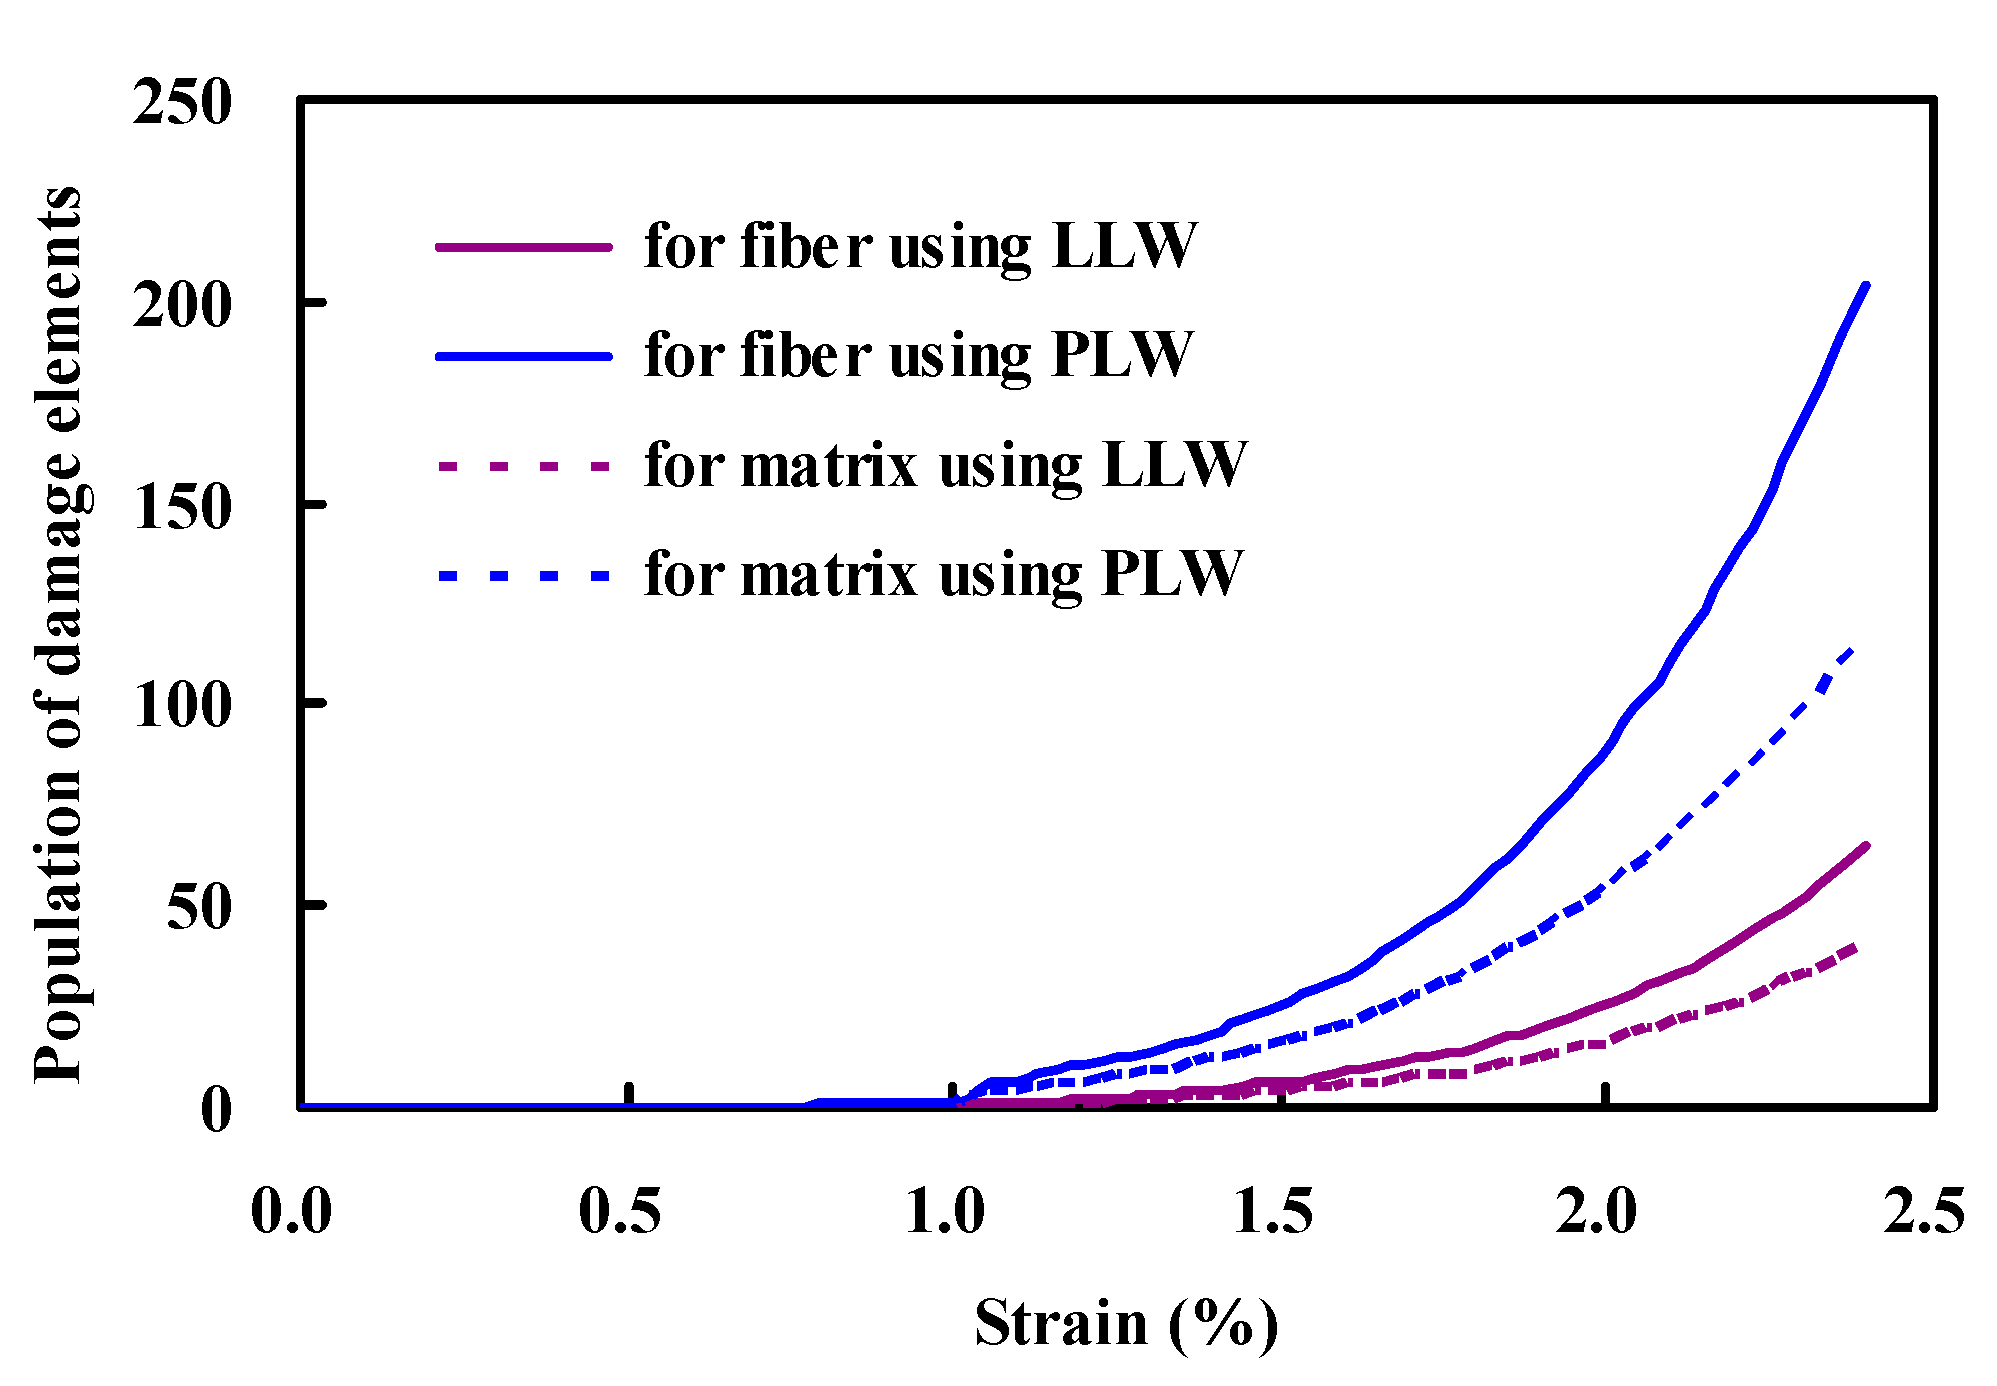
4.2. Analysis of Composite Strength Distribution
| Property | Fiber [29,36] | Matrix b |
|---|---|---|
| Tensile strength, (MPa) | 180–820 a | 65 |
| Young’s modulus, (GPa) | 12 | 2.7 |
| Shear modulus, (GPa) | – | 1.3 |
| Shear strength, (MPa) | – | 130 |


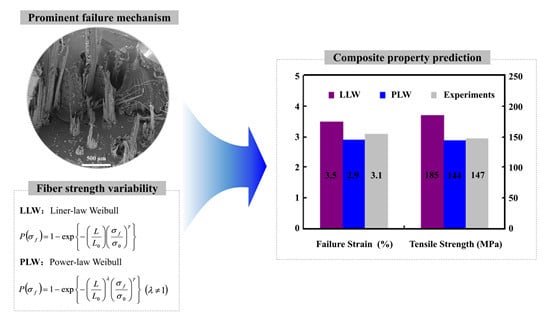
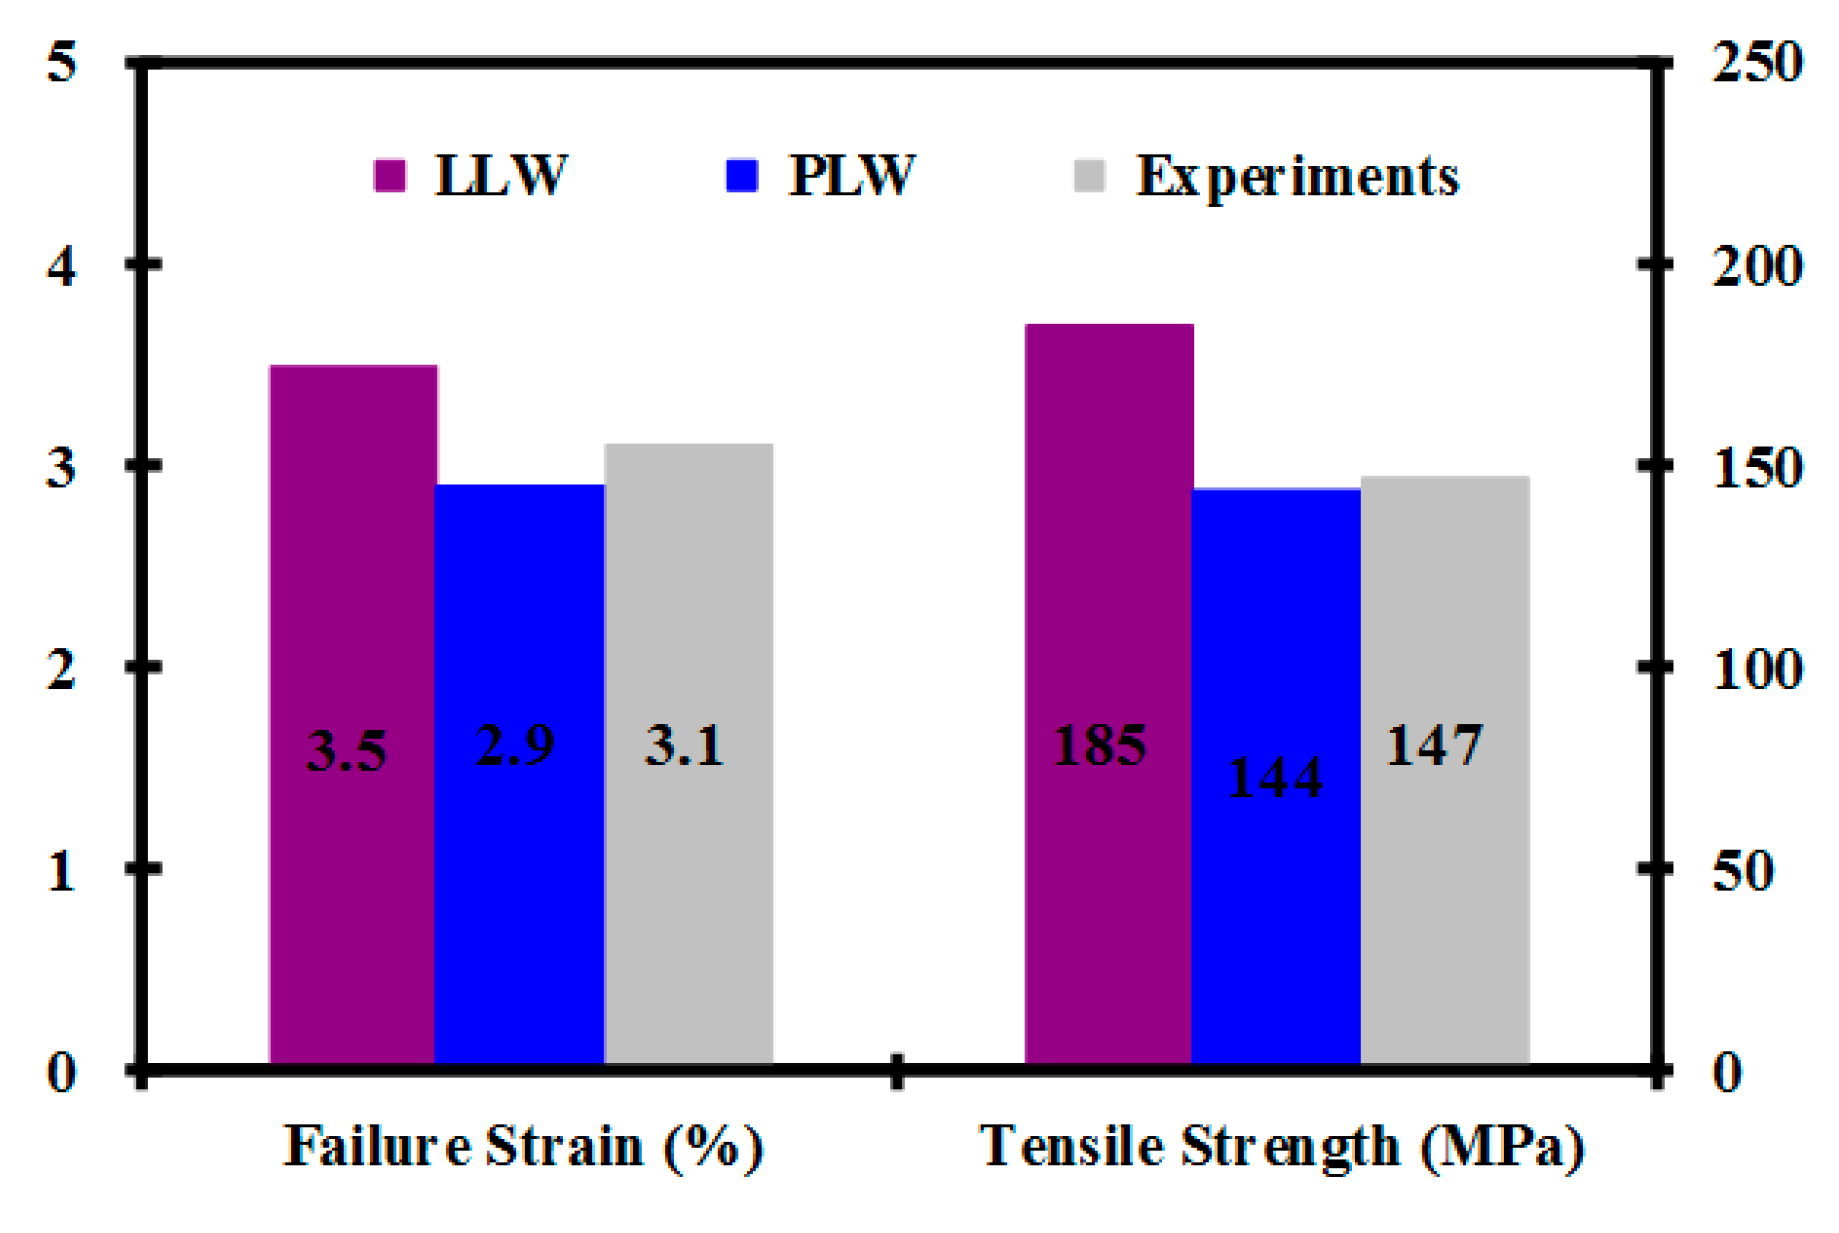
| Term | Strain when the first fiber breaks (%) | Stress when the first fiber breaks (%) | Failure strain (%) | Tensile strength (MPa) |
|---|---|---|---|---|
| LLW | 1.2 | 70 | 3.5 | 185 |
| PLW | 0.9 | 49 | 2.9 | 144 |

5. Conclusions
Acknowledgments
Author Contributions
Conflicts of Interest
Abbreviations
| LLW | Linear-law Weibull |
| PLW | Power-law Weibull |
| MLE | Maximum Likelihood Estimation |
References
- Pickering, K.L.; Murray, T.L. Weak link scaling analysis of high-strength carbon fibre. Compos. A Appl. Sci. Manuf. 1999, 30, 1017–1021. [Google Scholar] [CrossRef]
- Foray, G.; Descamps-Mandine, A.; R’Mili, M.; Lamon, J. Statistical flaw strength distributions for glass fibres: Correlation between bundle test and AFM-derived flaw size density functions. Acta Mater. 2012, 60, 3711–3718. [Google Scholar] [CrossRef]
- Curtin, W.A. Tensile strength of fiber-reinforced composites: III. Beyond the traditional Weibull model for fiber strengths. J. Compos. Mater. 2000, 34, 1301–1332. [Google Scholar] [CrossRef]
- Mishnaevsky, L.; Brøndsted, P. Micromechanisms of damage in unidirectional fiber reinforced composites: 3D computational analysis. Compos. Sci. Technol. 2009, 69, 1036–1044. [Google Scholar] [CrossRef]
- Curtin, W.A. Size scaling of strength in heterogeneous materials. Phys. Rev. Lett. 1998, 80, 1445–1448. [Google Scholar] [CrossRef]
- Bažant, Z.P. Size effect on structural strength: A review. Arch. Appl. Mech. 1999, 69, 703–725. [Google Scholar]
- Weibull, W. A statistical distribution function of wide applicability. J. Appl. Mech. 1951, 18, 293–297. [Google Scholar]
- Andersons, J.; Joffe, R.; Hojo, M.; Ochiai, S. Glass fibre strength distribution determined by common experimental methods. Compos. Sci. Technol. 2002, 62, 131–145. [Google Scholar] [CrossRef]
- Xia, Z.P.; Yu, J.Y.; Cheng, L.D.; Liu, L.F.; Wang, W.M. Study on the breaking strength of jute fibres using modified Weibull distribution. Compos. A Appl. Sci. Manuf. 2009, 40, 54–59. [Google Scholar] [CrossRef]
- Swolfs, Y.; McMeeking, R.M.; Verpoest, I.; Gorbatikh, L. The effect of fibre dispersion on initial failure strain and cluster development in unidirectional carbon/glass hybrid composites. Compos. A Appl. Sci. Manuf. 2015, 69, 279–287. [Google Scholar] [CrossRef]
- Mahesh, S.; Beyerlein, I.J.; Phoenix, S.L. Size and heterogeneity effects on the strength of fibrous composites. Physica D Nonlinear Phenom. 1999, 133, 371–389. [Google Scholar] [CrossRef]
- Andersons, J.; Poriķe, E.; Spārniņš, E. The effect of mechanical defects on the strength distribution of elementary flax fibres. Compos. Sci. Technol. 2009, 69, 2152–2157. [Google Scholar] [CrossRef]
- Trujillo, E.; Moesen, M.; Osorio, L.; van Vuure, A.W.; Ivens, J.; Verpoest, I. Bamboo fibres for reinforcement in composite materials: Strength Weibull analysis. Compos. A Appl. Sci. Manuf. 2014, 61, 115–125. [Google Scholar] [CrossRef]
- Zhang, Y.P.; Wang, X.G.; Pan, N.; Postle, R. Weibull analysis of the tensile behavior of fibers with geometrical irregularities. J. Mater. Sci. 2002, 37, 1401–1406. [Google Scholar] [CrossRef] [Green Version]
- Watson, A.S.; Smith, R.L. An examination of statistical theories for fibrous materials in the light of experimental data. J. Mater. Sci. 1985, 20, 3260–3270. [Google Scholar] [CrossRef]
- Ray, A.K.; Das, S.K.; Mondal, S.; Ramachandrarao, P. Microstructural characterization of bamboo. J. Mater. Sci. 2004, 39, 1055–1060. [Google Scholar] [CrossRef]
- Wang, F.; Shao, J.X.; Keer, L.M.; Li, L.; Zhang, J.Q. The effect of elementary fibre variability on bamboo fibre strength. Mater. Des. 2015, 75, 136–142. [Google Scholar] [CrossRef]
- Abdul Khalil, H.P.S.; Bhat, I.U.H.; Jawaid, M.; Zaidon, A.; Hermanwan, D.; Hadi, Y.S. Bamboo fibre reinforced biocomposites: A review. Mater. Des. 2012, 42, 353–368. [Google Scholar] [CrossRef]
- He, J.; Clarke, D.R. Determination of fibre strength distributions from bundle tests using optical luminescence spectroscopy. Proc. R. Soc. Lond. A 1997, 453, 1881–1901. [Google Scholar] [CrossRef]
- Landis, C.M.; Beyerlein, I.J.; McMeeking, R.M. Micromechanical simulation of the failure of fiber reinforced composites. J. Mech. Phys. Solids 2000, 48, 621–648. [Google Scholar] [CrossRef]
- Zhang, J.Q.; Wang, F. Modeling of damage evolution and failure in fiber-reinforced ductile composites under thermomechanical fatigue loading. Int. J. Damage Mech. 2010, 19, 851–875. [Google Scholar] [CrossRef]
- Padgett, W.J.; Durham, S.D.; Mason, A.M. Weibull analysis of the strength of carbon fibers using linear and power law models for the length effect. J. Compos. Mater. 1995, 29, 1873–1884. [Google Scholar] [CrossRef]
- Matveev, M.Y.; Long, A.C.; Jones, I.A. Modelling of textile composites with fibre strength variability. Compos. Sci. Technol. 2014, 105, 44–50. [Google Scholar] [CrossRef]
- Andersons, J.; Spārniņš, E.; Joffe, R.; Wallström, L. Strength distribution of elementary flax fibres. Compos. Sci. Technol. 2005, 65, 693–702. [Google Scholar] [CrossRef]
- Rao, K.M.M.; Rao, K.M. Extraction and tensile properties of natural fibers: Vakka, date and bamboo. Compos. Struct. 2007, 77, 288–295. [Google Scholar] [CrossRef]
- Virk, A.S.; Hall, W.; Summerscales, J. Multiple Data Set (MDS) weak-link scaling analysis of jute fibres. Compos. A Appl. Sci. Manuf. 2009, 40, 1764–1771. [Google Scholar] [CrossRef]
- Standard Test Method for Tensile Strength and Young’s Modulus for High Modulus Single-Filament Materials (Withdrawn 1998); ASTM International: West Conshohocken, PA, USA, 1975; ASTM D3379–75.
- Standard Test Method for Tensile Properties of Plastics; ASTM International: West Conshohocken, PA, USA, 2010; ASTM D638–10.
- Wang, F.; Shao, J.X.; Li, X. Statistics on the fracture strength of bamboo fibers. Polym. Compos. 2016, 37, 221–228. [Google Scholar] [CrossRef]
- Defoirdt, N.; Biswas, S.; de Vriese, L.; Tran, L.Q.N.; van Acker, J.; Ahsan, Q.; Gorbatikh, L.; van Vuure, A.; Verpoest, I. Assessment of the tensile properties of coir, bamboo and jute fibre. Compos. A Appl. Sci. Manuf. 2010, 41, 588–595. [Google Scholar] [CrossRef]
- Xia, Z.; Curtin, W.A.; Okabe, T. Green’s function vs. shear-lag models of damage and failure in fiber composites. Compos. Sci. Technol. 2002, 62, 1279–1288. [Google Scholar] [CrossRef]
- Wang, F.; Chen, Z.Q.; Wei, Y.Q.; Zeng, X.Q. Numerical modeling of tensile behavior of fiber-reinforced polymer composites. J. Compos. Mater. 2010, 44, 2325–2340. [Google Scholar] [CrossRef]
- Zhang, J.Q.; Wang, F. Modeling of progressive failure in ductile matrix composites including local matrix yielding. Mech. Adv. Mater. Struct. 2009, 16, 522–535. [Google Scholar] [CrossRef]
- Wang, F.; Li, X.; Zhang, J.Q.; Li, L.; Keer, L.M. Micromechanical modelling of the progressive failure in unidirectional composites reinforced with bamboo fibers. Mech. Mater. 2016, 94, 180–192. [Google Scholar] [CrossRef]
- Okabe, T.; Takeda, N.; Kamoshida, Y.; Shimizu, M.; Curtin, W.A. A 3D shear-lag model considering micro-damage and statistical strength prediction of unidirectional fiber-reinforced composites. Compos. Sci. Technol. 2001, 61, 1773–1787. [Google Scholar] [CrossRef]
- Wang, F.; Shao, J.X. Modified Weibull distribution for analyzing the tensile strength of bamboo fibers. Polymers 2014, 6, 3005–3018. [Google Scholar] [CrossRef]
- Curtin, W.A. Dimensionality and size effects on the strength of fiber-reinforced composites. Compos. Sci. Technol. 2000, 60, 543–551. [Google Scholar] [CrossRef]
- Ibnabdeljalil, M.; Curtin, W.A. Strength and reliability of fiber-reinforced composites: Localized load-sharing and associated size effects. Int. J. Solids Struct. 1997, 34, 2649–2668. [Google Scholar] [CrossRef]
- Goda, K. The role of interfacial debonding in increasing the strength and reliability of unidirectional fibrous composites. Compos. Sci. Technol. 1999, 59, 1871–1879. [Google Scholar] [CrossRef]
© 2016 by the authors. Licensee MDPI, Basel, Switzerland. This article is an open access article distributed under the terms and conditions of the Creative Commons by Attribution (CC-BY) license ( http://creativecommons.org/licenses/by/4.0/).
Share and Cite
Li, X.; Wang, F. Effect of the Statistical Nature of Fiber Strength on the Predictability of Tensile Properties of Polymer Composites Reinforced with Bamboo Fibers: Comparison of Linear- and Power-Law Weibull Models. Polymers 2016, 8, 24. https://doi.org/10.3390/polym8010024
Li X, Wang F. Effect of the Statistical Nature of Fiber Strength on the Predictability of Tensile Properties of Polymer Composites Reinforced with Bamboo Fibers: Comparison of Linear- and Power-Law Weibull Models. Polymers. 2016; 8(1):24. https://doi.org/10.3390/polym8010024
Chicago/Turabian StyleLi, Xue, and Fang Wang. 2016. "Effect of the Statistical Nature of Fiber Strength on the Predictability of Tensile Properties of Polymer Composites Reinforced with Bamboo Fibers: Comparison of Linear- and Power-Law Weibull Models" Polymers 8, no. 1: 24. https://doi.org/10.3390/polym8010024
APA StyleLi, X., & Wang, F. (2016). Effect of the Statistical Nature of Fiber Strength on the Predictability of Tensile Properties of Polymer Composites Reinforced with Bamboo Fibers: Comparison of Linear- and Power-Law Weibull Models. Polymers, 8(1), 24. https://doi.org/10.3390/polym8010024