Article

Near Azeotropic Ethanol–Water Mixture Pervaporation Through a Polyvinyl Alcohol Membrane: A Parametric Study on Process Efficiency


by
Cristiana Luminița Gîjiu
,
Daniel Dumitru Dinculescu
* and
Raluca Isopescu
Faculty of Chemical Engineering and Biotechnologies, National University of Science and Technology POLITEHNICA Bucharest, 011061 Bucharest, Romania
*
Author to whom correspondence should be addressed.
Polymers 2026, 18(1), 65; https://doi.org/10.3390/polym18010065
Submission received: 23 November 2025 / Revised: 12 December 2025 / Accepted: 19 December 2025 / Published: 25 December 2025
(This article belongs to the Special Issue Preparation and Application of Polymer Membranes)

Abstract

The goal of this study was to explore how different operating parameters influence the performance of a polyvinyl alcohol (PVA) membrane in pervaporation for separating ethanol–water mixtures. Specifically, the focus was on understanding how variations in feed composition, temperature, and permeate pressure affect the separation efficiency. The study aimed to provide a range of operating conditions that offer a balance between maximizing both the purity and quantity of ethanol. This was achieved through statistical models, which were generated by simulating the pervaporation process under various conditions using COMSOL Multiphysics® 6.3 and following a Box–Behnken design. It was found that similar operating conditions (temperature ~100 °C; pressure ~4–5 kPa) are suitable for both kinds of mixtures near azeotrope, with higher water content (~0.15 mass fraction) and lower water content (~0.05 mass fraction) obtaining very high recuperation degrees (generally above 99%). For more concentrated solutions (lower water content), it was possible to obtain optimal trade-off solutions (separation degree vs. retentate enrichment in ethanol), even at lower temperatures (~80 °C).

1. Introduction

There is a wide variety of processes that lead to the obtaining of azeotropic mixtures. Perhaps the best-known case is the ethyl alcohol/water azeotropic mixture, which needs to be separated in cases where (bio)ethanol is intended to be used as a (bio)fuel, for example. The butanol/water azeotrope also belongs to the same category [1]. As expected, the chemical industry also abounds in examples of azeotropic mixtures that appear in various manufacturing processes of certain chemical products: dimethyl carbonate/methanol [2,3], methanol/methyl-tert-butyl-ether [4], ethanol/ethyl-tert-butyl-ether [5,6], benzene/cyclohexane [7], etc.
The separation processes of azeotropic mixtures are usually energy and/or material-intensive (as is the case of the solvent used in separation by liquid–liquid extraction [8,9], extractive distillation [9,10,11,12], or azeotropic distillation [9,12]). The separation processes are usually performed in two steps: a first step involving separation by classical processes until concentrations close to the azeotrope concentration are obtained, followed by a second step involving breaking the azeotrope and purifying the components. The first way to approach the separations of liquid mixtures (of course, where the difference between the boiling points of the components allows it) was (and still is) distillation/rectification [8,9,10,11,12].
However, this separation option is only useful until the concentration corresponding to the azeotropic mixture is obtained. Therefore, to obtain pure components from such a mixture, membrane processes, in particular pervaporation, have been proposed [13,14]. Pervaporation does not suffer from the thermodynamic limitations that occur in the case of azeotropic mixtures, generally relying on the solubilization–diffusion mechanism of the mixture compounds in the membrane material. Hence, there is a need to obtain (and to obtain at the industrial level, not in the laboratory) membranes with high selectivity (high product quality) and ensure high permeate flows (high productivity). However, designing modules for optimal operation is also essential in convincing the industry to modernize [15,16].
A recent study [17] presents the evolution in the period 2002–2021 of the number of publications (articles, reviews, patents, books, conferences, etc.) relating to pervaporation membranes compared to pervaporation modules, i.e., the equipment that actually works to achieve separations by pervaporation (tubular, spiral, hollow-fiber). In a year, if the research to obtain membrane materials is in the order of hundreds, those for the design and study of the functioning of separation modules are barely in the order of tens. A possible explanation could be the reluctance of the industrial environment to replace classic equipment with modern separation equipment [14], apparently not yet convinced of its performance. However, the same authors present a comparative energy consumption for the dehydration of 100 kg of isopropanol starting from the azeotrope containing 88% isopropanol by mass. While in the case of azeotropic distillation and adsorption, it is 36 kWh and 29 kWh, respectively, in the case of pervaporation, it is only 12 kWh.
Recent European regulations require that economic, environmental, and sustainability criteria should be considered when selecting the most appropriate separation methods. Therefore, it has become imperative to replace outdated techniques in certain separation processes with modern techniques that comply with these new regulations.
Over the past two decades, extensive theoretical and numerical studies have been devoted to the modeling of pervaporation processes, with rigorous solutions of the governing transport equations implemented using analytical approaches and computational platforms, such as MATLAB, COMSOL, and CFD-based solvers [18,19,20,21,22,23,24,25,26,27,28]. In this context, most studies emphasize on the description of module hydrodynamics and focus on mass transport mechanisms (e.g., the solution–diffusion model) and their influence on membrane separation properties (selectivity and permeability) [29,30,31,32,33,34,35,36,37,38,39]. However, there has been limited attention to the integrated modeling of heat transfer during the pervaporation process [27,28,34,35,36,37,38]. Furthermore, these studies typically do not incorporate heat transfer along the entire pervaporation module but focus only on the membrane itself [38]. This is surprising given the negligible thickness of the selective membrane layers relative to the module length and the importance of heat for vapor formation on the permeate side. Efficient heat transfer management can significantly impact the overall energy efficiency of the process. By neglecting heat transfer, the process dynamics are only partially understood. The lack of focus on thermal coupling in pervaporation models represents a notable gap in the literature, especially considering the growing interest in energy-efficient membrane systems for large-scale industrial applications. The only comprehensive approach identified in the literature, which integrates flow, mass, and heat transfer for more accurate system performance predictions, is found in [27,28,34,35,36,37], and none of these refer to a PVA membrane. This approach offers valuable insights for optimizing pervaporation processes, aiming for energy reduction and improved productivity.
Regarding the membranes studied in pervaporation processes, they are different, but the vast majority are polymeric: hydrophilic (polyvinyl alcohol (PVA), polyelectrolyte complexes (PECs), chitosan (CS), cellulose derivatives, polyamide (PA), polyimide (PI), etc.) or hydrophobic (poly(dimethylsiloxane) (PDMS), poly[1-(trimethylsilyl)-1-propyne] (PTMSP), polyvinyl chloride (PVC), etc.) [40,41,42].
PVA is widely regarded as the polymer of choice for pervaporation membranes because it combines a set of material properties that match the requirements for efficient separation of water–organic mixtures. By itself, it is not used as a standalone pervaporation membrane because it swells significantly in water, weakening its mechanical properties and reducing its effectiveness [43]. To address this, PVA is typically modified or crosslinked to improve stability and performance [44,45]. The pronounced hydrophilicity of poly(vinyl alcohol)–based membranes confers a strong thermodynamic affinity for water, resulting in high water sorption and permeability and, consequently, preferential water transport under pervaporation conditions [46,47,48,49,50,51,52]. This intrinsic water selectivity underpins their widespread application in the dehydration of alcohols and other organic mixtures, as well as in emerging pervaporation-driven desalination processes, where transport performance is strongly modulated by membrane modification strategies and operating conditions [53,54,55,56,57]. Moreover, PVA has excellent film-forming ability and mechanical stability, allowing the fabrication of dense, defect-free composite membranes (flat-sheet, tubular, or hollow-fiber) with controlled thickness and uniformity [47,49,50]. Its chemical resistance and ability to be chemically modified or crosslinked further enhance its durability, reduce excessive swelling, and improve long-term performance under pervaporation conditions [48,49,55]. Additionally, as reported in the recent review on pervaporation–desalination membranes [53], PVA remains “the main polymer used to make high flux pervaporation membranes,” underscoring its prevalence and general acceptance in both research and industrial applications.
Unsurprisingly, according to what was presented above, PVA was the polymer for the very first commercial pervaporation membranes. In the early 1980s, Gesellschaft für Trenntechnik (GFT) developed a composite membrane featuring a thin, crosslinked PVA selective layer supported on a porous poly(acrylonitrile) substrate. This membrane, deployed for alcohol–water dehydration (e.g., ethanol), marked the transition of PV from laboratory studies to industrial-scale use [41,57]. Since then, PVA-based membranes (including commercially available products, such as the PERVAP™ line [52,56,57]) have remained the benchmark hydrophilic membranes for solvent dehydration and other pervaporation applications [41].
Response Surface Methodology (RSM) offers a robust approach for modeling the relationships between multiple factors and responses, enabling the identification of optimal operating conditions for enhanced process performance [58,59]. In the context of pervaporation, RSM has been applied to optimize membrane materials [60,61] and process variables and system performance [62,63,64,65], particularly for organic solvents and alcohol–water mixtures.

2. Models and Solving Methods

2.1. Pervaporation Theoretical Model in COMSOL Multiphysics®

The separation process was quantitatively described using the flow, heat, and mass transfer equations, particularized for a PVA membrane as a very thin layer on a porous support. According to several research studies [47,49,50], the support reduces the degree of swelling. However, specific values have not been mentioned. The membrane permeance used in the present study was estimated by [57] from experiments reported in [52] for a commercial PVA membrane. The expression of permeance is a function of water activity (aw) and temperature (T), and, consequently, it also encompasses the possible swelling (Table 1).

2.1.1. Geometry

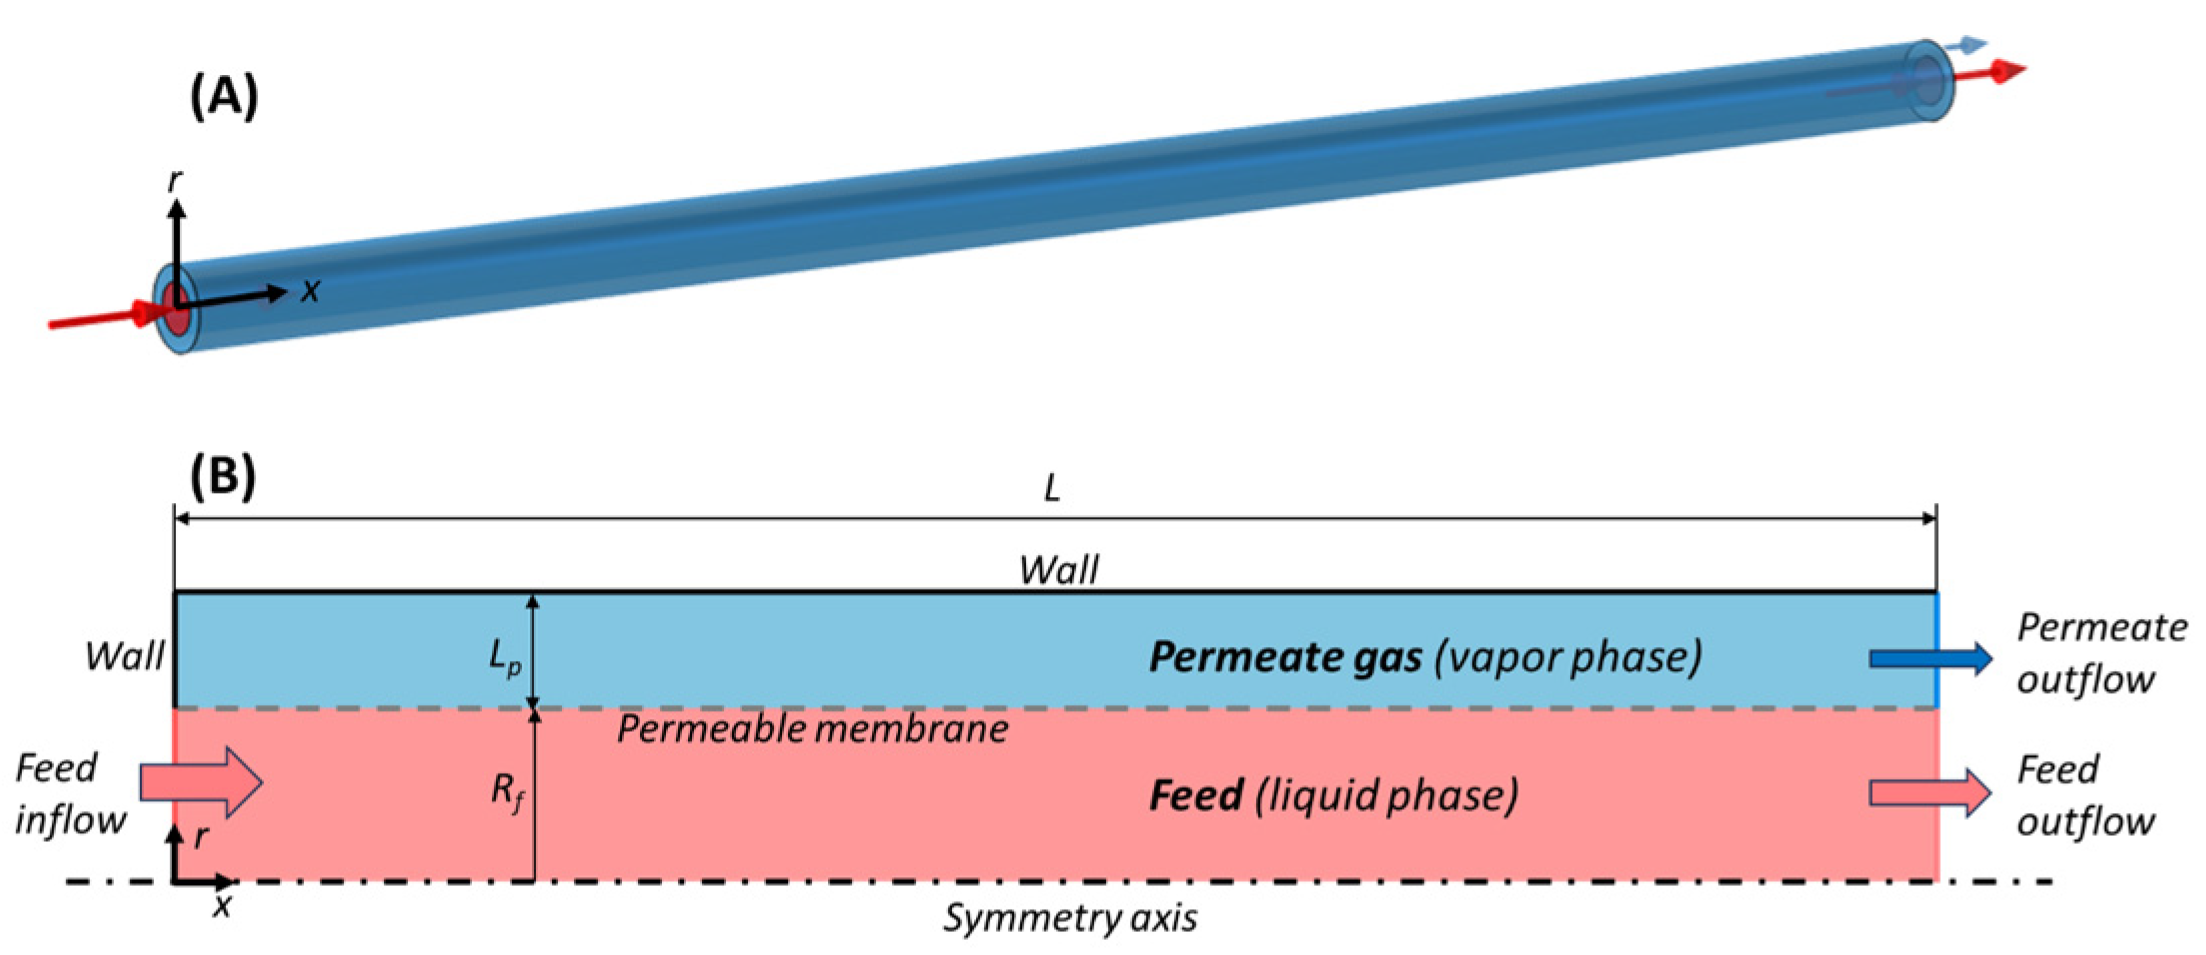
The pervaporation module consists of a cylindrical tube-in-tube configuration of length L with an active separation layer of PVA. The liquid feed (ethanol with a small fraction of water) flows in the lumen, with radius Rf, while the gaseous permeate (mostly water) is collected in the outer shell of the tubular pervaporation device, with thickness Lp. Therefore, the model is built on an axisymmetric geometry, with radial direction r and axial direction x (Figure 1).

2.1.2. Fluid Dynamics

Feed side. The feed is a liquid mixture of ethanol and water that flows within the lumen of the membrane module. At the operating conditions (Reynolds number Ref = 474, flow velocity 2 cm/s), the flow is laminar, incompressible, and stationary, and is thus represented by the Navier–Stokes equations of momentum conservation (1) and continuity (2) as follows:
ρ f u f u f = p f + η f u f + u f T
u f = 0
where u f = u f , r , u f , x is the vector of fluid velocity and pf is the pressure in the feed domain f. The physical properties, density ρf, and viscosity ηf, are calculated functions of the local mixture composition and temperature (Table 1).
The flow is driven by setting a fully developed laminar flow with an average velocity in the inlet (x = 0) and an outlet (x = L), with gauge pressure set to a reference value of zero, while axial symmetry applies at r = 0. On the permeable wall (r = Rf), the total volumetric flux of water and ethanol is a velocity imposed on the radial component of the feed velocity, u f , r , u f , z = J f , v , 0 i.e., normal to the boundary. The volumetric flux of liquid permeate, J f , v = J w / ρ w , L + J e / ρ e , L , results from the mass fluxes of the two components, J w = N w M w and J e = N e M e . The molar fluxes Nw and Ne are expressed as a function of membrane layer permeabilities for water and ethanol, Pm,w and Pm,e, depending on mass fraction of water in liquid wf,w (Table 1), membrane active layer thickness Lm, and driving force of permeation that is the difference in partial pressures between feed and permeate [66].
N w = P m , w L m γ w x f , w P v , w x p , w p p
N e = P m , e L m γ e x f , e P v , e x p , e p p
For water (wb) and ethanol (e), γ in Equations (3) and (4) is the activity coefficient function of mole fractions in the liquid feed, xf, and Pv are the vapor pressures functions of the feed temperature Tf, xp is the mole fraction in the vapor (permeate) phase, and pp is the total permeate pressure. The expressions of activity coefficients (NRTL relations) and vapor pressures (Antoine-like equations), as well as the other parameters, are listed in Table 1.
Permeate side. The permeate is a gaseous mixture of ethanol and water vapors that flows within the space created between the concentric tubes. The laminar gas flow is also stationary, but compressible, and is thus represented by momentum and mass conservation in Equations (5) and (6) as follows:
ρ p u p u p = p p + η p u p + u p T 2 3 η p u p I
ρ u p = 0
where u p = u p , r , u p , x is the vector of fluid velocity and pp is the pressure in the permeate domain. The gas density ρp is calculated according to the ideal gas law, and viscosity ηp results from a mixing law. Both function as the local mixture composition and temperature (Table 1).
The gas outlet (x = L) is defined by imposing a very low (close to vacuum) absolute pressure, pp = pp,out. The opposite wall (x = 0) and the lateral wall (r = Rf + Lp) are sealed, with zero gas velocity. On the permeable surface (r = Rf), the same total volumetric flux of water and ethanol coming from the feed is imposed on the radial permeate velocity, u p , r , u p , z = J f , v , 0 .

2.1.3. Mass Transfer

Feed side. The mass balance for ethanol is set as a function of mass fractions wf,e and wf,w given that the mixture cannot be treated as a very diluted solution of water in ethanol. The convective transport is supported by the liquid flow velocity uf, while diffusion was considered according to a Fick’s law approximation and was driven by the mass fraction gradient and was proportional to the water–ethanol diffusion coefficient Df,we as follows:
D f , w e w f , e + u f w f , e = 0
This simplified form of mass transport in binary mixtures, represented by Equation (7), produced the same results as the rigorous but much more complicated Maxwell–Stefan approach in our model tests, and no mixture diffusion correction flux was needed. With the computed distribution of wf,e, the remaining mass fraction of water results from the mass constraint wf,w =1 − wf,e. The mass fractions and mole fractions are interconvertible with x f , e = w f , e M e M f and xf,w =1 − xf,e, where the average molecular weight of the mixture is M f = w f , e M e + w f , w M w 1 .
The mass fraction in the liquid inlet (x = 0) is wf,e = wf,e,in, supplied from a specified mole fraction xf,e = xf,e,in. In the outflow (x = L), the normal diffusion flux is zero (i.e., only convection is allowed, and the normal mass fraction gradient is null, w f , e = 0 ). The usual axial symmetry applies in the center of the feed pipe (r = 0). The mass fluxes of ethanol and water at the permeable boundary (r = Rf) are set to equal the diffusive fluxes corrected with the Stefan velocity (the total mass flux exiting through the membrane divided by density) as follows:
ρ f D f , w e w f , e + J w + J e w f , e = J e
ρ u p = 0
The liquid density was computed for the mixture, dependent on local values of liquid composition and temperature (Table 1).
Permeate side. The mass balance for ethanol is set similarly to that in the liquid side, and functions of mass fractions in the permeate are wp,e and wp,w. The convective transport is driven by the vapor velocity up, and the diffusion flux was again approximated by Fick’s law from the mass fraction gradient and the water–ethanol diffusion coefficient Dp,we in the vapor phase.
ρ p D p , w e w p , e + ρ p u p w p , e = 0
No sensible differences appeared when using a Maxwell–Stefan approach and mixture diffusion corrections. The balance contains a variable vapor density, ρp, computed by the ideal gas law with local values pp, Tp, and wp,e. The mass fraction of water in the gaseous permeate is wp,w = 1 – wp,e, and the mole fractions are x p , e = w p , e M e M p and xp,w = 1 – xp,e.
In the outflow (x = L), the normal diffusive flux is zero, i.e., the exiting flux is only convective. The lateral wall (r = Rf + Lp) and the wall opposite to the outflow (x = 0) are insulated, and thus there are no mass fluxes of any component. The same type of permeable boundary as in the feed is set at r = Rf, except that here, the total flux enters the permeate phase.

2.1.4. Heat Transfer

Feed side. The stationary heat balance allows computing the temperature spatial distribution, Tf, and it includes conductive and convective heat transfer rates.
k f T f + ρ f C p , f u f T f = 0
where the thermal conductivity kf, the liquid density ρf, and the heat capacity at constant pressure Cp,f depend on the local temperature and mixture composition (Table 1).
The liquid inflow (x = 0) has a set temperature Tf,in, no conduction (i.e., no normal gradient of temperature) is assigned in the outflow (x = L), and axial symmetry (i.e., no heat flux) is set on the pipe axis at r = 0. On the membrane surface, water and ethanol evaporate and the liquid loses heat; therefore, an outward heat flux equal to the heat of vaporization is set at r = Rf: k f T f = q v a p . The total vaporization heat flux is the sum of the two evaporating components, q v a p = J w L v , w + J e L v , e , computed using the latent heat of vaporization of water Lv,w and ethanol Lv,e.
Permeate side. In the permeate (vapor phase), another heat balance is used to compute the spatial distribution of temperature Tp as follows:
k p T p + ρ p C p , p u p T p = 0
where the thermal conductivity kp and heat capacity Cp,p function as part of the local temperature and mixture composition, and density ρp is computed from the ideal gas law (Table 1).
The walls at x = 0 and r = Rf + Lp are insulated (adiabatic), whereas in the outflow (x = L), there is no more normal gradient of temperature (i.e., zero conduction). The membrane is assumed to be ideally conductive, so the temperature on the permeate side equals that on the feed side (Tp = Tf at r = Rf).

2.1.5. Parameters and Physical Properties

Model parameters include geometry dimensions and operating conditions (compositions, temperatures, pressures, and flow velocities). Furthermore, most physical properties are functions of temperature, and the mixture relations are also functions of composition (mole or mass fractions)—as presented in Table 1. Membrane permeability data and water–ethanol selectivity are also listed in Table 1.
Table 1. Model parameters, physical properties, and expressions for the average properties of the ethanol–water mixture.
DescriptionSymbolValue or ExpressionUnitsSource and Comments
Module lengthL1000mm
Feed tube radiusRf6mm
Permeate gap sizeLp2mm
Liquid feed inlet velocityuf,in2cm/s
Mass fractions in feed
   water
   ethanol

wf,w,in
wf,e,in

0.1
0.9

kg/kg
Inlet temperature feedTf,in100°C373.15 K
Permeate outflow pressurepp,out3kPaVacuum

Activity coefficients,
liquid

ln γ i
j x j τ j i G j i k x k G k i + j x j G i j k x k G k i τ i j m x m τ m j G m j k x k G k j
G i j = exp α i j τ i j
τ i j = a i j + b i j T f     α i j = c i j     c i j = c j i = α
          a i i = a j j = b i i = b j j = 0
aew = 0;           awe 0;
bew = −55.1681;       bwe = 670.441;
cew = cwe = 0.3031;

-


-
NRTL model equations

[57,67,68]

(Tf in K)
Vapor pressures


Pv,w


Pv,e
exp 65.93 7230 / T f 7.177 ln T f + 4.031 10 6 T f 2

exp 86.49 7931 / T f 10.25 ln T f + 6.389 10 6 T f 2
kPa


kPa
[69]


[69]
(Tf in K)
Density, liquid
   mixture

   water

   ethanol

ρf

ρw,L

ρe,L
1 w f , w / ρ w , L + w f , e / ρ e , L

0.000010335 T f 3 0.013395 T f 2 + 4.969288 T f + 432.2571

1038.799 0.850402 T f

kg m−3

kg m−3

kg m−3

[69]

[69]

[69]
(Tf in K)
Density, gas mixtureρp p p M p R T p kg m−3Ideal gas law
Viscosity, liquid
   mixture

   water


ethanol
ηf

ηw,L


ηe,L
exp x f , w ln η w , L + x f , e ln η e , L

1.3799566 0.021224 T f + 1.360456 10 4 T f 2 4.645409 10 7 T f 3 + 8.904273 10 10 T f 4 9.079069 10 13 T f 5 + 3.845733 10 16 T f 6
exp ( 1665 . 38568 / T f   -   12 . 399037 )

Pa s


Pa s

Pa s

[69]

[69]


[69]
(Tf in K)
Viscosity, gas
   mixture

   water


   ethanol

ηp

ηw,G


ηe,G

x p , w η w , G + x p , e η e , G

3.798134 10 6 + 2.778857 10 9 T p + 7.621016 10 11 T p 2 6.580738 10 14 T p 3 + 2.07707 10 17 T p 4
9.85045 10 7 + 3.361886 10 8 T p 2.673253 10 12 T p 2 7.131648 10 15 T p 3 + 3.44277 10 18 T p 4

Pa s

Pa s


Pa s

[69]

[69]

[69]
(Tf and Tp
in K)
Thermal
conductivity, liquid
   mixture

   water

   ethanol


kf

kw,L

ke,L


x f , w k w , L + x f , e k e , L

0.9003748 + 0.0083877 T f 1.118205 10 5 T f 2

0.2571662 3.064779 10 4 T f


W m−1 K−1

W m−1 K−1

W m−1 K−1


[69]

[69]

[69]
(Tf in K)
Thermal
conductivity, gas
   mixture

   water


   ethanol


kp

kw,G


ke,G


x p , w k w , G + x p , e k e , G

0.002953 + 2.573956 10 5 T p + 9.807821 10 8 T p 2 3.963389 10 11 T p 3 + 1.026238 10 14 T p 4

k w , G


W m−1 K−1

W m−1 K−1


W m−1 K−1

[69]

[69]

(Tp in K)
Assumed (negligible ethanol
fraction in permeate)
Heat capacity const. P, liquid
   mixture

   water

   ethanol


Cp,f

Cp,w,L

Cp,e,L


w f , w C p , w , L + w f , e C p , e , L

4035.84079 + 0.492312034 T f

384.391653 + 9.60563138 T f


J kg−1 K−1

J kg−1 K−1

J kg−1 K−1


[69]

[69]

[69]
(Tf in K)
Heat capacity const. P, gas
   mixture

   water


   ethanol


Cp,p


Cp,w,G


Cp,e,G


w p , w C p , w , G + w p , e C p , e , G

1745.96354 + 0.185114 T p + 6.19448 10 4 T p 2 3.02678 10 7 T p 3 + 4.19053 10 11 T p 4

878.1048 0.67455 T p + 0.012544 T p 2 1.59894 10 5 T p 3 + 6.34290 10 9 T p 4


J kg−1 K−1

J kg−1 K−1


J kg−1 K−1


[69]

[69]


[69]
(Tp in K)
Molar mass
   mixture


   water
   ethanol

Mf, Mp


Mw
Me

1 w f , w / M w + w f , e / M e ,   1 w p , w / M w + w p , e / M e

18
46

g mol−1


g mol−1
g mol−1
Latent heat of vaporization

   water
   ethanol


Δ H v = C 1 1 T r C 2 + C 3 T r + C 4 T r 2

J/kmol

[70]

Tr = T/Tc
(Tf in K)
C1C2C3C4Tc, K
5.66·1070.612041−0.6256970.398804647.096
6.5831·1071.1905−1.76661.0012514
Diffusion coefficient ethanol–water, liquidDf,we 1.3 10 9 1.02 T f 298.15 m2 s−1(Tf in K)
Diffusion coefficient ethanol–water, gasDp,we 2 10 5 m2 s−1
Membrane
permeances
   water


   ethanol


Pm,w/Lm


Pm,e/Lm


3.54853 10 - 7 exp ( 1.5771484 a w ) exp [ ( E w / R ) ( 1 / T r e f 1 / T ) ]


1.07990 10 - 10 exp ( 3.5393051 a w ) exp [ ( E e / R ) ( 1 / T r e f 1 / T ) ]

Tref = 368.15 K
Ew = 15,208.6 kJ/kmol
Ee = 15,208.6 kJ/kmol


kmol m 2 s kPa

kmol m 2 s kPa


[57]


[57]

2.1.6. Model Solution

The numerical model was implemented and solved in the finite element modeling software COMSOL Multiphysics® 6.3. The Chemical Reaction Engineering module of COMSOL was used to define all the model equations for the fluid flow (Single-Phase Laminar Flow), mass transfer (Transport of Concentrated Species), and heat transfer (Heat Transfer in Fluids). All partial differential equations used linear discretization schemes.
A mapped two-dimensional mesh of rectangular elements was used, with 100 equal elements over length x, 30 elements over feed tube radius Rf varying from 10 μm next to the membrane to 200 μm at the symmetry axis, and 20 elements over the permeate gap Lp with a size from 30 μm next to the membrane to 150 μm at the wall.
For numerical stability, two stationary solver steps were used consecutively. The first is for isothermal flow and mass transfer, and the second also includes heat transfer, using the solution of the first step as the initial value.

2.2. Statistical Modeling and Optimization

To gain a deeper insight into how operational parameters and attributes influence the performance of PVA membranes, we conducted statistical modeling, generating virtual experiments in COMSOL. Considering a membrane surface of 2 m2 (to be relevant for practical applications), the efficiency of the pervaporation process was calculated based on the accurate model derived from fundamental principles and presented above.
The virtual experiments were carried out using a Box–Behnken design [14], according to the Response Surface Method (RSM) [15], considering three independent variables: feed water mass fraction, feed temperature, and permeate pressure.
The dependent variables calculated from the simulation results were the relative ethanol enrichment in the retentate (Equation (13)) and rejection percentages of the membranes (Equation (14)).
R E   ( % ) = w R , e w F , e w F , e 100
s   ( % ) = R w R , e F w F , e 100
where wR,e and wF,e are ethanol mass fractions in retentate and feed, respectively, and R and F are retentate and feed mass rates.
Table 2 outlines the range of parameter variations in the virtual experimental study, using the values from the COMSOL model as a central point (Table 1).
The details of the experiments conducted as a part of this investigation are shown in Table 3 and are presented in the Section 3.
The regression models for RE and s were further considered as criteria for multiobjective optimization, aiming for their simultaneous maximization, which was performed using the global optimization tools implemented in MATLAB R2025.

3. Results and Discussion

3.1. Pervaporation Theoretical Model in COMSOL Multiphysics®

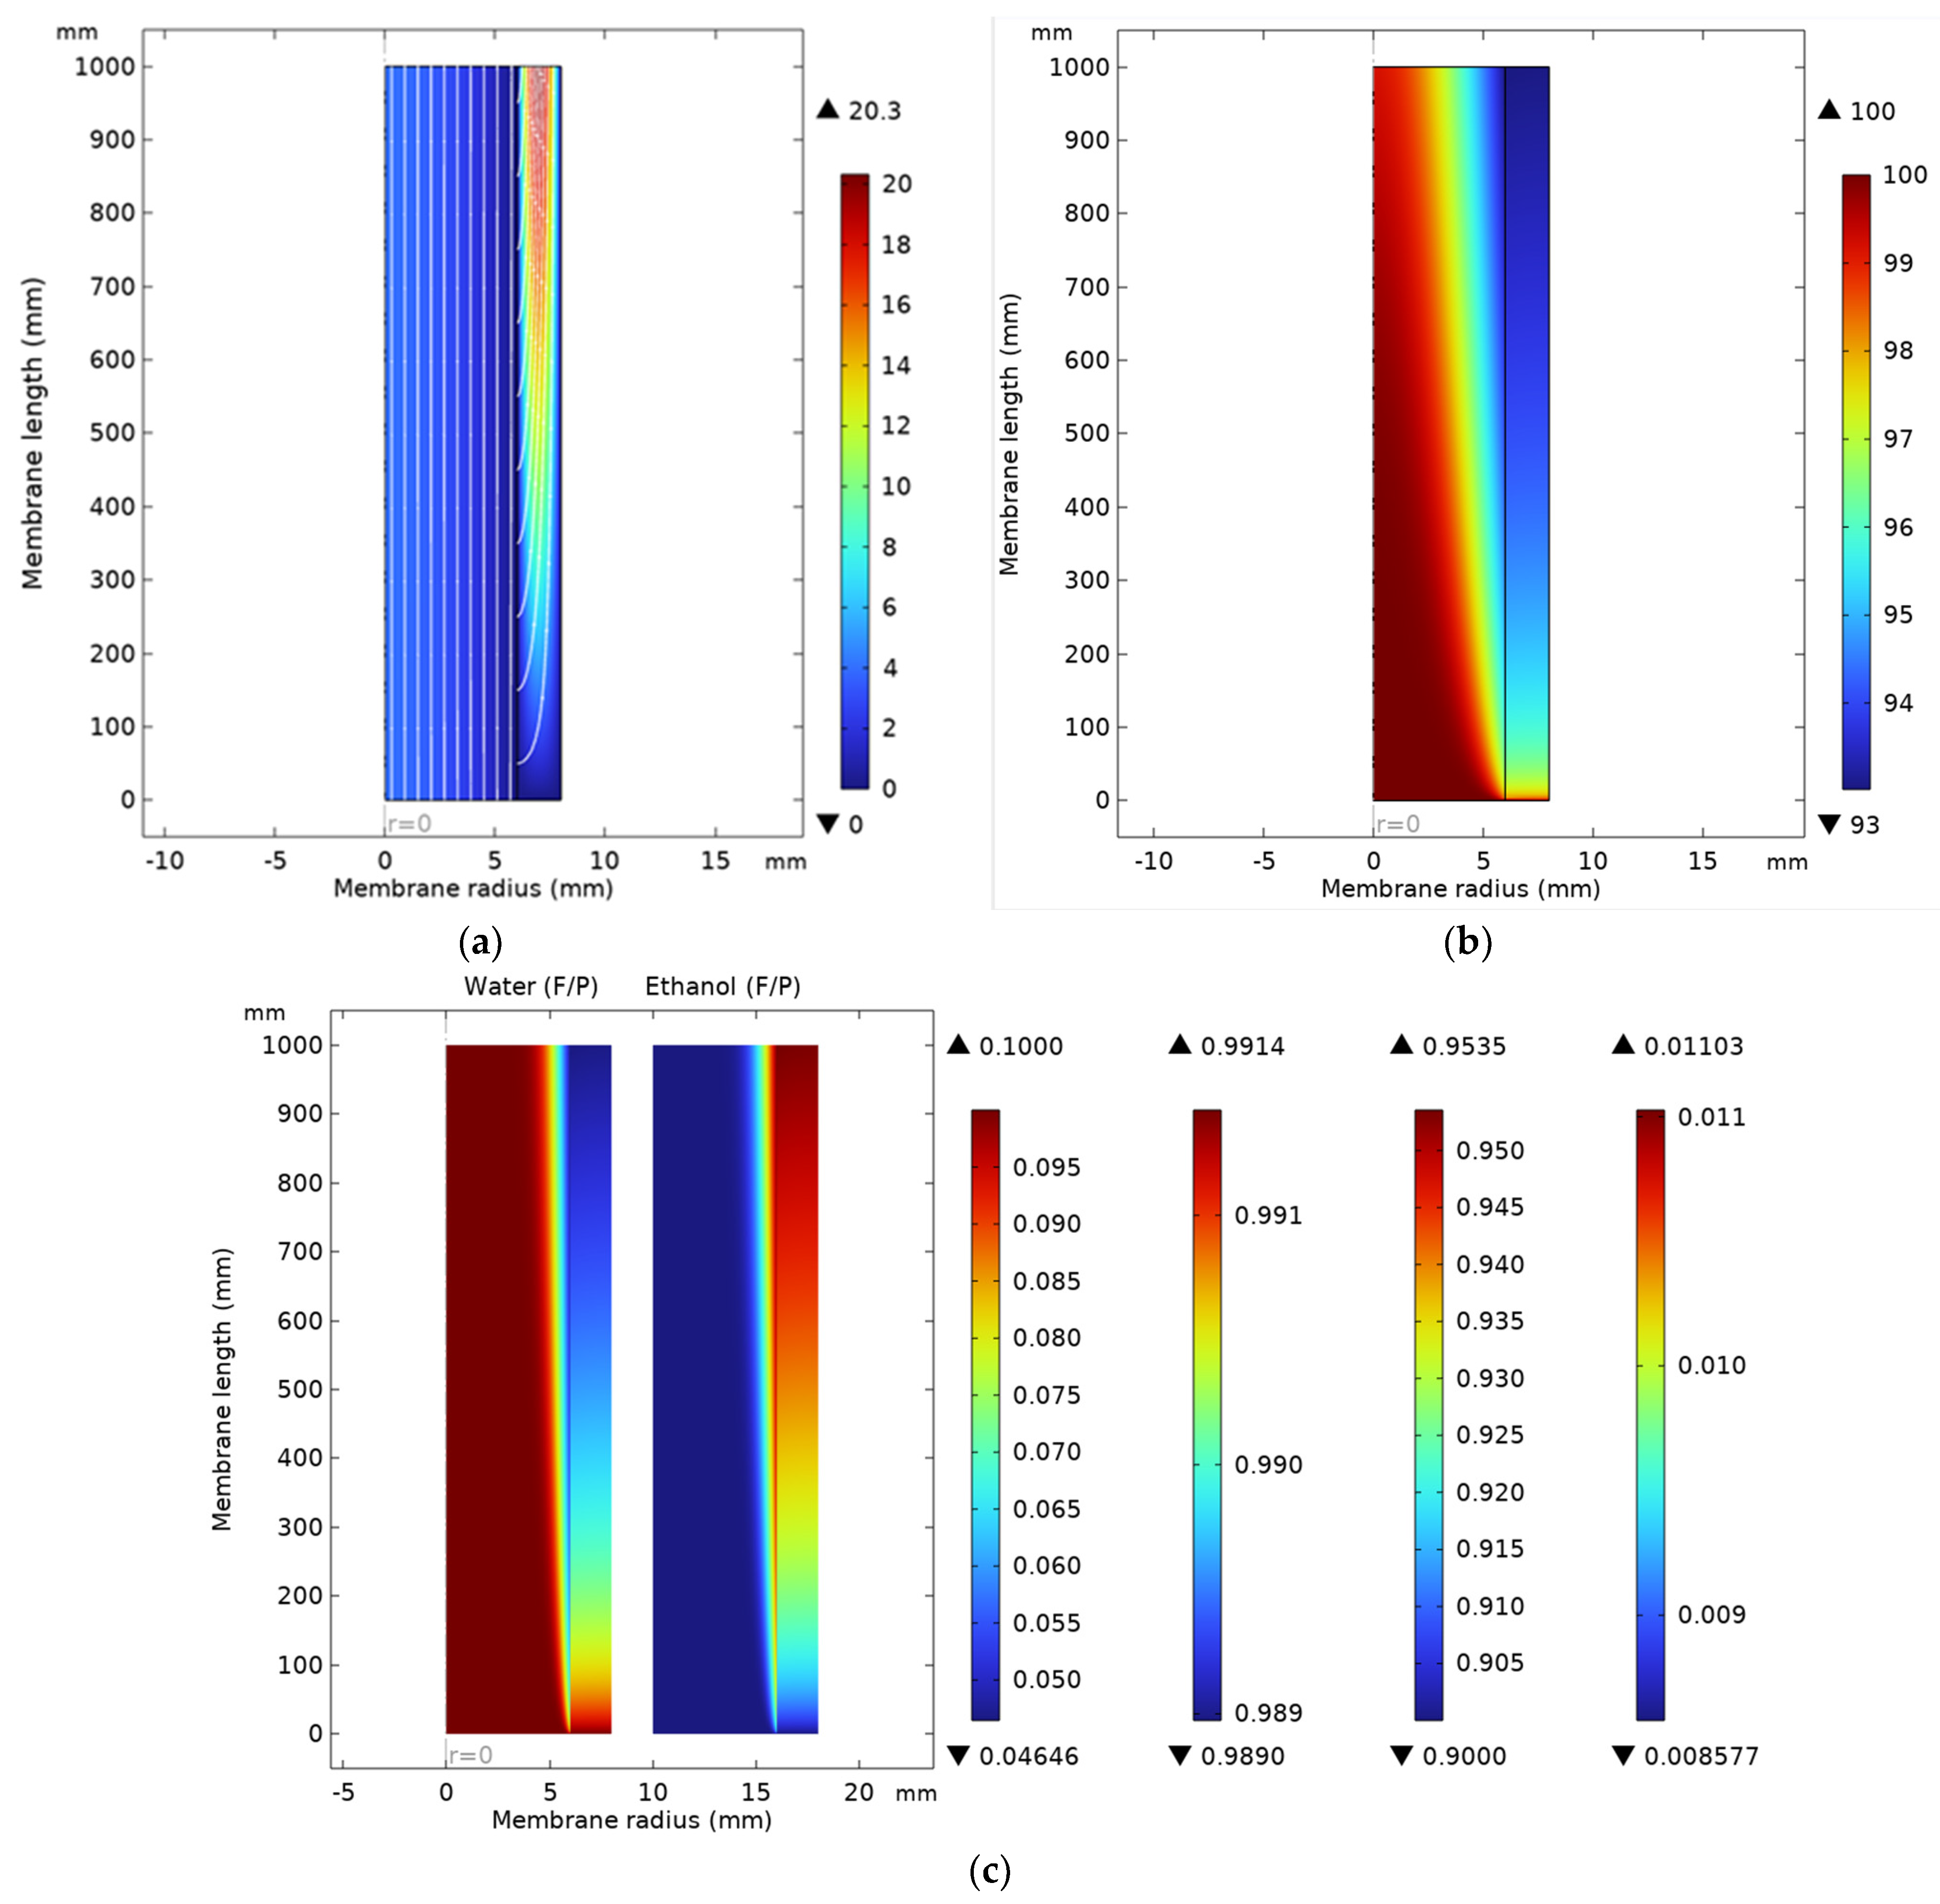
Based on the model considering the flow, mass, and heat transfer equations implemented in COMSOL, the velocities, temperatures, and concentration profiles were obtained, and they are presented in Figure 2. The surface-type graphs show the axisymmetric 2D section through the membrane module.
Figure 2a illustrates the laminar profile of the flow (maximum velocity values in the center of each compartment). Higher velocities are noticed in the permeate compartment, as the permeate is in the vapor phase. As one can see in Figure 2b, the temperature in the retentate (feed compartment) decreases due to the vaporization process during pervaporation through the membrane, and as expected, the permeate is cooler than the retentate.
Figure 2c presents both water and ethanol profiles in the same 2D section of the membrane. The origin of the ethanol mass fraction representation is translated, so the symmetry axis appears at the value of 10 mm. The first two color bars refer to the water concentrations in feed and permeate, respectively, while the ethanol concentration legends are given by the other two color bars. It has to be noticed that the color scale is different, as it is associated with different concentration ranges for water and ethanol, respectively.
The water concentration decreases along the membrane in the feed due to the permeation process and also in the permeate due to simultaneous mass transfer of the ethanol through the membrane, even if this is less important. On a 1 m long membrane, the decrease in water concentration in the feed compartment is about 5%, while in the permeate, it is only ~0.2%. The ethanol mass fraction profile proves its concentration in the retentate (feed compartment) from 0.9 to 0.9535.
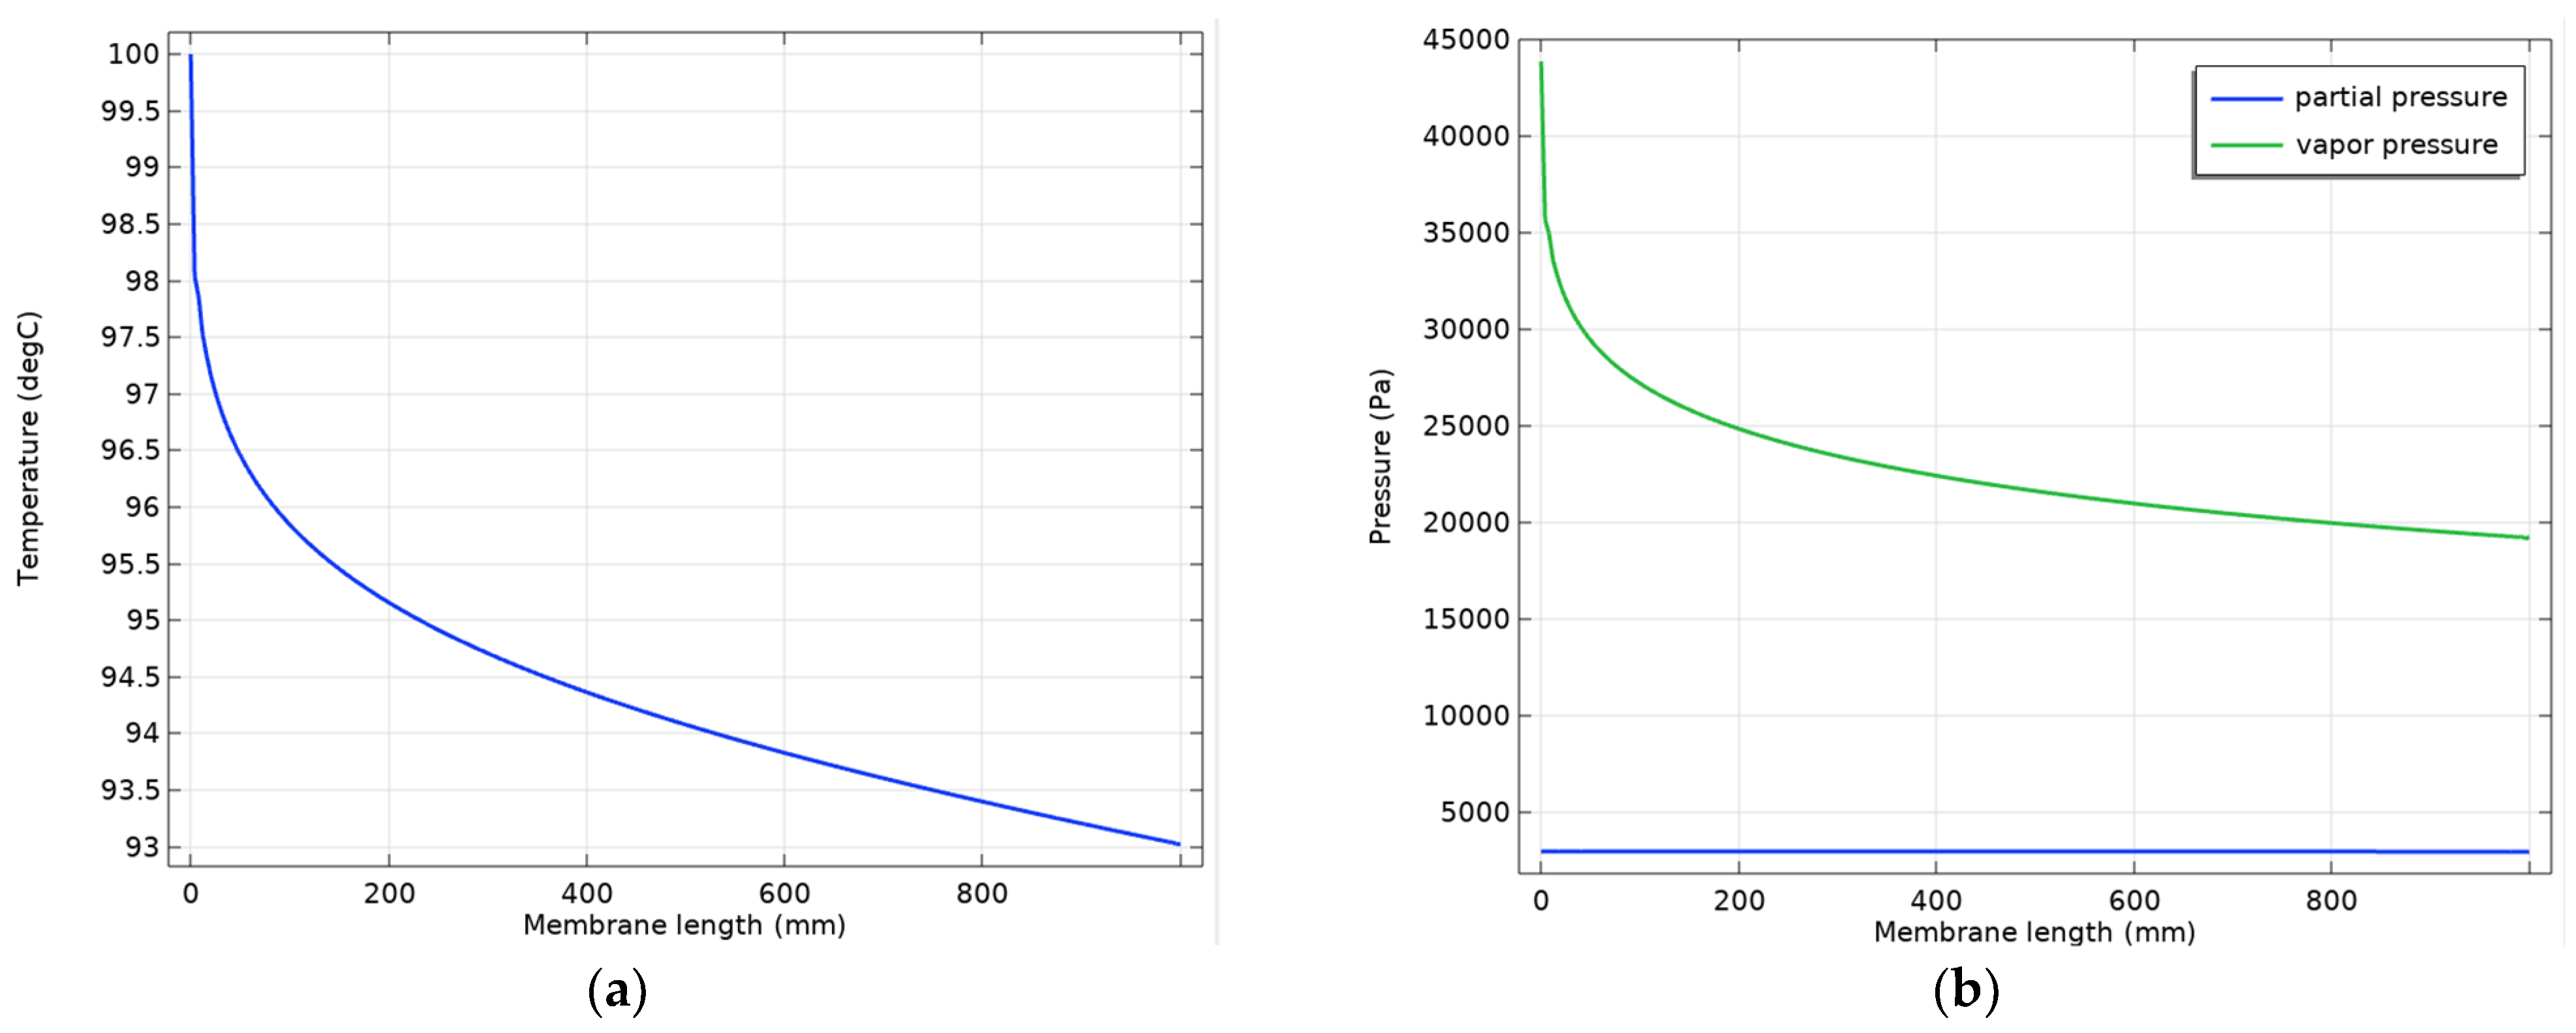
As the PVA membrane is selective for water, the process driving force of the permeation is the difference between the water vapor pressure and the water partial pressure in the permeate γ w x f , w P v , w x p , w p p . Figure 3 presents the variation of the temperature and this driving force along the membrane.
As one can see in Figure 3a, the temperature in the feed compartment decreases along the membrane due to the vaporization of the permeate. For the 1 m long membrane, the decrease is maybe not important (only 7 degrees), but it leads to a reduction in driving force (Figure 3b).
Analyzing the modeling results, one can say that the COMSOL model proves to be consistent with the theoretical description of the pervaporation process, and the studied PVA membrane shows a good capacity to concentrate the ethanol in solutions near azeotropic mixtures.
Moreover, the values of water fluxes through the membrane calculated in COMSOL were compared (Table 3) with the literature reports [52,57] for the same operating conditions.
To extend the study to more practical applications, we used this model to simulate the PVA membrane performance on a larger scale (a membrane surface of about 2 m2).

3.2. Statistical Modeling and Optimization

The virtual experimental values for relative enrichment of ethanol in retentate RE (%) and the ethanol recuperation degree s (%) for every combination of the operating parameters, according to the Box–Behnken program, are presented in Table 4.
The second-degree models were proposed in terms of coded variables for both the relative enrichment of ethanol in retentate and the ethanol recuperation degree. The general relation of these models is as follows:
y = b 0 + b 1 x 1 + b 2 x 2 + b 3 x 3 + b 12 x 1 x 2 + b 13 x 1 x 3 + b 23 x 2 x 3 + b 11 x 1 2 + b 22 x 2 2 + b 33 x 3 2
where y stands for the relative enrichment of ethanol in retentate RE and the ethanol recuperation degree s, respectively.

3.2.1. Model for Relative Enrichment of Ethanol in Retentate

The model coefficients were calculated by regression, and the values and their significance are presented in Table 5. According to Fisher’s test, the model is significant at a level of 5% (p-value = 1.453·10−4). The determination coefficient R2 for the model is 0.9993, and the adjusted R2 is slightly lower, 0.9972.
The minor influence of x32 and the interactions between permeate pressure and feed concentration (x1·x3) and permeate pressure and temperature (x2·x3) is confirmed by the analysis of the significance of the model coefficients—the p-value (Table 5).
R E   ( % ) = 4.14222 + 1.557732 x 1 + 1.626906 x 2 0.249572 x 3 + 0.568607 x 1 x 2 0.019582 x 1 x 3 + + 0.045 x 2 x 3 0.26554 x 1 2 + 0.04834 x 2 2 + 0.001664 x 3 2
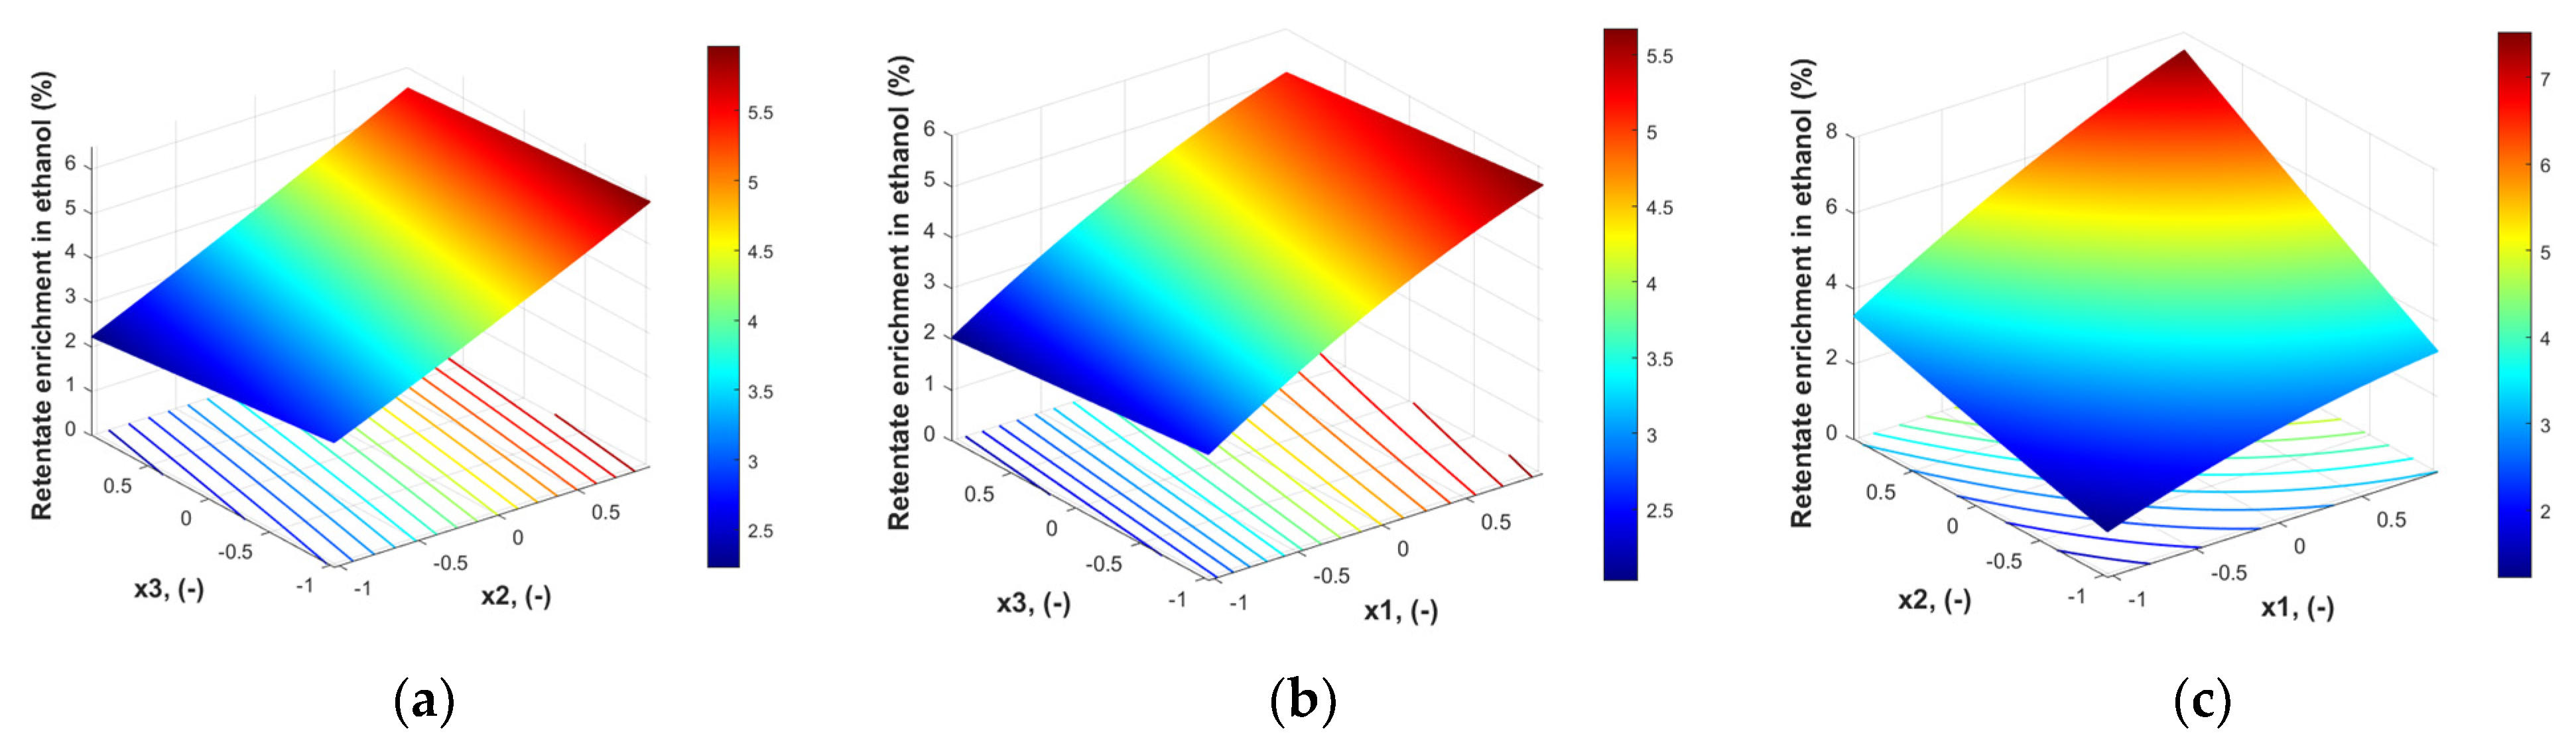
The response surface corresponding to this model (Equation (16)) is given in Figure 4.
As Figure 4 shows, the response surface does not exhibit a clear maximum. Some high retentate enrichment in ethanol values can be reached in a region characterized by higher values of x1 and x2 and lower values of x3.

3.2.2. Model for Ethanol Recuperation Degree

The general model proposed for ethanol recuperation degree is given by Equation (17), and the coefficients of the full second-order degree model obtained are given in Table 6. The coefficient of determination is R2 = 0.9959, the adjusted R2 is 0.9837, and the Fisher test confirms the significance of the model (p-value = 0.001998).
The model used in this study is as follows:
s   ( % ) = 99.303 0.28225 x 1 0.0395 x 2 + 0.07575 x 3 + 0.00425 x 1 x 2 + 0.03625 x 1 x 3 0.02475 x 2 x 3 + 0.002375 x 1 2 + 0.040875 x 2 2 + 0.002375 x 3 2
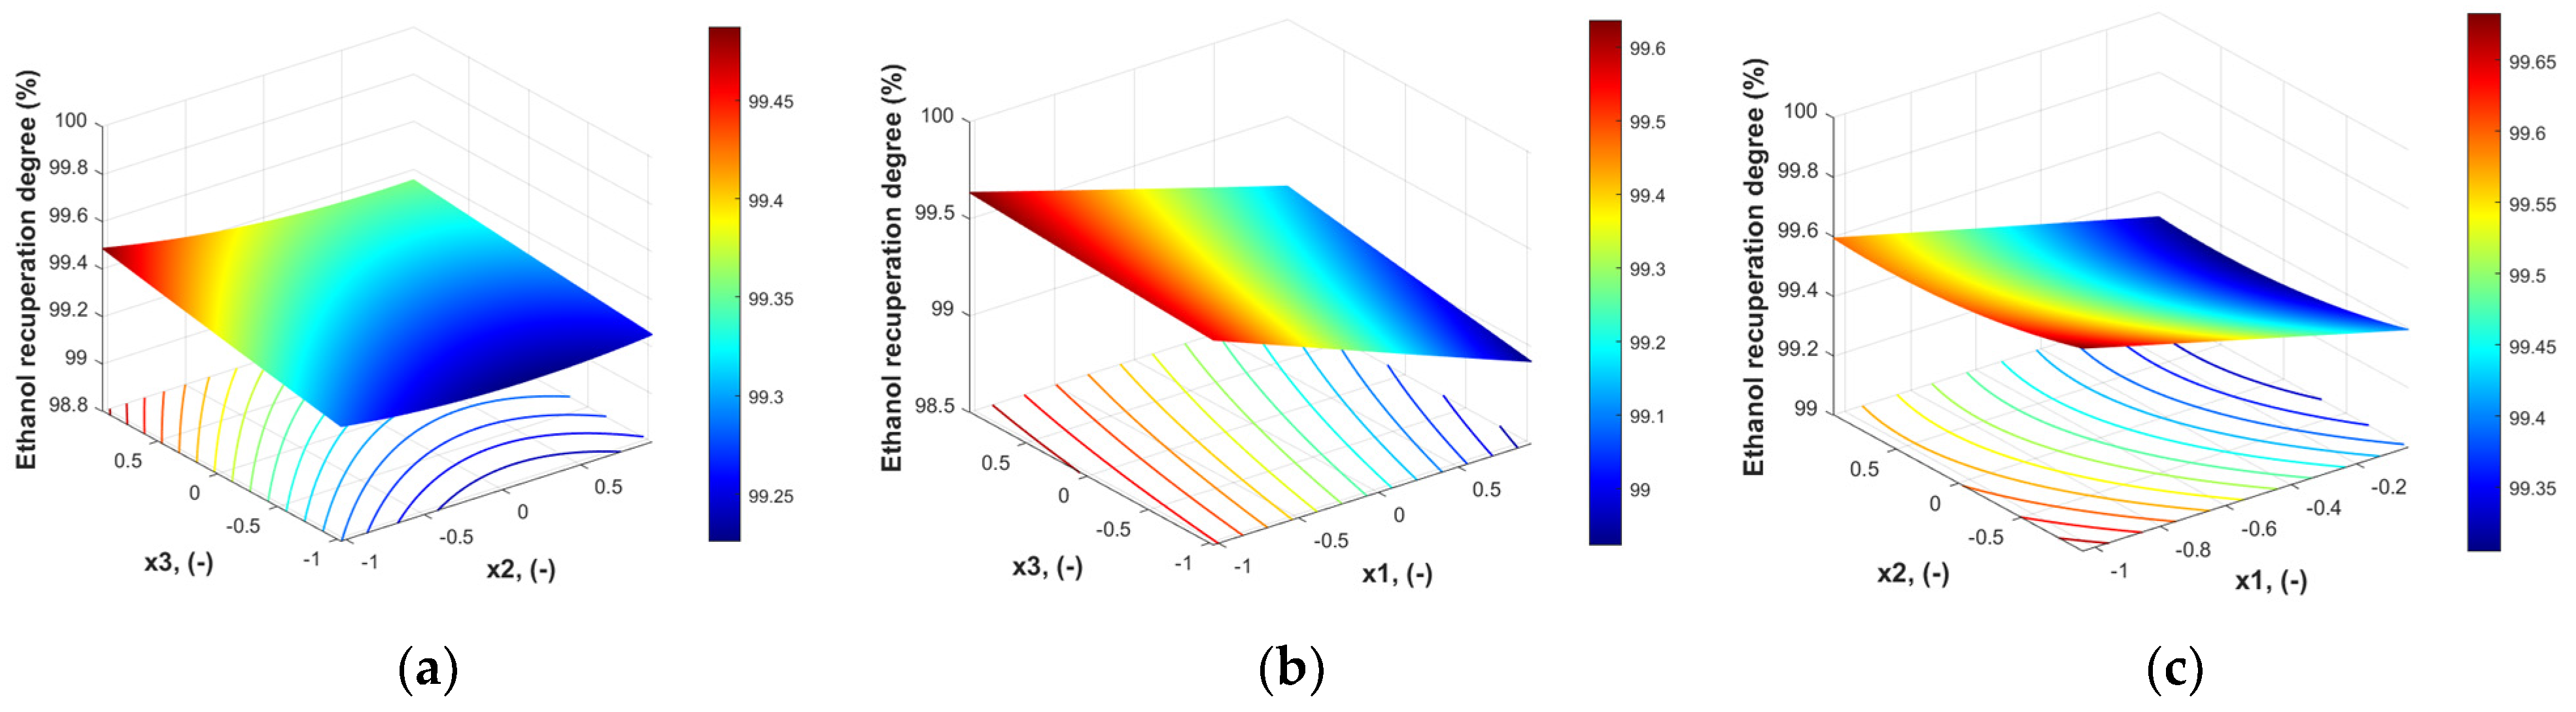
A more relevant image of the response surface is given in Figure 5.
As Figure 5 shows, the response surface for ethanol recuperation degree does not exhibit a clear maximum. Some high recuperation degrees of ethanol can be reached at lower values of x1 and x2 and higher values of x3, which is a contradictory trend compared to the retentate enrichment in ethanol.
This dichotomy leads to the need to find ways to optimize both objectives. The objective functions considered for the optimization are expressed by the polynomial models obtained (Equations (16) and (17)).
These two objective functions must be maximized simultaneously in order to identify operating conditions that improve membrane performance. Traditional optimization methods attempt to combine conflicting objectives either by assigning weights and merging them into a single function or by defining a desirability index for each criterion and aggregating these into an overall desirability function. Both approaches require predefined scaling and restriction of the solution space, ultimately yielding a single optimal point [71].
In this study, genetic algorithms (GAs) were selected to address the multiobjective optimization problem. Because they evaluate many candidate solutions in parallel, GAs are particularly well-suited for identifying Pareto fronts rather than single optimal solutions. Unlike scalarization techniques that require multiple runs to explore various trade-offs, genetic algorithms generate a diverse set of Pareto-optimal solutions within a single evolutionary process.
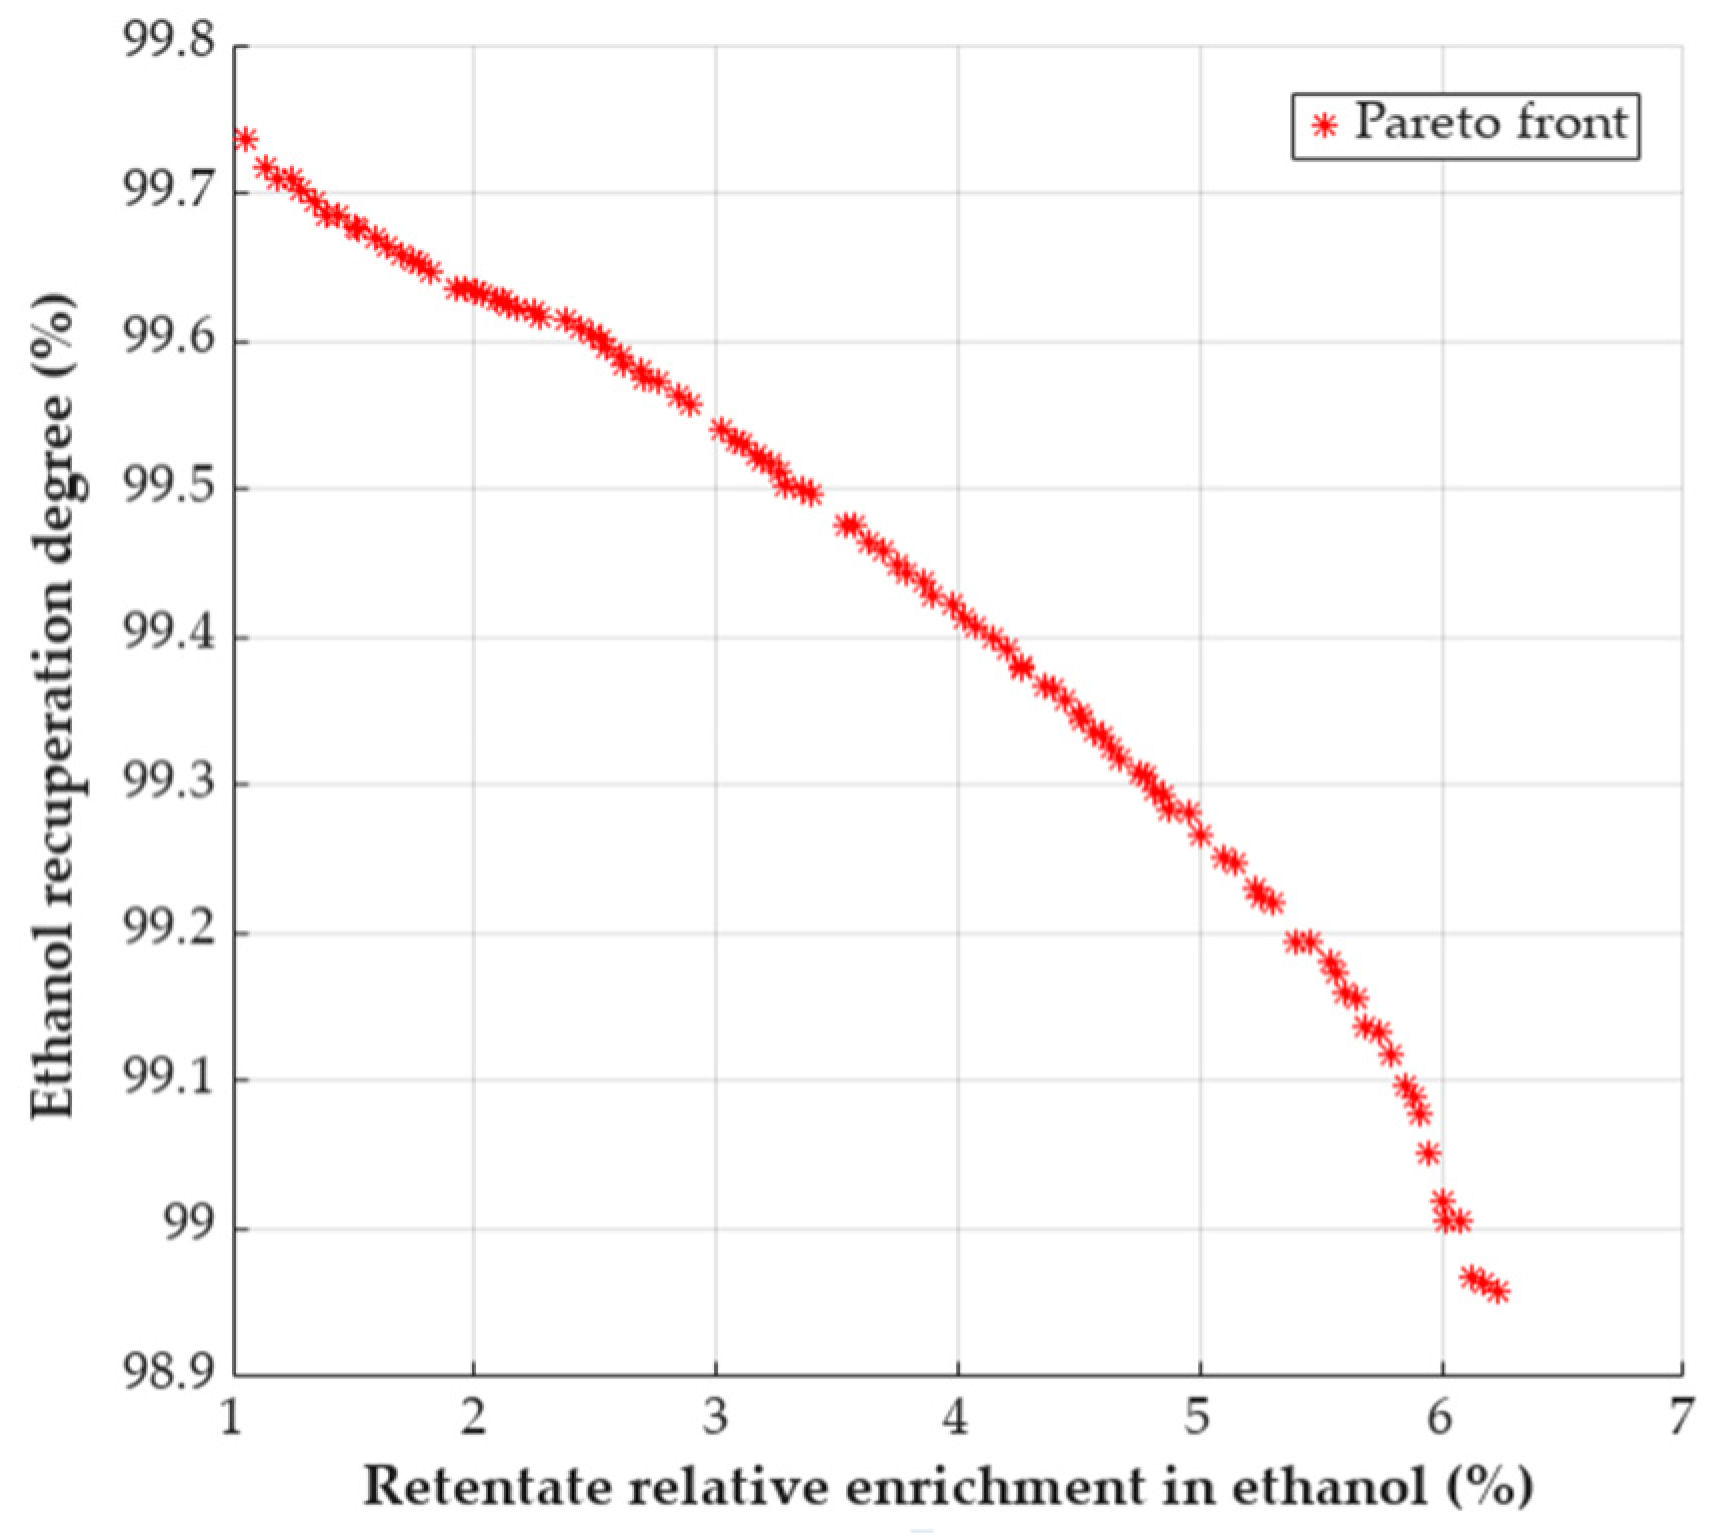
The results obtained are presented in Figure 6, where the Pareto front is given.
The set of equally good solutions that represent the Pareto front shows that there are some combinations of working conditions that can ensure a trade-off between the two criteria considered.
Some selected sets from the Pareto front can also provide more insight into how operating parameters influence the PVA membrane efficiency (Table 7).
In case of mixtures with lower water content, the operating conditions can be milder in terms of temperature and permeate pressure (~80 °C, 5 kPa), obtaining a very high ethanol recuperation degree. If the temperature is raised to about 100 °C, better retentate enrichment in ethanol can be achieved, without significantly decreasing the recuperation degree.
It is worth noticing that similar operating conditions are suitable for mixtures with higher water content, realizing a significant increase in ethanol concentration. Higher enrichment can be achieved at the cost of decreasing permeate pressure and reducing ethanol recovery.

4. Conclusions

The performance of a PVA membrane applied in pervaporation was investigated through COMSOL-based modeling and simulation, targeting larger-scale ethanol dehydration. In this first modeling attempt, which integrates flow, mass, and heat transfer for a PVA membrane with well-established separation properties, the simulations demonstrated strong predictive capability, delivering results consistent with previously reported experimental data and calculated performance indicators.
Using virtual experiments designed according to a Box–Behnken scheme within the RSM framework, the variation of separation performance was mapped across a large range of operating conditions. The statistical modeling yielded original analytical expressions for two key criteria—ethanol recovery degree and relative retentate enrichment—as functions of the main process variables.
A multiobjective optimization effort, focusing on the simultaneous maximization of these two criteria, was carried out using a genetic algorithm implemented in MATLAB, searching on a practically relevant range of operating parameters. This approach revealed a Pareto front of equally optimal solutions from which meaningful trade-offs between ethanol recovery (s) and retentate relative enrichment (RE) were identified.
For example, the Pareto front offered some combination of temperature and pressure that can lead to good trade-offs between separation degree (s) and relative enrichment of retentate in ethanol (RE) for concentrated ethanol solutions (around 0.05 water mass fraction). For more diluted ethanol solutions (around 0.15 water mass fraction), which are more easily obtained by distillation, some combinations of operating parameters are also available (Table 7). Since pervaporation units are often supplied with the top product from a distillation column, a more diluted distillate is associated with potential energy savings.
The combined methodology—COMSOL modeling based on coupled flow, heat, and mass transfer equations, RSM-based statistical exploration, and multiobjective optimization—proved to be an effective and original approach for evaluating the capability of PVA membranes in ethanol dehydration. Since PVA-based membranes are already used in practical applications, this integrated strategy can be further extended to industrial-scale analyses.

Author Contributions

Following CRediT taxonomy criteria, the individual contributions of the authors are conceptualization, C.L.G. and R.I.; methodology: D.D.D. and R.I.; software: C.L.G. and R.I.; validation: D.D.D. and R.I.; formal analysis: C.L.G., R.I., and D.D.D.; investigation: C.L.G. and R.I.; resources: D.D.D. and R.I.; writing—original draft preparation: C.L.G., R.I., and D.D.D.; writing—review and editing: C.L.G., R.I., and D.D.D.; visualization: C.L.G. and R.I.; supervision: R.I.; project administration: C.L.G.; funding acquisition: C.L.G. All authors have read and agreed to the published version of the manuscript.

Funding

This work was supported by a grant GNAcARUT from the National University of Science and Technology POLITEHNICA Bucharest, project number 178/04.12.2023.

Institutional Review Board Statement

Not applicable.

Data Availability Statement

The original contributions presented in this study are included in the article. Further inquiries can be directed to the corresponding author.

Acknowledgments

The authors would like to thank Cristian Picioreanu, from King Abdullah University of Science and Technology (KAUST), for advice and support for COMSOL modeling.

Conflicts of Interest

The authors declare no conflicts of interest.

References

  1. Cai, D.; Wen, J.; Zhuang, Y.; Huang, T.; Si, Z.; Qin, P.; Chen, H. Review of alternative technologies for acetone–butanol–ethanol separation: Principles, state-of-the-art and development trends. Sep. Purif. Technol. 2022, 298, 121244. [Google Scholar] [CrossRef]
  2. Lyu, H.; Hu, Y.; Zhou, T. Dimethyl carbonate/methanol separation by azeotropic distillation with water: An alternative process driven by low-pressure steam. Sep. Purif. Technol. 2025, 355, 129677. [Google Scholar] [CrossRef]
  3. Zheng, M.; Wang, J. Simulation and Optimization of the Separation of Methanol–Dimethyl Carbonate Azeotrope by Extractive Dividing Wall Column. Separations 2022, 9, 189. [Google Scholar] [CrossRef]
  4. Nam, S.Y.; Lee, Y.M. Pervaporation separation of methanol/methyl-tert-butyl-ether (MTBE) mixtures through chitosan composite membranes modified with surfactants. J. Membr. Sci. 1999, 157, 63–71. [Google Scholar] [CrossRef]
  5. Weber de Menezes, E.; Cataluña, R. Optimization of the ETBE (ethyl tert-butyl ether) production process. Fuel Process. Technol. 2008, 89, 1148–1152. [Google Scholar] [CrossRef]
  6. Reddy, P.; Benecke, T.P.; Ramjugernath, D. Isothermal vapor–liquid equilibrium at 333.15 K and excess properties for the {ethyl tert-butyl ether + methanol + water} system. Fluid Phase Equilibria 2013, 344, 32–37. [Google Scholar] [CrossRef]
  7. Cruz Valdez, J.A.; Patiño-Herrera, R.; Avilés Martínez, A.; Pérez, E. Separation of the cyclohexane–benzene mixture by the extractive distillation process using ethylene glycol as a solvent. Chem. Eng. Process.–Process Intensif. 2024, 196, 109686. [Google Scholar] [CrossRef]
  8. Vázquez-Ojeda, M.; Segovia-Hernández, J.G.; Hernández, S.; Hernández-Aguirre, A.; Kiss, A.A. Design and optimization of an ethanol dehydration process using stochastic methods. Sep. Purif. Technol. 2013, 105, 90–97. [Google Scholar] [CrossRef]
  9. Zhao, T.; Geng, X.; Qi, P.; Zhu, Z.; Gao, J.; Wang, Y. Optimization of liquid–liquid extraction combined with either heterogeneous azeotropic distillation or extractive distillation processes to reduce energy consumption and carbon dioxide emissions. Chem. Eng. Res. Des. 2018, 132, 399–408. [Google Scholar] [CrossRef]
  10. Gerbaud, V.; Rodríguez-Donis, I.; Hegely, L.; Lang, P.; Denes, F.; You, X. Review of extractive distillation. Process design, operation, optimization and control. Chem. Eng. Res. Des. 2019, 141, 229–271. [Google Scholar] [CrossRef]
  11. Kiss, A.A.; Ignat, R.M.; Bildea, C.S. Optimal extractive distillation process for bioethanol dehydration. Comput. Aided Chem. Eng. 2014, 33, 1333–1338. [Google Scholar] [CrossRef]
  12. Neagu, M.; Pricop-Nicolae, M. Azeotropic and Extractive Distillation for Bio-Ethanol Dehydration: Process Design, Simulation, and Cost Analysis. Processes 2025, 13, 3634. [Google Scholar] [CrossRef]
  13. Lipnizki, F.; Field, R.W.; Ten, P.-K. Pervaporation-based hybrid process: A review of process design, applications and economics. J. Membr. Sci. 1999, 153, 183–210. [Google Scholar] [CrossRef]
  14. Jonquières, A.; Clément, R.; Lochon, P.; Néel, J.; Dresch, M.; Chrétien, B. Industrial state-of-the-art of pervaporation and vapour permeation in the western countries. J. Membr. Sci. 2002, 206, 87–117. [Google Scholar] [CrossRef]
  15. Favre, E. The Future of Membrane Separation Processes: A Prospective Analysis. Front. Chem. Eng. 2022, 4, 916054. [Google Scholar] [CrossRef]
  16. Vane, L.M. Review of pervaporation and vapor permeation process factors affecting the removal of water from industrial solvents. J. Chem. Technol. Biotechnol. 2019, 95, 495–512. [Google Scholar] [CrossRef]
  17. Lu, X.; Huang, J.; Pinelo, M.; Chen, G.; Wan, Y.; Luo, J. Modelling and optimization of pervaporation membrane modules: A critical review. J. Membr. Sci. 2022, 664, 121084. [Google Scholar] [CrossRef]
  18. Kazemimoghadam, M.; Rigi, Z.A. Investigation on Simulation of NaX Zeolite Membrane in Pervaporation Process. Int. J. Sci. Res. Chem. Sci. 2017, 4, 1–8. [Google Scholar]
  19. Kazemimoghadam, M.; Masjedi, S.M.H. Modeling of Pervaporation Process for Dehydration of Alcohols by Polymer Membrane. Int. J. Adv. Sci. Eng. 2018, 4, 679–686. [Google Scholar] [CrossRef]
  20. Farhan, N.M.; Ibrahim, S.; Alsalhy, Q. Modeling and simulation of pervaporation (PV) separation for alcohol dehydration. Heliyon 2023, 9, e13713. [Google Scholar] [CrossRef]
  21. Liu, D.; Liu, G.; Meng, L.; Dong, Z.; Huang, K.; Jin, W. Hollow fiber modules with ceramic-supported PDMS composite membranes for pervaporation recovery of bio-butanol. Sep. Purif. Technol. 2015, 146, 24–32. [Google Scholar] [CrossRef]
  22. Soares, L.S.; Vieira, A.C.F.; Fidler, F.; Monteiro, A.R.; Di Luccio, M. Pervaporation as an alternative for adding value to residues of oyster (Crassostrea gigas) processing. Sep. Purif. Technol. 2020, 232, 115968. [Google Scholar] [CrossRef]
  23. Darvishi, A.; Aroujalian, A.; Keshavarz Moraveji, M.; Pazuki, G. Computational fluid dynamic modeling of a pervaporation process for removal of styrene from petrochemical wastewater. RSC Adv. 2016, 6, 15327–15339. [Google Scholar] [CrossRef]
  24. Rezakazemi, M.; Shahverdi, M.; Shirazian, S.; Mohammadi, T.; Pak, A. CFD simulation of water removal from water/ethylene glycol mixtures by pervaporation. Chem. Eng. J. 2011, 168, 60–67. [Google Scholar] [CrossRef]
  25. Liu, S.X.; Peng, M.; Vane, L.M. CFD simulation of effect of baffle on mass transfer in a slit-type pervaporation module. J. Membr. Sci. 2005, 265, 124–136. [Google Scholar] [CrossRef]
  26. Liu, S.X.; Peng, M.; Vane, L.M. CFD modeling of pervaporative mass transfer in the boundary layer. Chem. Eng. Sci. 2004, 59, 5853–5857. [Google Scholar] [CrossRef]
  27. Wang, L.; Sun, Q.; Zhou, X.; Zhang, W.; Wu, L. Numerical simulation and optimization of pervaporation process based on heat–mass–flow coupling. Appl. Therm. Eng. 2024, 249, 123357. [Google Scholar] [CrossRef]
  28. Hieu, N.H. Modelling and simulation of a pervaporation process using tubular module for production of anhydrous ethanol. AIP Conf. Proc. 2017, 1878, 020029. [Google Scholar] [CrossRef]
  29. Moulik, S.; Bukke, V.; Sajja, S.C.; Sridhar, S. Chitosan-polytetrafluoroethylene composite membranes for separation of methanol and toluene by pervaporation. Carbohydr. Polym. 2018, 193, 28–38. [Google Scholar] [CrossRef]
  30. Huang, J.; Li, J.; Zhan, X.; Chen, C. A modified solution-diffusion model and its application in the pervaporation separation of alkane/thiophenes mixtures with PDMS membrane. J. Appl. Polym. Sci. 2008, 110, 3140–3148. [Google Scholar] [CrossRef]
  31. Marszałek, J.; Tylman, M.; Rdzanek, P.; Kamiński, W. The influence of hydrodynamic conditions on the recovery of acetone, butanol and ethanol in pervaporation membrane modules. Chem. Process Eng.–Inżynieria Chem. Proces. 2018, 39, 155–163. [Google Scholar] [CrossRef]
  32. Moulik, S.; Praveen Kumar, K.; Bohra, S.; Sridhar, S. Pervaporation performance of PPO membranes in dehydration of highly hazardous MMH and UDMH liquid propellants. J. Hazard. Mater. 2015, 288, 69–79. [Google Scholar] [CrossRef]
  33. Asadollahzadeh, M.; Raoufi, N.; Rezakazemi, M.; Shirazian, S. Simulation of nonporous polymeric membranes using CFD for bioethanol purification. Macromol. Theory Simul. 2018, 27, 1700084. [Google Scholar] [CrossRef]
  34. Marjani, A.; Shirazian, S. Mathematical modeling and CFD simulation of hydrocarbon purification using membrane technology. Orient. J. Chem. 2012, 28, 123–129. [Google Scholar] [CrossRef]
  35. Cha-umpong, W.; Li, Q.; Razmjou, A.; Chen, V. Concentrating brine for lithium recovery using GO composite pervaporation membranes. Desalination 2021, 500, 114894. [Google Scholar] [CrossRef]
  36. Sommer, S.; Klinkhammer, B.; Schleger, M.; Melin, T. Performance efficiency of tubular inorganic membrane modules for pervaporation. AIChE J. 2005, 51, 162–177. [Google Scholar] [CrossRef]
  37. Liu, X.; Wang, R.; Bai, Y.; Zhang, L. Performance of a New-Type Polymeric Membrane for Gas Separation. J. Membr. Sci. 2006, 283, 192–200. [Google Scholar] [CrossRef]
  38. Mafi, A.; Raisi, A.; Hatam, M.; Aroujalian, A. A mathematical model for mass transfer in hydrophobic pervaporation for organic compounds separation from aqueous solutions. J. Membr. Sci. 2012, 423–424, 175–188. [Google Scholar] [CrossRef]
  39. Mafi, A.; Raisi, A.; Aroujalian, A. Computational fluid dynamics modeling of mass transfer for aroma compounds recovery from aqueous solutions by hydrophobic pervaporation. J. Food Eng. 2013, 119, 46–55. [Google Scholar] [CrossRef]
  40. Raza, W.; Wang, J.; Yang, J.; Tsuru, T. Progress in Pervaporation Membranes for Dehydration of Acetic Acid. Sep. Purif. Technol. 2021, 262, 118338. [Google Scholar] [CrossRef]
  41. Lakshmy, K.S.; Lal, D.; Nair, A.; Babu, A.; Das, H.; Govind, N.; Dmitrenko, M.; Kuzminova, A.; Korniak, A.; Penkova, A.; et al. Pervaporation as a Successful Tool in the Treatment of Industrial Liquid Mixtures. Polymers 2022, 14, 1604. [Google Scholar] [CrossRef]
  42. Imad, M.; Castro-Muñoz, R. Ongoing Progress on Pervaporation Membranes for Ethanol Separation. Membranes 2023, 13, 848. [Google Scholar] [CrossRef]
  43. Li, L.; Xu, X.; Liu, L.; Song, P.; Cao, Q.; Xu, Z.; Fang, Z.; Wang, H. Water governs the mechanical properties of poly(vinyl alcohol). Polymer 2021, 213, 123330. [Google Scholar] [CrossRef]
  44. Jain, N.; Singh, V.K.; Chauhan, S. A review on mechanical and water absorption properties of polyvinyl alcohol based composites/films. J. Mech. Behav. Mater. 2014, 26, 213–222. [Google Scholar] [CrossRef]
  45. Penkova, A.V.; Acquah, S.F.A.; Dmitrenko, M.E.; Sokolova, M.P.; Ermakov, S.S.; Shcherbina, A.Y.; Maslyk, M.F.; Kovalev, G.V.; Kuznetsov, B.N. Improvement of pervaporation PVA membranes by the controlled incorporation of fullerenol nanoparticles. Mater. Des. 2016, 96, 416–423. [Google Scholar] [CrossRef]
  46. Dobre, T.; Patrichi, C.A.M.; Pârvulescu, O.C.; Aljanabi, A.A.A. Pervaporation of Aqueous Ethanol Solutions through Rigid Composite Polyvinyl-Alcohol/Bacterial Cellulose Membranes. Processes 2021, 9, 437. [Google Scholar] [CrossRef]
  47. Filimon, A.; Dobos, A.M.; Onofrei, M.D.; Serbezeanu, D. Polyvinyl Alcohol-Based Membranes: A Review of Research Progress on Design and Predictive Modeling of Properties for Targeted Application. Polymers 2025, 17, 1016. [Google Scholar] [CrossRef]
  48. Dmitrenko, M.; Penkova, A.; Kuzminova, A.; Missyul, A.; Ermakov, S.; Roizard, D. Development and Characterization of New Pervaporation PVA Membranes for the Dehydration Using Bulk and Surface Modifications. Polymers 2018, 10, 571. [Google Scholar] [CrossRef]
  49. Sapalidis, A.A. Porous Polyvinyl Alcohol Membranes: Preparation Methods and Applications. Symmetry 2020, 12, 960. [Google Scholar] [CrossRef]
  50. Samei, M.; Mohammadi, T.; Asadi, A.A. Tubular composite PVA ceramic supported membrane for bio-ethanol production. Chem. Eng. Res. Des. 2013, 91, 2703–2712. [Google Scholar] [CrossRef]
  51. Ong, Y.K.; Shi, G.M.; Le, N.L.; Tang, Y.P.; Zuo, J.; Nunes, S.P.; Chung, T.-S. Recent Membrane Development for Pervaporation Processes. Prog. Polym. Sci. 2016, 57, 1–31. [Google Scholar] [CrossRef]
  52. Yave, W. Separation performance of improved PERVAP membrane and its dependence on operating conditions. J. Membr. Sci. Res. 2019, 5, 216–221. [Google Scholar] [CrossRef]
  53. Li, Y.; Xu, J.; Qian, M.; Yu, J. Desalination by Membrane Pervaporation: A Review. Desalination 2023, 547, 116223. [Google Scholar] [CrossRef]
  54. Rahman Khan, M.M.; Rumon, M.M.H.; Islam, M. Synthesis, Rheology, Morphology, and Mechanical Properties of Biodegradable PVA-Based Composite Films: A Review on Recent Progress. Processes 2024, 12, 2880. [Google Scholar] [CrossRef]
  55. Vu, N.Q.; Le, T.M.; Ngo, A.N.B.; Nguyen, M.H.T.; Liao, Y.-C.; Tran, T.T. Engineering Functional PVA: A Comprehensive Review of Chemical Modifications and Prospective Developments. ACS Polym. Au 2025. [Google Scholar] [CrossRef]
  56. Farhan, N.M.; Ibrahim, S.; Alsalhy, Q.F. A new PERVAPTM membrane to enhance the dehydration of isopropanol by pervaporation. S. Afr. J. Chem. Eng. 2023, 45, 269–282. [Google Scholar] [CrossRef]
  57. Vane, L.M. Effect of membrane performance variability with temperature and feed composition on pervaporation and vapor permeation system design for solvent drying. J. Chem. Technol. Biotechnol. 2022, 97, 2706–2719. [Google Scholar] [CrossRef]
  58. Khuri, A.I.; Mukhopadhyay, S. Response Surface Experiments and Designs. In Handbook of Design and Analysis of Experiments; Dean, A., Morris, M., Stufken, J., Bingham, D., Eds.; Chapmann & Hall: Boca Raton, FL, USA; CRC Press: New York, NY, USA, 2015; pp. 198–230. [Google Scholar]
  59. Montgomery, D.C. Design and Analysis of Experiments, 9th ed.; John Wiley & Sons: Hoboken, NJ, USA, 2017; pp. 489–568. [Google Scholar]
  60. Kakooei, R.; Hajilary, N.; Rajabi, S. Unveiling a high-performance composite membrane for bioethanol dehydration: Optimizing fiber diameter of MXene-incorporated PVA nanofibers via response surface methodology. Next Mater. 2025, 9, 101280. [Google Scholar] [CrossRef]
  61. Ahadi, N.; Bakhtiari, O. Preparation and optimization of nanocomposite membranes for ethanol dehydration via pervaporation by using response surface methodology. J. Taiwan Inst. Chem. Eng. 2024, 165, 105790. [Google Scholar] [CrossRef]
  62. Rasheed, S.H.; Ibrahim, S.S.; Alsalhy, Q.F.; Majdi, H.S. Polydimethylsiloxane (PDMS) Membrane for Separation of Soluble Toluene by Pervaporation Process. Membranes 2023, 13, 289. [Google Scholar] [CrossRef]
  63. Rasheed, S.H.; Ibrahim, S.S.; Alsalhy, Q.F.; Salih, I.K. Separation of Soluble Benzene from an Aqueous Solution by Pervaporation Using a Commercial PDMS Membrane. Membranes 2022, 12, 1040. [Google Scholar] [CrossRef] [PubMed]
  64. Singh, A.; Gupta, A.; Chaurasia, A. Optimization of Volatile Organic Compound Separation by Pervaporation Using Response Surface Methodology. J. Membr. Sci. 2022, 622, 118973. [Google Scholar]
  65. Wee, S.L.; Tye, C.T.; Bhatia, S. Process optimization studies for the dehydration of alcohol–water system by inorganic membrane based pervaporation separation using design of experiments (DOE). Sep. Purif. Technol. 2010, 71, 192–199. [Google Scholar] [CrossRef]
  66. Baker, R.W. Membrane Technology and Applications, 3rd ed.; JohnWiley & Sons: Chichester, UK, 2012. [Google Scholar]
  67. Schwarz, C.E. Effect of Variation between Different Experimental VLE Data Sets on Thermodynamic Model and Separation Predictions: NRTL Correlation of the Ethanol + Water System. Ind. Eng. Chem. Res. 2024, 63, 10721–10734. [Google Scholar] [CrossRef]
  68. Aspen Technology, Inc. Aspen Plus®, v.14; Aspen Technology, Inc.: Bedford, MA, USA, 2025.
  69. COMSOL AB. COMSOL Multiphysics®, v. 6.3; COMSOL AB: Stockholm, Sweden, 2024.
  70. Southard, M.Z.; Rowley, R.L.; Wilding, W.V. Physical and Chemical Data. In Perry’s Chemical Engineers’ Handbook, 9th ed.; Green, D.W., Southard, M.Z., Eds.; McGraw-Hill Education: Columbus, OH, USA, 2019; pp. 2-120–2-126. [Google Scholar]
  71. Khayet, M.; Cojocaru, C.; Zakrzewska-Trznadel, G. Response surface modelling and optimization in pervaporation. J. Membr. Sci. 2008, 321, 272–283. [Google Scholar] [CrossRef]
Figure 1. Schematic representation of membrane module geometry. (A) Three-dimensional tube-in-tube configuration; (B) two-dimensional axisymmetric model representation with the assigned domains, boundaries, and dimensions. The cylindrical geometry spans along directions x and r.
Polymers 18 00065 g001
Figure 2. Profiles in the feed and permeate compartments: (a) velocities (cm/s); (b) temperature (°C); (c) water and ethanol mass fraction (–).
Polymers 18 00065 g002
Figure 3. Variations along the membrane: (a) temperature; (b) driving force for water permeation.
Polymers 18 00065 g003
Figure 4. Variation of retentate enrichment in ethanol (%) with the operating condition expressed in coded values: (a) x1 = 0, (b) x2 = 0, (c) x3 = 0.
Polymers 18 00065 g004
Figure 5. Ethanol recuperation degree (%) with operating condition expressed in coded values: (a) x1 = 0, (b) x2 = 0, (c) x3 = 0.
Polymers 18 00065 g005
Figure 6. Pareto front for simultaneous maximization of ethanol recuperation degree and retentate relative enrichment in ethanol.
Polymers 18 00065 g006
Table 2. The different levels of experimental variables.
Variables
(Operating Parameters)
Coded
Variables
Coded Levels and
Actual Values
−101
Water content in feed, ww_in (mass fraction)x10.050.10.15
Feed temperature,
Tf_in (°C)
x280100120
Permeate pressure,
pp (kPa)
x3135
Table 3. Experimental and calculated values.
Temperature
(°C)
Water
Flux kg m 2 h
Water
Partial
Pressure (kPa)
Water
Activity
(−)
Water
Permeance kmol m 2 s kPa
Obs.
951.6 ÷ 1.7 * Measured by Yave [52]
1.6406 This work
600.2029.04250.453643.8719·10−7Estimated by Vane [57]
using experimental data from Yave [52]
0.2238.990.453504.2943·10−7This work
1052.40052.3460.433167.2070·10−7Estimated by Vane [57]
using experimental data from Yave [52]
2.65052.0550.43297.982·10−7This work
* Reading from a graph.
Table 4. Virtual experimental data Box–Behnken design.
Run #x1x2x3Relative Enrichment of Ethanol in Retentate (%)Ethanol Recuperation
Degree
(%)
11107.658899.029
21−103.371899.126
3−1103.341199.558
4−1−101.328499.672
51015.136599.122
610−15.670698.902
7−1012.125399.641
8−10−12.581199.566
90115.664499.373
1001−16.077899.267
110−112.216799.475
120−1−12.810099.270
130004.142299.303
Table 5. ANOVA results for the relative enrichment of ethanol in the retentate model.
CoefficientsStandard Errorp-Value
Intercept4.142220.100213.1161·10−5
x11.557730.035432.59·10−5
x21.626910.035432.2739·10−5
x3−0.249570.035430.00588
x1·x20.568610.050110.00147
x1·x3−0.019580.050110.72204
x2·x30.045000.050110.43532
x12−0.265540.066280.02790
x220.048340.066280.51864
x320.001660.066280.98155
Table 6. ANOVA results for the ethanol recuperation degree model.
CoefficientsStandard Errorp-Value
Intercept99.303000.031066.74935·10−5
x1−0.282250.010980.00013
x2−0.039500.010980.03685
x30.075750.010980.00624
x1·x20.004250.015530.80211
x1·x30.036250.015530.10177
x2·x3−0.024750.015530.20928
x120.002380.020550.91528
x220.040880.020550.14075
x320.002380.020550.91528
Table 7. Parameter values selected from the Pareto front in multiobjective optimization, considering maximum ethanol recuperation degree and maximum retentate relative enrichment in ethanol.
VariablesObjective Functions
Coded ValuesReal ValuesRE
(%)
s
(%)
x1x2x3Water Content in Feed,
wF,w (Mass Fraction)
Feed Temperature,
Tf,in (°C)
Permeat
Pressure,
pp (kPa)
Diluted
solutions
0.94290.29070.32950.1471105.813.665.924199.0662
0.95290.29510.96390.1476105.904.935.785599.1308
1.00000.3000−0.97640.1500106.001.056.348698.9164
Concentrated solutions−0.99180.22820.97790.0504104.564.962.367799.6131
−0.9841−0.04390.96190.050899.124.922.083599.6268
−0.9826−0.96800.99430.050980.644.991.095899.7293
Disclaimer/Publisher’s Note: The statements, opinions and data contained in all publications are solely those of the individual author(s) and contributor(s) and not of MDPI and/or the editor(s). MDPI and/or the editor(s) disclaim responsibility for any injury to people or property resulting from any ideas, methods, instructions or products referred to in the content.