
Optical Behavior of Clear Thermoplastic Dental Materials in a Simulated Oral Environment


Abstract
1. Introduction
2. Materials and Methods
2.1. Sample Preparation
2.2. Optical and Color Changes Measurements
2.3. Statistical Analysis
3. Results
4. Discussions
5. Conclusions
- Optical properties of PETG clear thermoplastic materials, like TP and OP, increase in a simulated oral environment and the changes become significant after artificial aging. Correlation analyses indicated a migration towards red and yellow.
- Related to pH values, the optical behavior between the materials is significantly different, but without a more unpropitious environment being evident.
- In artificial saliva, various commercial PETG materials behave similarly in terms of translucency, and differently related to opalescence. During artificial aging, the tested materials behave significantly differently in terms of optical properties.
- After the simulated period of 14 days, color changes in some cases even reach the level of extremely marked. Whiteness increases and the differences are mostly perceptible, but partially exceed the limit of acceptability.
- More studies are needed in terms of extended and multifactorial in vitro and vivo studies of aligners. Providing real conditions for the data obtained in this study may help to understand aesthetic outcomes associated with aligners.
Author Contributions
Funding
Institutional Review Board Statement
Data Availability Statement
Conflicts of Interest
References
- Bichu, Y.M.; Alwafi, A.; Liu, X.; Andrews, J.; Ludwig, B.; Bichu, A.Y.; Zou, B. Advances in orthodontic clear aligner materials. Bioact. Mater. 2022, 22, 384–403. [Google Scholar] [CrossRef] [PubMed]
- Hartshorne, J.; Wertheimer, M.B. Emerging insights and new developments in clear aligner therapy: A review of the literature. Am. J. Orthod. Dentofac. Orthop. Clin. Companion 2022, 2, 311–324. [Google Scholar] [CrossRef]
- Hussein, A.M.; Mohammed-Salih, H.S.; Al-Sheakli, I.I. Effects of various cleaning agents on polypropylene and copolyester thermoplastic orthodontic retainer materials. J. Taibah Univ. Med. Sci. 2022, 17, 861–868. [Google Scholar] [CrossRef] [PubMed]
- Tamburino, F.; D’Anto, V.; Bucci, R.; Alessandri-Bonetti, G.; Barone, S.; Razionale, A.V. Mechanical properties of thermoplastics polymers for aligner manufacturing: In vitro study. Dent. J. 2020, 8, 47. [Google Scholar] [CrossRef]
- Khorsandi, D.; Fahimipour, A.; Abasian, P.; Saber, S.S.; Seyedi, M.; Ghanavati, S.; Ahmad, A.; De Stephanis, A.A.; Taghavinezhaddilami, F.; Leonova, A.; et al. 3D and 4D printing in dentistry and maxillofacial surgery: Printing techniques, materials, and applications. Acta Biomater. 2021, 122, 26–49. [Google Scholar] [CrossRef] [PubMed]
- Macri, M.; Murmura, G.; Varvara, G.; Train, I.T.; Festa, F. Clinical performances and biological features of clear aligners materials in orthodontics. Front. Mater. 2022, 9, 819121. [Google Scholar] [CrossRef]
- Bayirli, B.; Kim-Berman, H.; Puntillo, A.; Bielawski, D. (Eds.) Embracing Novel Technologies in Dentistry and Orthodontics; The University of Michigan: Ann Arbor, MI, USA, 2020; pp. 22–35, 56. [Google Scholar]
- Cianci, C.; Pappalettera, G.; Renna, G.; Casavola, C.; Laurenziello, M.; Battista, G.; Pappalettere, C.; Ciavarella, D. Mechanical Behavior of PET-G Tooth Aligners Under Cyclic Loading. Front. Mater. 2020, 7, 104. [Google Scholar] [CrossRef]
- Neoh, S.P.; Khantachawana, A.; Chintavalakorn, R.; Santiwong, P.; Srikhirin, T. Comparison of physical, mechanical, and optical properties between thermoplastic materials and 3-dimensional printing resins for orthodontic clear retainers. Am. J. Orthod. Dentofac. Orthop. 2025, 167, 95–109.e1. [Google Scholar] [CrossRef]
- Cond’o, R.; Mampieri, G.; Giancotti, A.; Cerroni, L.; Pasquantonio, G.; Divizia, A.; Convertino, A.; Mecheri, B.; Maiolo, L. SEM Characterization and ageing analysis on two generations of Invisible aligners. BMC Oral Health 2021, 21, 316. [Google Scholar] [CrossRef]
- Latko-Durałek, P.; Dydek, K.; Boczkowska, A. Thermal, rheological and mechanical properties of PETG/rPETG blends. J. Polym. Environ. 2019, 27, 2600–2606. [Google Scholar] [CrossRef]
- Liu, C.L.; Sun, W.T.; Liao, W.; Lu, W.X.; Li, Q.W.; Jeong, Y.; Liu, J.; Zhao, Z.-H. Colour stabilities of three types of orthodontic clear aligners exposed to staining agents. Int. J. Oral Sci. 2016, 8, 246–253. [Google Scholar] [CrossRef] [PubMed]
- Bernard, G.; Rompré, P.; Tavares, J.R.; Montpetit, A. Colorimetric and spectrophotometric measurements of orthodontic thermoplastic aligners exposed to various staining sources and cleaning methods. Head Face Med. 2020, 16, 2. [Google Scholar] [CrossRef]
- Gold, B.P.; Siva, S.; Duraisamy, S.; Idaayath, A.; Kannan, R. Properties of orthodontic clear aligner materials—A review. J. Evol. Med. Dent. Sci. 2021, 10, 3288–3294. [Google Scholar] [CrossRef]
- Srinivasan, B.; Padmanabhan, S.; Srinivasan, S. Comparative evaluation of physical and mechanical properties of clear aligners—A systematic review. Evid. Based Dent. 2024, 25, 53. [Google Scholar] [CrossRef]
- Daniele, V.; Macera, L.; Taglieri, G.; Spera, L.; Marzo, G.; Quinzi, V. Color Stability, Chemico-Physical and Optical Features of the Most Common PETG and PU Based Orthodontic Aligners for Clear Aligner Therapy. Polymers 2021, 14, 14. [Google Scholar] [CrossRef] [PubMed]
- Ruiz-López, J.; Pulgar, R.; Lucena, C.; Pelaez-Cruz, P.; Cardona, J.C.; Perez, M.M.; Ghinea, R. Impact of short-term dental dehydration on in-vivo dental color and whiteness. J. Dent. 2021, 105, 103560. [Google Scholar] [CrossRef] [PubMed]
- Suliman, S.; Sulaiman, T.; Olafsson, V.; Delgado, A.; Donovan, T.; Heymann, H. Effect of time on tooth dehydration and rehydration. J. Esthet. Restor. Dent. 2019, 31, 118–123. [Google Scholar] [CrossRef] [PubMed]
- Hatırlı, H.; Karaarslan, E.Ş.; Yaşa, B.; Kılıç, E.; Yaylacı, A. Clinical effects of dehydration on tooth color: How much and how long? J. Esthet. Restor. Dent. 2020, 33, 364–370. [Google Scholar] [CrossRef] [PubMed]
- Lira, L.F.; Otero Amaral Vargas, E.; Moreira da Silva, E.; Nunes da Silva Meirelles Dória Maia, J.; Elzubair, A.; Siqueira de Morais, L.; Alvaro de Souza Camargo, S., Jr.; Serra, G.; Gomes de Souza, M.M. Effect of oral exposure on chemical, physical, mechanical, and morphologic properties of clear orthodontic aligners. Am. J. Orthod. Dentofac. Orthop. 2023, 164, e51–e63. [Google Scholar] [CrossRef]
- The International Commission on Illumination. CIE 015:2018 Colorimetry, 4th ed.; The International Commission on Illumination: Vienna, Austria, 2019. [Google Scholar]
- Porojan, L.; Toma, F.R.; Bîrdeanu, M.I.; Vasiliu, R.D.; Matichescu, A. Topographical and Optical Characteristics of Thermoplastic Dental Appliances Materials Related to Water Sorption. J. Funct. Biomater. 2023, 14, 190. [Google Scholar] [CrossRef] [PubMed]
- Espinar, C.; Della Bona, A.; Pérez, M.M.; Pulgar, R. Color and optical properties of 3D printing restorative polymer-based materials: A scoping review. J. Esthet. Restor. Dent. 2022, 34, 853–864. [Google Scholar] [CrossRef] [PubMed]
- Wu, Z.; Tian, J.; Wei, D.; Zhang, Y.; Lin, Y.; Di, P. Effects of thickness and polishing treatment on the translucency and opalescence of six dental CAD-CAM monolithic restorative materials: An in vitro study. BMC Oral Health 2023, 23, 579. [Google Scholar] [CrossRef]
- Shirani, M.; Savabi, O.; Mosharraf, R.; Akhavankhaleghi, M.; Hebibkhodaei, M.; Isler, S. Comparison of translucency and opalescence among different dental monolithic ceramics. J. Prosthet. Dent. 2021, 126, 446. [Google Scholar] [CrossRef] [PubMed]
- Yilmaz Savas, T.; Akin, C. Effects of sintering protocol and dipping time on the optical properties of monolithic zirconia. J. Prosthet. Dent. 2022, 127, 801. [Google Scholar] [CrossRef]
- Vichi, A.; Balestra, D.; Scotti, N.; Louca, C.; Paolone, G. Translucency of CAD/CAM and 3D printable composite materials for permanent dental restorations. Polymers 2023, 15, 1443. [Google Scholar] [CrossRef]
- Salas, M.; Lucena, C.; Herrera, L.J.; Yebra, A.; Della Bona, A.; Perez, M.M. Translucency thresholds for dental materials. Dent. Mater. 2018, 34, 1168–1174. [Google Scholar] [CrossRef] [PubMed]
- Guerra, F.; Mazur, M.; Corridore, D.; Pasqualotto, D.; Nardi, G.M.; Ottolenghi, L. Evaluation of the esthetic properties of developmental defects of enamel: A spectrophotometric clinical study. Sci. World J. 2015, 2015, 878235. [Google Scholar] [CrossRef] [PubMed]
- Elamin, H.O.; Abubakr, N.H.; Ibrahim, Y.E. Identifying the tooth shade in group of patients using Vita Easyshade. Eur. J. Dent. 2015, 9, 213–217. [Google Scholar] [CrossRef] [PubMed]
- Tabatabaian, F.; Motamedi, E.; Sahabi, M.; Torabzadeh, H.; Namdari, M. Effect of thickness of monolithic zirconia ceramic on final color. J. Prosthet. Dent. 2018, 120, 257–262. [Google Scholar] [CrossRef] [PubMed]
- Perez, M.M.; Ghinea, R.; Rivas, M.; Yebra, A.; Ionescu, A.; Paravina, R.; Herrera, L. Development of a customized whiteness index for dentistry based on CIELAB color space. Dent. Mater. 2016, 32, 461–467. [Google Scholar] [CrossRef] [PubMed]
- Akl, M.A.; Sim, C.P.C.; Nunn, M.E.; Zeng, L.L.; Hamza, T.A.; Wee, A.G. Validation of two clinical color measuring instruments for use in dental research. J. Dent. 2022, 125, 104223. [Google Scholar] [CrossRef] [PubMed]
- Paravina, R.; Powers, J. Esthetic Color Training in Dentistry; Mosby: St. Louis, MO, USA, 2004; pp. 51–78. [Google Scholar]
- Biron, M. Detailed Accounts of Thermoplastic Resins. In Thermoplastics and Thermoplastic Composites, 3rd ed.; William Andrew: Kindlington, UK; Oxford, UK, 2018; pp. 203–766. [Google Scholar]
- Pérez, M.M.; Herrera, L.J.; Carrillo, F.; Pecho, O.E.; Dudea, D.; Gasparik, C.; Ghinea, R.; Bona, A.D. Whiteness difference thresholds in dentistry. Dent. Mater. 2019, 35, 292–297. [Google Scholar] [CrossRef] [PubMed]
- Ryu, J.H.; Kwon, J.S.; Jiang, H.B.; Cha, J.Y.; Kim, K.M. Effects of thermoforming on the physical and mechanical properties of thermoplastic materials for transparent orthodontic aligners. Korean J. Orthod. 2018, 48, 316–325. [Google Scholar] [CrossRef]
- Bucci, R.; Rongo, R.; Levat’e, C.; Michelotti, A.; Barone, S.; Razionale, A.V.; D’Antò, V. Thickness of orthodontic clear aligners after thermoforming and after 10 days of intraoral exposure: A prospective clinical study. Prog. Orthod. 2019, 20, 36. [Google Scholar] [CrossRef] [PubMed]
- Ajwa, N.; Radhi, F.; Aloraini, R.; AlSaydalani, G. Comparative color stability assessment of orthodontic clear aligners: An in vitro study. Sci. Rep. 2025, 15, 2041. [Google Scholar] [CrossRef] [PubMed]
- Olteanu, N.D.; Taraboanta, I.; Panaite, T.; Balcos, C.; Rosu, S.N.; Vieriu, R.M.; Dinu, S.; Zetu, I.N. Color Stability of Various Orthodontic Clear Aligner Systems after Submersion in Different Staining Beverages. Materials 2024, 17, 4009. [Google Scholar] [CrossRef]
- Alharbi, N.; Alharbi, A.; Osman, R. Stain Susceptibility of 3D-Printed Nanohybrid Composite Restorative Material and the Efficacy of Different Stain Removal Techniques: An In Vitro Study. Materials 2021, 14, 5621. [Google Scholar] [CrossRef]
- Tartaglia, G.M.; Mapelli, A.; Maspero, C.; Santaniello, T.; Serafin, M.; Farronato, M.; Caprioglio, A. Direct 3D Printing of Clear Orthodontic Aligners: Current State and Future Possibilities. Materials 2021, 14, 1799. [Google Scholar] [CrossRef]
- Ryokawa, H.; Miyazaki, Y.; Fujishima, A.; Miyazaki, T.; Maki, K. The mechanical properties of dental thermoplastic materials in a simulated intraoral environment. Orthod. Waves 2006, 65, 64–72. [Google Scholar] [CrossRef]
- Fernandes, A.B.N.; Ruellas, A.C.O.; Araújo, M.V.A.; Sant’Anna, E.F.; Elias, C.N. Assessment of exogenous pigmentation in colourless elastic ligatures. J. Orthod. 2014, 41, 147–151. [Google Scholar] [CrossRef] [PubMed]
- Porojan, L.; Toma, F.R.; Gherban, M.I.; Vasiliu, R.D.; Matichescu, A. Surface Topography of Thermoplastic Appliance Materials Related to Sorption and Solubility in Artificial Saliva. Biomimetics 2024, 9, 379. [Google Scholar] [CrossRef] [PubMed]
- Dasy, H.; Dasy, A.; Asatrian, G.; Rózsa, N.; Lee, H.F.; Kwak, J.H. Effects of variable attachment shapes and aligner material on aligner retention. Angle Orthod. 2015, 85, 934–940. [Google Scholar] [CrossRef] [PubMed]
- Zhang, N.; Bai, Y.; Ding, X.; Zhang, Y. Preparation and characterization of thermoplastic materials for invisible orthodontics. Dent. Mater. J. 2011, 30, 954–959. [Google Scholar] [CrossRef]
- Daniele, V.; Macera, L.; Taglieri, G.; Di Giambattista, A.; Spagnoli, G.; Massaria, A.; Messori, M.; Quagliarini, E.; Chiappini, G.; Campanella, V.; et al. Thermoplastic disks used for commercial orthodontic aligners: Complete physicochemical and mechanical characterization. Materials 2020, 13, 2386. [Google Scholar] [CrossRef]
- Albilali, A.T.; Baras, B.H.; Aldosari, M.A. Evaluation of water sorption and solubility and FTIR spectroscopy of thermoplastic orthodontic retainer materials subjected to thermoforming and thermocycling. Appl. Sci. 2023, 13, 5165. [Google Scholar] [CrossRef]
- Al-Angari, S.S.; Eckert, G.J.; Sabrah, A.H.A. Color stability, Roughness, and Microhardness of Enamel and Composites Submitted to Staining/Bleaching Cycles. Saudi Dent. J. 2021, 33, 215–221. [Google Scholar] [CrossRef]
- Aldweesh, A.H.; Al-Maflehi, N.S.; AlGhizzi, M.; AlShayea, E.; Albarakati, S.F. Comparison of mechanical properties and color stability of various vacuum-formed orthodontic retainers: An in vitro study. Saudi Dent. J. 2023, 35, 953–959. [Google Scholar] [CrossRef] [PubMed]
- Papadopoulou, A.K.; Cantele, A.; Polychronis, G.; Zinelis, S.; Eliades, T. Changes in roughness and mechanical properties of Invisalign® appliances after One- and two-weeks use. Materials 2019, 12, 2406. [Google Scholar] [CrossRef] [PubMed]
- MaxdentCADigital. Available online: https://maxdentcadigital.com/clear-aligner/ (accessed on 9 December 2020).
- Mazzitelli, C.; Paolone, G.; Sabbagh, J.; Scotti, N.; Vichi, A. Color Stability of Resin Cements after Water Aging. Polymers 2023, 15, 655. [Google Scholar] [CrossRef] [PubMed]
- Ahn, H.W.; Ha, H.R.; Lim, H.N.; Choi, S. Effects of aging procedures on the molecular, biochemical, morphological, and mechanical properties of vacuum-formed retainers. J. Mech. Behav. Biomed. Mater 2015, 51, 356–366. [Google Scholar] [CrossRef]
- Ihssen, B.A.; Willmann, J.H.; Nimer, A.; Drescher, D. Effect of in vitro aging by water immersion and thermocycling on the mechanical properties of PETG aligner material. J. Orofac. Orthop. 2019, 80, 292–303. [Google Scholar] [CrossRef]
- Gülyurt, M. Investigation of Changes in Tooth Colour After the Use of Different Aligners. Cureus 2024, 16, e71047. [Google Scholar]
- Paravina, R.D.; Pérez, M.M.; Ghinea, R. Acceptability and perceptibility thresholds in dentistry: A comprehensive review of clinical and research applications. J. Esthet. Restor. Dent. 2019, 31, 103–112. [Google Scholar] [CrossRef]
- Paravina, R.D.; Ghinea, R.; Herrera, L.; Della Bona, A.; Igiel, C.; Linninger, M.; Sakai, M.; Takahashi, H.; Tashkandi, E.; del Mar Perez, M.; et al. Color differences thresholds in dentistry. J. Esthet. Restor. Dent. 2015, 27, S1–S9. [Google Scholar] [CrossRef] [PubMed]
- Pérez, M.M.; Ghinea, R.; Herrera, L.J.; Carrillo, F.; Ionescu, A.M.; Paravina, R.D. Color difference thresholds forcomputer-simulated human gingiva. J. Esthet. Restor. Dent. 2018, 30, e24–e30. [Google Scholar] [CrossRef]
- Grünheid, T.; Bitner, T.F. Wear and fatigue resistance: An in-vitro comparison of three polyethylene terephthalate glycol and thermoplastic polyurethane materials for vacuum-formed retainers. Int. Orthod. 2023, 21, 100748. [Google Scholar] [CrossRef] [PubMed]
- Iliadi, A.; Enzler, V.; Polychronis, G.; Peltomaki, T.; Zinelis, S.; Eliades, T. Effect of cleansers on the composition and mechanical properties of orthodontic aligners in vitro. Prog. Orthod. 2022, 23, 54. [Google Scholar] [CrossRef]

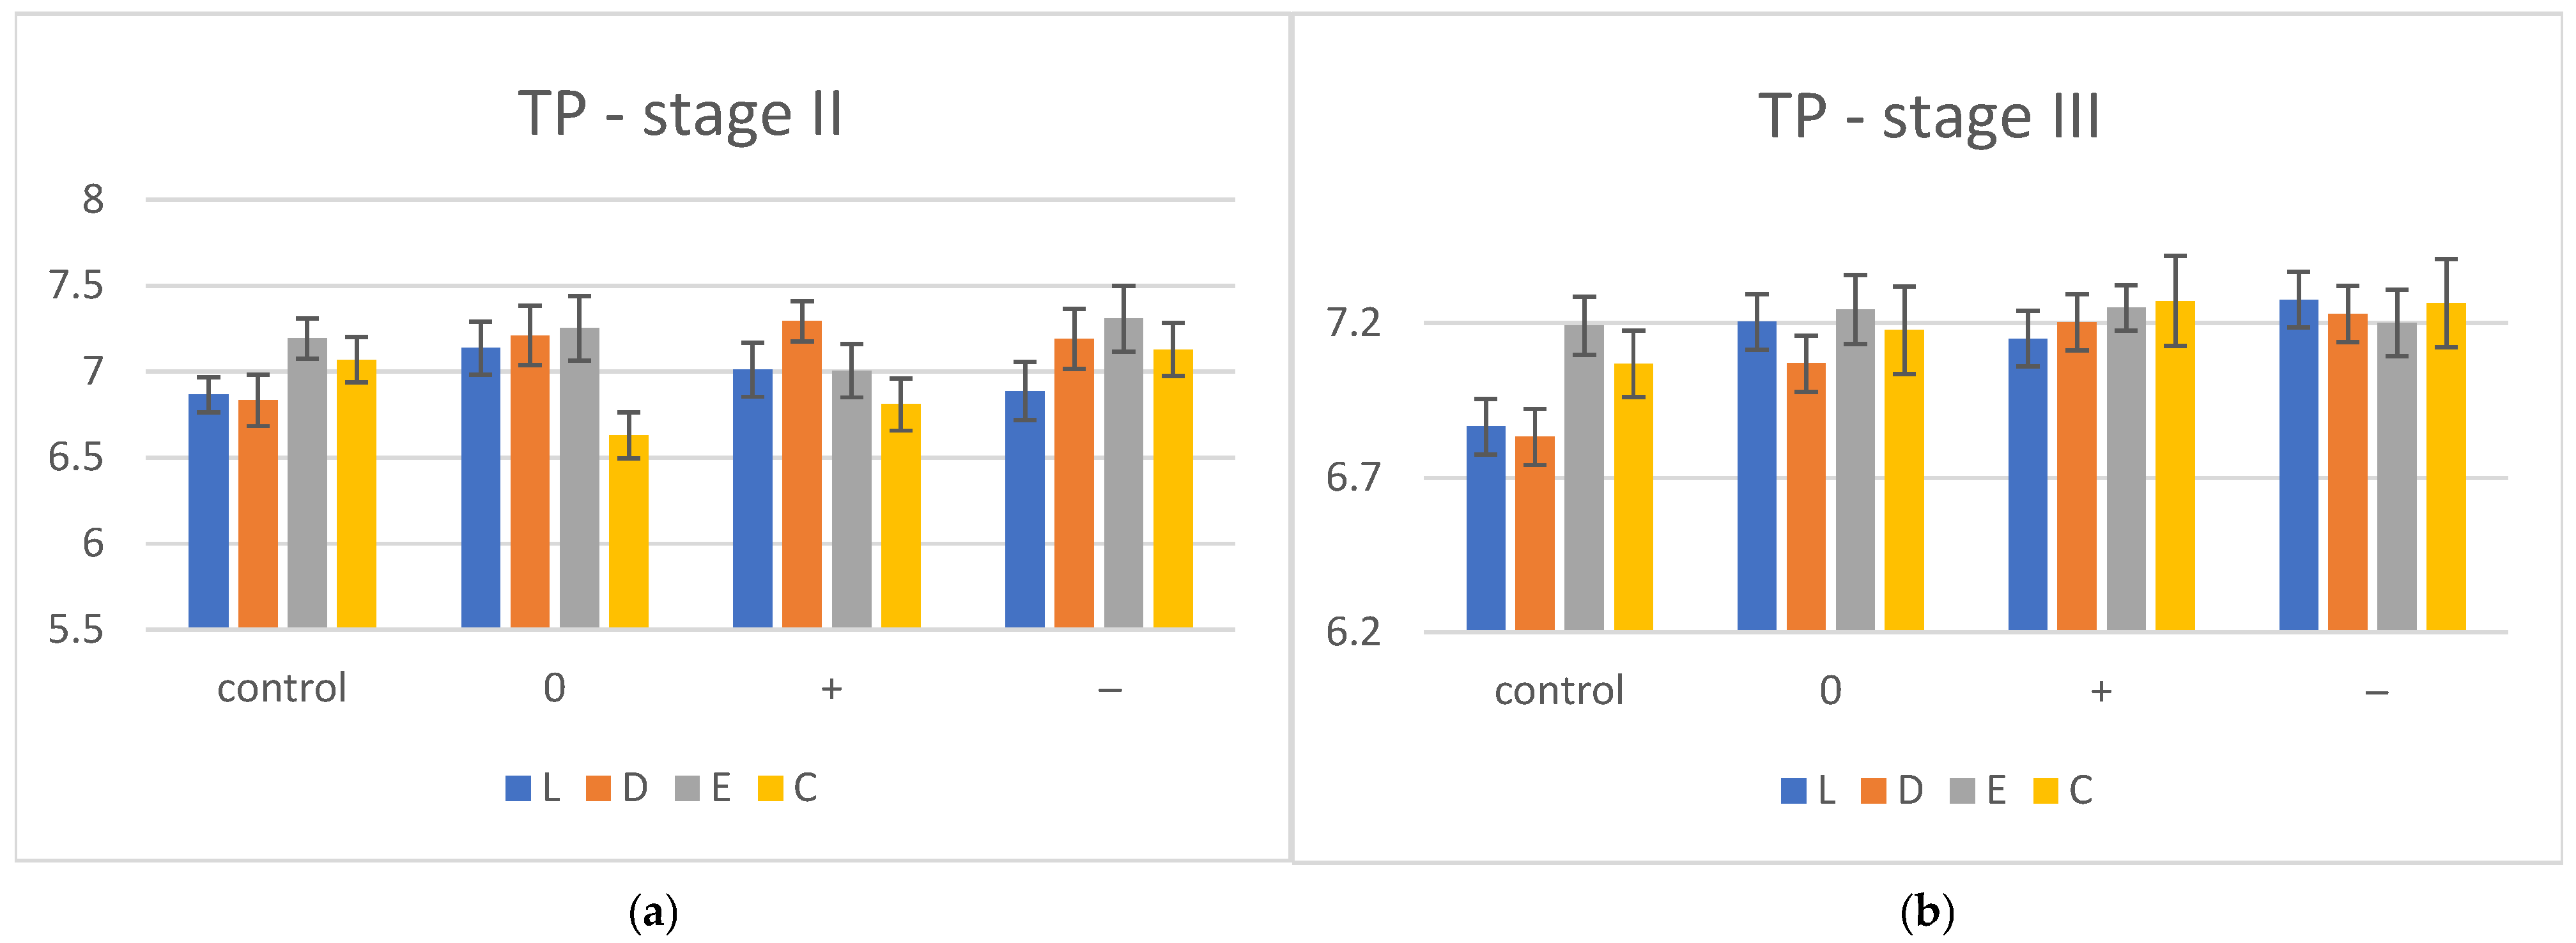
| TP | Stage I | Stage II | Stage III | ||||
|---|---|---|---|---|---|---|---|
| Control | 0 | + | − | 0 | + | − | |
| L | 6.865 ± 0.101 | 7.136 ± 0.153 | 7.01 ± 0.156 | 6.886 ± 0.168 | 7.204 ± 0.131 | 7.149 ± 0.117 | 7.276 ± 0.134 |
| D | 6.832 ± 0.148 | 7.21 ± 0.174 | 7.243 ± 0.117 | 7.19 ± 0.176 | 7.069 ± 0.157 | 7.203 ± 0.145 | 7.13 ± 0.101 |
| E | 7.192 ± 0.116 | 7.251 ± 0.187 | 7.254 ± 0.154 | 7.308 ± 0.191 | 7.244 ± 0.112 | 7.249 ± 0.074 | 7.301 ± 0.108 |
| C | 7.068 ± 0.132 | 6.63 ± 0.134 | 6.809 ± 0.152 | 7.028 ± 0.153 | 7.177 ± 0.141 | 7.271 ± 0.146 | 7.264 ± 0.143 |
| Stage | p-Value | L/D | L/E | L/C | D/E | D/C | E/C |
|---|---|---|---|---|---|---|---|
| control | 0.795 | 0.016 | 0.126 | 0.003 | 0.046 | 0.255 | |
| II | 0 | 0.35 | 0.171 | <0.001 | 0.637 | <0.001 | <0.001 |
| + | 0.001 | 0.948 | 0.024 | <0.001 | <0.001 | 0.014 | |
| − | 0.001 | <0.001 | 0.005 | 0.188 | 0.435 | 0.04 | |
| III | 0 | 0.146 | 0.682 | 0.757 | 0.073 | 0.193 | 0.462 |
| + | 0.52 | 0.172 | 0.204 | 0.405 | 0.41 | 0.754 | |
| − | 0.544 | 0.426 | 0.9 | 0.695 | 0.642 | 0.494 |
| p-Value | Lc/L0 | Lc/L+ | Lc/L− | Dc/D0 | Dc/D+ | Dc/D− | Ec/E0 | Ec/E+ | Ec/E− | Cc/C0 | Cc/C+ | Cc/C− |
|---|---|---|---|---|---|---|---|---|---|---|---|---|
| contr.-stage II | 0.03 | 0.114 | 0.883 | 0.001 | <0.001 | <0.001 | 0.536 | 0.074 | 0.29 | 0.005 | 0.036 | 0.569 |
| contr.-stage III | 0.035 | 0.078 | 0.025 | 0.057 | 0.005 | 0.001 | 0.678 | 0.475 | 0.491 | 0.319 | 0.04 | 0.175 |
| Stage | Material | L* | a* | b* |
|---|---|---|---|---|
| II | D0 | strong, r = 0.716, r2 = 0.512 = 51.2%, p = 0.733 | strong, r = −0.781, r2 = 0.609 = 60.9%, p = 0.009 | weak, r = 0.193, r2 = 0.037 = 3.72%, p = 0.647 |
| D+ | strong, r = 0.701, r2 = 0.49 = 49%, p = 0.2 | moderate, r = -0.491, r2 = 0.24 = 24.01%, p = 0.144 | moderate, r = −0.546, r2 = 0.297 = 29.7%, p = 0.007 | |
| D− | very strong, r = 0.850, r2 = 0.722 = 72.25%, p= 0.379 | strong, r = −0.768, r2 = 0.588 = 58.8%, p = 0.01 | very weak, r = 0.162, r2 = 0.026 = 2.6%, p = 0.017 | |
| C0 | very strong, r = 0.924, r2 = 0.853 = 85.3%, p = 0.920 | strong, r = −0.752, r2 = 0.564 = 56.4%, p = 0.009 | strong, r = 0.608, r2 = 0.369 = 36.9%, p = 0.749 | |
| III | D+ | very strong, r = 0.826, r2 =0.682 = 68.22%, p = 0.062 | strong, r = −0.772, r2 =0.595 = 59.5%, p = 0.008 | weak, r = 0.379, r2 = 0.143 = 14.36%, p = 0.017 |
| D− | weak, r = 0.353, r2 = 0.124 = 12.4%, p = 0.231 | weak, r = 0.201, r2 = 0.04 = 4.04%, p = 0.595 | moderate, r = −0.571, r2 = 0.326 32.6%, p= 0.001 |
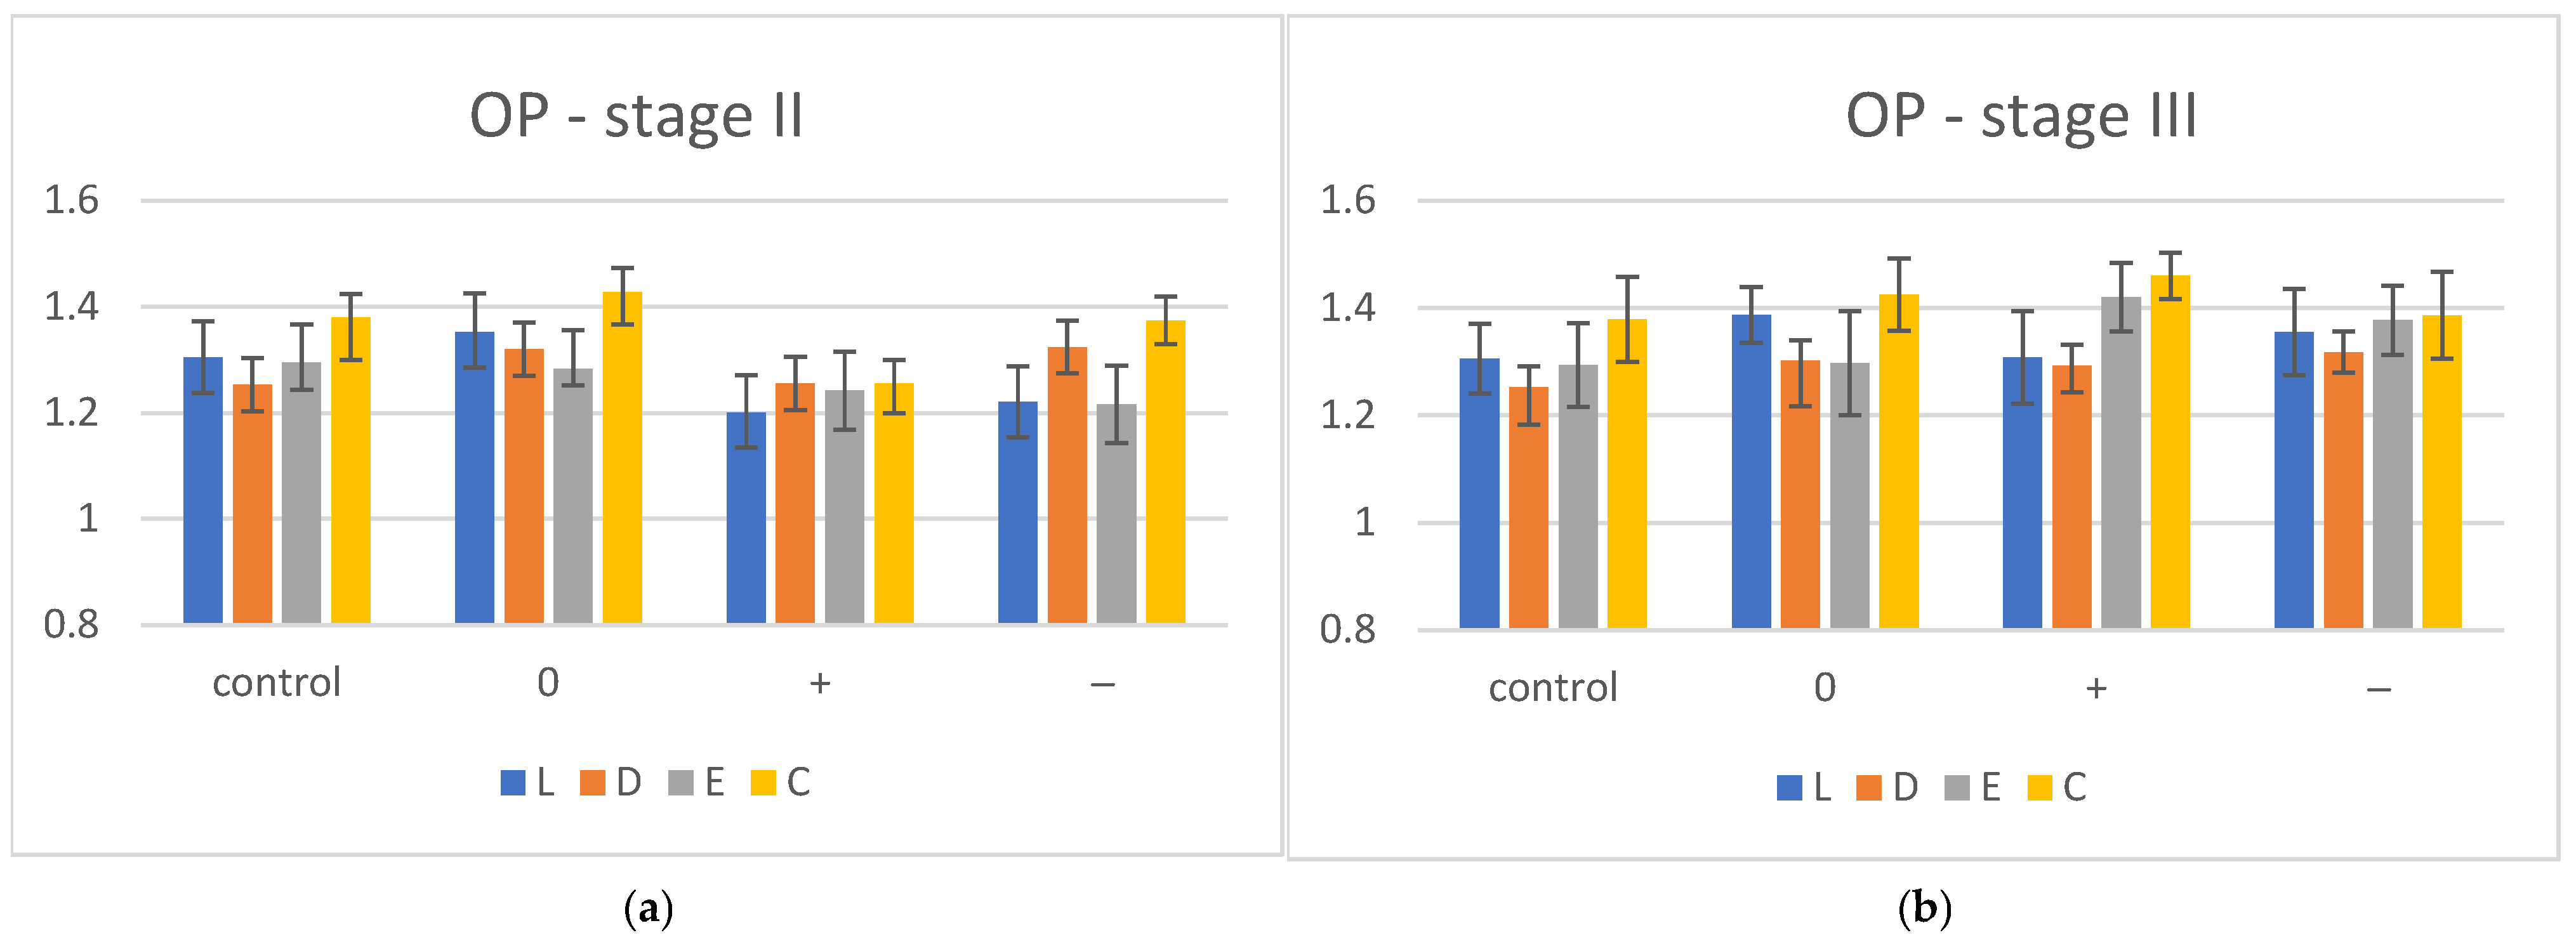
| OP | I | II | III | ||||
|---|---|---|---|---|---|---|---|
| Control | 0 | + | − | 0 | + | − | |
| L | 1.305 ± 0.068 | 1.352 ± 0.073 | 1.201 ± 0.07 | 1.221 ± 0.067 | 1.387 ± 0.052 | 1.308 ± 0.086 | 1.355 ± 0.08 |
| D | 1.253 ± 0.07 | 1.32 ± 0.062 | 1.245 ± 0.065 | 1.324 ± 0.05 | 1.302 ± 0.085 | 1.293 ± 0.05 | 1.318 ± 0.038 |
| E | 1.294 ± 0.051 | 1.283 ± 0.031 | 1.242 ± 0.074 | 1.216 ± 0.073 | 1.257 ± 0.097 | 1.42 ± 0.064 | 1.377 ± 0.064 |
| C | 1.379 ± 0.079 | 1.428 ± 0.061 | 1.255 ± 0.056 | 1.374 ± 0.045 | 1.425 ± 0.067 | 1.46 ± 0.043 | 1.336 ± 0.081 |
| Stage | p-Value | L/D | L/E | L/C | D/E | D/C | E/C |
|---|---|---|---|---|---|---|---|
| control | 0.194 | 0.083 | 0.336 | 0.336 | 0.101 | 0.061 | |
| II | 0 | 0.409 | 0.018 | 0.027 | 0.246 | 0.006 | <0.001 |
| + | 0.021 | 0.001 | 0.031 | <0.001 | 0.761 | <0.001 | |
| − | 0.007 | 0.907 | 0.001 | 0.001 | 0.146 | <0.001 | |
| III | 0 | 0.019 | 0.002 | 0.197 | 0.305 | 0.003 | <0.001 |
| + | 0.625 | 0.005 | <0.001 | <0.001 | <0.001 | 0.138 | |
| − | 0.228 | 0.527 | 0.629 | 0.029 | 0.551 | 0.253 |
| p-Value | Lc/L0 | Lc/L+ | Lc/L− | Dc/D0 | Dc/D+ | Dc/D− | Ec/E0 | Ec/E+ | Ec/E− | Cc/C0 | Cc/C+ | Cc/C− |
|---|---|---|---|---|---|---|---|---|---|---|---|---|
| control-stage II | 0.014 | 0.03 | <0.001 | 0.085 | 0.989 | 0.141 | 0.781 | <0.001 | 0.071 | 0.188 | 0.014 | 0.856 |
| control-stage III | <0.001 | <0.001 | <0.001 | 0.283 | 0.287 | 0.018 | 0.496 | 0.012 | 0.042 | 0.236 | 0.018 | 0.308 |
| Stage | Material | a* | b* |
|---|---|---|---|
| II | L− | weak, r = 0.275, r2= 0.075 = 7.56%, p = 0.573 | moderate, r = 0.502, r2 =0.25 = 25.5%, p = 0.02 |
| E+ | strong, r = 0.623, r2 =0.388 = 38.8%, p = 0.006 | moderate, r = 0.498, r2 = 0.24 = 24.8%, p < 0.01 | |
| III | L0 | strong, r = 0.609, r2 = 0.371 = 37.1%, p = 0.058 | weak, r = 0.336, r2 =0.113 = 11.3%, p = 0.071 |
| L+ | weak, r = 0.377, r2 =0.142 = 14.2%, p = 0.219 | weak, r = 0.274, r2 =0.075 = 7.5%, p = 0.003 | |
| L− | moderate, r = 0.499, r2 =0.249 = 24.9%, p = 0.13 | weak, r = 0.338, r2 =0.114 = 11.4%, p = 0.031 | |
| E+ | very strong, r = 0.80, r2 = 0.64 = 64.3%, p = 0.001 | very strong, r = 0.8, r2 = 0.654 = 65.4%, p = 0.003 |
| NBS | L | D | E | C | |
|---|---|---|---|---|---|
| Stage II | 0 | 6.389 | 6.35 | 0.895 | 1.071 |
| + | 2.093 | 4.719 | 0.181 | 4.071 | |
| − | 1.518 | 0.429 | 2.357 | 2.338 | |
| Stage III | 0 | 3.737 | 3.396 | 0.189 | 3.036 |
| + | 2.635 | 4.729 | 4.967 | 4.978 | |
| − | 4.501 | 6.322 | 3.204 | 1.436 |
 extremely slight change,
  slight change,
  perceivable,
  marked change,
  extremely marked change.
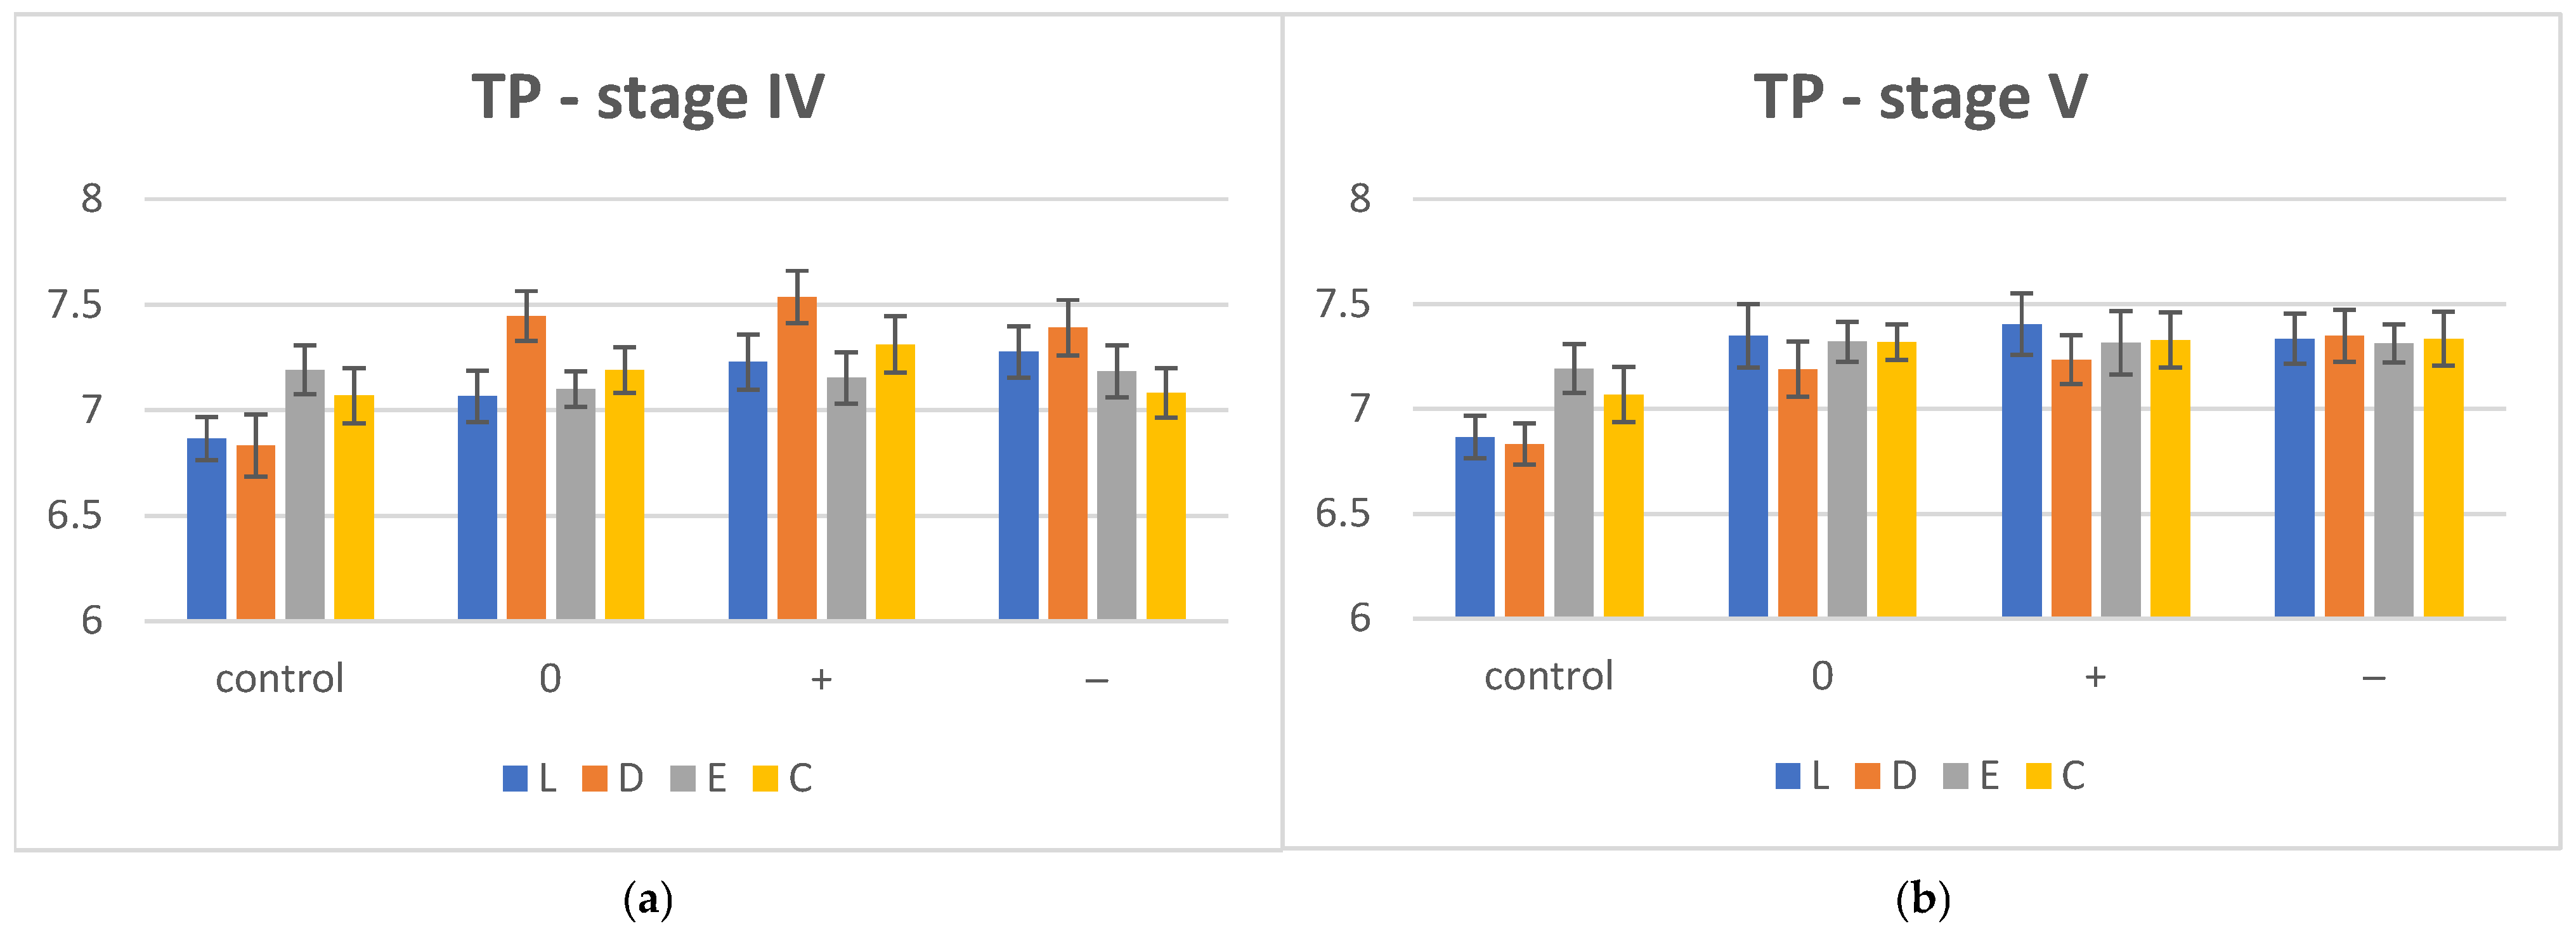
| TP | I | IV | V | ||||
|---|---|---|---|---|---|---|---|
| Control | 0 | + | − | 0 | + | − | |
| L | 6.865 ± 0.101 | 7.065 ± 0.123 | 7.228 ± 0.131 | 7.276 ± 0.121 | 7.348 ± 0.151 | 7.404 ± 0.147 | 7.125 ± 0.119 |
| D | 6.832 ± 0.148 | 7.446 ± 0.118 | 7.537 ± 0.123 | 7.291 ± 0.131 | 7.189 ± 0.131 | 7.235 ± 0.117 | 7.349 ± 0.123 |
| E | 7.192 ± 0.116 | 7.101 ± 0.084 | 7.153 ± 0.122 | 7.284 ± 0.122 | 7.321 ± 0.095 | 7.315 ± 0.151 | 7.312 ± 0.092 |
| C | 7.068 ± 0.132 | 7.189 ± 0.108 | 7.312 ± 0.133 | 7.081 ± 0.117 | 7.618 ± 0.084 | 7.328 ± 0.132 | 7.334 ± 0.128 |
| Stage | p-Value | L/D | L/E | L/C | D/E | D/C | E/C |
|---|---|---|---|---|---|---|---|
| control | 0.795 | 0.016 | 0.126 | 0.003 | 0.046 | 0.255 | |
| IV | 0 | <0.001 | 0.565 | 0.072 | <0.001 | <0.001 | 0.07 |
| + | <0.001 | 0.344 | 0.305 | <0.001 | 0.002 | 0.02 | |
| − | 0.804 | 0.905 | 0.007 | 0.918 | 0.011 | 0.004 | |
| V | 0 | 0.059 | 0.663 | <0.001 | 0.068 | <0.001 | <0.001 |
| + | 0.04 | 0.296 | 0.352 | 0.229 | 0.132 | 0.841 | |
| − | <0.001 | <0.001 | <0.001 | 0.587 | 0.869 | 0.784 |
| p-Value | Lc/L0 | Lc/L+ | Lc/L− | Dc/D0 | Dc/D+ | Dc/D− | Ec/E0 | Ec/E+ | Ec/E− | Cc/C0 | Cc/C+ | Cc/C− |
|---|---|---|---|---|---|---|---|---|---|---|---|---|
| control-IV | 0.029 | 0.038 | 0.005 | <0.001 | <0.001 | 0.002 | 0.324 | 0.66 | 0.15 | 0.192 | 0.026 | 0.899 |
| control-V | 0.003 | <0.001 | <0.001 | 0.015 | 0.001 | <0.001 | 0.08 | 0.193 | 0.184 | 0.101 | 0.02 | 0.058 |
| Stage | Material | L* | a* | b* |
|---|---|---|---|---|
| IV | L− | strong, r = 0.725, r2 = 0.525 = 52.5%, p = 0.405 | weak, r = 0.376, r2 = 0.142 = 14.2%, p = 0.306 | very weak, r = 0.024, r2 = 0.001 = 0.1%, p = 0.213 |
| D0 | very strong, r = 0.918, r2 = 0.842 = 84.2%, p = 0.113 | moderate, r = 0.591, r2 = 0.349 = 34.9%, p = 0.087 | moderate, r = 0.430, r2 = 0.185 = 18.5%, p = 0.732 | |
| D+ | very strong, r = 0.955, r2 = 0.912 = 91.2%, p = 0.021 | moderate, r = 0.544, r2 = 0.296 = 29.5%, p = 0.110 | moderate, r = 0.586, r2 = 0.344 = 34.36%, p = 0.980 | |
| D− | very strong, r = 0.905, r2 = 0.819 = 81.9%, p = 0.049 | strong, r = 0.717, r2 = 0.514 = 51.4%, p = 0.025 | strong, r = 0.659, r2 = 0.434 = 43.4%, p = 0.715 | |
| V | L0 | very strong, r = 0.875, r2 = 0.765 = 76.5%, p = 0.103 | strong, r = 0.708, r2 = 0.609 =60.9%, p = 0.008 | weak, r = 0.368, r2 = 0.136 = 13.6%, p = 0.911 |
| L+ | very strong, r = 0.963, r2 = 0.928 = 92.7%, p = 0.003 | strong, r = 0.812, r2 = 0.660 = 66%, p = 0.004 | very weak, r = 0.182, r2 = 0.033 = 3.33%, p = 0.824 | |
| L− | very weak, r = 0.115, r2 = 0.013 = 1.32%, p = 0.002 | weak, r = 0.226, r2 = 0.051 = 5.12%, p = 0.396 | weak, r = 0.221, r2 = 0.049 = 4.87, p = 0.034 | |
| D0 | very strong, r = 0.940, r2 = 0.883 = 88.3%, p = 0.022 | strong, r = 0.770, r2 = 0.593 = 59.2%, p = 0.008 | weak, r = 0.278, r2 = 0.077 = 7.72%, p = 0.068 | |
| D+ | strong, r = 0.792, r2 = 0.627 = 62.7%, p = 0.618 | moderate, r = 0.414, r2 = 0.172 = 17.1%, p = 0.254 | moderate, r = 0.408, r2 = 0.166 = 0.17%, p = 0.007 | |
| D- | very strong, r = 0.841, r2 = 0.707 = 70.6%, p = 0.244 | moderate, r = 0.445, r2 = 0.198 = 19.8%, p = 0.211 | very weak, r = 0.005, r2 = 0.0002 = 0.02%, p = 0.076 |
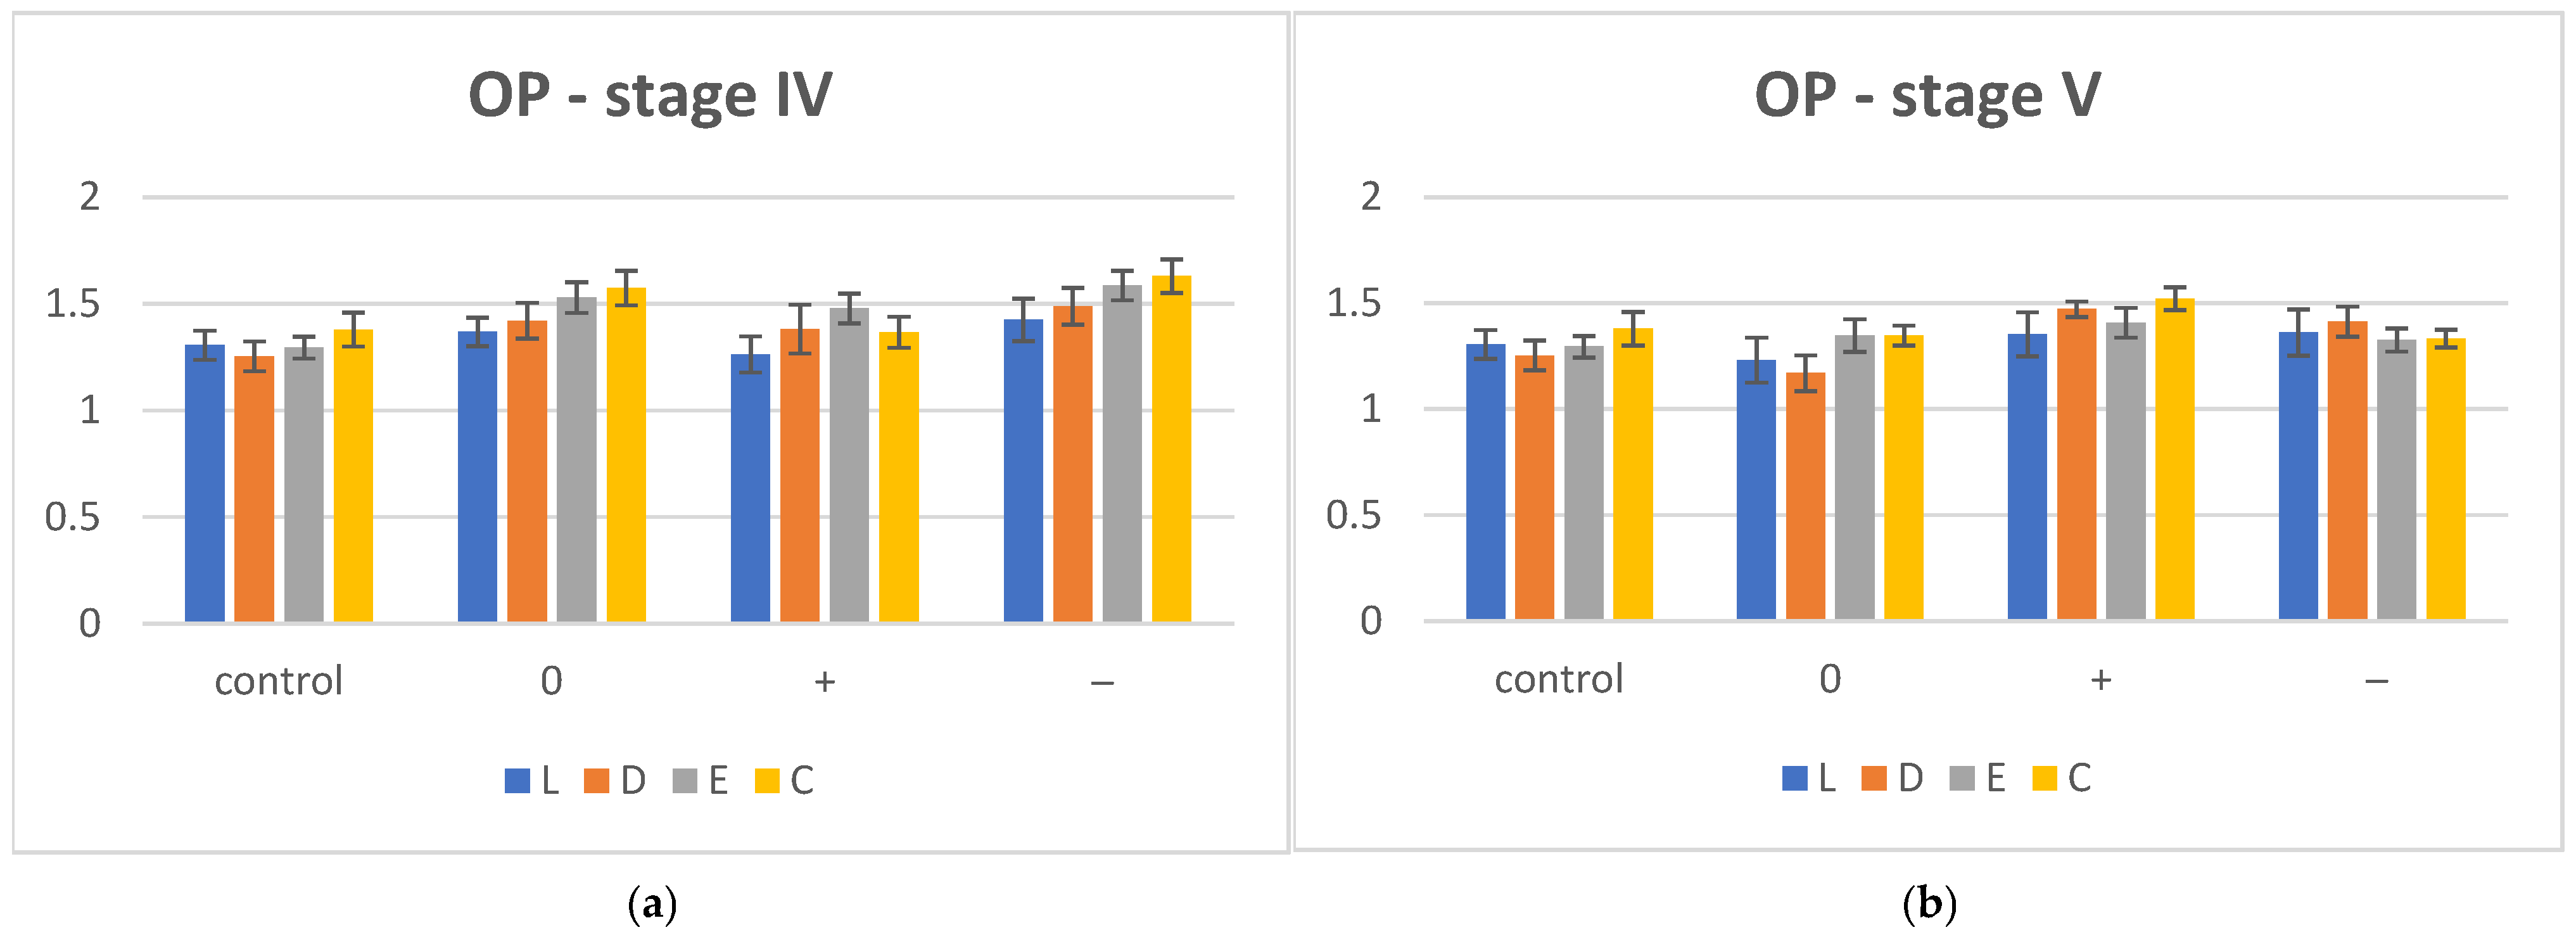
| OP | I | IV | V | ||||
|---|---|---|---|---|---|---|---|
| Control | 0 | + | − | 0 | + | − | |
| L | 1.305 ± 0.068 | 1.368 ± 0.067 | 1.362 ± 0.085 | 1.424 ± 0.099 | 1.131 ± 0.106 | 1.353 ± 0.104 | 1.361 ± 0.109 |
| D | 1.253 ± 0.07 | 1.42 ± 0.084 | 1.381 ± 0.114 | 1.488 ± 0.086 | 1.169 ± 0.085 | 1.471 ± 0.037 | 1.413 ± 0.071 |
| E | 1.294 ± 0.051 | 1.529 ± 0.072 | 1.477 ± 0.069 | 1.585 ± 0.069 | 1.247 ± 0.077 | 1.407 ± 0.07 | 1.326 ± 0.055 |
| C | 1.379 ± 0.079 | 1.573 ± 0.081 | 1.466 ± 0.073 | 1.628 ± 0.079 | 1.347 ± 0.047 | 1.42 ± 0.053 | 1.383 ± 0.042 |
| Stage | p-Value | L/D | L/E | L/C | D/E | D/C | E/C |
|---|---|---|---|---|---|---|---|
| control | 0.194 | 0.807 | 0.083 | 0.336 | 0.101 | 0.061 | |
| IV | 0 | 0.167 | <0.001 | <0.001 | 0.008 | <0.001 | 0.104 |
| + | 0.022 | 0.045 | 0.004 | <0.001 | 0.736 | 0.013 | |
| − | 0.157 | <0.001 | <0.001 | 0.006 | <0.001 | 0.044 | |
| V | 0 | 0.191 | 0.015 | 0.007 | <0.001 | <0.001 | 0.991 |
| + | 0.004 | 0.212 | <0.001 | 0.026 | 0.035 | 0.001 | |
| − | 0.214 | 0.396 | 0.474 | 0.008 | 0.008 | 0.769 |
| Stage | Material | a* | b* |
|---|---|---|---|
| IV | L0 | weak, r = 0.219, r2 = 0.048 = 4.8%, p = 0.543 | very weak, r = 0.047, r2 = 0.002 = 0.22%, p = 0.13 |
| L+ | moderate, r = 0.423, r2 = 0.179 = 17.8%, p = 0.21 | strong, r = 0.677, r2 = 0.459 = 45.9%, p = 0.456 | |
| L− | very weak, r = 0.193, r2 = 0.037 = 3.7%, p = 0.725 | very weak, r = 0.039, r2 = 0.002 = 0.2%, p = 0.03 | |
| D0 | very weak, r = 0.047, r2 = 0.002 = 0.22%, p = 0.62 | moderate, r = 0.594, r2 = 0.353 = 35.3%, p = 0.07 | |
| D+ | very weak, r = 0.04, r2 = 0.001 = 0.16%, p = 0.8 | weak, r = 0.206, r2 = 0.042 = 4.26%, p < 0.001 | |
| D− | strong, r = 0.66, r2 = 0.436 = 43.6%, p = 0.066 | very strong, r = 0.83, r 2 = 0.692 = 69.2%, p = 0.04 | |
| E0 | very weak, r = 0.172, r2 = 0.029 = 2.94%, p = 0.64 | moderate, r = 0.471, r2 = 0.221 = 22.1%, p > 0.011 | |
| E+ | very weak, r = 0.13, r2 = 0.017 = 1.71%, p = 0.75 | weak, r = 0.221, r2 = 0.049 = 4.9%, p = 0.02 | |
| E− | weak, r = 0.242, r2 = 0.059 = 5.87%, p = 0.448 | moderate, r = 0.512, r2 = 0.262 = 26.1%, p = 0.73 | |
| C0 | moderate, r = 0.542, r2 = 0.274 = 27.4%, p = 0.12 | very weak, r = 0.103, r2 = 0.011 = 1.1%, p = 0.348 | |
| C+ | very weak, r = 0.198, r2 = 0.039 = 3.93%, p = 0.59 | weak, r = 0.39, r2 = 0.157 = 15.73%, p = 0.393 | |
| C− | very weak, r = 0.242, r2 = 0.059 = 5.87%, p = 0.44 | moderate, r = 0.512,r2 = 0.262 = 26.19%, p = 0.73 | |
| V | L0 | weak, r = 0.180, r2 =0.032 = 3.22%, p = 0.605 | strong, r = 0.697, r2 =0.486 = 48.9%, p = 0.004 |
| L+ | strong, r = 0.605, r2 = 0.366 = 36.6%, p = 0.062 | very weak, r = 0.11,r2 = 0.013 = 1.34%, p = 0.038 | |
| L− | moderate, r = 0.583, r2 = 0.34 = 34%, p = 0.049 | very weak, r = 0.152, r2 = 0.023 = 2.3%, p = 0.02 | |
| D0 | weak, r = 0.260, r2 = 0.067 = 6.74%, p = 0.58 | strong, r = 0.755, r2 = 0.570 = 57%, p = 0.057 | |
| D+ | weak, r = 0.202, r2 = 0.041 = 4.09%, p = 0.63 | moderate, r = 0.414, r2 = 0.171 = 17.1%, p = 0.03 | |
| D− | weak, r = 0.371, r2 = 0.138 = 13.8%, p = 0.33 | very strong, r = 0.80, r2 = 0.648 = 64.7%, p = 0.01 |
| NBS | L | D | E | C | |
|---|---|---|---|---|---|
| Stage IV | 0 | 2.55 | 8 | 2.07 | 4.35 |
| + | 3.7 | 7.61 | 4.49 | 2.55 | |
| − | 3.99 | 10.08 | 7.55 | 6.32 | |
| Stage V | 0 | 3.49 | 1.63 | 2.92 | 2.9 |
| + | 4.37 | 9.4 | 2.92 | 4.81 | |
| − | 4.05 | 7.8 | 1.73 | 0.88 |
 slight change,
  perceivable,
  marked change,
  extremely marked change.
| WID | pH | L | D | E | C |
|---|---|---|---|---|---|
| Stage I | control | 26.79 | 26.58 | 28.33 | 28.69 |
| Stage II | 0 | 31.00 | 30.54 | 28.65 | 27.98 |
| + | 28.03 | 28.76 | 27.91 | 26.74 | |
| − | 25.59 | 30.52 | 29.78 | 30.96 | |
| Stage III | 0 | 28.67 | 28.21 | 28.12 | 30.37 |
| + | 28.00 | 28.66 | 30.76 | 31.69 | |
| − | 29.06 | 29.97 | 29.89 | 29.51 | |
| Stage IV | 0 | 28.18 | 30.93 | 28.85 | 30.88 |
| + | 28.61 | 30.50 | 30.52 | 30.31 | |
| − | 29.03 | 32.01 | 32.22 | 32.07 | |
| Stage V | 0 | 28.66 | 26.92 | 31.42 | 30.08 |
| + | 28.83 | 31.70 | 29.21 | 31.39 | |
| − | 28.77 | 30.51 | 28.94 | 29.08 |
| WID Differences | II—I | III—I | IV—I | V—I |
|---|---|---|---|---|
| L0—Lc | 4.21 | 1.88 | 1.42 | 1.87 |
| D0—Dc | 3.96 | 1.63 | 2.35 | 0.34 |
| E0—Ec | 0.33 | −0.21 | 0.52 | 3.09 |
| C0—Cc | −0.71 | 1.68 | 2.19 | 1.39 |
| L+)—Lc | 1.24 | 1.21 | 1.82 | 2.04 |
| D+)—Dc | 2.18 | 2.08 | 3.92 | 5.12 |
| E+)—Ec | −0.42 | 2.43 | 2.19 | 0.88 |
| C+)—Cc | −1.95 | 3.00 | 1.62 | 2.70 |
| L−)—Lc | −1.20 | 1.27 | 2.24 | 1.98 |
| D−)—Dc | 3.94 | 3.39 | 5.43 | 3.93 |
| E−)—Ec | 1.45 | 1.56 | 3.89 | 0.61 |
| C−)—Cc | 2.27 | 0.82 | 3.38 | 0.39 |
Disclaimer/Publisher’s Note: The statements, opinions and data contained in all publications are solely those of the individual author(s) and contributor(s) and not of MDPI and/or the editor(s). MDPI and/or the editor(s) disclaim responsibility for any injury to people or property resulting from any ideas, methods, instructions or products referred to in the content. |
© 2025 by the authors. Licensee MDPI, Basel, Switzerland. This article is an open access article distributed under the terms and conditions of the Creative Commons Attribution (CC BY) license (https://creativecommons.org/licenses/by/4.0/).
Share and Cite
Porojan, L.; Bejan, F.R.; Vasiliu, R.D.; Matichescu, A. Optical Behavior of Clear Thermoplastic Dental Materials in a Simulated Oral Environment. Polymers 2025, 17, 472. https://doi.org/10.3390/polym17040472
Porojan L, Bejan FR, Vasiliu RD, Matichescu A. Optical Behavior of Clear Thermoplastic Dental Materials in a Simulated Oral Environment. Polymers. 2025; 17(4):472. https://doi.org/10.3390/polym17040472
Chicago/Turabian StylePorojan, Liliana, Flavia Roxana Bejan, Roxana Diana Vasiliu, and Anamaria Matichescu. 2025. "Optical Behavior of Clear Thermoplastic Dental Materials in a Simulated Oral Environment" Polymers 17, no. 4: 472. https://doi.org/10.3390/polym17040472
APA StylePorojan, L., Bejan, F. R., Vasiliu, R. D., & Matichescu, A. (2025). Optical Behavior of Clear Thermoplastic Dental Materials in a Simulated Oral Environment. Polymers, 17(4), 472. https://doi.org/10.3390/polym17040472