

Reducing Infrared Radiation and Solid Thermal Conductivity by Incorporating Varying Amounts of GnP into Microcellular PMMA

 ,
,  , ,
, ,  and
and 
Abstract

1. Introduction
2. Experimental
2.1. Materials
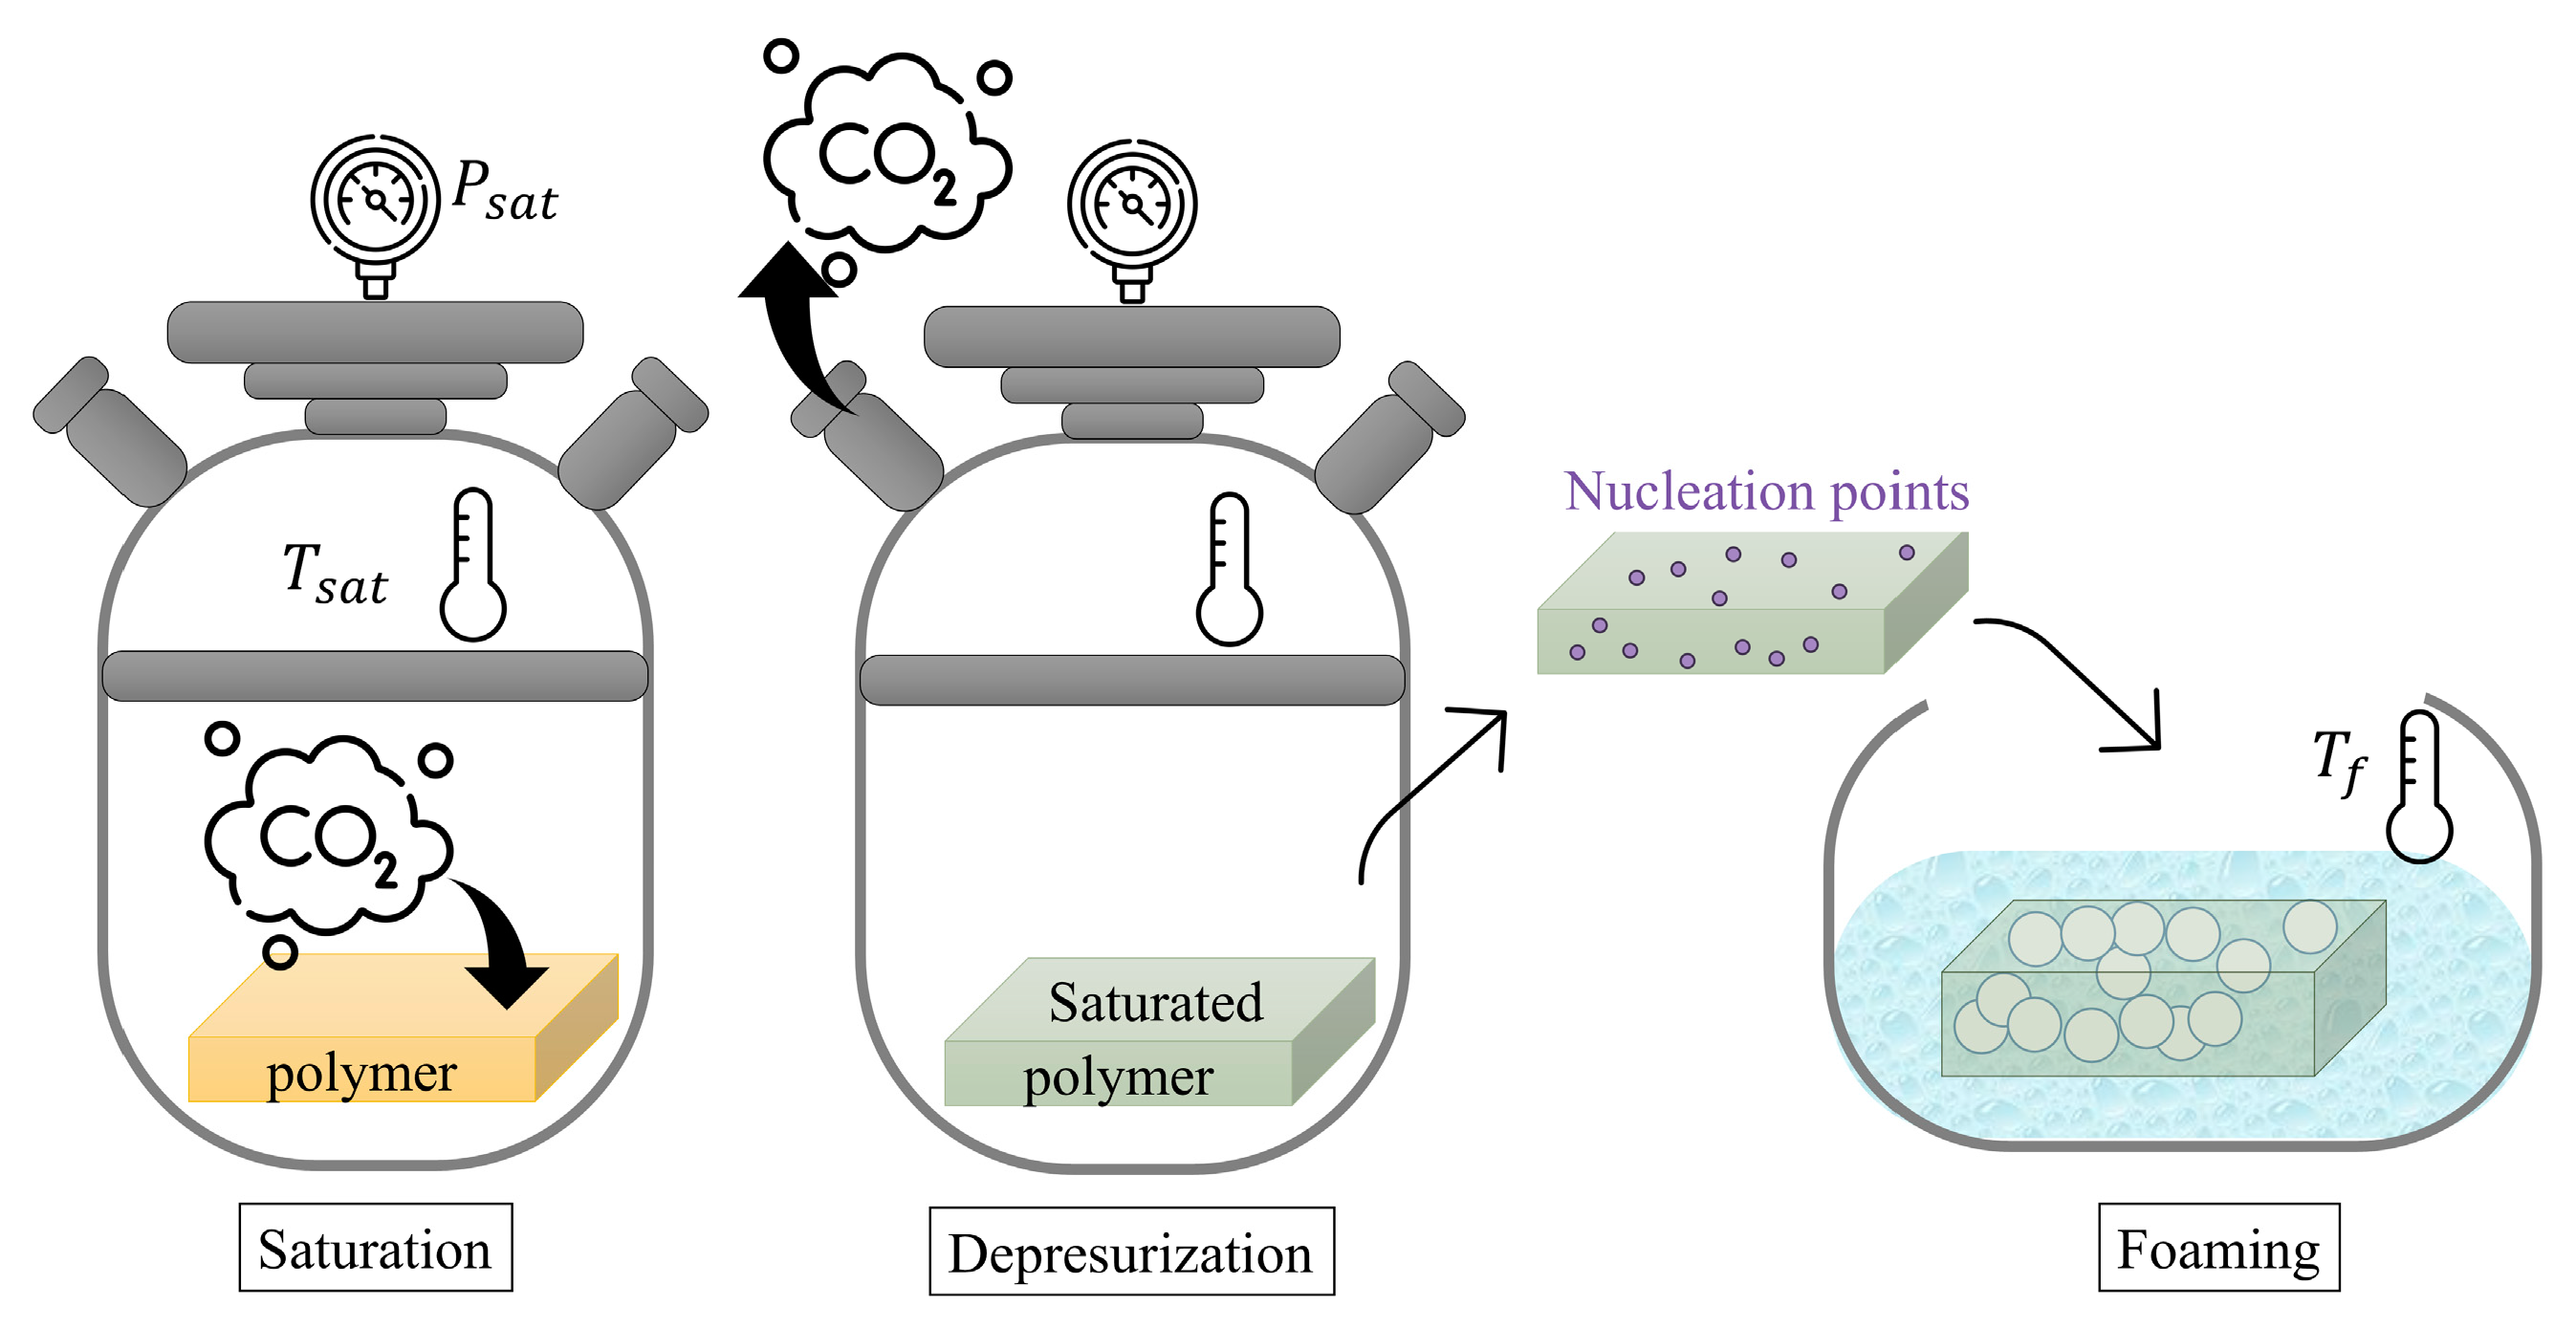
2.2. Sample Preparation
2.3. Characterization
2.3.1. Composition
2.3.2. Glass Transition Temperature
2.3.3. Density
2.3.4. Cellular Structure
2.3.5. Thermal Conductivity
3. Results and Discussion
3.1. Characterization of the Solid
3.2. Characterization of the Cellular Materials
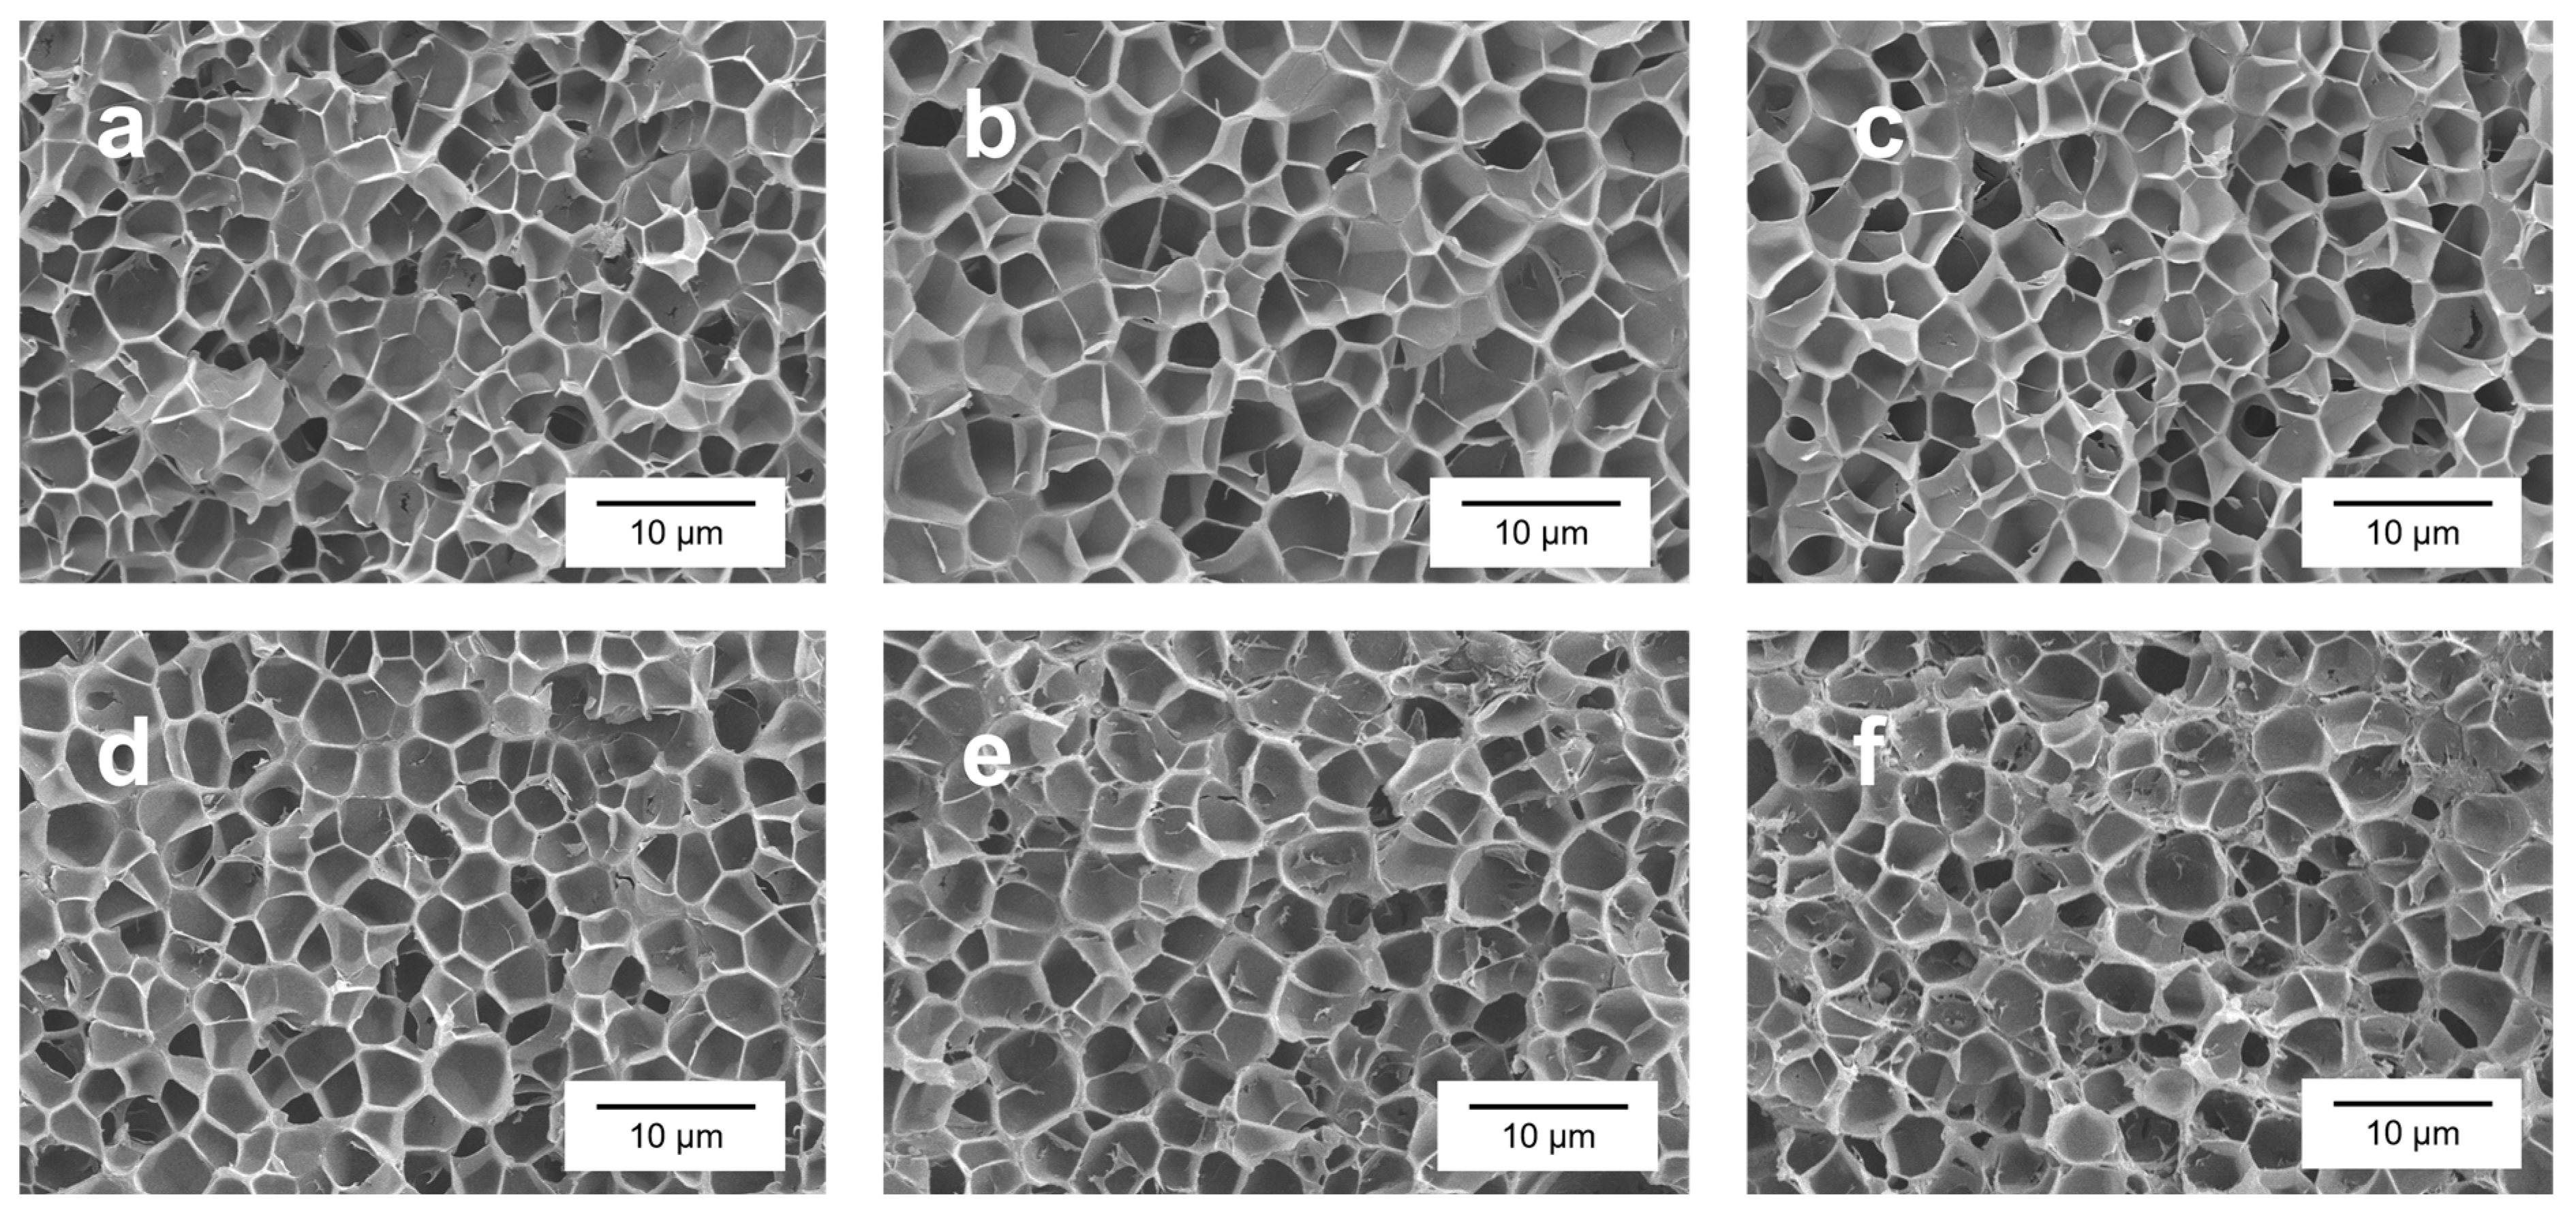
3.2.1. Cellular Structure and Density
Cellular Structure
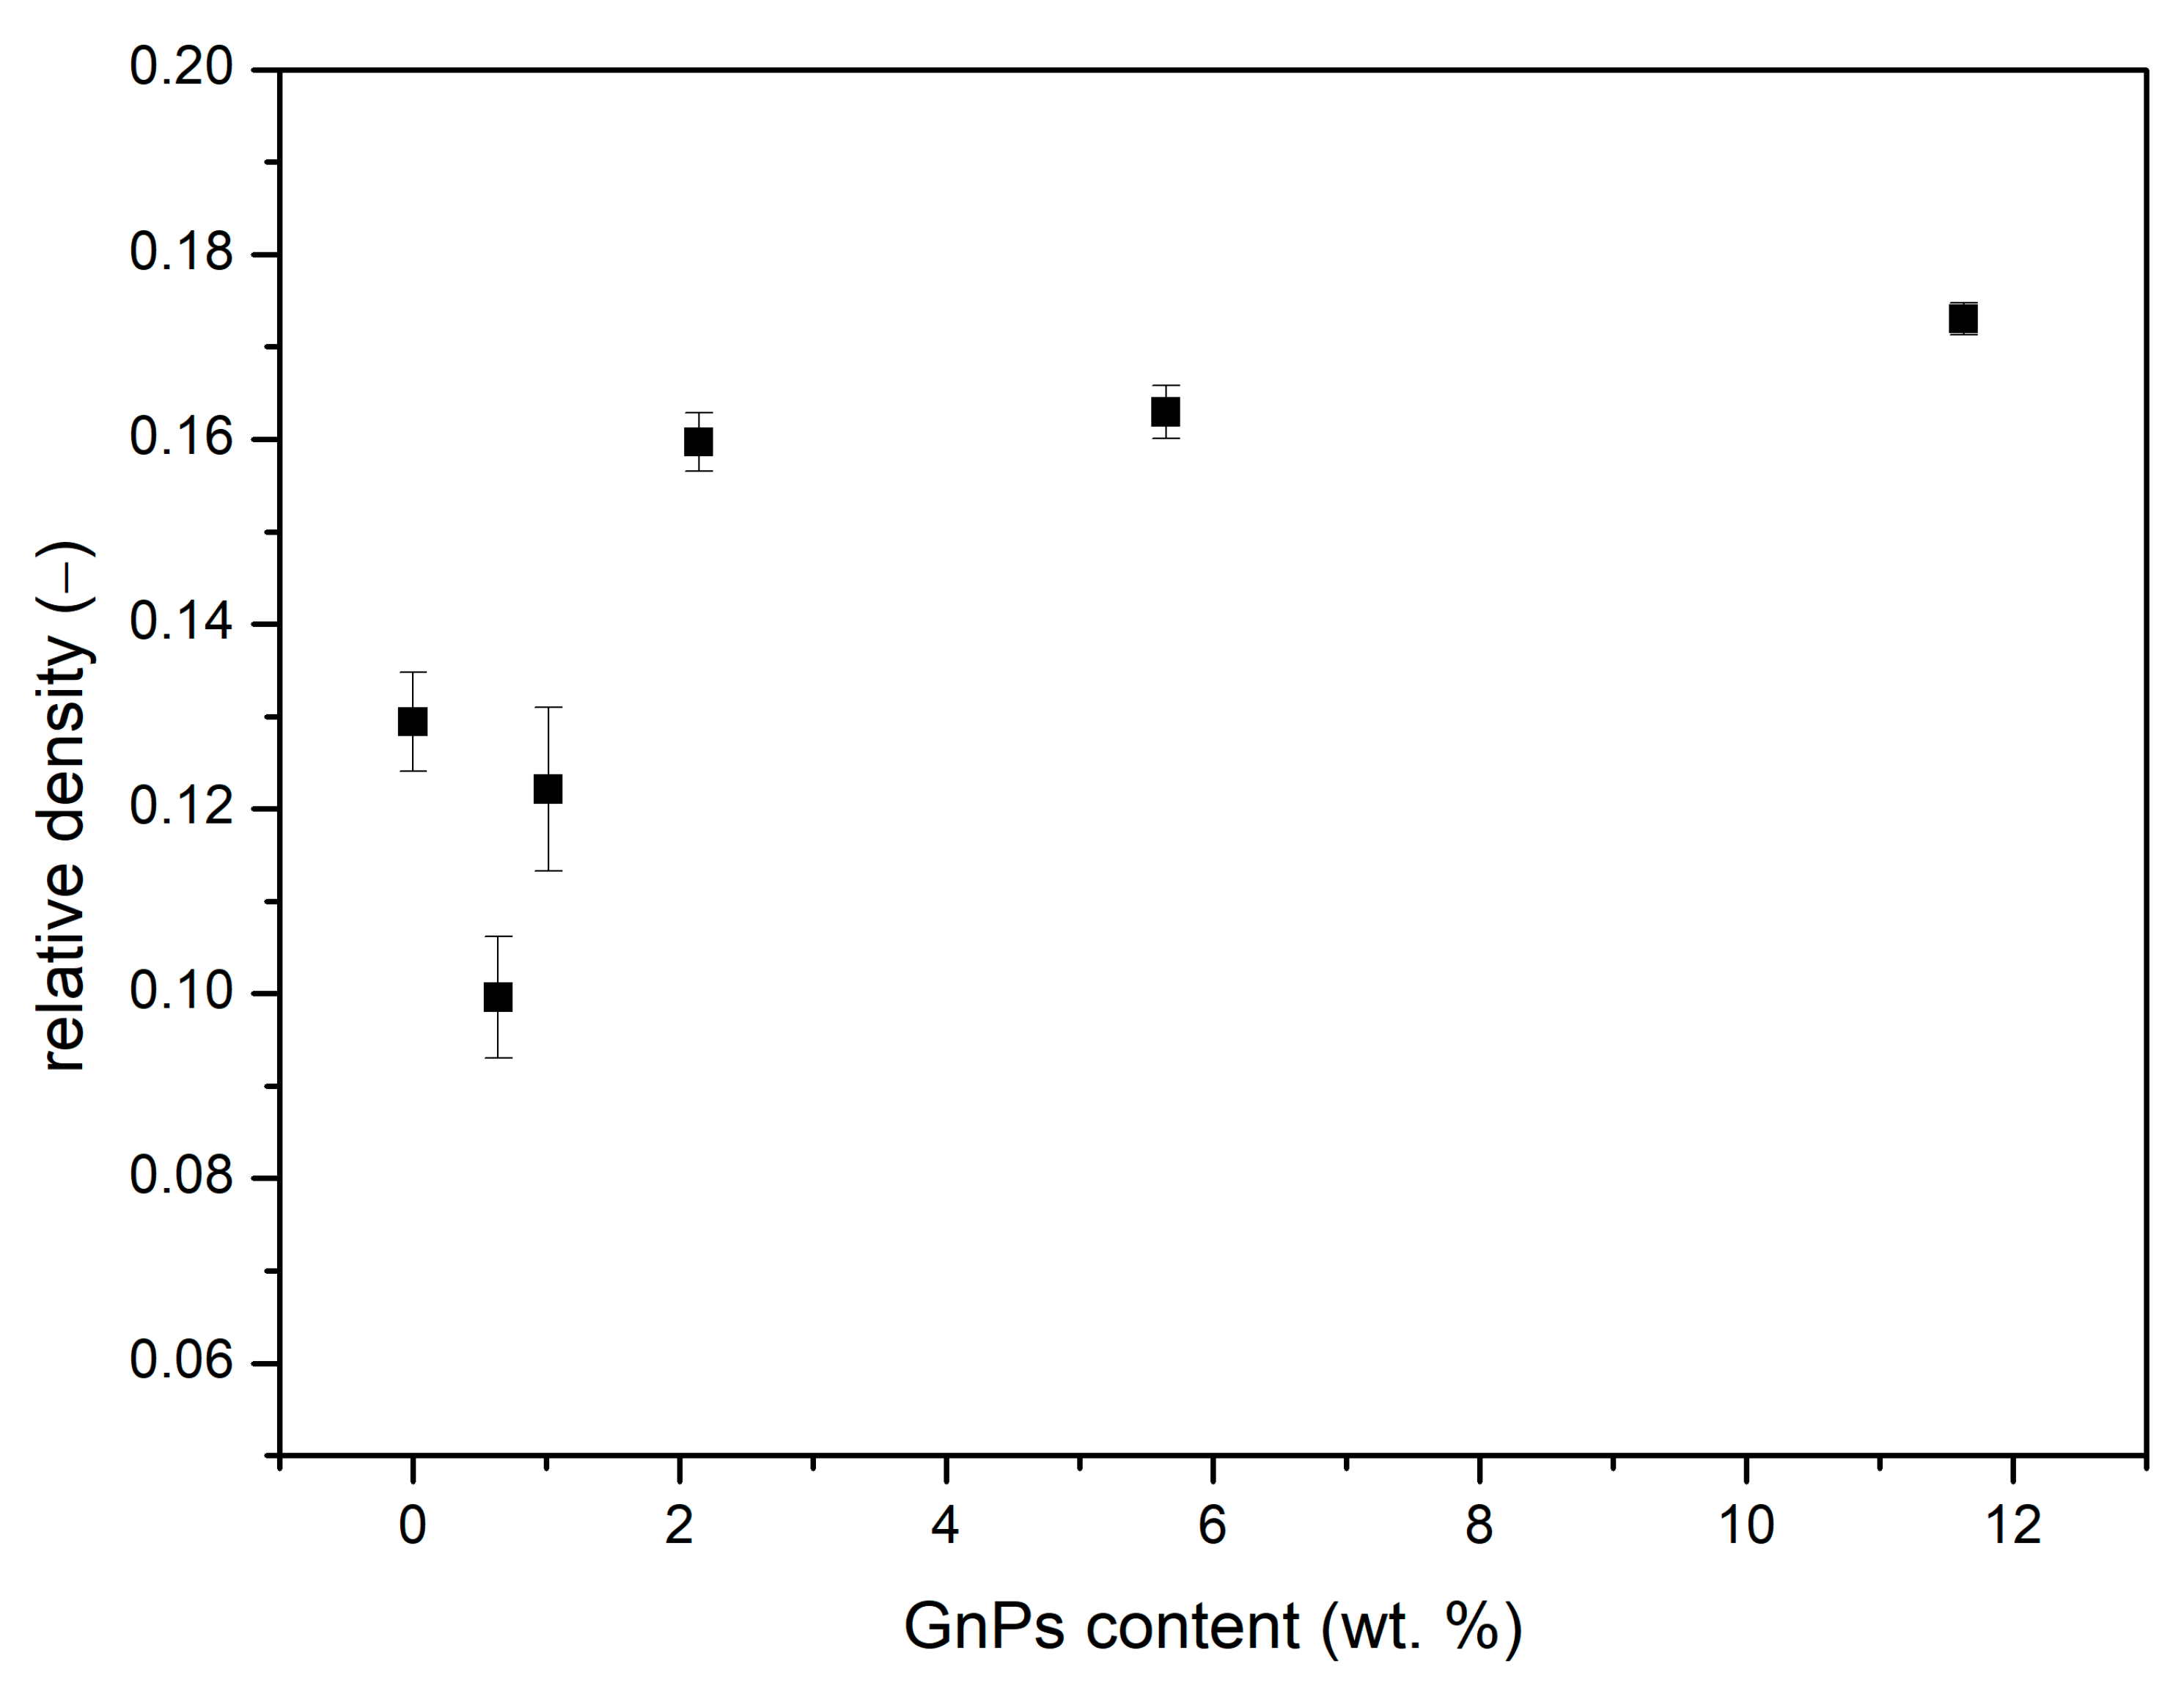
Relative Density
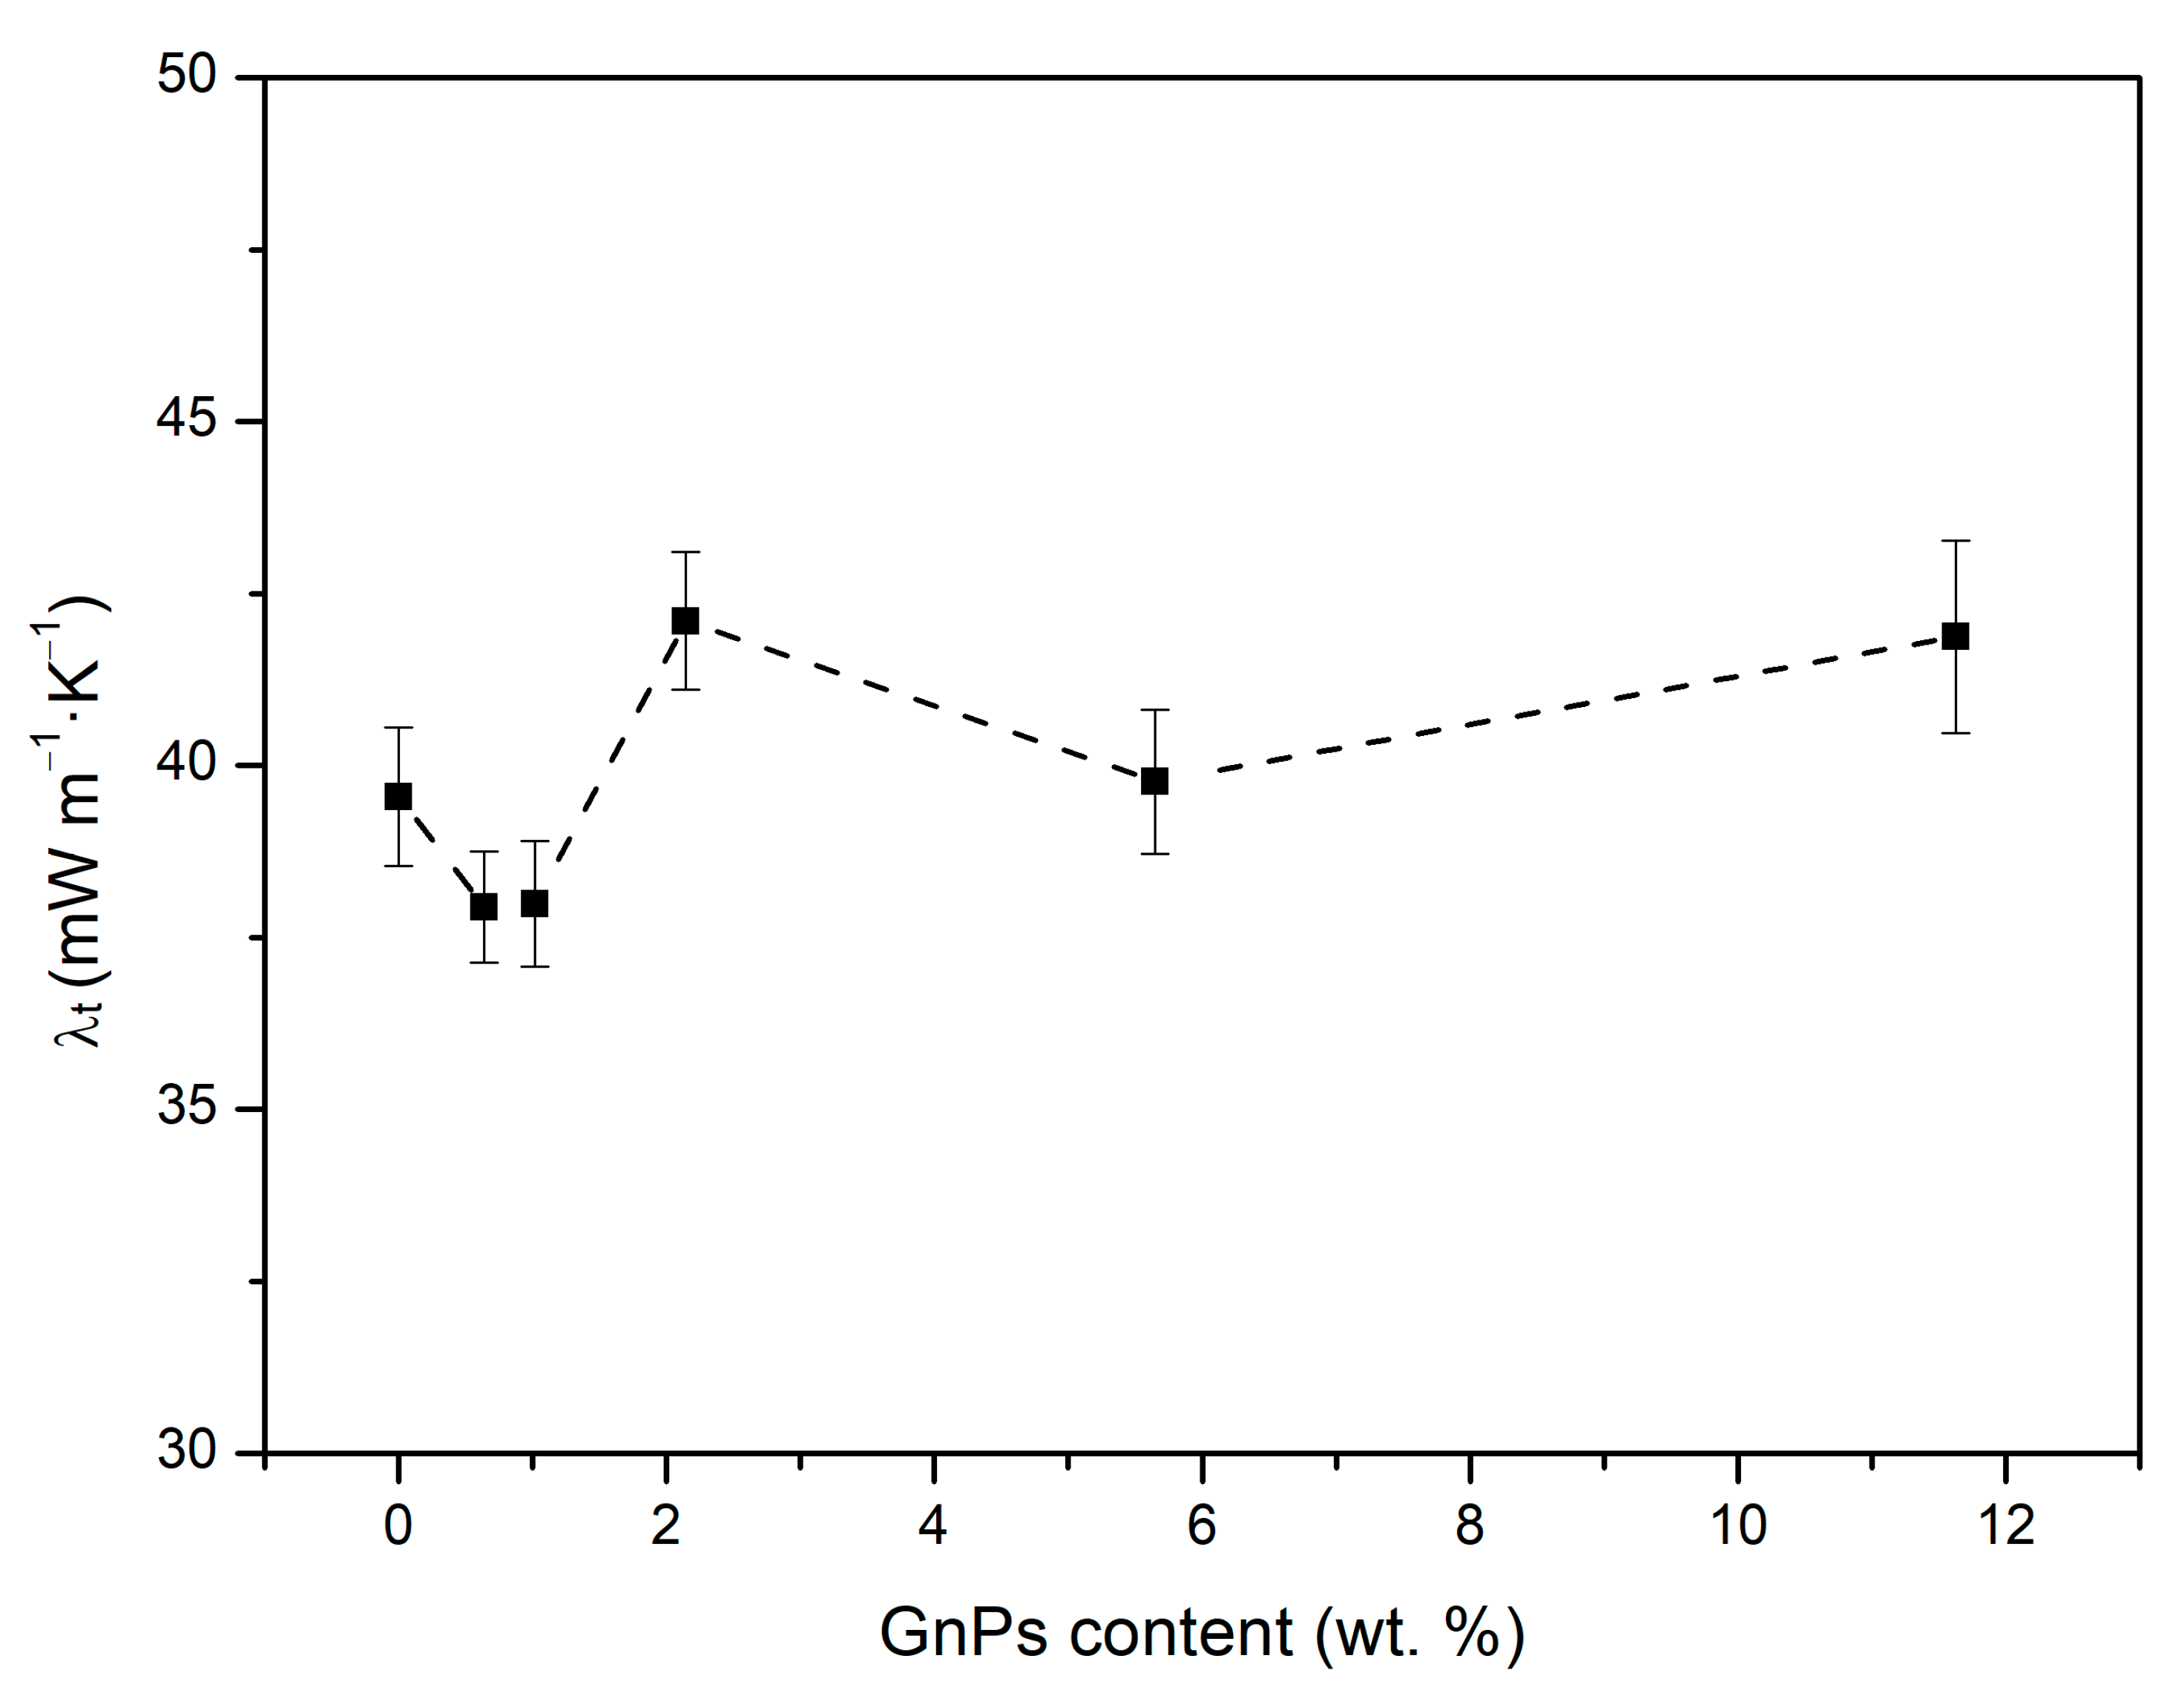
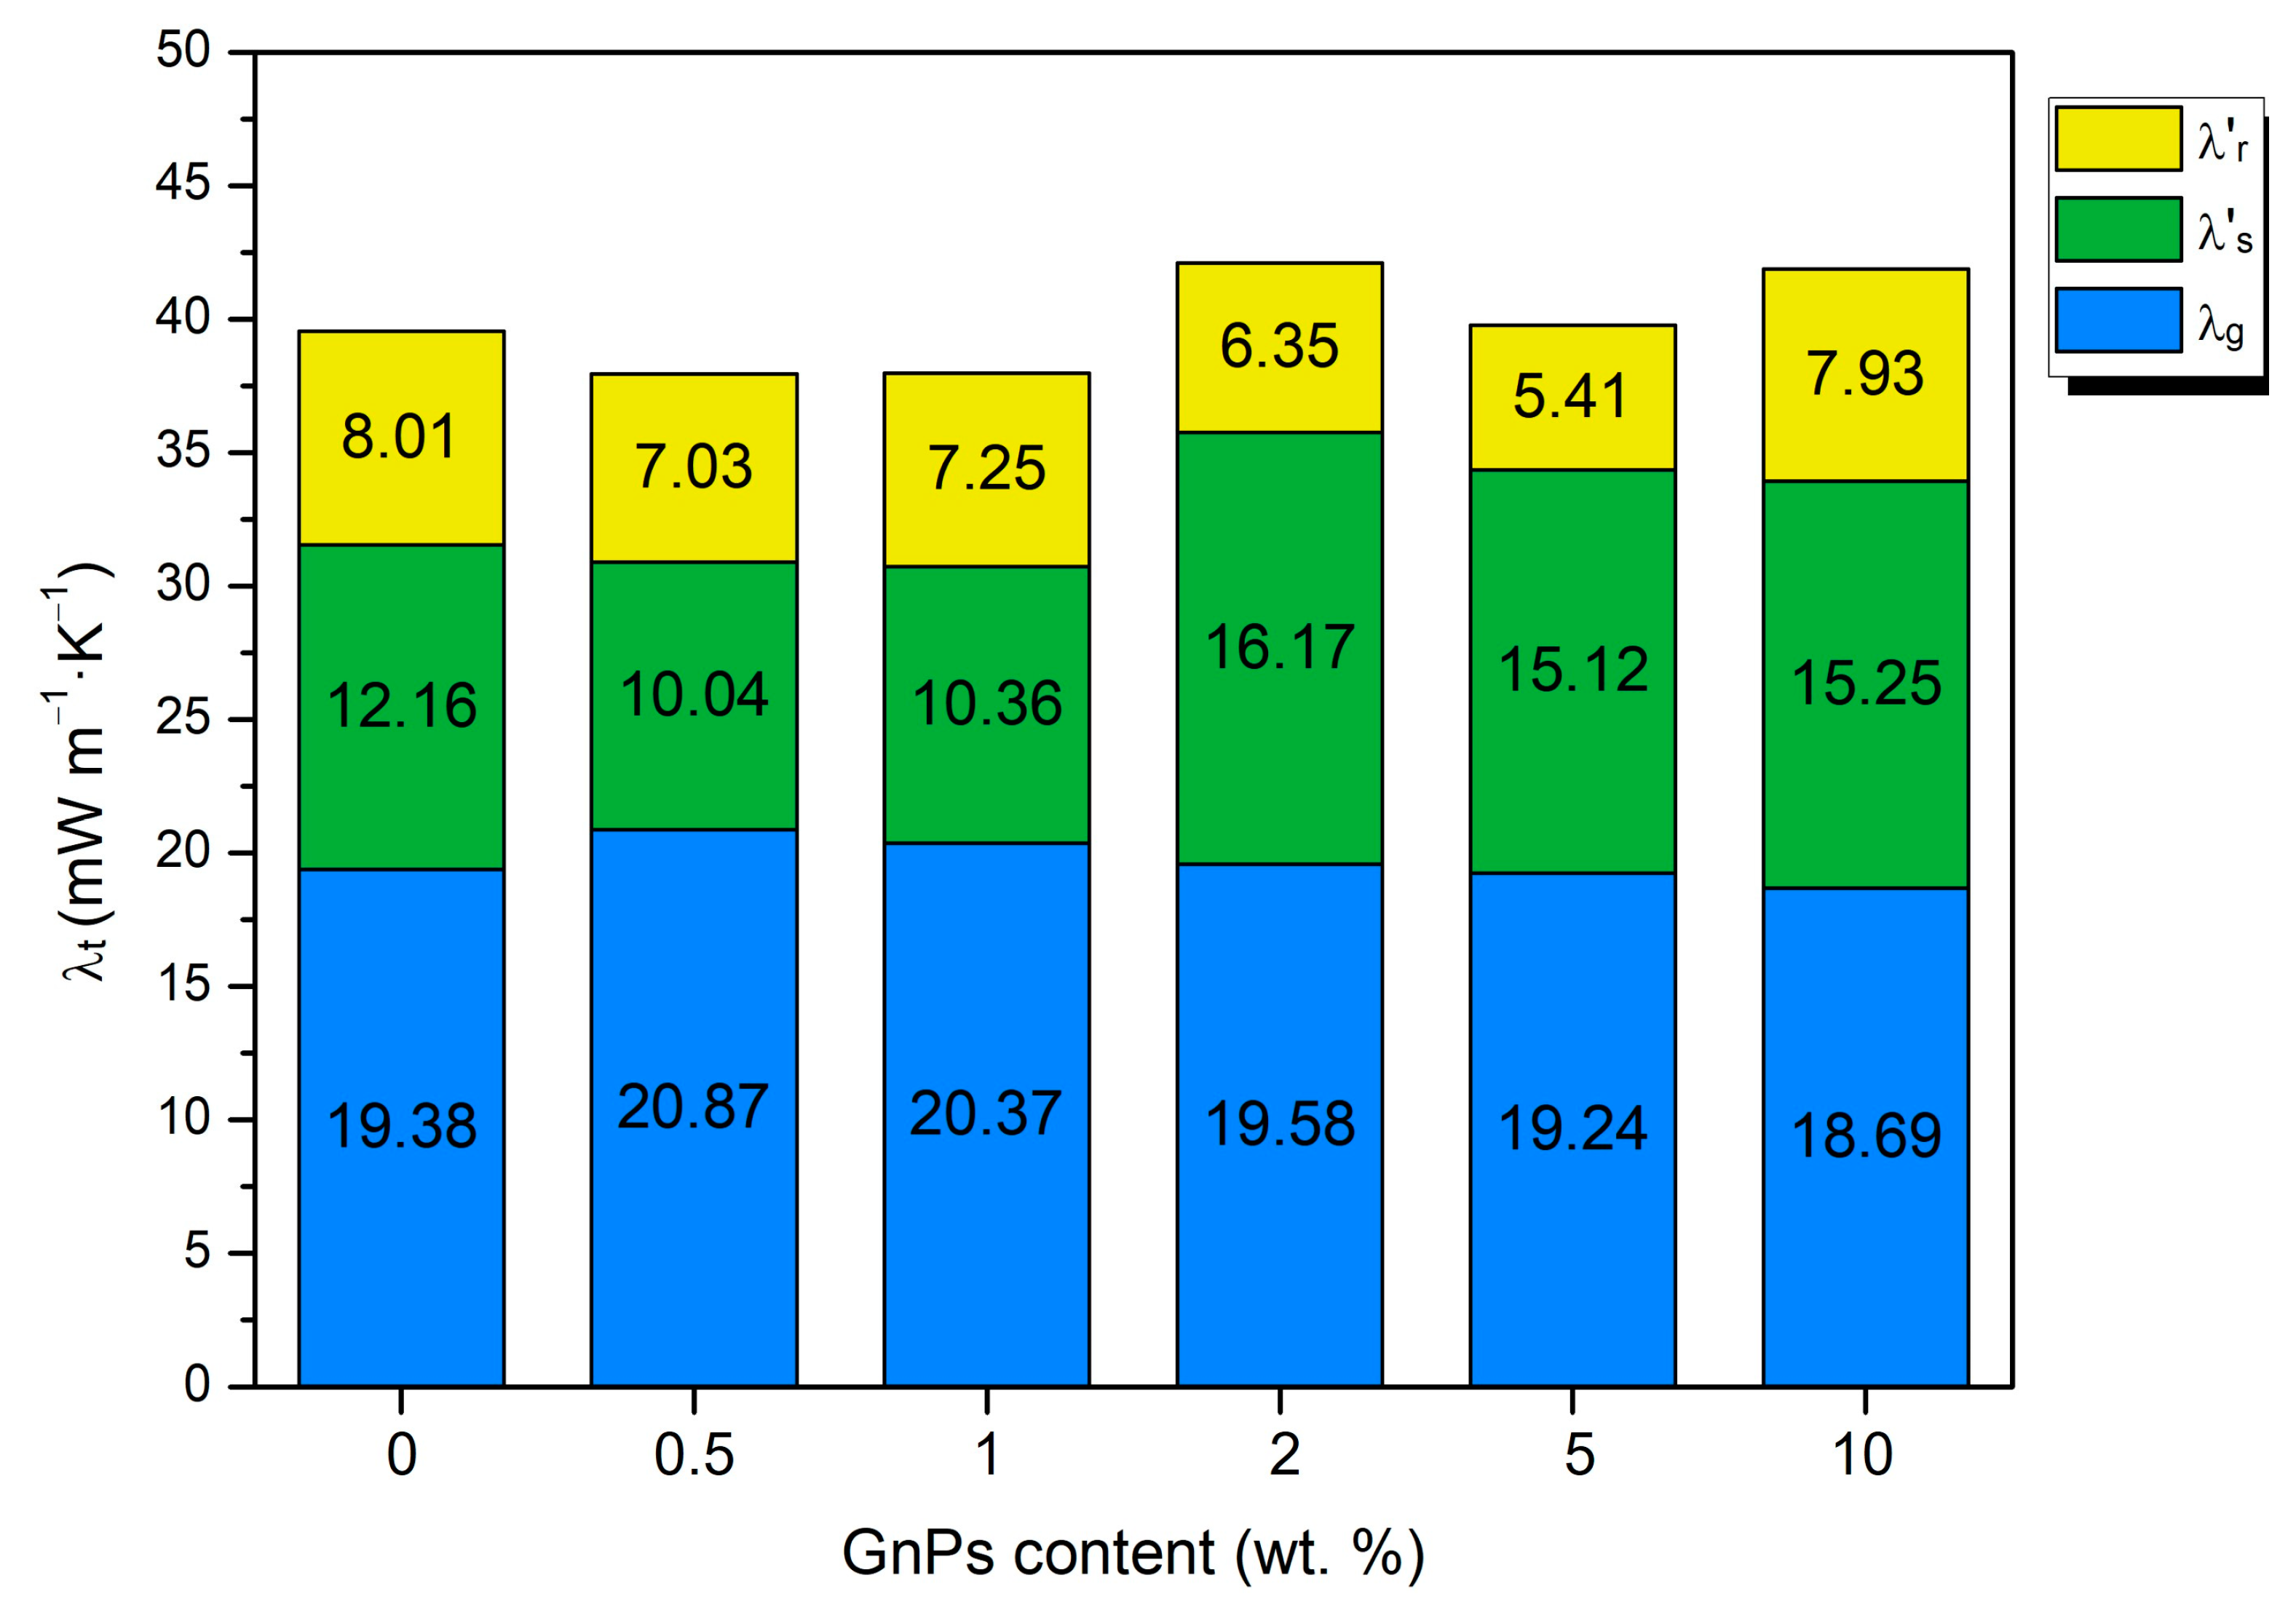
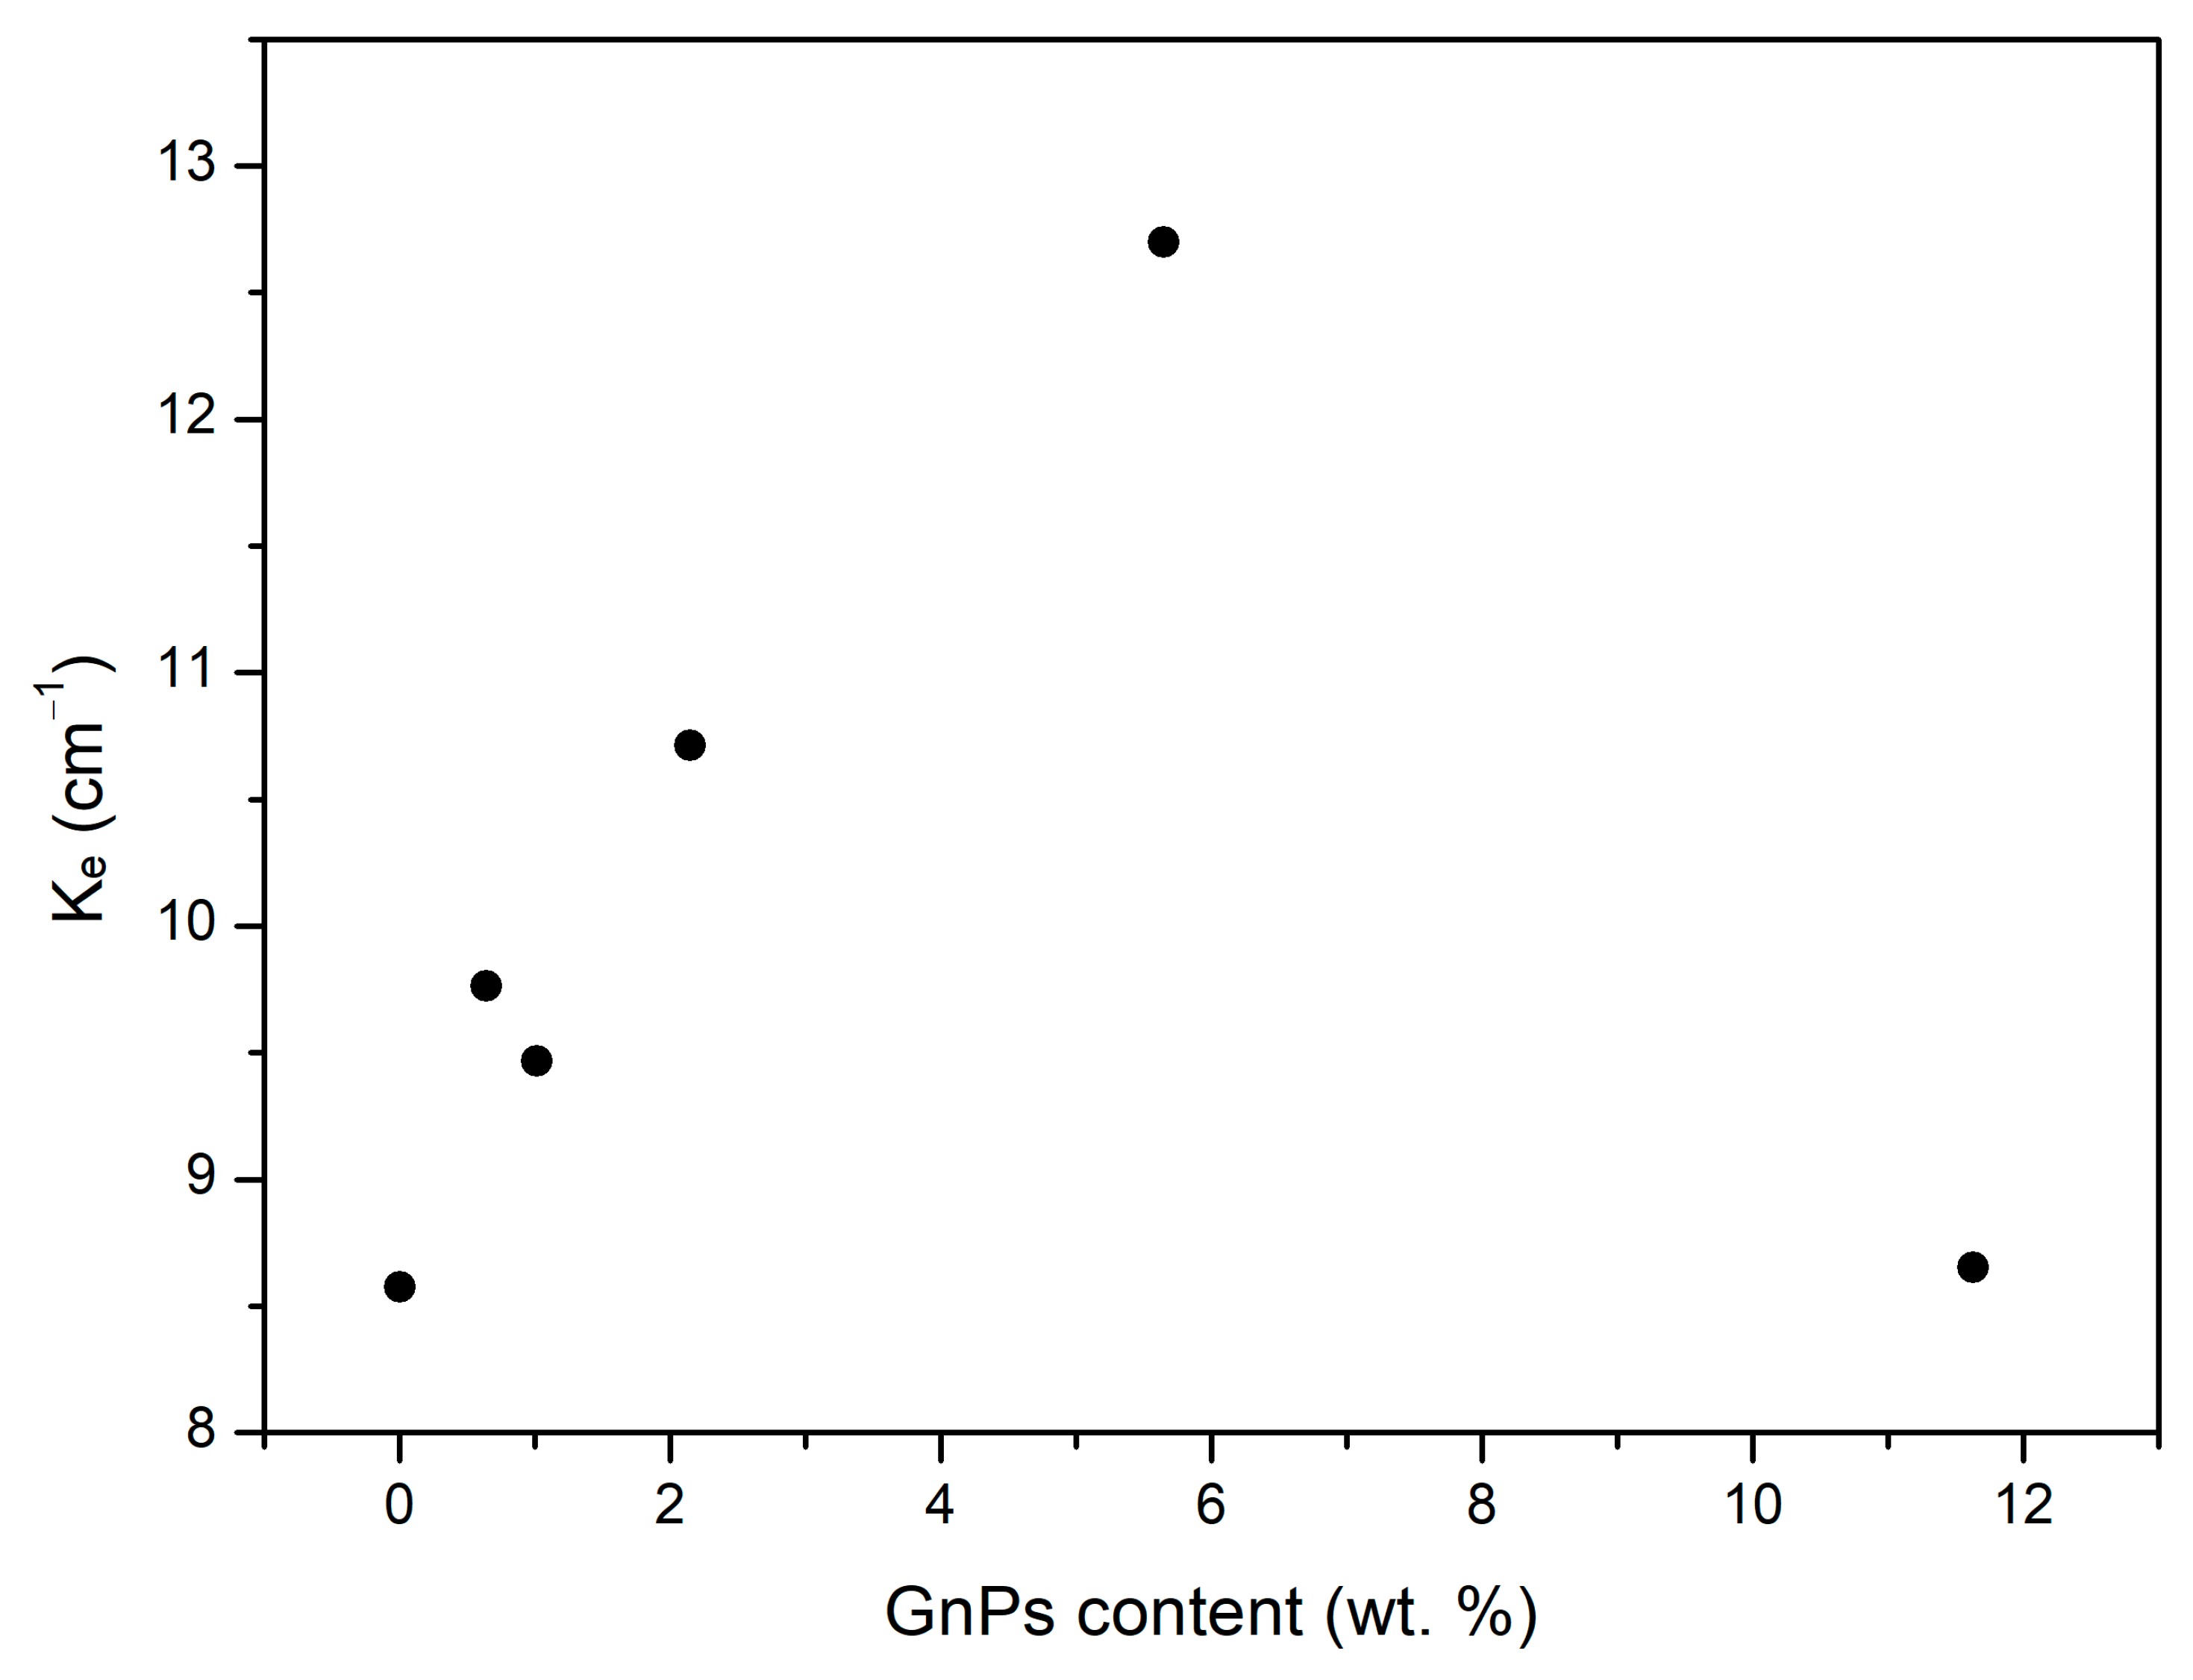
3.3. Influence of GnP Addition in the Thermal Conductivity
4. Conclusions
Supplementary Materials
Author Contributions
Funding
Institutional Review Board Statement
Data Availability Statement
Acknowledgments
Conflicts of Interest
References
- Khitab, A.; Abdin, Z.U.; Ahmed, I.; Karim, T. Thermal insulation of buildings through classical materials and nanomaterials. In Recent Advances in Nano-Tailored Multi-Functional Cementitious Composites; Elsevier: Amsterdam, The Netherlands, 2022; pp. 277–303. [Google Scholar] [CrossRef]
- Jelle, B.P. Nano-based thermal insulation for energy-efficient buildings. In Start-Up Creation; Elsevier: Amsterdam, The Netherlands, 2016; pp. 129–181. [Google Scholar] [CrossRef]
- Lundgren, L.; Moberg, C.; Lidén, C.; Lidén, L. Do insulation products of man-made vitreous fibres still cause skin discomfort? Contact Dermat. 2014, 70, 351–360. [Google Scholar] [CrossRef] [PubMed]
- Wernery, J.; Mancebo, F.; Malfait, W.J.; O’Connor, M.; Jelle, B.P. The economics of thermal superinsulation in buildings. Energy Build 2021, 253, 111506. [Google Scholar] [CrossRef]
- Nadella, K.; Kumar, V.; Li, W. Novel microcellular plastics for lightweight and energy efficient building applications. In Advances in Building Technology; Elsevier: Amsterdam, The Netherlands, 2002; pp. 121–128. [Google Scholar] [CrossRef]
- Weiser, E.S.; Johnson, T.F.; Clair, T.L.S.; Echigo, Y.; Kaneshiro, H.; Grimsley, B.W. Polyimide Foams for Aerospace Vehicles. High Perform. Polym. 2000, 12, 1–12. [Google Scholar] [CrossRef]
- Araque, L.M.; Alvarez, V.A.; Gutiérrez, T.J. Composite Foams Made from Biodegradable Polymers for Food Packaging Applications. In Polymers for Food Applications; Springer International Publishing: Cham, Switzerland, 2018; pp. 347–355. [Google Scholar] [CrossRef]
- Costanza, G.; Solaiyappan, D.; Tata, M.E. Properties, Applications and Recent Developments of Cellular Solid Materials: A Review. Materials 2023, 16, 7076. [Google Scholar] [CrossRef]
- Villasmil, W.; Fischer, L.J.; Worlitschek, J. A review and evaluation of thermal insulation materials and methods for thermal energy storage systems. Renew. Sustain. Energy Rev. 2019, 103, 71–84. [Google Scholar] [CrossRef]
- Jeon, B.; Kim, H.K.; Cha, S.W.; Lee, S.J.; Han, M.-S.; Lee, K.S. Microcellular foam processing of biodegradable polymers—Review. Int. J. Precis. Eng. Manuf. 2013, 14, 679–690. [Google Scholar] [CrossRef]
- Kanagamadhuran, H.D.; Sneha, J.; Gnanavel, G.; Prabhu, N. Review on Manufacturing of Cellular Polymers and Its Applications. IOSR J. Polym. Text. Eng. 2019, 6, 9–22. [Google Scholar] [CrossRef]
- Sorrentino, L.; Aurilia, M.; Iannace, S. Polymeric foams from high-performance thermoplastics. Advances in Polymer Technology 2011, 30, 234–243. [Google Scholar] [CrossRef]
- Yang, C.; Zhang, Q.; Zhang, W.; Xia, M.; Yan, K.; Lu, J.; Wu, G. High thermal insulation and compressive strength polypropylene microcellular foams with honeycomb structure. Polym. Degrad. Stab. 2021, 183, 109406. [Google Scholar] [CrossRef]
- Atalla, Y.; Fu, J.; Atalla, N.; Naguib, H.E. Study of the effects of processing parameters on the sound absorption of open-cell microcellular polymeric foams. Noise Control Eng. J. 2010, 58, 18–26. [Google Scholar] [CrossRef]
- Zhou, D.; Xiong, Y.; Yuan, H.; Shen, Q.; Luo, G.; Guo, W. Enhanced sound insulation properties of microporous PMMA foams by constructing novel multilayered and directional cell structure (MDCS). J. Appl. Polym. Sci. 2020, 137, 49020. [Google Scholar] [CrossRef]
- Dugad, R.; Radhakrishna, G.; Gandhi, A. Recent advancements in manufacturing technologies of microcellular polymers: A review. J. Polym. Res. 2020, 27, 182. [Google Scholar] [CrossRef]
- Okolieocha, C.; Raps, D.; Subramaniam, K.; Altstädt, V. Microcellular to nanocellular polymer foams: Progress (2004–2015) and future directions—A review. Eur. Polym. J. 2015, 73, 500–519. [Google Scholar] [CrossRef]
- Kumar, V. Microcellular Polymers: Novel Materials for the 21st Century. Cell. Polym. 1993, 12, 207–223. [Google Scholar] [CrossRef]
- Banerjee, R.; Ray, S.S. Foamability and Special Applications of Microcellular Thermoplastic Polymers: A Review on Recent Advances and Future Direction. Macromol. Mater. Eng. 2020, 305, 2000366. [Google Scholar] [CrossRef]
- Pang, Y.; Cao, Y.; Zheng, W.; Park, C.B. A comprehensive review of cell structure variation and general rules for polymer microcellular foams. Chem. Eng. J. 2022, 430, 132662. [Google Scholar] [CrossRef]
- Merillas, B.; Vareda, J.P.; León, J.M.-D.; Rodríguez-Pérez, M.Á.; Durães, L. Thermal Conductivity of Nanoporous Materials: Where Is the Limit? Polymers 2022, 14, 2556. [Google Scholar] [CrossRef]
- Gibson, L.J.; Ashby, M.F. Cellular Solids: Structure and Properties. In Cellular Solids: Structure and Properties, 2nd ed.; Cambridge University Press: Cambridge, UK, 1997; pp. 1–510. [Google Scholar] [CrossRef]
- Collishaw, P.G.; Evans, J.R.G. An assessment of expressions for the apparent thermal conductivity of cellular materials. J. Mater. Sci. 1994, 29, 2261–2273. [Google Scholar] [CrossRef]
- Glicksman, L.R. Heat transfer in foams. In Low Density Cellular Plastics; Springer: Dordrecht, The Netherlands, 1994; pp. 104–152. [Google Scholar] [CrossRef]
- Fricke, J. Thermal Transport in Porous Superinsulations; Springer: Berlin/Heidelberg, Germany, 1986; pp. 94–103. [Google Scholar] [CrossRef]
- Howell, J.R.; Mengüç, M.P.; Daun, K.; Siegel, R. Thermal Radiation Heat Transfer, 7th ed.; CRC Press: Boca Raton, FL, USA, 2020. [Google Scholar] [CrossRef]
- León, J.M.-D.; Sillero, A.; Rodríguez-Pérez, M.A. Using infrared opacifiers to reduce the thermal conductivity of micro and nanocellular polymethylmethacrylate. Polymer 2024, 290, 126523. [Google Scholar] [CrossRef]
- Sánchez-Calderón, I.; Bernardo, V.; Martín-de-León, J.; Rodríguez-Pérez, M.Á. Thermal conductivity of low-density micro-and nanocellular poly(methyl-methacrylate) (PMMA): Experimental and modeling. Mater. Des. 2022, 221, 110938. [Google Scholar] [CrossRef]
- Pérez, M.A.R.; de León, J.M.; García, V.B. Nanocellular Polymers: From Microscale to Nanoscale; De Gruyter: Berlin, Germany, 2023. [Google Scholar] [CrossRef]
- Mu, D.; Liu, Z.-S.; Huang, C.; Djilali, N. Determination of the effective diffusion coefficient in porous media including Knudsen effects. Microfluid. Nanofluidics 2008, 4, 257–260. [Google Scholar] [CrossRef]
- Wang, G.; Wang, C.; Zhao, J.; Wang, G.; Park, C.B.; Zhao, G. Modelling of thermal transport through a nanocellular polymer foam: Toward the generation of a new superinsulating material. Nanoscale 2017, 9, 5996–6009. [Google Scholar] [CrossRef] [PubMed]
- Placido, E.; Arduini-Schuster, M.C.; Kuhn, J. Thermal properties predictive model for insulating foams. Infrared. Phys. Technol. 2005, 46, 219–231. [Google Scholar] [CrossRef]
- Bernardo, V.; Leon, J.M.-D.; Pinto, J.; Verdejo, R.; Rodriguez-Perez, M.A. Modeling the heat transfer by conduction of nanocellular polymers with bimodal cellular structures. Polymer 2019, 160, 126–137. [Google Scholar] [CrossRef]
- Glicksman, L.; Schuetz, M.; Sinofsky, M. Radiation heat transfer in foam insulation. Int. J. Heat Mass Transf. 1987, 30, 187–197. [Google Scholar] [CrossRef]
- Ghosh, S.; Dutta, S.; Gomes, E.; Carroll, D.; D’Agostino, R., Jr.; Olson, J.; Guthold, M.; Gmeiner, W.H. Increased Heating Efficiency and Selective Thermal Ablation of Malignant Tissue with DNA-Encased Multiwalled Carbon Nanotubes. ACS Nano 2009, 3, 2667–2673. [Google Scholar] [CrossRef]
- Gong, P.; Buahom, P.; Tran, M.-P.; Saniei, M.; Park, C.B.; Pötschke, P. Heat transfer in microcellular polystyrene/multi-walled carbon nanotube nanocomposite foams. Carbon 2015, 93, 819–829. [Google Scholar] [CrossRef]
- Moens, E.K.; De Smit, K.; Marien, Y.W.; Trigilio, A.D.; Van Steenberge, P.H.; Van Geem, K.M.; Dubois, J.L.; D’hooge, D.R. Progress in Reaction Mechanisms and Reactor Technologies for Thermochemical Recycling of Poly(methyl methacrylate). Polymers 2020, 12, 1667. [Google Scholar] [CrossRef] [PubMed]
- Schindelin, J.; Arganda-Carreras, I.; Frise, E.; Kaynig, V.; Longair, M.; Pietzsch, T.; Preibisch, S.; Rueden, C.; Saalfeld, S.; Schmid, B.; et al. Fiji: An open-source platform for biological-image analysis. Nat. Methods 2012, 9, 676–682. [Google Scholar] [CrossRef]
- Pinto, J.; Solórzano, E.; Rodriguez-Perez, M.A.; de Saja, J.A. Characterization of the cellular structure based on user-interactive image analysis procedures. J. Cell. Plast. 2013, 49, 555–575. [Google Scholar] [CrossRef]
- Kumar, V.; Suh, N.P. A process for making microcellular thermoplastic parts. Polym. Eng. Sci. 1990, 30, 1323–1329. [Google Scholar] [CrossRef]
- ASTM C518; Standard Test Method for Steady-State Thermal Transmission Properties by Means of the Heat Flow Meter Apparatus. ASTM International: West Conshohocken, PA, USA, 2017.
- ISO 8301; Thermal Insulation—Determination of Steady-State Thermal Resistance and Related Properties—Heat Flow Meter. International Organization for Standardization: Geneva, Switzerland, 1991.
- Sánchez-Calderón, I.; Merillas, B.; Bernardo, V.; Rodríguez-Pérez, M.Á. Methodology for measuring the thermal conductivity of insulating samples with small dimensions by heat flow meter technique. J. Therm. Anal. Calorim. 2022, 147, 12523–12533. [Google Scholar] [CrossRef]


| Sample | Filler Content (wt. %) | Tg (°C) | ρs (g/cm3) |
|---|---|---|---|
| Pure | 0 | 105.73 | 1.18 |
| 0.5% | 0.64 | 107.55 | 1.19 |
| 1% | 1.02 | 108.55 | 1.19 |
| 2% | 2.14 | 108.88 | 1.20 |
| 5% | 5.65 | 110.10 | 1.20 |
| 10% | 11.63 | 109.89 | 1.18 |
Disclaimer/Publisher’s Note: The statements, opinions and data contained in all publications are solely those of the individual author(s) and contributor(s) and not of MDPI and/or the editor(s). MDPI and/or the editor(s) disclaim responsibility for any injury to people or property resulting from any ideas, methods, instructions or products referred to in the content. |
© 2025 by the authors. Licensee MDPI, Basel, Switzerland. This article is an open access article distributed under the terms and conditions of the Creative Commons Attribution (CC BY) license (https://creativecommons.org/licenses/by/4.0/).
Share and Cite
Largo-Barrientos, A.; Merillas, B.; Sánchez-Calderón, I.; Rodríguez-Pérez, M.A.; Martín-de León, J. Reducing Infrared Radiation and Solid Thermal Conductivity by Incorporating Varying Amounts of GnP into Microcellular PMMA. Polymers 2025, 17, 471. https://doi.org/10.3390/polym17040471
Largo-Barrientos A, Merillas B, Sánchez-Calderón I, Rodríguez-Pérez MA, Martín-de León J. Reducing Infrared Radiation and Solid Thermal Conductivity by Incorporating Varying Amounts of GnP into Microcellular PMMA. Polymers. 2025; 17(4):471. https://doi.org/10.3390/polym17040471
Chicago/Turabian StyleLargo-Barrientos, Antonio, Beatriz Merillas, Ismael Sánchez-Calderón, Miguel Angel Rodríguez-Pérez, and Judith Martín-de León. 2025. "Reducing Infrared Radiation and Solid Thermal Conductivity by Incorporating Varying Amounts of GnP into Microcellular PMMA" Polymers 17, no. 4: 471. https://doi.org/10.3390/polym17040471
APA StyleLargo-Barrientos, A., Merillas, B., Sánchez-Calderón, I., Rodríguez-Pérez, M. A., & Martín-de León, J. (2025). Reducing Infrared Radiation and Solid Thermal Conductivity by Incorporating Varying Amounts of GnP into Microcellular PMMA. Polymers, 17(4), 471. https://doi.org/10.3390/polym17040471