
Wet Chemical-Synthesized Low-Loss Dielectric Composite Material Based on CuCl-Cu7S4 Nanoparticles and PVDF Copolymer

 ,
,  ,
,  , , , and
Abstract
1. Introduction
2. Materials and Methods
2.1. Main Materials
2.2. Material Preparation
2.3. XRD Study of Composite Material
2.4. TEM Study of Composite Structure
2.5. Raman Spectroscopy
2.6. FTIR Spectroscopy
2.7. PVDF Phase Content Calculations
2.8. Differential Scanning Calorimetry
2.9. Scanning Probe Microscopy of Composite Surface
2.10. Dielectric Permittivity Measurements
2.11. Dielectrical Breakdown Measurement
2.12. Optical Microscopy
2.13. UV-Vis Spectroscopy and Haze Measurement
- Tdirect (λ)—transmittance coefficient, measured in the free space configuration;
- λ is a wavelength (nm).
3. Results and Discussion
3.1. Nanoparticle Characterization
3.1.1. XRD Research
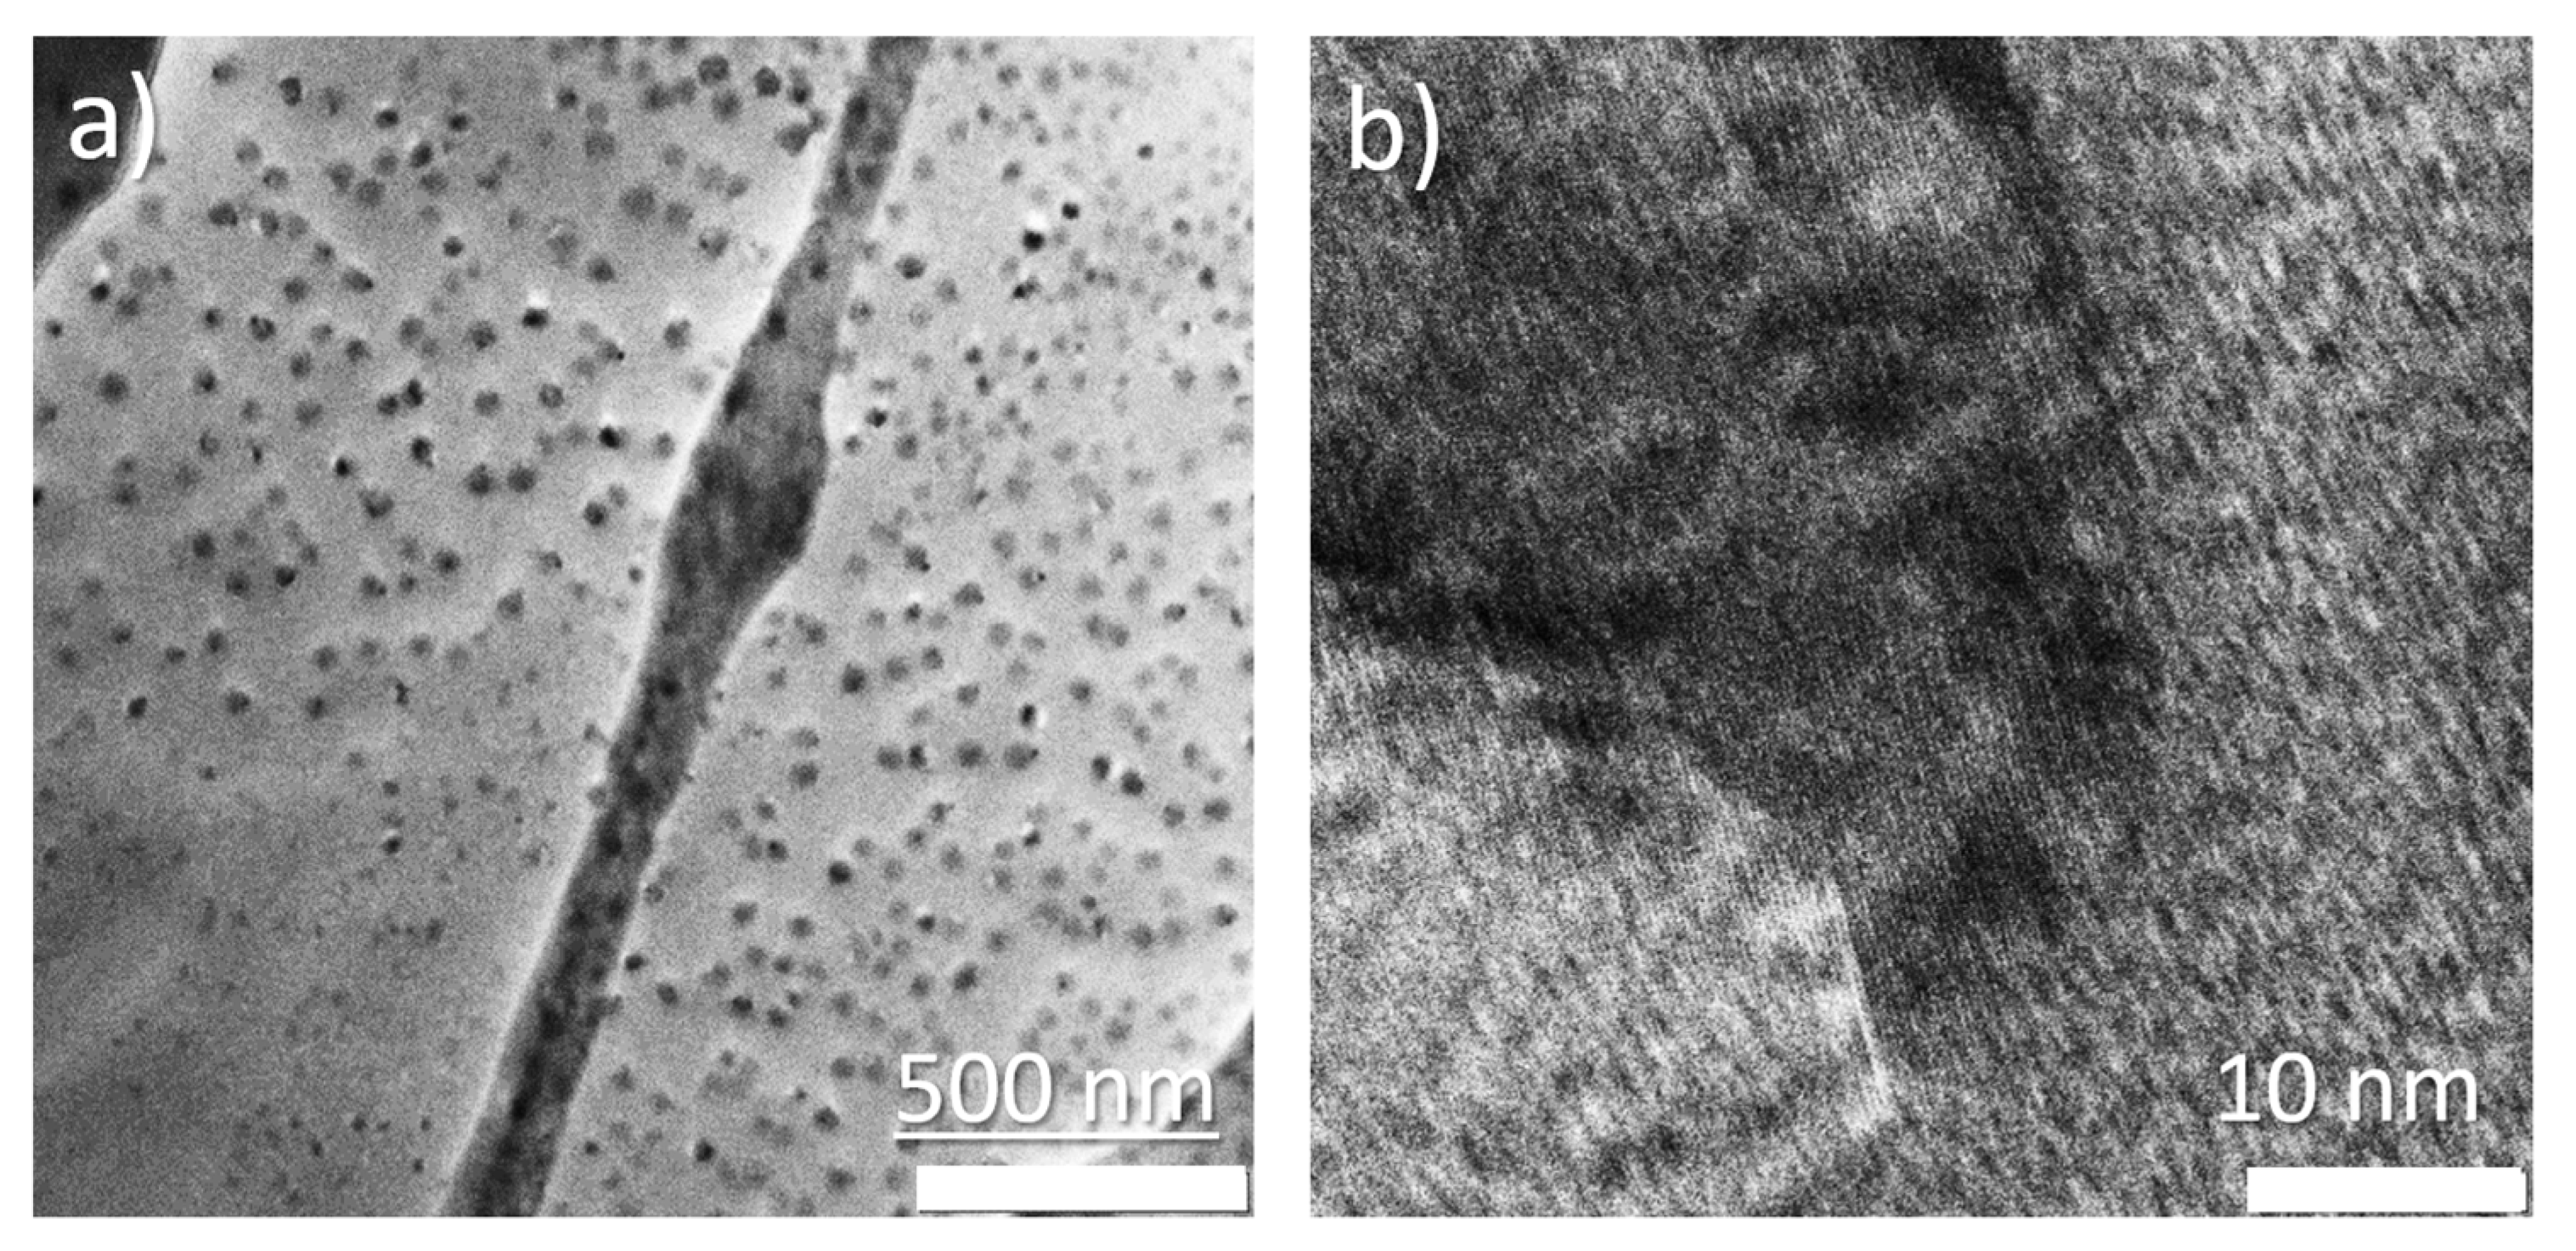
3.1.2. TEM Research
3.1.3. Chemical Composition
3.2. Composite Chemistry Characterization
3.2.1. Raman Spectroscopy
3.2.2. FTIR Characterization of VDF Copolymer Phases
3.2.3. DSC Analysis and Crystallinity Calculation
3.3. Composite Film Characterization
3.3.1. Scanning Probe Microscopy
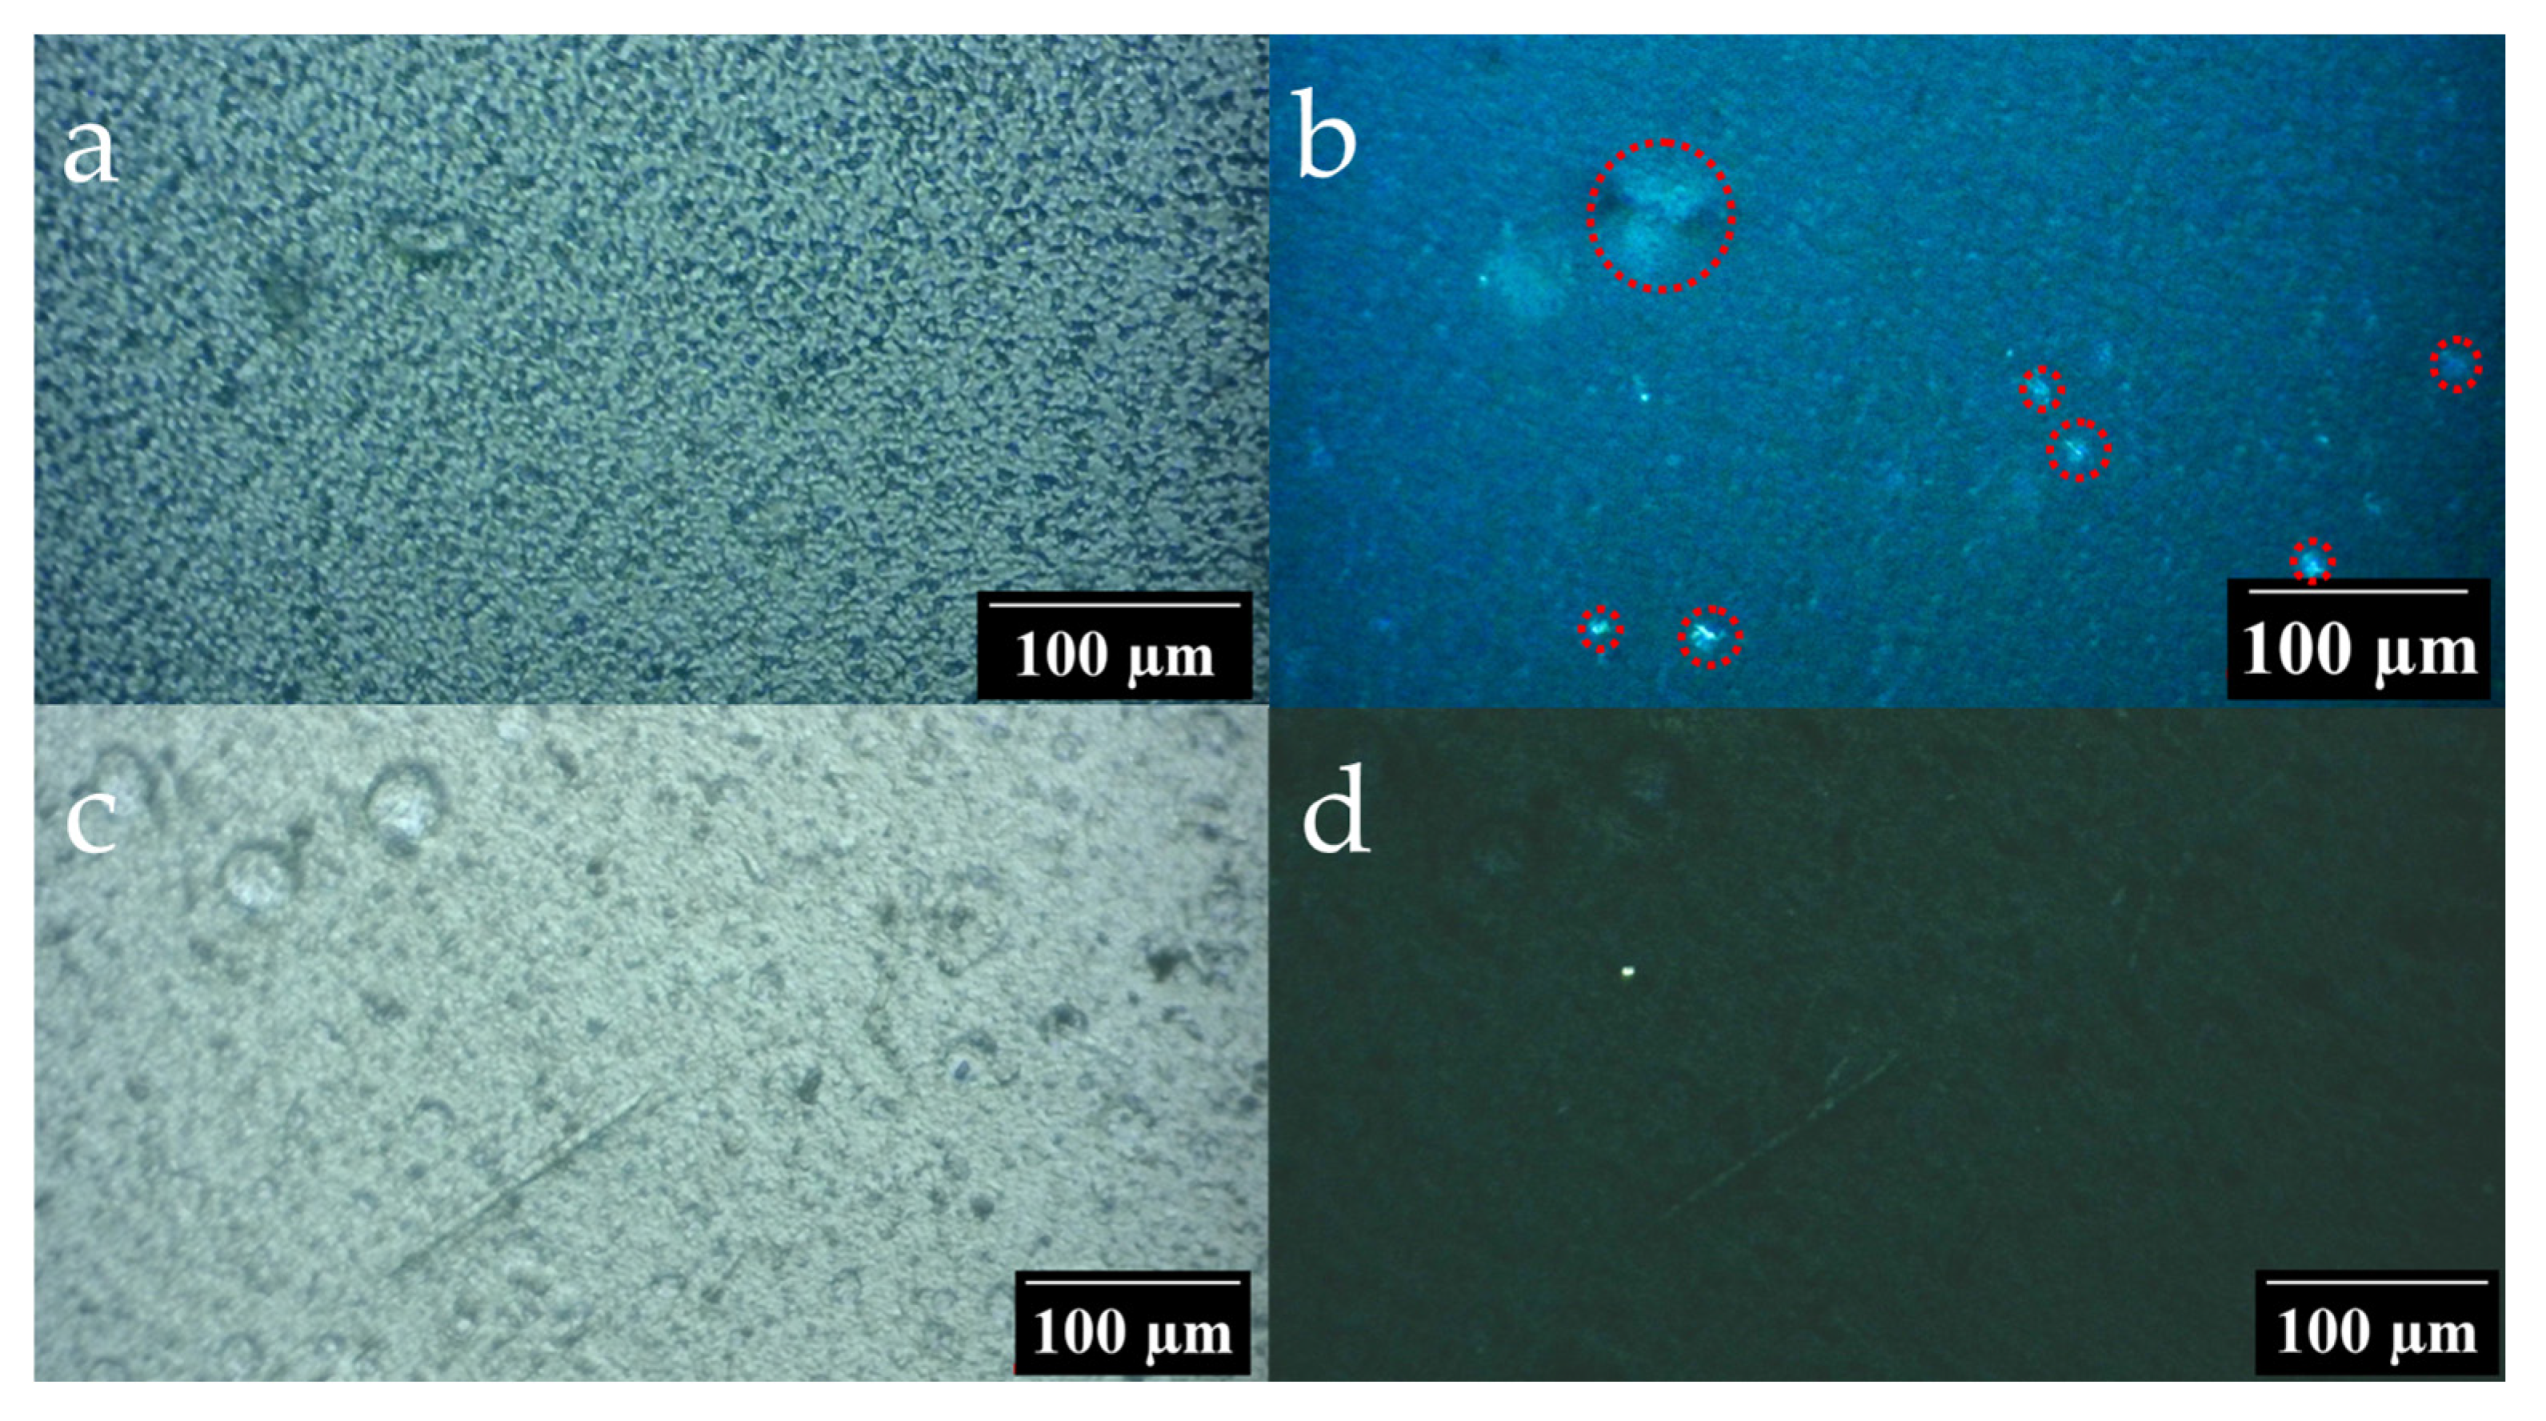
3.3.2. Polarization Microscopy
3.3.3. Optical Measurement
3.4. Composite Electrical Properties Characterization
3.4.1. Impedance Spectroscopy Measurement
3.4.2. Electric Breakdown Field Strength Measurement
4. Discussion
5. Conclusions
Author Contributions
Funding
Institutional Review Board Statement
Data Availability Statement
Acknowledgments
Conflicts of Interest
Abbreviations
| PVDF | Poly(vinylidene fluoride) |
| DMF | Dimethyl formamide |
| PVA/PVP | Mixture of two polymers: polyvinyl alcohol and polyvinylpyrrolidone |
| n/d | No data |
References
- Zha, J.-W.; Zheng, M.-S.; Fan, B.-H.; Dang, Z.-M. Polymer-Based Dielectrics with High Permittivity for Electric Energy Storage: A Review. Nano Energy 2021, 89, 106438. [Google Scholar] [CrossRef]
- Zhang, X.-J.; Wang, G.-S.; Wei, Y.-Z.; Guo, L.; Cao, M.-S. Polymer-Composite with High Dielectric Constant and Enhanced Absorption Properties Based on Graphene–CuS Nanocomposites and Polyvinylidene Fluoride. J. Mater. Chem. A 2013, 1, 12115. [Google Scholar] [CrossRef]
- He, S.; Wang, G.-S.; Lu, C.; Liu, J.; Wen, B.; Liu, H.; Guo, L.; Cao, M.-S. Enhanced Wave Absorption of Nanocomposites Based on the Synthesized Complex Symmetrical CuS Nanostructure and Poly(Vinylidene Fluoride). J. Mater. Chem. A 2013, 1, 4685. [Google Scholar] [CrossRef]
- Meng, X.-S.; Zhou, Y.; Li, J.; Ye, H.; Chen, F.; Zhao, Y.; Pan, Q.; Xu, J. All-Organic PTFE Coated PVDF Composite Film Exhibiting Low Conduction Loss and High Breakdown Strength for Energy Storage Applications. Polymers 2023, 15, 1305. [Google Scholar] [CrossRef]
- Kochervinskii, V.V.; Gradov, O.V.; Gradova, M.A. Fluorine-Containing Ferroelectric Polymers: Applications in Engineering and Biomedicine. Russ. Chem. Rev. 2022, 91, RCR5037. [Google Scholar] [CrossRef]
- Wu, L.; Jin, Z.; Liu, Y.; Ning, H.; Liu, X.; Alamusi; Hu, N. Recent Advances in the Preparation of PVDF-Based Piezoelectric Materials. Nanotechnol. Rev. 2022, 11, 1386–1407. [Google Scholar] [CrossRef]
- Chan, K.-Y.; Li, C.-L.; Wang, D.-M.; Lai, J.-Y. Formation of Porous Structures and Crystalline Phases in Poly(Vinylidene Fluoride) Membranes Prepared with Nonsolvent-Induced Phase Separation—Roles of Solvent Polarity. Polymers 2023, 15, 1314. [Google Scholar] [CrossRef]
- Chen, X.; Tougne, C.; Jiang, T.; Espindola-Rodriguez, M.; Zhao, Q.; Jia, Q.; Mendil-Jakani, H.; Jiang, J.; Zhang, W. Highly Oriented PVDF Molecular Chains for Enhanced Material Performance. Polymer 2022, 261, 125366. [Google Scholar] [CrossRef]
- Fakhri, P.; Mahmood, H.; Jaleh, B.; Pegoretti, A. Improved Electroactive Phase Content and Dielectric Properties of Flexible PVDF Nanocomposite Films Filled with Au- and Cu-Doped Graphene Oxide Hybrid Nanofiller. Synth. Met. 2016, 220, 653–660. [Google Scholar] [CrossRef]
- Ramazanov, M.A.; Hajiyeva, F.V.; Shirinova, H.A.; Mamedov, H.M. The Relation between the Composition, Structure and Absorption Properties of Ultra-High Frequency Radio Waves of Poly(Vinylidene Fluoride)/Magnetite Nanocomposites. Int. J. Mod. Phys. B 2019, 33, 1950083. [Google Scholar] [CrossRef]
- Wang, Y.; Xing, C.; Guan, J.; Li, Y. Towards Flexible Dielectric Materials with High Dielectric Constant and Low Loss: PVDF Nanocomposites with Both Homogenously Dispersed CNTs and Ionic Liquids Nanodomains. Polymers 2017, 9, 562. [Google Scholar] [CrossRef] [PubMed]
- Li, B.; Wang, F.; Wang, K.; Qiao, J.; Xu, D.; Yang, Y.; Zhang, X.; Lyu, L.; Liu, W.; Liu, J. Metal Sulfides Based Composites as Promising Efficient Microwave Absorption Materials: A Review. J. Mater. Sci. Technol. 2022, 104, 244–268. [Google Scholar] [CrossRef]
- Du, Y.-H.; Gao, N.; Li, M.-D.; Wang, L.; Wang, G.-S. Preparation and Microwave Absorption Properties of NixSy/PVDF Nanocomposites. Front. Mater. 2020, 7, 80. [Google Scholar] [CrossRef]
- Hajiyeva, F.V. New Hybrid Polymeric Nanocomposites Based on Polyvinylidene Fluoride+CdS/ZnS: Structure and Dielectric Properties. Surf. Eng. Appl. Electrochem. 2020, 56, 649–655. [Google Scholar] [CrossRef]
- Zhang, X.-J.; Li, S.; Wang, S.-W.; Yin, Z.-J.; Zhu, J.-Q.; Guo, A.-P.; Wang, G.-S.; Yin, P.-G.; Guo, L. Self-Supported Construction of Three-Dimensional MoS2 Hierarchical Nanospheres with Tunable High-Performance Microwave Absorption in Broadband. J. Phys. Chem. C 2016, 120, 22019–22027. [Google Scholar] [CrossRef]
- Fatemi, A.; Rasouli, M.; Ghoranneviss, M.; Dorranian, D.; Ostrikov, K. (Ken) Chemical Bath Synthesis of Ag2S, CuS, and CdS Nanoparticle-Polymer Nanocomposites: Structural, Linear, and Nonlinear Optical Characteristics. Opt. Mater. Express 2022, 12, 2697. [Google Scholar] [CrossRef]
- Zhang, C.; Wang, B.; Xiang, J.; Su, C.; Mu, C.; Wen, F.; Liu, Z. Microwave Absorption Properties of CoS2 Nanocrystals Embedded into Reduced Graphene Oxide. ACS Appl. Mater. Interfaces 2017, 9, 28868–28875. [Google Scholar] [CrossRef] [PubMed]
- Reddy, P.L.; Deshmukh, K.; Kovářík, T.; Reiger, D.; Nambiraj, N.A.; Lakshmipathy, R.; Khadheer Pasha, S.K. Enhanced Dielectric Properties of Green Synthesized Nickel Sulphide (NiS) Nanoparticles Integrated Polyvinylalcohol Nanocomposites. Mater. Res. Express 2020, 7, 064007. [Google Scholar] [CrossRef]
- Tang, Z.; Park, J.H.; Kim, S.H.; Kim, J.; Mun, J.; Kwak, S.K.; Kim, W.-S.; Yu, T. Synthesis of Cu7S4 Nanoparticles: Role of Halide Ions, Calculation, and Electrochemical Properties. J. Alloys Compd. 2018, 764, 333–340. [Google Scholar] [CrossRef]
- Roy, P.; Srivastava, S.K. Nanostructured Copper Sulfides: Synthesis, Properties and Applications. CrystEngComm 2015, 17, 7801–7815. [Google Scholar] [CrossRef]
- Sagade, A.A.; Sharma, R. Copper Sulphide (CuxS) as an Ammonia Gas Sensor Working at Room Temperature. Sens. Actuators B Chem. 2008, 133, 135–143. [Google Scholar] [CrossRef]
- Mureed, U.; Saddique, Z.; Asad, K. Synthesis of CuS Nanoparticles and Study of Its Photocatalytic Activity. Acta Chem. Malays. 2023, 7, 68–72. [Google Scholar]
- Maskaeva, L.N.; Glukhova, I.A.; Markov, V.F.; Tulenin, S.S.; Voronin, V.I. Nanostructured Copper(I) Sulfide Films: Synthesis, Composition, Morphology, and Structure. Russ. J. Appl. Chem. 2016, 89, 1939–1947. [Google Scholar] [CrossRef]
- Li, D.; Ma, J.; Zhou, L.; Li, Y.; Zou, C. Synthesis and Characterization of Cu2S Nanoparticles by Diethylenetriamine-Assisted Hydrothermal Method. Optik 2015, 126, 4971–4973. [Google Scholar] [CrossRef]
- Tang, Y.-Q.; Ge, Z.-H.; Feng, J. Synthesis and Thermoelectric Properties of Copper Sulfides via Solution Phase Methods and Spark Plasma Sintering. Crystals 2017, 7, 141. [Google Scholar] [CrossRef]
- Qin, P.; Qian, X.; Ge, Z.-H.; Zheng, L.; Feng, J.; Zhao, L.-D. Improvements of Thermoelectric Properties for P-Type Cu1.8S Bulk Materials via Optimizing the Mechanical Alloying Process. Inorg. Chem. Front. 2017, 4, 1192–1199. [Google Scholar] [CrossRef]
- Wang, C.; Xu, Z.; Liu, R. Fabrication and Optical Property of Cu7S4 Hollow Nanoparticles Formed Through Kirkendall Effect. Chem. Res. Chin. Univ. 2008, 24, 249–250. [Google Scholar] [CrossRef]
- Cao, X.; Lu, Q.; Xu, X.; Yan, J.; Zeng, H. Single-Crystal Snowflake of Cu7S4: Low Temperature, Large Scale Synthesis and Growth Mechanism. Mater. Lett. 2008, 62, 2567–2570. [Google Scholar] [CrossRef]
- Tang, Z.; Chen, M.; Tang, Y.; Du, J.; Xu, L. Application of Continuous Stirring Tank Reactor for Controllable Synthesis of Cu7S4 Nanocrystals. J. Cryst. Growth 2025, 649, 127967. [Google Scholar] [CrossRef]
- Muradov, M.B.; Abdinov, A.S.; Hajimamedov, R.H.; Eyivazova, G.M. Dielectric Properties of Nanocomposites on the Basis of Copper Sulfide Nanoparticles and a Polymer Matrix. Surf. Engin. Appl. Electrochem. 2009, 45, 167–170. [Google Scholar] [CrossRef]
- Devi, P.I.; Ramachandran, K. Dielectric Studies on Hybridised PVDF–ZnO Nanocomposites. J. Exp. Nanosci. 2011, 6, 281–293. [Google Scholar] [CrossRef]
- Tawansi, A.; Oraby, A.H.; Badr, S.I.; Abdelaziz, M. Effect of CuCl2 and CoCl2 Mixed Fillers on the Physical Properties of Polyvinylidene Fluoride Flms. J. Mater. Sci. Mater. Electron. 2003, 14, 135–141. [Google Scholar] [CrossRef]
- Bose, S.; Sinha, A.; Ghosh, S. In Situ Growth of Copper Channels within CuCl and PVDF Composite for Durable WORM Device Formation. ACS Appl. Electron. Mater. 2025, 7, 847–855. [Google Scholar] [CrossRef]
- Kochervinskii, V.V.; Buryanskaya, E.L.; Osipkov, A.S.; Ryzhenko, D.S.; Kiselev, D.A.; Lokshin, B.V.; Zvyagina, A.I.; Kirakosyan, G.A. The Domain and Structural Characteristics of Ferroelectric Copolymers Based on Vinylidene Fluoride Copolymer with Tetrafluoroethylene Composition (94/6). Polymers 2024, 16, 233. [Google Scholar] [CrossRef] [PubMed]
- McCusker, L.B.; Von Dreele, R.B.; Cox, D.E.; Louër, D.; Scardi, P. Rietveld Refinement Guidelines. J. Appl. Crystallogr. 1999, 32, 36–50. [Google Scholar] [CrossRef]
- FullProf Suite. Available online: https://www.ill.eu/sites/fullprof/index.html (accessed on 26 June 2025).
- Jo, J.; Tchoe, Y.; Yi, G.-C.; Kim, M. Real-Time Characterization Using in Situ RHEED Transmission Mode and TEM for Investigation of the Growth Behaviour of Nanomaterials. Sci. Rep. 2018, 8, 1694. [Google Scholar] [CrossRef]
- Cai, X.; Lei, T.; Sun, D.; Lin, L. A Critical Analysis of the α, β and γ Phases in Poly (Vinylidene Fluoride) Using FTIR. RSC Adv. 2017, 7, 15382–15389. [Google Scholar] [CrossRef]
- Andrey, V.; Koshevaya, E.; Mstislav, M.; Parfait, K. Piezoelectric PVDF and Its Copolymers in Biomedicine: Innovations and Applications. Biomater. Sci. 2024, 12, 5164–5185. [Google Scholar] [CrossRef]
- Fan, Z.; Schwedes, M.; Schwaderer, J.; Beuermann, S.; Fischlschweiger, M. Molecular Weight as a Key for Electroactive Phase Formation in Poly (Vinylidene Fluoride). Mater. Res. Lett. 2022, 10, 271–277. [Google Scholar] [CrossRef]
- ISO 13468-2:2021; Plastics—Determination of the Total Luminous Transmittance of Transparent Materials. International Organization for Standardization: Geneva, Switzerland, 2021.
- ISO 14782:2021; Plastics—Determination of Haze for Transparent Materials. International Organization for Standardization: Geneva, Switzerland, 2021.
- Anilite R060514. Available online: https://rruff.info/anilite/display=default/R060514 (accessed on 20 June 2025).
- Riosbaas, M.T.; Loh, K.J.; O’Bryan, G.; Loyola, B.R. In Situ Phase Change Characterization of PVDF Thin Films Using Raman Spectroscopy; Lynch, J.P., Wang, K.-W., Sohn, H., Eds.; Office of Scientific and Technical Information: San Diego, CA, USA, 2014; p. 90610Z.
- Chapron, D.; Rault, F.; Talbourdet, A.; Lemort, G.; Cochrane, C.; Bourson, P.; Devaux, E.; Campagne, C. In-situ Raman Monitoring of the Poly(Vinylidene Fluoride) Crystalline Structure during a Melt-spinning Process. J. Raman Spectrosc. 2021, 52, 1073–1079. [Google Scholar] [CrossRef]
- Pal, M.; Mathews, N.R.; Sanchez-Mora, E.; Pal, U.; Paraguay-Delgado, F.; Mathew, X. Synthesis of CuS Nanoparticles by a Wet Chemical Route and Their Photocatalytic Activity. J. Nanopart. Res. 2015, 17, 301. [Google Scholar] [CrossRef]
- Kochervinskii, V.V. The Structure and Properties of Block Poly(Vinylidene Fluoride) and Systems Based on It. Russ. Chem. Rev. 1996, 65, 865–913. [Google Scholar] [CrossRef]
- Tao, R.; Shi, J.; Rafiee, M.; Akbarzadeh, A.; Therriault, D. Fused Filament Fabrication of PVDF Films for Piezoelectric Sensing and Energy Harvesting Applications. Mater. Adv. 2022, 3, 4851–4860. [Google Scholar] [CrossRef]
- O’Reilly, L.; Mitra, A.; Natarajan, G.; Lucas, O.F.; McNally, P.J.; Daniels, S.; Cameron, D.C.; Bradley, A.L.; Reader, A. Impact on Structural, Optical and Electrical Properties of CuCl by Incorporation of Zn for n-Type Doping. J. Cryst. Growth 2006, 287, 139–144. [Google Scholar] [CrossRef]
- Mahtout, S. Growth and Linear Optical Properties of CuCl Nanocrystals. Semicond. Phys. Quantum Electron. Optoelectron. 2004, 7, 185–189. [Google Scholar] [CrossRef]
- Wang, M.; Xie, F.; Li, W.; Chen, M.; Zhao, Y. Preparation of Various Kinds of Copper Sulfides in a Facile Way and the Enhanced Catalytic Activity by Visible Light. J. Mater. Chem. A 2013, 1, 8616. [Google Scholar] [CrossRef]
- Chung, T.C.M. Functionalization of Polypropylene with High Dielectric Properties: Applications in Electric Energy Storage. GSC 2012, 02, 29–37. [Google Scholar] [CrossRef]
- Wang, L.; Yang, J.; Cheng, W.; Zou, J.; Zhao, D. Progress on Polymer Composites With Low Dielectric Constant and Low Dielectric Loss for High-Frequency Signal Transmission. Front. Mater. 2021, 8, 774843. [Google Scholar] [CrossRef]
- Chen, J.; Wang, X.; Yu, X.; Yao, L.; Duan, Z.; Fan, Y.; Jiang, Y.; Zhou, Y.; Pan, Z. High Dielectric Constant and Low Dielectric Loss Poly(Vinylidene Fluoride) Nanocomposites via a Small Loading of Two-Dimensional Bi2 Te3 @Al2 O3 Hexagonal Nanoplates. J. Mater. Chem. C 2018, 6, 271–279. [Google Scholar] [CrossRef]
- Ramesan, M.T.; Jayakrishnan, P.; Anilkumar, T.; Mathew, G. Influence of Copper Sulphide Nanoparticles on the Structural, Mechanical and Dielectric Properties of Poly(Vinyl Alcohol)/Poly(Vinyl Pyrrolidone) Blend Nanocomposites. J. Mater. Sci Mater. Electron. 2018, 29, 1992–2000. [Google Scholar] [CrossRef]
- IPC-4203; Revision B—Standard Only: Cover and Bonding Material for Flexible Printed Circuitry. IPC: Bonn, Germany, 2018.
- IEC 60384-1:2021; Fixed Capacitors for Use in Electronic Equipment—Part 1: Generic Specification. IEC: Geneva, Switzerland, 2021.


| Layer | α-Phase Content, % | β-Phase Content, % | γ-Phase Content, % |
|---|---|---|---|
| Pure polymer, both surfaces | 32 | 32 | 36 |
| Composite, inner side | 36 | 29 | 35 |
| Composite, outer side | 35 | 27 | 38 |
| Pure polymer, volume | 10 | 43 | 47 |
| Composite, volume | 5 | 55 | 40 |
| Material | Measured Melting Enthalpy, J/K | Melting Temperature, °C | Phase Content, % | Crystallinity, % | ||
|---|---|---|---|---|---|---|
| β | α | β + γ | α | |||
| Pure polymer | 54.13 | 154.6 | 157.5 | 90 | 10 | 52.9 |
| Composite (94% polymer) | 50.41 | 152.8 | 156.7 | 95 | 5 | 52.1 |
| Sample | Side | RMS, nm | Surface Potential φ, V |
|---|---|---|---|
| Pure polymer | Inner side | 9 | 0.23 |
| Outer side | 180 | −0.12 | |
| Composite polymer | Inner side | 81 | 0.12 |
| Outer side | 55 | −0.03 |
| Material | Frequency | Dielectric Constant, ε’ | Dielectric Loss Tangent, tg δ | Electric Strength, MV/m | Reference |
|---|---|---|---|---|---|
| 10% reduced graphite oxide/CuS in PVDF | 2 GHz | 24 | ~ 0.8 | n/d | [2] |
| 10% CuS in PVDF | 2 GHz | 12 | 0.05 | n/d | [3] |
| Pure PVDF | 2 GHz | ~3 | <0.15 | n/d | [3] |
| Polypropylene | 1 kHz | 2.6 | n/d | 550 | [52] |
| Polypropylene (isotactic) | 1 kHz | 2.2 | 0.0001 | n/d | [53] |
| PolyK PVDF (pure) | 1 kHz | 11.5 | <0.015 | 311 | [4] |
| 5% Cu@Graphite Oxide in PVDF | 1 kHz | 45 | <0.1 | n/d | [9] |
| 10% NixSy in PVDF | 2 GHz | 5 | <0.15 | n/d | [13] |
| 10% ZnO in PVDF | 1 kHz | 10 | 0.026 | 95 | [31] |
| 10% Bi2Te3 in PVDF | 1 kHz | 385 | 0.20 | ~ 50 | [54] |
| 10% CuS in PVA/PVP blend | 1 kHz | 8000 | ~2.5 | n/d | [55] |
| Cu7S4/CuCl (6% Cu) in VDF-TFE copolymer | 1 kHz | 15.9 | 0.08 | 157 | This work |
| VDF-TFE copolymer | 1 kHz | 10.4 | 0.026 | 288 | This work |
Disclaimer/Publisher’s Note: The statements, opinions and data contained in all publications are solely those of the individual author(s) and contributor(s) and not of MDPI and/or the editor(s). MDPI and/or the editor(s) disclaim responsibility for any injury to people or property resulting from any ideas, methods, instructions or products referred to in the content. |
© 2025 by the authors. Licensee MDPI, Basel, Switzerland. This article is an open access article distributed under the terms and conditions of the Creative Commons Attribution (CC BY) license (https://creativecommons.org/licenses/by/4.0/).
Share and Cite
Maltsev, A.A.; Vodyashkin, A.A.; Buryanskaya, E.L.; Koval, O.Y.; Syuy, A.V.; Bibikov, S.B.; Maltseva, I.E.; Parshin, B.A.; Stoynova, A.M.; Mikhalev, P.A.; et al. Wet Chemical-Synthesized Low-Loss Dielectric Composite Material Based on CuCl-Cu7S4 Nanoparticles and PVDF Copolymer. Polymers 2025, 17, 1845. https://doi.org/10.3390/polym17131845
Maltsev AA, Vodyashkin AA, Buryanskaya EL, Koval OY, Syuy AV, Bibikov SB, Maltseva IE, Parshin BA, Stoynova AM, Mikhalev PA, et al. Wet Chemical-Synthesized Low-Loss Dielectric Composite Material Based on CuCl-Cu7S4 Nanoparticles and PVDF Copolymer. Polymers. 2025; 17(13):1845. https://doi.org/10.3390/polym17131845
Chicago/Turabian StyleMaltsev, Alexander A., Andrey A. Vodyashkin, Evgenia L. Buryanskaya, Olga Yu. Koval, Alexander V. Syuy, Sergei B. Bibikov, Irina E. Maltseva, Bogdan A. Parshin, Anastasia M. Stoynova, Pavel A. Mikhalev, and et al. 2025. "Wet Chemical-Synthesized Low-Loss Dielectric Composite Material Based on CuCl-Cu7S4 Nanoparticles and PVDF Copolymer" Polymers 17, no. 13: 1845. https://doi.org/10.3390/polym17131845
APA StyleMaltsev, A. A., Vodyashkin, A. A., Buryanskaya, E. L., Koval, O. Y., Syuy, A. V., Bibikov, S. B., Maltseva, I. E., Parshin, B. A., Stoynova, A. M., Mikhalev, P. A., & Makeev, M. O. (2025). Wet Chemical-Synthesized Low-Loss Dielectric Composite Material Based on CuCl-Cu7S4 Nanoparticles and PVDF Copolymer. Polymers, 17(13), 1845. https://doi.org/10.3390/polym17131845