Abstract
The preparation of biodegradable polymer foams with a stable high volume-expansion ratio (VER) is challenging. For example, poly (butylene adipate-co-terephthalate) (PBAT) foams have a low melt strength and high shrinkage. In this study, polylactic acid (PLA), which has a high VER and crystallinity, was added to PBAT to reduce shrinkage during the supercritical molded-bead foaming process. The epoxy chain extender ADR4368 was used both as a chain extender and a compatibilizer to mitigate the linear chain structure and incompatibility and improve the foamability of PBAT. The branched-chain structure increased the energy-storage modulus (G’) and complex viscosity (η*), which are the key factors for the growth of cells, by 1–2 orders of magnitude. Subsequently, we innovatively used the CO2 and N2 composite gas method. The foam-shrinkage performance was further inhibited; the final foam had a VER of 23.39 and a stable cell was obtained. Finally, after steam forming, the results showed that the mechanical strength of the PBAT/PLA blended composite foam was considerably improved by the addition of PLA. The compressive strength (50%), bending strength, and fracture load by bending reached 270.23 kPa, 0.36 MPa, and 23.32 N, respectively. This study provides a potential strategy for the development of PBAT-based foam packaging materials with stable cell structure, high VER, and excellent mechanical strength.
1. Introduction
As plastic production increases, net emissions from plastic packaging waste incineration will increase to 84 million tons and 309 million tons by 2030 and 2050, respectively [1]. This poses a serious threat to human health and natural ecosystems. Therefore, global efforts are being made to create green polymers from renewable resources. Environmentally friendly plastics provide a possible solution to the above problems [2]. Polymer foam is a polymer/gas composite material with a polymer matrix, which offers the advantages of a lower charge, light weight, high impact strength, and good heat and sound insulation; thus, it is widely used in packaging, construction, medical applications, sound insulation, earthquake resistance, and electromagnetic shielding fields [3,4,5]. Therefore, polymer foam provides an effective mean to alleviate current environmental problems [6]. The foaming industry has focused on research and development of the supercritical bead-foaming technique for poly (butylene adipate-co-terephthalate) (PBAT), polylactic acid (PLA), and other degradable materials, as well as the gradual replacement and elimination of foamed expanded polystyrene and foamed expanded polypropylene [7,8,9].
PBAT is a representative biodegradable material and has been widely used in tableware, plastic bags, agricultural films, and pharmaceutical materials. However, there are few studies and applications of PBAT as a foaming material. Cui et al. prepared biodegradable branched PBAT (CPBAT)/acetylated cellulose nanocrystal (ACNC) nanocomposite foams using a batch foaming process with supercritical CO2 [10]. Their study produced the highest volume-expansion ratio (VER) reported for PBAT foam in the literature at that time; however, the VER of their CPBAT foams was only 9.21. PBAT still experiences limiting disadvantages in the field of foaming, such as low melt strength, poor mechanical strength, and low glass-transition temperature (Tg). These shortcomings lead to the low VER of PBAT foams and high shrinkage. Moreover, PBAT foam sheets are soft, which is unsuitable for the field of packaging materials. PLA is a representative biodegradable material with excellent mechanical [11] and physical properties [8,12] and a high foaming VER [13]. PLA supercritical foaming has been extensively studied for a long time. Its development process is mature; however, limitations regarding its molding still exist. Park et al. used PLA beads with a VER of 15 for steam forming; however, the forming interface was poor, which leaves considerable room for improvement in bead molding [14]. The authors proposed that the foaming properties and mechanical strength of PBAT may be improved by mixing PLA into PBAT before foaming [15]. Cai et al. implemented the method of foaming after mixing 75 wt% PBAT and 25 wt% PLA. Under the optimal foaming condition, the VER value of the PBAT/PLA foam was 13.44, and the cell density was 4.08 × 10⁸ cells/cm3. Because PBAT and PLA are incompatible systems and both have straight-chain structures and low melt strengths, the VER of unmodified PBAT/PLA is low [16]. Increasing the compatibility between PBAT and PLA is the key to improving the foaming performance of the blend [17,18,19,20]. To the best of our knowledge, there are no existing studies on the preparation of extended chain branched PBAT/PLA composite foams to obtain high-VER foam with PBAT as the main body. Furthermore, the compound-gas foaming and steam-forming properties of PBAT/PLA are also limited.
Unmodified PBAT foam has the characteristics of low VER and high shrinkage; it also exhibits poor mechanical properties. In this study, PLA was added to PBAT, and the PBAT/PLA (8:2) branched chain composites were prepared using the twin-screw melt blending method with ADR4368 as a compatibilizer and chain extender (CE). The thermal properties, melt strength, mechanical properties, and crystallization properties of the blend were improved to different degrees, and a comprehensive analysis was conducted. Subsequently, the effects of CO2 and N2 compound-gas foaming on the shrinkage, cell morphology, and VER evolution of PBAT/PLA (8:2) foam with 1.2% CE was used to adjust the foam performance, and foams with a stable and high VER were obtained at appropriate gas ratios. Finally, a PBAT/PLA composite-foam sheet was prepared using steam-forming technology, and its mechanical strength was considerably improved. This method provides an effective strategy for the study of degradable green foam materials. The foaming process and mechanism used in this study are shown in Scheme 1.
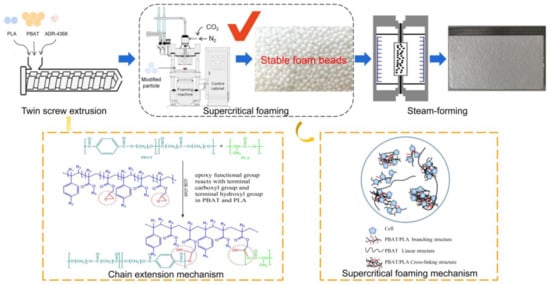
Scheme 1.
Experiments on supercritical bead composite gas foaming of chain extended PBAT/PLA and reaction-mechanism diagram.
2. Experimental Section
2.1. Experimental Materials
PBAT (density: 1.24 g/cm3, melting point: 95–135 °C) is provided by Shanxi Jinhui Zhaolong High-Tech Co., Ltd., China and its melt index (190 °C/2.16 kg) is 5 g/10 min. PLA (density: 1.24 g/cm3, melting point: 155–170 °C) is provided by Foshan Bijia High-Tech Material technique Co., Ltd., China and its melt index (190 °C/2.16 kg) is 1–4 g/10 min. The detailed physical properties and test methods of PBAT and PLA are shown in Table S1. The multifunctional epoxy chain extender ADR4368 is supplied by Badische Anilin-und-Soda-Fabrik (BASF), Germany.
2.2. Preparation of Diverse Samples
Branched PBAT/PLA composites were prepared via the twin-screw melt blending method. The diverse samples formulations are shown in Table 1. The details are available in the Section S1.1. For simplicity, for PBAT/PLA samples supplemented with 0 wt%, 0.6 wt%, 0.9 wt%, 1.2 wt%, and 1.5 wt% of the CE, the names are abbreviated as PPCE-0, PPCE-0.6, PPCE-0.9, PPCE-1.2, and PPCE-1.5, respectively.

Table 1.
Experimental formulae of different PBAT, PLA, and PBAT/PLA blend samples.
2.3. Preparation of Diverse Types of Foamed Samples
During preparation of diverse types of foamed samples, PPCE-1.2 foam with different gas components was provided for the PPCE-1.2 orthogonal foaming experiment. The diverse samples shown in Table 1 were dried under vacuum at 70 °C for 12 h. The various foams were prepared via an intermittent foaming method in the self-developed supercritical mold foaming equipment using supercritical gas as the physical foaming agent. First, diverse samples were placed inside the high-pressure mold and flushed into the high-pressure mold with saturated gas to 14 MPa and constant foaming temperatures of 105 °C, 110 °C, 115 °C, and 120 °C for 30 min. After waiting for the saturated gas to diffuse and dissolve sufficiently in the matrix, the pressure inside the high-pressure mold dropped from 14 MPa to 0.1 MPa in about 2 s. The orthogonal parallel foaming experiments were performed at different temperatures (110 °C, 115 °C, 120 °C), pressures (12 MPa, 14 MPa, 16 MPa), and saturation times (10 min, 20 min, 30 min) to obtain PPCE-1.2 foams with different foaming conditions.
The schematic diagram of the self-developed supercritical mold foaming equipment is shown in Figure 1.
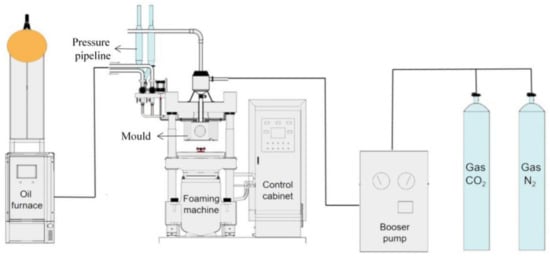
Figure 1.
Diagram of supercritical molded bead foaming equipment.
2.4. Preparation of Foam Sheets
The PBAT and PPCE-1.2 foam sheets were prepared to use the steam-forming equipment. The PBAT foam sheets and PPCE-1.2 foam sheets obtained under the optimal foaming conditions were sucked into the water steam forming apparatus using a pipeline, the sheets were prepared to use the steam forming equipment, and the molded biodegradable composite sheets were obtained after opening the mold at a double-sided steam pressure of 0.6 kg and 0.9 kg, a heating time of 60 s, a holding time of 10 s, water cooling of 110 s, and a vacuum of 10 s, respectively. The biodegradable composite sheets were obtained after opening the mold.
2.5. Material Characterization Analysis
2.5.1. Differential Scanning Calorimetry (DSC)
DSC (Q20, TA Instruments, New Castle, DE, USA) tested the thermal performance of diverse samples used under a nitrogen flow of 50 mL/min. The details are available in the Section S1.2.1 [21,22].
The Crystallinity (Xc) of PBAT was calculated using Equation (1):
The Crystallinity (Xc) of PLA was calculated using Equation (2):
where XC(PABT) is the degree of crystallinity of PBAT, ∆Hm(PABT) is the PBAT melting enthalpy of various samples, ∆Hm0 (PBAT) is the standard melting enthalpy of the crystallized PBAT (114 J/g) and c1 is the mass fraction of PBAT. XC(PLA) is the degree of crystallinity of PLA, ∆Hm(PLA) is the PLA melting enthalpy of various samples, ∆Hcc is the PLA cold crystallization enthalpy of various samples, ∆Hm0(PLA) is the standard melting enthalpy of the crystallized PLA (93.6 J/g), and c2 is the mass fraction of PLA.
2.5.2. Thermogravimetric Analysis (TGA)
The degradation temperatures of diverse samples were tested by a thermogravimetric analyzer (2950, TA Instruments, New Castle, DE, USA). The details are available in the Section S1.2.2.
2.5.3. Avrami Isothermal Crystallization Kinetic
The crystallization kinetic of diverse samples were tested using a DSC (Q20, TA Instruments, New Castle, DE, USA) under a 50 mL/min nitrogen flow rate. The details are available in the Section S1.2.3 [23,24].
The Avrami kinetics model was calculated using Equation (3):
The t1/2 and G were calculated using Equations (4) and (5):
where X(t) is the relative crystallinity at crystallization time t, k is the crystallization kinetic constant for nucleation and growth rate, and n is the Avrami index that reflects the crystal nucleation and growth mechanism.
2.5.4. Rheological Properties
The dynamic rheological performances of diverse samples were tested using a rotational rheometer (MARS40, HAAKE, Germany). The details are available in the Section S1.2.4.
2.5.5. Scanning Electron Microscopy (SEM)
The diverse surface morphologies of non-foamed and foamed samples were obtained using scanning electron microscopy (SEM) (Regulus 8100, Hitachi High-Technologies, Chiyoda Ward, Tokyo, Japan). The details are available in the Section S1.2.5.
2.5.6. Foaming Performance
The volume expansion ratio (VER), cell density (N0), and average cell size (D) of diverse foam sample equations and the method for the adsorption capacity of composite gases are provided [25].
The VER was calculated using Equation (6):
where is the density of unfoamed foam and is the density of the foamed foam, both in g/cm3; the VER was measured by an LS12ASCS density balance.
The N0 was calculated using Equation (7):
where N0 is the cell density, n represents the number of cells in the SEM image, M is the magnification of the SEM photograph, A denotes the area (in cm2) of the scanning electron microscope (SEM) image, and VER denotes the volume expansion ratio.
The D was calculated using Equation (8):
where D is the average cell size, di is the individual cell size, and ni is the number of cell sizes.
2.5.7. Compounding Gas Adsorption
Selection of PPCE-1.2 for gas adsorption and foaming research. The gravimetric method determined the foaming adsorption behaviors at different compound gas ratios. The details are available in the Section S1.2.6.
2.5.8. Mechanical Properties of Sheet Testing
Compressive strength, bending strength, and the fracture load by bending were tested by a universal testing machine (UTM8104, Sanshizongheng Technology Co., Ltd., Shenzhen, China). The details are available in the Section S1.2.7.
3. Results and Discussion
3.1. Thermal Physical Analysis (DSC)
Figure 2a,b show the DSC curves of different samples, and their detailed thermal performance parameters are shown in Table S2. Crystallization and melting properties play a crucial role in the foam cell nucleation, growth, and final foaming properties. This study used DSC analysis at atmospheric pressure to evaluate the crystallization and melting properties of the samples. After blending PBAT/PLA, it was observed that both materials had distinctive DSC peaks, thereby indicating that they could not be mixed into a unified phase. However, the materials influenced each other, and their physical properties changed greatly. As shown in Figure 2a,b and Table S2, the crystallization temperature (Tc) of PBAT was 62.90 °C, and that of PLA was 111.06 °C. The modified PLA with high crystallinity did not exhibit a cold crystallization peak, but had a high Tc, which indicates that it has a high crystallization rate and ensures foam formation. When a 20% proportion of PLA was co-blended in the main body of the PBAT, the Tc corresponding to PBAT was considerably increased (by approximately 17 °C). The Tc of PLA also increased, which may be because the addition of PLA provided both materials with heterogeneous nucleation sites [26], which improved the crystallization rate. Moreover, an interesting phenomenon was observed: the Tc and melting temperature (Tm) of the PBAT phase gradually decreased with the increase in CE content, whereas the Tc and Tm of the PLA phase gradually increased. This may be because the branched reaction reacts more easily with PLA, thereby producing more branched structures and providing crystal nucleation sites. The crystallization behavior of PBAT may be weakened due to the lower chain extension activity of the branched reaction for PBAT. Under the effect of these two mechanisms, the CE exhibits different reactions based on the two phases. This has different effects on the Tc, making the Tc either decrease or increase.
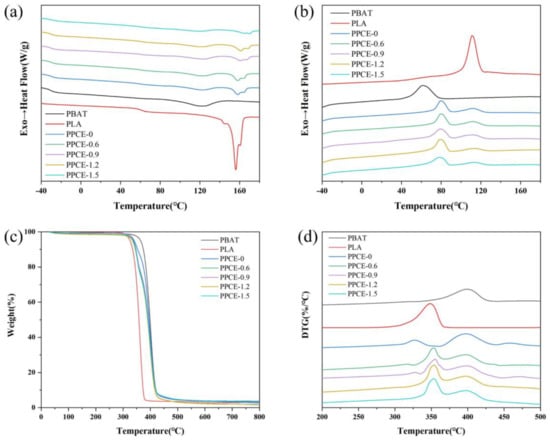
Figure 2.
Characterization of different samples. DSC curves of different samples: (a) DSC heating curves, (b) DSC cooling curves. TGA curves of different samples: (c) TG curves, (d) DTG curves.
The final crystallinity (Xc) of both the PBAT and PLA phases decreased after their blending and further decreased after the addition of the CE. This is due to the higher chain regularity of the linear structure of PBAT or PLA, which eventually produces a higher Xc under isothermal conditions [27,28]. When complex branched chains are present, the crystal growth is inevitably hindered, due to the increased resistance to molecular motion. This inevitably leads to increased chain entanglement, and the interaction among these crystals weakens the molecular motion in the course of crystal growth, which leads to a lower degree of crystal stacking [29]. The melting-temperature peaks of PBAT and PLA appeared on the heating-scan curves of different PPCE samples, and a double melt peak appeared in the PLA melt peak. This indicates the coexistence of two spherical crystal structures. Additionally, some imperfect crystalline parts melted first and perfect crystalline parts melted later in the process. The Tg of both the PBAT and PLA phases increased after blending PBAT and PLA. Moreover, the Tg values of the PBAT and PLA phases increased with the increase in the CE content after blending. This was due to the entanglement of chain segments, which limited their motion.
3.2. Thermogravimetric Analysis (TGA)
Figure 2c,d show the thermal decomposition properties and thermal weight/thermal weight loss (TG/DTG) curves of diverse samples in a nitrogen atmosphere, and detailed thermal decomposition properties are shown in Table S3. In a nitrogen atmosphere, the diverse thermal decomposition of pure PBAT was higher than that of pure PLA, which indicates that the thermal stability of pure PBAT was higher than that of pure PLA. The decomposition peaks of the pure blend, PPCE-0, are the PLA and PBAT decomposition peaks. Moreover, the decomposition temperature of the corresponding thermal decomposition peak of pure PLA decreased by approximately 19 °C, which indicates that the stability of the pure blend PPCE-0 sample decreased considerably due to the incompatibility of the two materials. The thermal weight-loss temperatures of the 5%, 10%, and 50% PPCE samples with the addition of the CE were slightly lower than that of PPCE-0. However, the peak temperature of the thermal decomposition of PLA was approximately 24 °C higher than that without the CE. The thermal decomposition peak temperature of PBAT was essentially unchanged, thereby indicating that the chain extension effect of the CE agent on PLA was pronounced, and the chain extension effect on PBAT was poor. However, the overall thermal stability improved. Moreover, the thermal decomposition performance did not change significantly with an increase in CE content.
3.3. Avrami Isothermal Crystallization Kinetic
Figure 3a shows the result of the isothermal crystallization analysis of the Avrami model. The detailed parameters of the Avrami model are shown in Table 2. The n values for both PBAT and various PPCE samples were approximately two or lower, thereby indicating that two-dimensional (2D) homogeneous spherical crystal growth dominates the crystallization process. The n values for PLA were approximately three, which indicates that this straight-chain PLA is more inclined to 3D heterogeneous cell nucleation and growth [24,30]. Blending PBAT with PLA alone resulted in a crystallization rate closer to that of the PLA phase, with an overall decrease. As the degree of CE increased, the t1/2 time shortened. The crystallization rate (G) gradually increased, which is why the two chain-segment groups of PBAT and PLA play the role of crystal heterogeneous nucleation sites, which led to an elevated crystallization rate. However, during this process, the activity of the branched chain reduced, and the crystallization behavior was weakened [31,32]. Overall, the two systems competed and the crystallization rate eventually increased. Therefore, in the overall crystallization process of chain extension PPCE, the chain-segment groups played a dominant role in the effect of crystal heterogeneous nucleation sites, which increased the crystallization rate. Moreover, the crystallization rate of PPCE samples increased with an increase in the chain-expanding agent content.
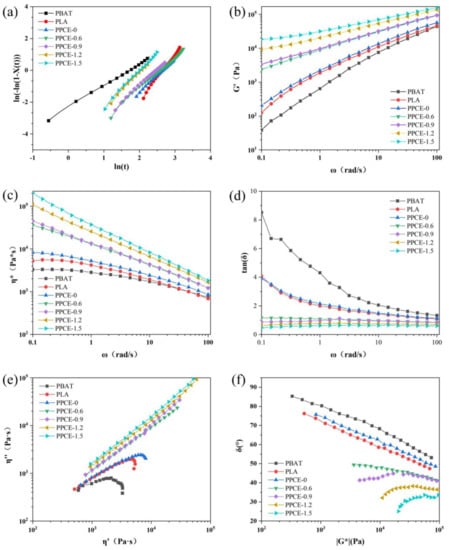
Figure 3.
Characterization of samples: (a) Kinetics of crystallization of Avrami equation, (b) η*, (c) G’, (d) tan(δ), (e) Cole–Cole plots, and (f) vGP.

Table 2.
Semi-crystallization time, crystallization rate, and Avrami-model parameters for different samples at atmospheric pressure and a temperature of 90 °C.
3.4. Rheological Properties
The rheology of polymers is strongly dependent on their melt strength and a vital factor that affects their foaming properties. The shear rheological parameters (G’, η*, and tanδ) of the polymer melt at 190 °C are susceptible to the effects of the polymer molecular chain structure, as well as the type and content of the added filler [33].
Figure 3b shows the storage modulus (G’) of samples with different rheological properties. G’ is a measure of energy storage and recovery that is exhibited during cyclic deformation, and it reflects the elastic moduli of a material [34]. G’ plays a crucial role in polymers’ melt elasticity and foaming properties [35]. The G’ value after the chain extension is more significant than the G’ values for PBAT and PLA, and the G’ values of different samples were elevated over the entire ω range, which is characteristic of the melt elastic behavior of polymers. The branched chains of PBAT and PLA were easily entangled with other PBAT and PLA molecular chains around them after the chain extension. These entanglement points can act as cross-linking points, thereby improving melt strength and foaming properties.
Figure 3c shows the η* values of samples with different rheological properties. The complex viscosity (η*), which reflects the viscosity of the polymer, is closely related to cell nucleation and growth during the foaming process [36], and an increase in η* can assist with preventing cell rupture during the cell-growth stage. Hence, the foaming gas escaped quickly, which resulted in a low foam VER. Different samples exhibited a shear-thinning phenomenon and η* decreased with increasing ω. Compared with pure PBAT and pure PLA, the addition of CE significantly affected the η* value of the PPCE samples. Particularly, at ω = 0.1 rad/s, η* increased substantially by 1–2 orders of magnitude. With an increase in CE content, η* increased and the shear thinning phenomenon became more apparent. This was mainly because the chain extension produced a branched structure, which increased the PPCE sample’s relaxation time and melt strength.
Figure 3d shows the tanδ values of samples with different rheological properties. tanδ is equal to the loss modulus G’’/G’, which has an essential analytical index that reflects the viscoelastic properties of polymers. A larger tanδ value implies a greater viscosity, whereas a smaller tanδ value implies better elasticity. After the addition of the CE, tanδ was significantly lower than that of pure PBAT and pure PLA, thereby indicating a faster elastic response, progressively lower viscous dissipation, and enhanced foamability [37]. This is attributed to the formation of branched structures that increase the number of entanglements between molecular chains.
Cole–Cole and vGP plots were introduced to evaluate the degree of branching and molecular-weight increase in different PPCE samples. Figure 3e shows the Cole–Cole plots of the rheological properties of different samples. A larger radius in the Cole–Cole plot data corresponds to an increased degree of branching [38]. The Cole–Cole plots of PBAT, PLA, and PPCE-0 almost form a semicircle without a tail, thereby confirming their linear structure. The Cole–Cole plot after the chain extension deviates from the trend of the tail rising at higher values of η’ because the value of “η” increases with an increase in η’. This deviation from a semicircle in the Cole–Cole diagram further indicates the appearance of chains with longer relaxation times. This is also the result of physical chain extension and cross-linking, which is a consequence that favors the foaming process.
Figure 3f shows the vGP plots of the rheological properties of different samples. The vGP diagram is typically used when researching the topology of polymers. PBAT, PLA, and PPCE-0 exhibited linear relationships with G *, which confirmed their linear chain structures. The vGP plot of the branched PPCE samples strongly deviated from the trend and exhibited a local extreme in the low-G* range, which implies a nonlinear chain structure [32]. As the CE content increased, the minimum value of the phase angle decreased, which means the molecular weight was more significant. The above results reveal that CE is effective in improving the melt strength.
3.5. Phase Morphology of PPCE Samples with Different Degrees of Chain Extension
Figure 4 shows the scanning electron micrographs of PPCE samples with different degrees of chain extension. Preparing high-performance PBAT/PLA melt composite samples is technically challenging due to the incompatibility of the PBAT and PLA polymers [39]. Figure 4a shows that before the addition of CE, the interfacial adhesion of the PPCE-0 blend was poor, and the microscopic section of the system had many particles. A typical sea island structure should be observed for PPCE-0 blends, which indicates the poor compatibility of PBAT and PLA. The compatibility between PBAT and PLA phases improved with an increase in CE content. The addition of the CE significantly improved the interfacial bonding between PBAT and PLA, even at a lower dosage (0.6 wt%). The compatibility of the PPCE-0.6 interface was also considerably improved. When the CE content reached more than 1.2 wt%, there was no apparent phase separation between PBAT and PLA, the interface between the two phases of the PPCE blend system became blurred, and the number of protruding sheets significantly reduced [40]. The presence of CE may produce PBAT-g-PLA copolymer in the PPCE system, which significantly improves the compatibility of PPCE samples [41].
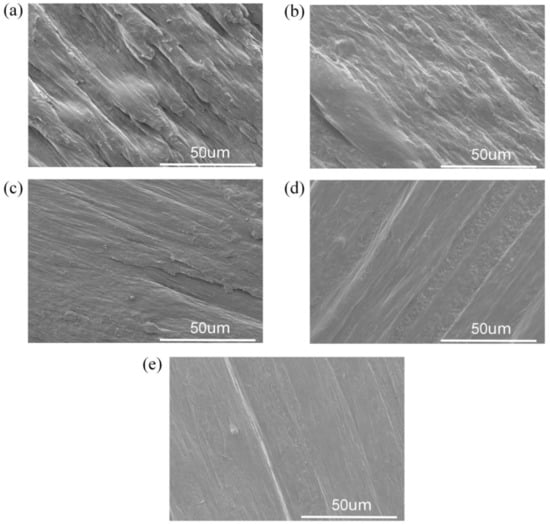
Figure 4.
Scanning electron microscopy images of PPCE samples with different degrees of CE: (a) PPCE-0, (b) PPCE-0.6%, (c) PPCE-0.9%, (d) PPCE-1.2%, and (e) PPCE-1.5%.
3.6. The VER of Samples under Different Foaming Conditions
All samples were saturated in a 14 MPa CO2 atmosphere for 30 min, and the foaming conditions were set at different temperatures; the specific foaming results are shown in Figure S1. Pure PBAT has the lowest VER due to the low melt strength, which limits its foaming effect. The PPCE-0 samples were obtained after the pure blending of PBAT and PLA; the VER improvement was not significant due to the high melting temperature of PLA and incompatibility with PBAT. The foaming performance was substantially improved after different contents of CE were added again. The CE can effectively improve the foaming performance of the PPCE samples; the overall foaming conditions were at their best when the CE content was 1.2%, and the highest VER reached 22.55 at 120 °C. This is because adding CE improves melt strength and the formation of a branched network, which supports stable cell growth and nucleation and effectively improves the compatibility between PBAT and PLA. As the CE content increased to 1.5%, the VER did not continue to increase because a micro-crosslinking phenomenon may occur with the continuous improvement of chain extension. Because the cell wall had a higher strength, the cell growth was more significant than that of PPCE-0.9 and PPCE-1.2. However, the chain activity reduced, cell nucleation weakened, the number of cells significantly reduced, and the supporting effect of foaming weakened; therefore, the VER decreased. Thus, chain extension and blending provide an easy method to prepare high-VER PABT foams for easy handling and large-scale production.
3.7. Cell-Morphology Analysis
Different degrees of chain extension induce different melt strengths in PPCE samples, affecting cell growth. Figure 5 shows the cell morphology, cell-size distribution, and cell parameters of various foams at a foaming temperature of 120 °C. The detailed parameters are shown in Table 3. The average cell size of PBAT foams was 56.0 μm, the average cell density was 2.62 × 10⁷ cells/cm3, and the VER was 7.38. After blending PLA with PBT, the cell size decreased to 49.36 μm, and the cell density increased to 5.27 × 10⁷ cells/cm3 because PLA provides heterogeneous nucleation sites that are more favorable for the generation of cells during polymer foaming. Additionally, more complex cell structures emerged after the introduction of the CE [42], and the trend of cell size and cell density is the opposite: the lower the cell density, the larger the cell size [43,44]. Between 0.6% and 1.2% CE, the cell size was smaller, and the cell density increased as the CE content increased. The cell size of PPCE-1.2 reached 31.98 μm with a cell size of 1.85 × 10⁸ cells/cm3, which may be due to the improved viscoelasticity of the material. This is due to the branched structure that is formed and the branched chains providing more cell-nucleation sites [45]. When the CE content increased by 1.5%, the cell size and density exhibited different trends from those obtained for CE contents between 0.6% and 1.2%. This may be due to the formation of a more complex cross-linked network at that time; the chain activity was weakened and the nucleation performance was reduced during the foaming process.
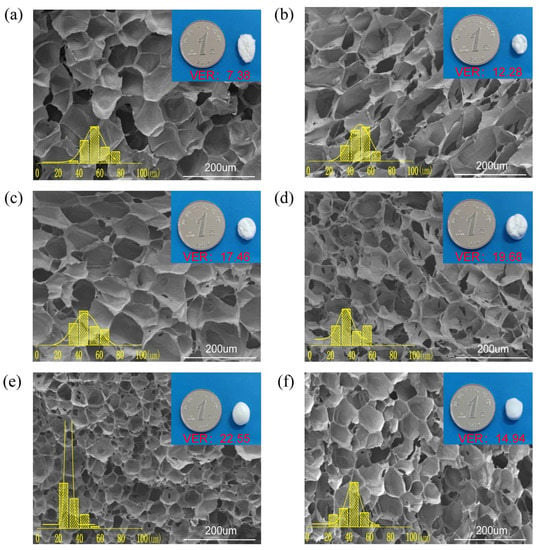
Figure 5.
Morphology and size distribution of cells at 120 °C for (a) PBAT, (b) PPCE-0, (c) PPCE-0.6, (d) PPCE-0.9, (e) PPCE-1.2, and (f) PPCE-1.5.

Table 3.
Foam parameters of PPCE samples with different degrees of chain extension at a foaming temperature of 120 °C.
3.8. Foam-Shrinkage Analysis
Compared to PBAT, PPCE blends exhibited more severe cell rupture due to the incompatibility of PBAT and PLA. Although the CE improved the compatibility of PBAT and PLA, the compatibility was still poor, and the incompatibility at the interfacial bonds could not withstand cell growth. However, the high melt strength provided good support for the growth of the foam. We also observed that PBAT showed severe shrinkage after 110 °C. As the CE content increased, the onset temperature at which the foam began to shrink increased, and foams with PPCE-0, PPCE-0.6, and PPCE-0.9 began to show adhesion and shrinkage at 115 °C. Severe shrinkage occurred at temperatures higher than 120 °C. The material’s melt at this temperature was insufficient to encapsulate the gas, and the cell merge and breakage were detrimental. The PPCE-1.2 and PPCE-1.5 foams showed slight adhesion and shrinkage at 120 °C. The shrinkage of each foam at 120 °C is shown in Figure 5. The addition of PLA inhibited the shrinkage of the material, and the addition of CE further inhibited the shrinkage. The anti-shrinkage property was further strengthened with an increase in CE content. However, foam shrinkage still exists, which limits the further increase in the foam VER. Overcoming this phenomenon is the key to improving the VER.
3.9. Foaming Orthogonal and Parallel Experiments
To reduce the foam shrinkage phenomenon, this study investigated the influence of foaming conditions on the foaming state in more detail. We selected PPCE-1.2 samples with the best foaming effect to conduct a more detailed orthogonal foaming study in a reasonable foaming window. The foaming temperature, saturation pressure, and saturation time significantly influence the foam [46]. The orthogonal experiment design of PPCE-1.2 is described in Table S4.
Figure S2 demonstrates the foaming parallel experiments in a specific interval of foaming conditions; the details are available in Table S5. Figure 6a shows the R-value, and the effect on the foam VER were obtained under the following foaming conditions: temperature > time > pressure. The optimal temperature, pressure, and time foaming conditions were 120 °C, 14 MPa, and 30 min, respectively. Figure 6b shows the 3D plot distribution of the foaming VER for the foaming parallel experiments under three foaming factors; different sphere colors indicate different VER gradients. It is evident from the figure that the foaming window of PPCE-1.2 shown by the yellow and red spheres is the more suitable foaming window.
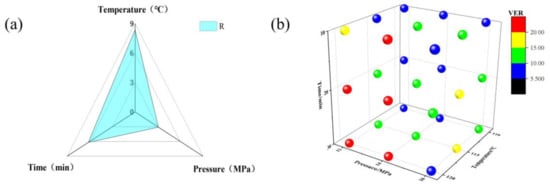
Figure 6.
Parallel experiments on PPCE-1.2: (a) Orthogonal experiment: R. (b) 3D plot of foam VER for three factors.
This parallel experiment verified the foaming orthogonal experiment above, and the highest VER of the foam was 22.55 under the temperature, pressure, and time conditions of 120 °C, 14 MPa, and 30 min, respectively, which is consistent with the results of the orthogonal experiment. Under different foaming conditions, a saturation time of 30 min can complete the saturation process, which is consistent with our previous experimental conclusions. PBAT has an extremely short saturation time compared to that of PLA, which facilitates industrial upscaling and production. We increased the pressure from 14 MPa to 16 MPa; the foam VER decreased sharply, severe shrinkage was observed, and the foam matrix of PPCE-1.2 could no longer continue to support the saturated gas. The foaming state of PPCE-1.2 foam at a temperature, pressure, and time of 120 °C, 14 MPa, and 30 min, respectively, has been described above, and slight adhesion and shrinkage still occur in these conditions.
3.10. Compound Gas-Adsorption Capacity
After optimizing the influence of foaming conditions, foam still experiences a shrinkage phenomenon. Zhong et al. obtained TPU sheets with improved mechanical properties and moldability via a steam forming technique using different ratios of CO2 and N2 compound gas for TPU foaming [47]. The foam-structure stability of TPU foam was improved by compound gas foaming; however, research on PBAT/PLA in compound gas foaming is limited.
To further suppress foam shrinkage, we chose the PPCE-1.2 sample, which exhibited excellent foaming performance. We conducted compound gas foaming experiments under the conditions of a saturation temperature of 120 °C, saturation pressure of 16 MPa, and saturation time of 30 min. The gas adsorption values for various CO2/N2 ratios are shown in Table S6. The CO2/N2 ratios described in this study are all pressure ratios. The adsorption of CO2 was considerably higher than that of N2. CO2 had a better affinity with polar polymers and CO2 had a higher adsorption amount, which assisted the polymers in forming a homogeneous system [47,48]. However, this also caused a high diffusion rate. Additionally, the Tg transition temperature of PBAT is just −28 °C at atmospheric pressure, and the foam was in a highly elastic state at room temperature. The soft texture of PBAT and the fast diffusion of saturated gas were the main reasons for the shrinkage of PBAT foam.
3.11. Compounding Gas Foaming-Density Variation
Figure S3 shows the change in density of PPCE-1.2 foam within one week of foaming. For foaming gases of 100%CO2, 75%CO2 + 25%N2, and 50%CO2 + 50%N2, the initial VERs of all three were similar. The density of the PPCE-1.2 foaming with pure CO2 foaming began to increase gradually and reached 0.16 g/cm3 after 6 h of maturation after foaming. Then, the density began to decrease and stabilize with the extension of the foaming time. With the increase in N2 content in the foaming agent, the density change of PPCE-1.2 became more stable. No significant change in the initial and final densities was observed when the N2 content increased by 25% and above at the same pressure, temperature, and saturation time. The foam produced by pure CO2 required a long maturation time to ensure the stability of the foam. Additionally, the foams comprising 75% CO2 + 25% N2 and 50% CO2 + 50% N2 had smaller densities of 0.053 and 0.057 g/cm3, respectively.
3.12. Analysis of Compound Gas-Foaming Morphology and Cells
Figure 7 demonstrates the cell morphology, size distribution, and parameters of PPCE-1.2 samples under different gas conditions, and detailed cell parameters are listed in Table 4. Compared with the previous foaming conditions, we increased the pressure to 16 MPa, and a severe shrinkage phenomenon occurred. This indicates that the critical value of the cell tolerable gas had been reached. Therefore, we used compound gas foaming to suppress the shrinkage of the foams. Under this foaming condition, the VER of a pure CO2 foamed PPCE-1.2 sample was reduced from 22.96 to 10.97; the sample exhibited 52.22% shrinkage, which is considered to be severe shrinkage, and surface wrinkling. For the 75% CO2 + 25% N2 compound gas foaming, the cell size, cell density, and VER of the foam were 34.10 μm, 1.78 × 10⁸ cells/cm3, and 23.39, respectively. When 50% N2 was added, the cell size, cell density, and VER of the 50% CO2 + 50% N2 compound gas foaming were similar to those of the 75% CO2 + 25% N2 compound gas foaming. As the proportion of N2 continued to increase, the VER decreased sharply to just 6.78, and the cell density of the 25% CO2 + 75% N2 compound gas foaming improved by an order of magnitude compared to that of the pure CO2 foaming. As the N2 content increased from 0% to 75%, the cell size continued to decrease and the cell density increased. This is because N2 has a more vital nucleation ability than CO2, which promotes the generation of nucleation sites in the foaming process [49]. When pure N2 is used as a foaming agent, the cell density exhibits a decreasing tendency. The cell structure is complex, and the cell wall is thick, which is relevant to the apparent unfoamed area between the cells. Additionally, the foam VER is low, only 1.95, because the driving force of N2 on cell growth is lower than that of CO2. However, a saturation time of 30 min is insufficient when pure N2 is used as the foaming gas.
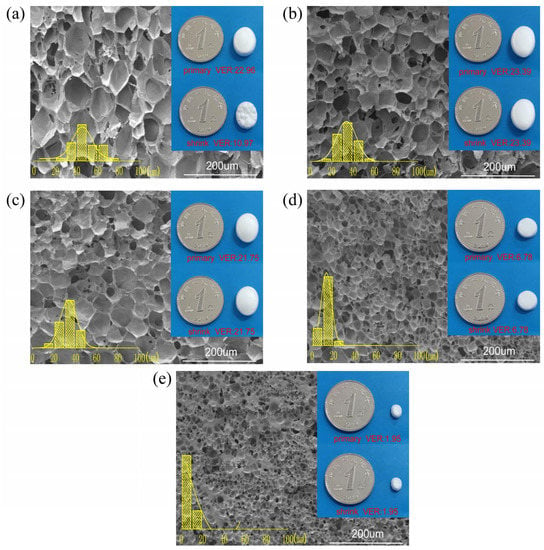
Figure 7.
Distribution of cell morphology and cell size of PPCE-1.2 samples under different gas conditions (a) 100% CO2, (b) 75% CO2 + 25% N2, (c) 50% CO2 + 50% N2, (d) 25% CO2 + 75% N2, and (e) 100% N2.

Table 4.
Cell parameters of PPCE-1.2 samples under different gas conditions.
Supercritical CO2 foaming produces a wider distribution of cell sizes and a higher proportion of large and small cells. This is due to the superior absorption of CO2, which facilitates the growth of cells. The driving force of N2 on cell growth is smaller, and the adsorption amount is smaller. Cell nucleation is increased, which results in a larger number of cells at a smaller size. Additionally, the cell size distribution is in a general range [19,49]. Overall, CO2 and N2 compound foaming can effectively inhibit the shrinkage of cells. The compound gas foaming of 75% CO2 + 25% N2 is the most effective.
3.13. Sheet Forming and Mechanical Property Analysis
Figure 8a,b show the PBAT and PPCE-1.2 foam-forming sheets, respectively. Steam-forming uses high temperatures at a particular pressure to melt the foam and adhere it together while eliminating the voids in the foam. The key contribution of steam forming is that the polymer chains diffuse to the interface area of the foam bead and rearrange under high-temperature steam [20,49]. The densities of the PBAT and PPCE-1.2 foam sheets obtained using steam-forming equipment under the optimal foaming conditions were 0.128 g/cm3 and 0.113 g/cm3, respectively. The final molding densities of the two were relatively close.
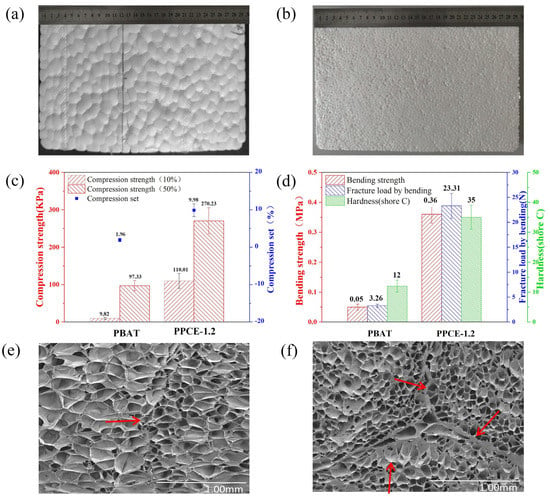
Figure 8.
(a) PBAT foam-forming sheets and (b) PPCE-1.2 foam-forming sheets. Characterization of PBAT and PPCE-1.2: (c) compression properties, (d) bending properties and hardness (shore C). (e) SEM image of PBAT foaming particle-bonding position. (f) SEM image of PPCE-1.2 foaming particle-bonding position.
Figure 8c shows the compression strength and permanent compression deformation of the PBAT and PPCE-1.2 foam sheets. PBAT has low Tg, excellent toughness, and a high elastic state. Therefore, its molded sheets were incredibly soft and had insufficient compressive strength at 10% and 50% deformation, which led to minor permanent compression deformation. The mechanical and physical properties of PLA were excellent. After adding 20% PLA and 1.2% CE to PBAT, the compressive strength of the foam significantly increased. Moreover, the high hardness, low resilience, and high brittleness of PLA caused the permanent compression deformation of PPCE-1.2 to increase, but kept the permanent deformation low [20,50].
Figure 8d shows the bending strength, the fracture load demonstrated by bending, and the shore hardness C of the PBAT and PPCE-1.2 foam sheets. As previously mentioned, adding PLA increased the shore hardness C of the foam board from 12 to 35. Notably, the PBAT foam sheet was exceptionally soft and exhibited high toughness. No fracturing occurred during bending, due to the low bending strength and fracture load demonstrated by bending. The low mechanical strength limited the foam’s application in packaging and other fields. After the PPCE-1.2 foam sheet was prepared, the bending strength increased from 0.05 M Pa to 0.36 M Pa, and the fracture load by bending increased from 3.26 MPa to 23.31 MPa, which effectively expanded the application range of the foaming sheet.
Figure 8e,f show the SEM images of PBAT and PPCE-1.2 foam bonding, respectively. The interface thickness of PPCE-1.2 was thicker than that of PBAT in terms of the foam-forming joint, and the interface part that did not fuse well after molding provided more fracture points in the mechanical property testing. Therefore, adding PLA led to a higher mechanical strength in the foam plate. Moreover, the cell density of PPCE-1.2 was higher and the cell size was smaller, which plays a more important role in supporting the foam and preventing the bursting and shrinkage of the foam. Therefore, a plate with excellent mechanical properties was produced [51].
4. Conclusions
In conclusion, a simple, clean, and highly efficient preparation method of PBAT/PLA degradable green foam material is presented. It has the following advantages. (1) It used ADR4368 as a CE and compatibilizer to improve the foaming properties, compatibility, rheological properties, and thermal properties of PPCE composite samples; compared with the system without chain extender, the VER increased from 7.38 to 22.55. (2) After using composite gas to coordinate the process of cell nucleation and cell growth, the cell size reduced, the cell density increased, no foams shrinkage was observed, and the VER further increased to 23.39. (3) For the foam sheets obtained via the steam-forming technique, compared with pure PBAT sheets, the compressive strength (50%) increased from 97.33 kPa to 270.23 kPa, the bending strength increased from 0.05 MPa to 0.36 MPa, and the fracture load obtained via bending increased from 12 N to 23.32 N. Hence, we believe that this strategy will find wide applications in the green packaging field, as well as in industry.
Supplementary Materials
The following supporting information can be downloaded at: https://www.mdpi.com/article/10.3390/polym15040895/s1, Table S1. PBAT and PLA detailed property tables and test standard; Table S2. Thermal performance parameter of PBAT, PLA, and diverse PPCE samples; Table S3. Thermal decomposition properties of diverse samples; Table S4. Orthogonal experiment design of PPCE-1.2; Table S5. Results of foaming parallel experiments in a specific interval of foaming conditions; Table S6. CO2 and N2 gas adsorption amounts; Figure S1. Diverse samples saturated with 14 MPa CO2 saturated atmosphere for 30 min and foamed at different foaming temperatures; Figure S2. Parallel experiments on PPCE-1.2: (a) 110 °C, (b) 115 °C, (c) 120 °C; Figure S3. Density variation of foam maturation process under different gas conditions.
Author Contributions
Conceptualization, W.Z.; Data curation, C.Z.; Investigation, J.J.; Methodology, L.J.; Software, W.Z. and M.L.; Supervision, T.J. and C.Z.; Validation, H.Y.; Visualization, J.S.; Writing—original draft, H.L.; Writing—review and editing, H.X. All authors have read and agreed to the published version of the manuscript.
Funding
This work was supported by grants from the National Key Research and Development Program of China (Grant No.: 2021YFC2102805), the National Natural Science Foundation of China (Grant No.: 22178170, 21878142), the Key Research and Development Plan of Jiangsu Province (Grant No.: BE2020712, BE2019001), the six talent peaks project in Jiangsu Province (SWYY-016), and the Jiangsu Synergetic Innovation Center for Advanced Bio-Manufacture.
Data Availability Statement
Not applicable.
Conflicts of Interest
The authors declare no conflict of interest.
References
- Shen, M.; Huang, W.; Chen, M.; Song, B.; Zeng, G.; Zhang, Y. (Micro)plastic crisis: Un-ignorable contribution to global greenhouse gas emissions and climate change. J. Clean. Prod. 2020, 254, 120138. [Google Scholar] [CrossRef]
- Peng, K.; Mubarak, S.; Diao, X.; Cai, Z.; Zhang, C.; Wang, J. Progress in the preparation, properties, and applications of PLA and its composite microporous materials by supercritical CO2: A review from 2020 to 2022. Polymers 2022, 14, 4320. [Google Scholar] [CrossRef] [PubMed]
- Fei, Y.; Chen, F.; Fang, W.; Xu, L.; Ruan, S.; Liu, X.; Zhong, M.; Kuang, T. High-strength, flexible and cycling-stable piezo-resistive polymeric foams derived from thermoplastic polyurethane and multi-wall carbon nanotubes. Compos. Part B Eng. 2020, 199, 108279. [Google Scholar] [CrossRef]
- Liu, J.; Zhang, L.; Shun, W.; Dai, J.; Peng, Y.; Liu, X. Recent development on bio-based thermosetting resins. J. Polym. Sci. 2021, 59, 1474. [Google Scholar] [CrossRef]
- Aversa, C.; Barletta, M.; Cappiello, G.; Gisario, A. Compatibilization strategies and analysis of morphological features of poly(butylene adipate-co-terephthalate) (PBAT)/poly(lactic acid) PLA blends: A state-of-art review. Eur. Polym. J. 2022, 173, 111304. [Google Scholar] [CrossRef]
- Faba, S.; Arrieta, M.P.; Aguero, A.; Torres, A.; Romero, J.; Rojas, A.; Galotto, M. Processing compostable PLA/organoclay bionanocomposite foams by supercritical CO2 foaming for sustainable food packaging. Polymers 2022, 14, 4394. [Google Scholar] [CrossRef]
- Ameli, A.; Nofar, M.; Jahani, D.; Rizvi, G.; Park, C.B. Development of high void fraction polylactide composite foams using injection molding: Crystallization and foaming behaviors. Chem. Eng. J. 2015, 262, 78. [Google Scholar] [CrossRef]
- Nofar, M.; Ameli, A.; Park, C.B. A novel technology to manufacture biodegradable polylactide bead foam products. Mater. Des. 2015, 83, 413. [Google Scholar] [CrossRef]
- Liao, J.; Zhang, S.; Wang, Z.; Song, X.; Zhang, D.; Kumar, R.; Jin, J.; Ren, P.; You, H.; Chen, F. Transition-metal catalyzed asymmetric reactions under continuous flow from 2015 to early 2020. Green Synth. Catal. 2020, 1, 121. [Google Scholar] [CrossRef]
- Cui, Y.; Luo, J.; Deng, Y.; Wang, X.; Zhou, H. Effect of acetylated cellulose nanocrystals on solid-state foaming behaviors of chain-extended poly(butylene adipate-co-terephthalate). J. Vinyl Addit. Technol. 2021, 27, 722. [Google Scholar] [CrossRef]
- Jiang, L.; Wolcott, M.P.; Zhang, J. Study of Biodegradable/Poly(butylene adipate-co-terephthalate) blends. Biomacromolecules 2006, 7, 199. [Google Scholar] [CrossRef]
- Nofar, M.; Park, C.B. Poly (lactic acid) foaming. Prog. Polym. Sci. 2014, 39, 1721. [Google Scholar] [CrossRef]
- Li, Y.; Yin, D.; Liu, W.; Zhou, H.; Zhang, Y.; Wang, X. Fabrication of biodegradable poly (lactic acid)/carbon nanotube nanocomposite foams: Significant improvement on rheological property and foamability. Int. J. Biol. Macromol. 2020, 163, 1175. [Google Scholar] [CrossRef]
- Nofar, M.; Tabatabaei, A.; Sojoudiasli, H.; Park, C.B.; Carreau, P.J.; Heuzey, M.C.; Kamal, M.R. Mechanical and bead foaming behavior of PLA-PBAT and PLA-PBSA blends with different morphologies. Eur. Polym. J. 2017, 90, 231. [Google Scholar] [CrossRef]
- Li, Y.; Zhang, Z.; Wang, W.; Gong, P.; Yang, Q.; Park, C.B.; Li, G. Ultra-fast degradable PBAT/PBS foams of high performance in compression and thermal insulation made from environment-friendly supercritical foaming. J. Supercrit. Fluids 2022, 181, 105512. [Google Scholar] [CrossRef]
- Cai, W.; Liu, P.; Bai, S.; Li, S. A one-step method to manufacture biodegradable poly (butylene adipate-co-terephthalate) bead foam parts. Polym. Adv. Technol. 2021, 32, 2007. [Google Scholar] [CrossRef]
- Nofar, M.; Salehiyan, R.; Ciftci, U.; Jalali, A.; Durmuş, A. Ductility improvements of PLA-based binary and ternary blends with controlled morphology using PBAT, PBSA, and nanoclay. Compos. Part B Eng. 2020, 182, 107661. [Google Scholar] [CrossRef]
- Wang, X.; Peng, S.; Chen, H.; Yu, X.; Zhao, X. Mechanical properties, rheological behaviors, and phase morphologies of high-toughness PLA/PBAT blends by in-situ reactive compatibilization. Compos. Part B Eng. 2019, 173, 107028. [Google Scholar] [CrossRef]
- Chen, Y.; Li, D.; Zhang, H.; Ling, Y.; Wu, K.; Liu, T.; Hu, D.; Zhao, L. Antishrinking strategy of microcellular thermoplastic polyurethane by comprehensive modeling analysis. Ind. Eng. Chem. Res. 2021, 60, 7155. [Google Scholar] [CrossRef]
- Ge, C.; Ren, Q.; Wang, S.; Zheng, W.; Zhai, W.; Park, C.B. Steam-chest molding of expanded thermoplastic polyurethane bead foams and their mechanical properties. Chem. Eng. Sci. 2017, 174, 337. [Google Scholar] [CrossRef]
- Bastarrachea, L.; Dhawan, S.; Sablani, S.S.; Mah, J.H.; Kang, D.H.; Zhang, J.; Tang, J. Biodegradable poly(butylene adipate-co-terephthalate) films incorporated with nisin: Characterization and effectiveness against listeria innocua. J. Food Sci. 2010, 75, E215. [Google Scholar] [CrossRef] [PubMed]
- Fischer, E.W.; Sterzel, H.J.; Wegner, G. Investigation of the structure of solution grown crystals of lactide copolymers by means of chemical reactions. Colloid Polym. Sci. 1973, 251, 980. [Google Scholar]
- Colton, J.S.; Suh, N.P. The nucleation of microcellular thermoplastic foam with additives: Part 1: Theoretical considerations. Polym. Eng. Sci. 1987, 27, 493. [Google Scholar] [CrossRef]
- Cai, J.; Liu, M.; Wang, L.; Yao, K.; Li, S.; Xiong, H. Isothermal crystallization kinetics of thermoplastic starch/poly(lactic acid) composites. Carbohydr. Polym. 2011, 86, 941. [Google Scholar] [CrossRef]
- Avrami, M. Kinetics of phase change. II transformation-time relations for random distribution of nuclei. J. Chem. Phys. 1940, 8, 212. [Google Scholar] [CrossRef]
- Zhang, R.; Xiong, Y.; Liu, Q.; Hu, S. Improved cell morphology and thermal properties of expanded polypropylene beads by the addition of PP with a high melting point. J. Appl. Polym. Sci. 2017, 134, 45121. [Google Scholar] [CrossRef]
- Tian, J.; Yu, W.; Zhou, C. Crystallization kinetics of linear and long-chain branched polypropylene. J. Macromol. Sci. Part B: Phys. 2011, 45, 969. [Google Scholar] [CrossRef]
- Pilla, S.; Kim, S.G.; Auer, G.K.; Gong, S.; Park, C.B. Microcellular extrusion-foaming of polylactide with chain-extender. Polym. Eng. Sci. 2009, 49, 1653. [Google Scholar] [CrossRef]
- Ouchi, T.; Ichimura, S.; Ohya, Y. Synthesis of branched poly (lactide) using polyglycidol and thermal, mechanical properties of its solution-cast film. Polymer 2006, 47, 429. [Google Scholar] [CrossRef]
- Nofar, M.; Zhu, W.; Park, C.B. Effect of dissolved CO2 on the crystallization behavior of linear and branched PLA. Polymers 2012, 53, 3341. [Google Scholar] [CrossRef]
- Zhang, C.; Lan, Q.; Zhai, T.; Nie, S.; Luo, J.; Yan, W. Melt crystallization behavior and crystalline morphology of polylactide/poly(epsilon-caprolactone) blends compatibilized by lactide-caprolactone copolymer. Polymers 2018, 10, 1181. [Google Scholar] [CrossRef]
- Qiao, Y.; Li, Q.; Jalali, A.; Yang, J.; Wang, X.; Zhao, N.; Jiang, Y.; Wang, S.; Hou, J.; Jiang, J. In-situ microfibrillated poly(ε-caprolactone)/poly(lactic acid) composites with enhanced rheological properties, crystallization kinetics and foaming ability. Compos. Part B Eng. 2021, 208, 108594. [Google Scholar] [CrossRef]
- Yin, D.; Mi, J.; Zhou, H.; Wang, X.; Tian, H. Fabrication of branching poly (butylene succinate)/cellulose nanocrystal foams with exceptional thermal insulation. Carbohydr. Polym. 2020, 247, 116708. [Google Scholar] [CrossRef]
- Pradeep, S.A.; Kharbas, H.; Turng, L.S.; Avalos, A.; Lawrence, J.G.; Pilla, S. Investigation of thermal and thermomechanical properties of biodegradable PLA/PBSA composites processed via supercritical fluid-assisted foam injection molding. Polymers 2017, 9, 22. [Google Scholar] [CrossRef]
- Shi, X.; Qin, J.; Wang, L.; Ren, L.; Rong, F.; Li, D.; Wang, R.; Zhang, G. Introduction of stereocomplex crystallites of PLA for the solid and microcellular poly(lactide)/poly(butylene adipate-co-terephthalate) blends. RSC Adv. 2018, 8, 11850. [Google Scholar] [CrossRef]
- Chen, Z.; Hu, J.; Ju, J.; Kuang, T. Fabrication of poly(butylene succinate)/carbon black nanocomposite foams with good electrical conductivity and high strength by a supercritical CO2 foaming process. Polymers 2019, 11, 1852. [Google Scholar] [CrossRef]
- He, H.; Wang, G.; Chen, M.; Xiong, C.; Li, Y.; Tong, Y. Effect of different compatibilizers on the properties of poly (lactic acid)/poly (butylene adipate-co-terephthalate) blends prepared under intense shear flow field. Materials 2020, 13, 2094. [Google Scholar] [CrossRef]
- Tian, H.; Wang, Z.; Jia, S.; Pan, H.; Han, L.; Bian, J.; Li, Y.; Yang, H.; Zhang, H. Biodegradable foaming material of poly(butylene adipate-co-terephthalate) (PBAT)/poly(propylene carbonate) (PPC). Chin. J. Polym. Sci. 2021, 40, 208. [Google Scholar] [CrossRef]
- Sun, M.; Zhang, L.; Li, C. Modified cellulose nanocrystals based on SI-ATRP for enhancing interfacial compatibility and mechanical performance of biodegradable PLA/PBAT blend. J. Polym. Compos. 2022, 43, 3753. [Google Scholar] [CrossRef]
- Zhou, W.; Rao, Y.; Zhuang, W.; Ge, L.; Lin, R.; Tang, T.; Wu, J.; Li, M.; Yang, P.; Zhu, C.; et al. Improved enzymatic activity by oriented immobilization on graphene oxide with tunable surface heterogeneity. Compos. Part B Eng. 2021, 216, 108788. [Google Scholar] [CrossRef]
- Wu, D.; Huang, A.; Fan, J.; Xu, R.; Liu, P.; Li, G.; Yang, S. Effect of blending procedures and reactive compatibilizers on the properties of biodegradable poly(butylene adipate-co-terephthalate)/poly(lactic acid) blends. J. Polym. Eng. 2021, 41, 95. [Google Scholar] [CrossRef]
- Cui, Y.; Zhou, H.; Yin, D.; Zhou, H.; Wang, X. An innovative strategy to regulate bimodal cellular structure in chain extended poly(butylene adipate- co- terephthalate) foams. J. Vinyl Addit. Technol. 2020, 27, 319. [Google Scholar] [CrossRef]
- Kuang, T.; Li, K.; Chen, B.; Peng, X. Poly (propylene carbonate)-based in situ nanofibrillar biocomposites with enhanced miscibility, dynamic mechanical properties, rheological behavior and extrusion foaming ability. Compos. Part B Eng. 2017, 123, 112. [Google Scholar] [CrossRef]
- Gao, C.; Li, M.; Zhu, C.; Hu, Y.; Shen, T.; Li, M.; Ji, X.; Lyu, G.; Zhuang, W. One-pot depolymerization, demethylation and phenolation of lignin catalyzed by HBr under microwave irradiation for phenolic foam preparation. Compos. Part B Eng. 2021, 205, 108530. [Google Scholar] [CrossRef]
- Wang, X.; Mi, J.; Zhou, H.; Wang, X. Transition from microcellular to nanocellular chain extended poly(lactic acid)/hydroxyl-functionalized graphene foams by supercritical CO2. J. Mater. Sci 2018, 54, 3863. [Google Scholar] [CrossRef]
- Zhou, C.; Wang, P.; Li, W. Fabrication of functionally graded porous polymer via supercritical CO2 foaming. Compos. Part B Eng. 2011, 42, 318. [Google Scholar] [CrossRef]
- Zhong, W.; Yu, Z.; Zhu, T.; Zhao, Y.; Phule, A.D.; Zhang, Z. Influence of different ratio of CO2/N2 and foaming additives on supercritical foaming of expanded thermoplastic polyurethane. Express Polym Lett. 2022, 16, 318. [Google Scholar] [CrossRef]
- Horne, W.J.; Shannon, M.S.; Bara, J.E. Correlating fractional free volume to CO2 selectivity in [Rmim][Tf2N] ionic liquids. J. Chem. Thermodyn. 2014, 77, 190. [Google Scholar] [CrossRef]
- Li, R.; Lee, J.; Wang, C.; Mark, L.H.; Park, C.B. Solubility and diffusivity of CO2 and N2 in TPU and their effects on cell nucleation in batch foaming. J. Supercrit. Fluids 2019, 154, 104623. [Google Scholar] [CrossRef]
- Ma, P.; Cai, X.; Zhang, Y.; Wang, S.; Dong, W.; Chen, M.; Lemstra, P. In-situ compatibilization of poly(lactic acid) and poly(butylene adipate-co-terephthalate) blends by using dicumyl peroxide as a free-radical initiator. Polym. Degrad. Stab. 2014, 102, 145. [Google Scholar] [CrossRef]
- Yang, J.; Chen, Z.; Xu, D.; Liu, P.; Li, L. Enhanced Interfacial Adhesion of Polystyrene Bead Foams by Microwave Sintering for Microplastics Reduction. Ind. Eng. Chem. Res. 2021, 60, 8812. [Google Scholar] [CrossRef]
Disclaimer/Publisher’s Note: The statements, opinions and data contained in all publications are solely those of the individual author(s) and contributor(s) and not of MDPI and/or the editor(s). MDPI and/or the editor(s) disclaim responsibility for any injury to people or property resulting from any ideas, methods, instructions or products referred to in the content. |
© 2023 by the authors. Licensee MDPI, Basel, Switzerland. This article is an open access article distributed under the terms and conditions of the Creative Commons Attribution (CC BY) license (https://creativecommons.org/licenses/by/4.0/).