
Preparation and Characterization of Polycarbonate-Based Blend System with Favorable Mechanical Properties and 3D Printing Performance

 ,
,  , ,
, ,
Abstract
:1. Introduction
2. Experimental
2.1. Materials
2.2. Preparation of PC/PBAT and PC/PBAT/MBS Blends and Corresponding MEX Filaments
2.3. Preparation of 3D Printed Specimens
2.4. Preparation of Specimens by Injection Molding
2.5. Characterization
2.5.1. Torque Rheological Test
2.5.2. Capillary Rheological Test
2.5.3. Mechanical Test
2.5.4. Differential Scanning Calorimetry (DSC)
2.5.5. Thermal Gravimetric Analysis (TGA)
2.5.6. Dynamic Mechanical Analysis (DMA)
2.5.7. Vicat Softening Temperature (VST)
2.5.8. Scanning Electron Microscope (SEM)
3. Results and Discussion
3.1. Effect of PBAT on Processing Performance of PC/PBAT Blends
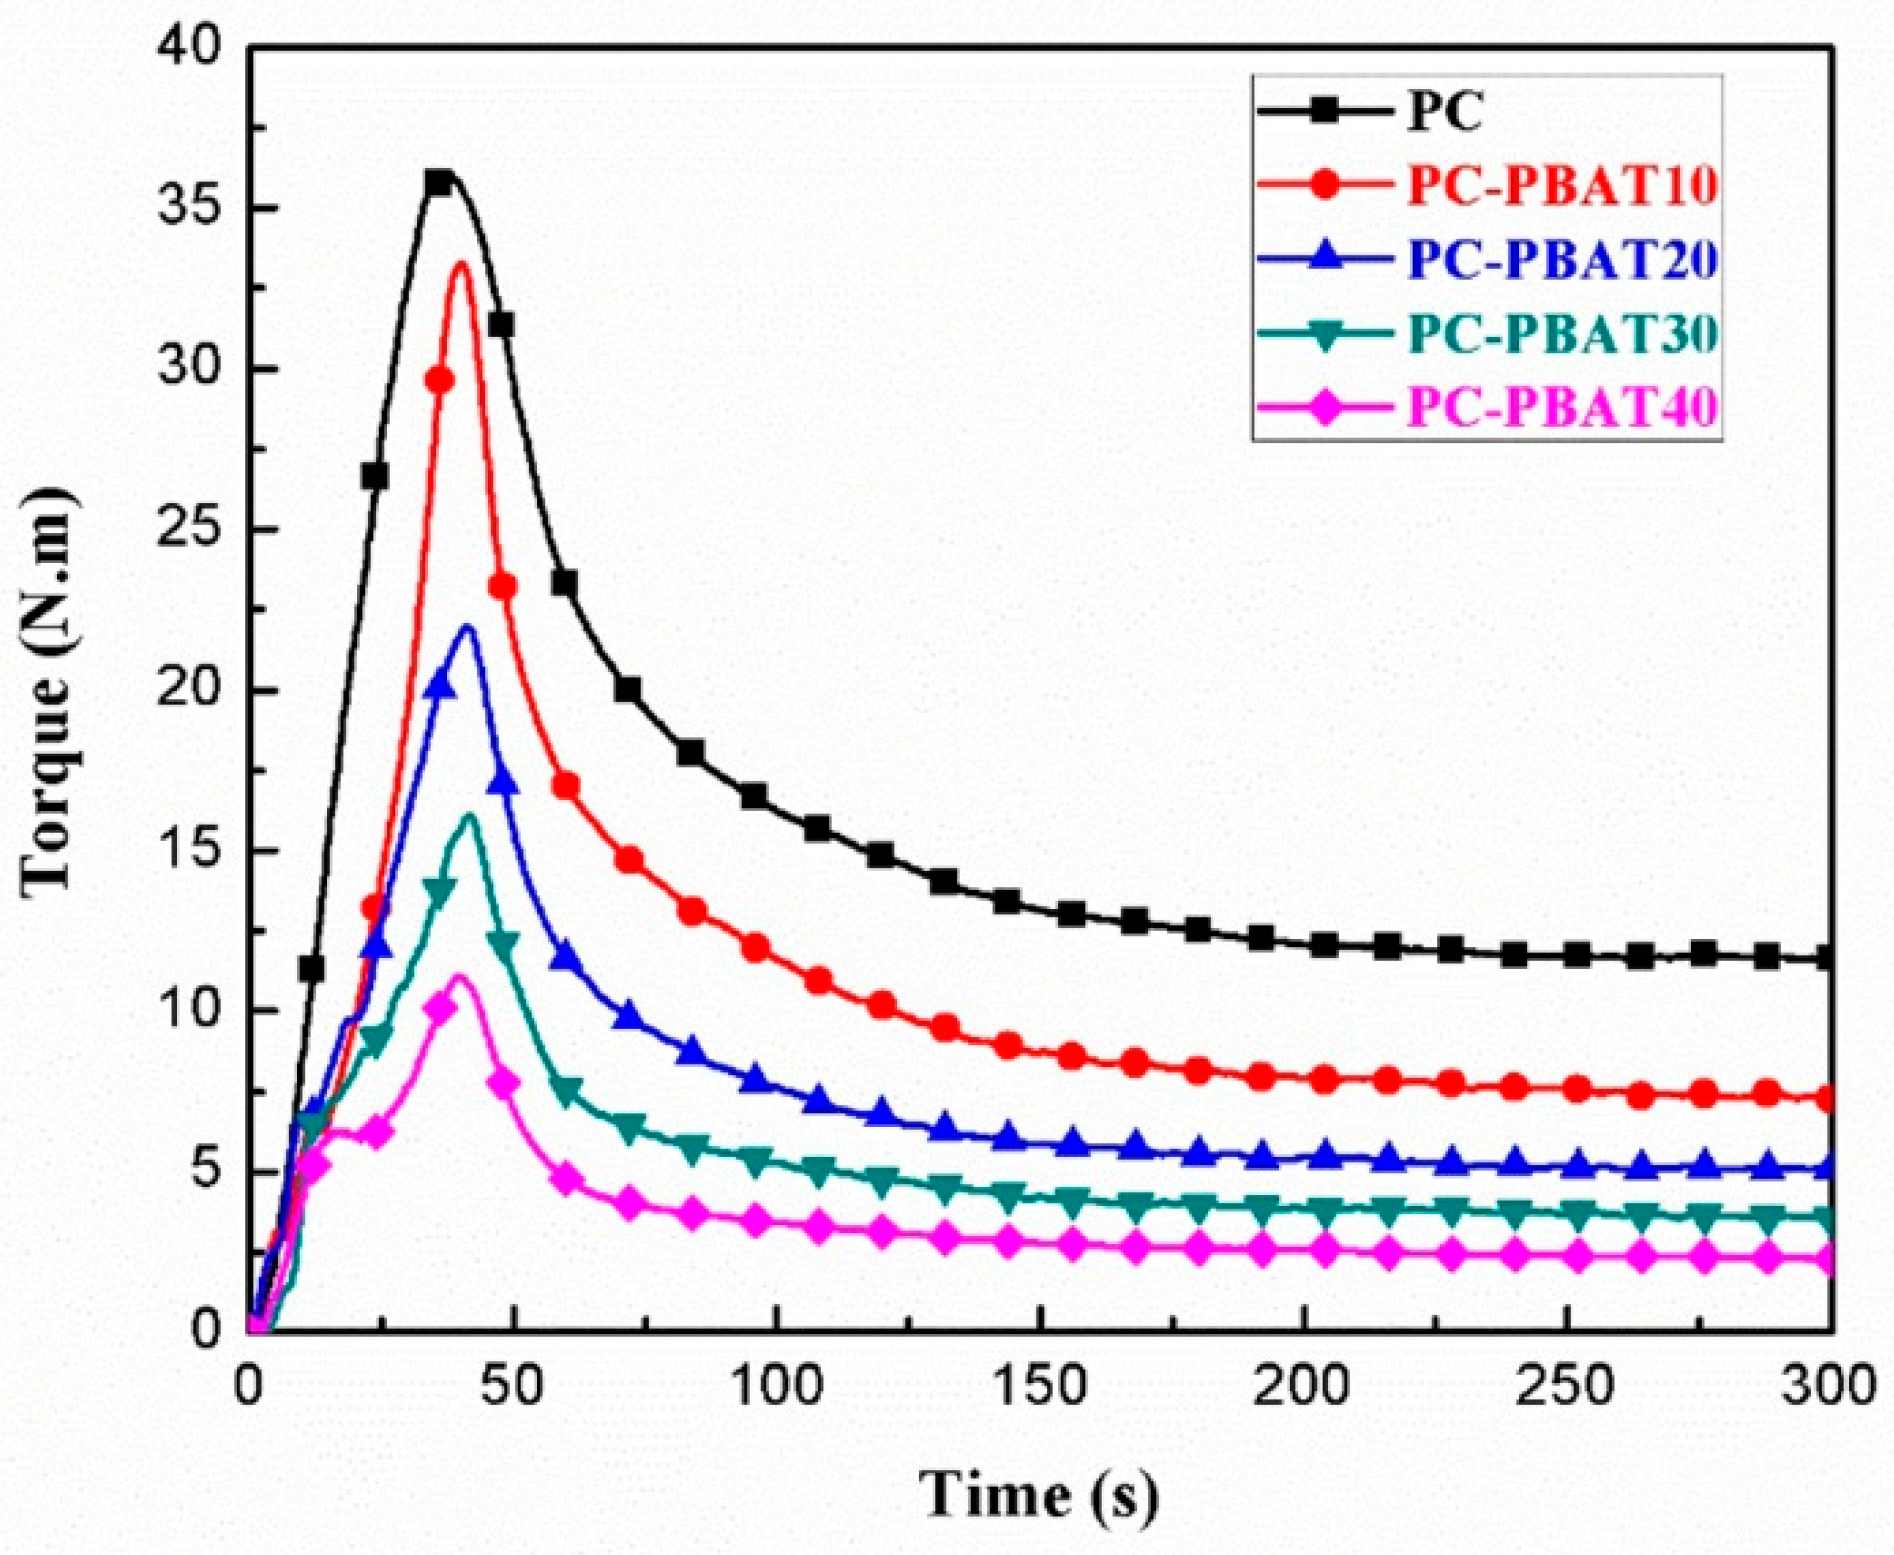
3.1.1. Processing Torque
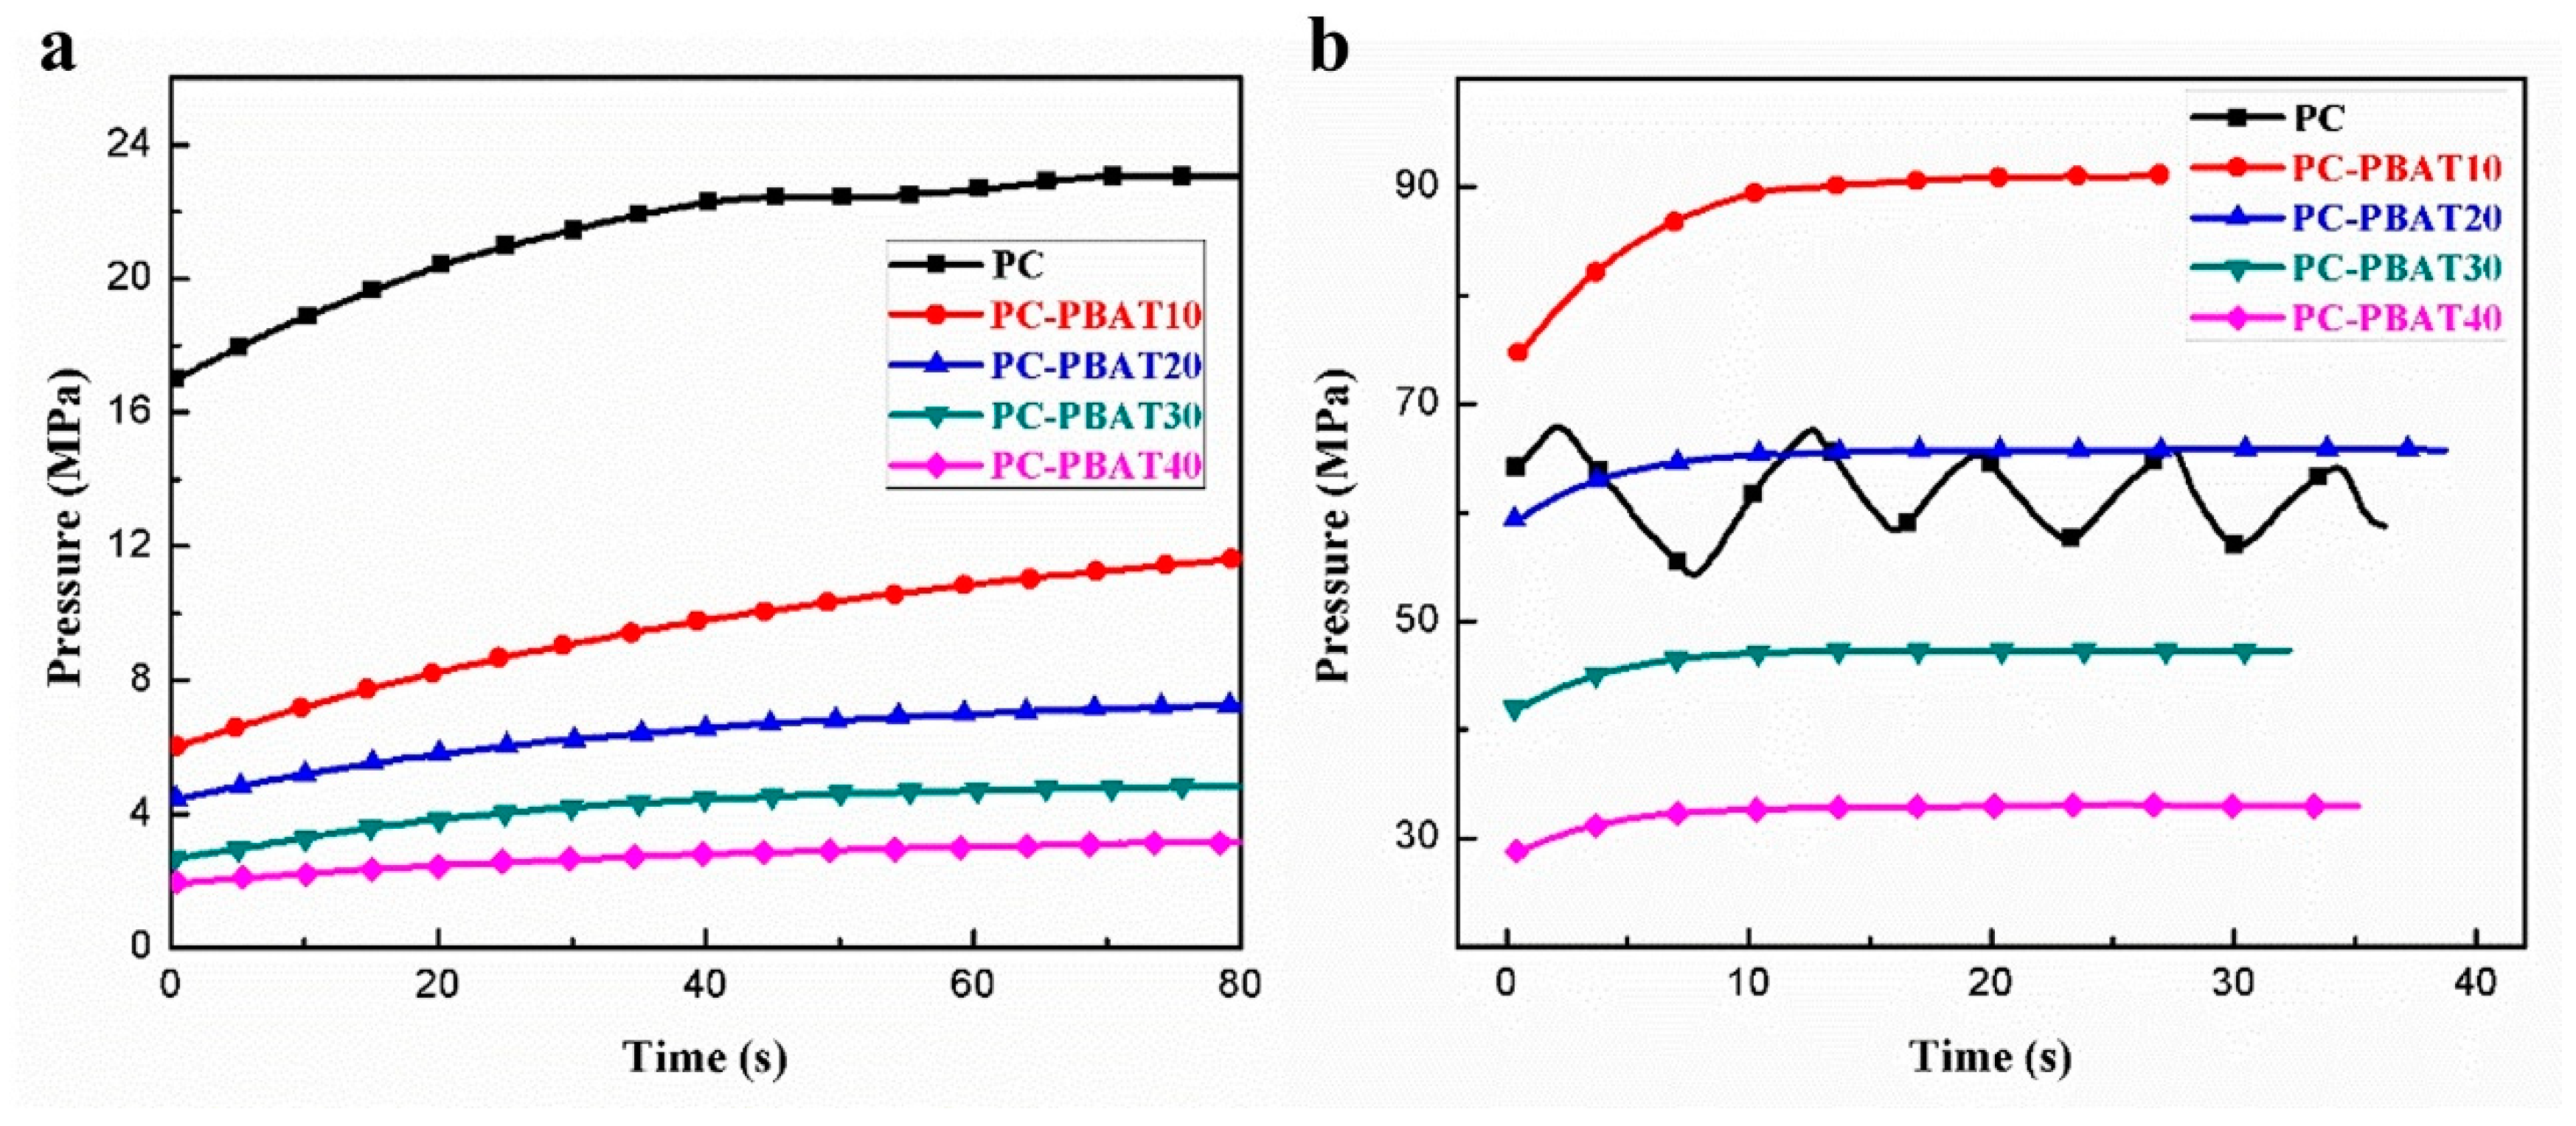
3.1.2. Capillary Rheological Properties
3.2. Effect of PBAT on Thermal Properties of PC/PBAT Blends
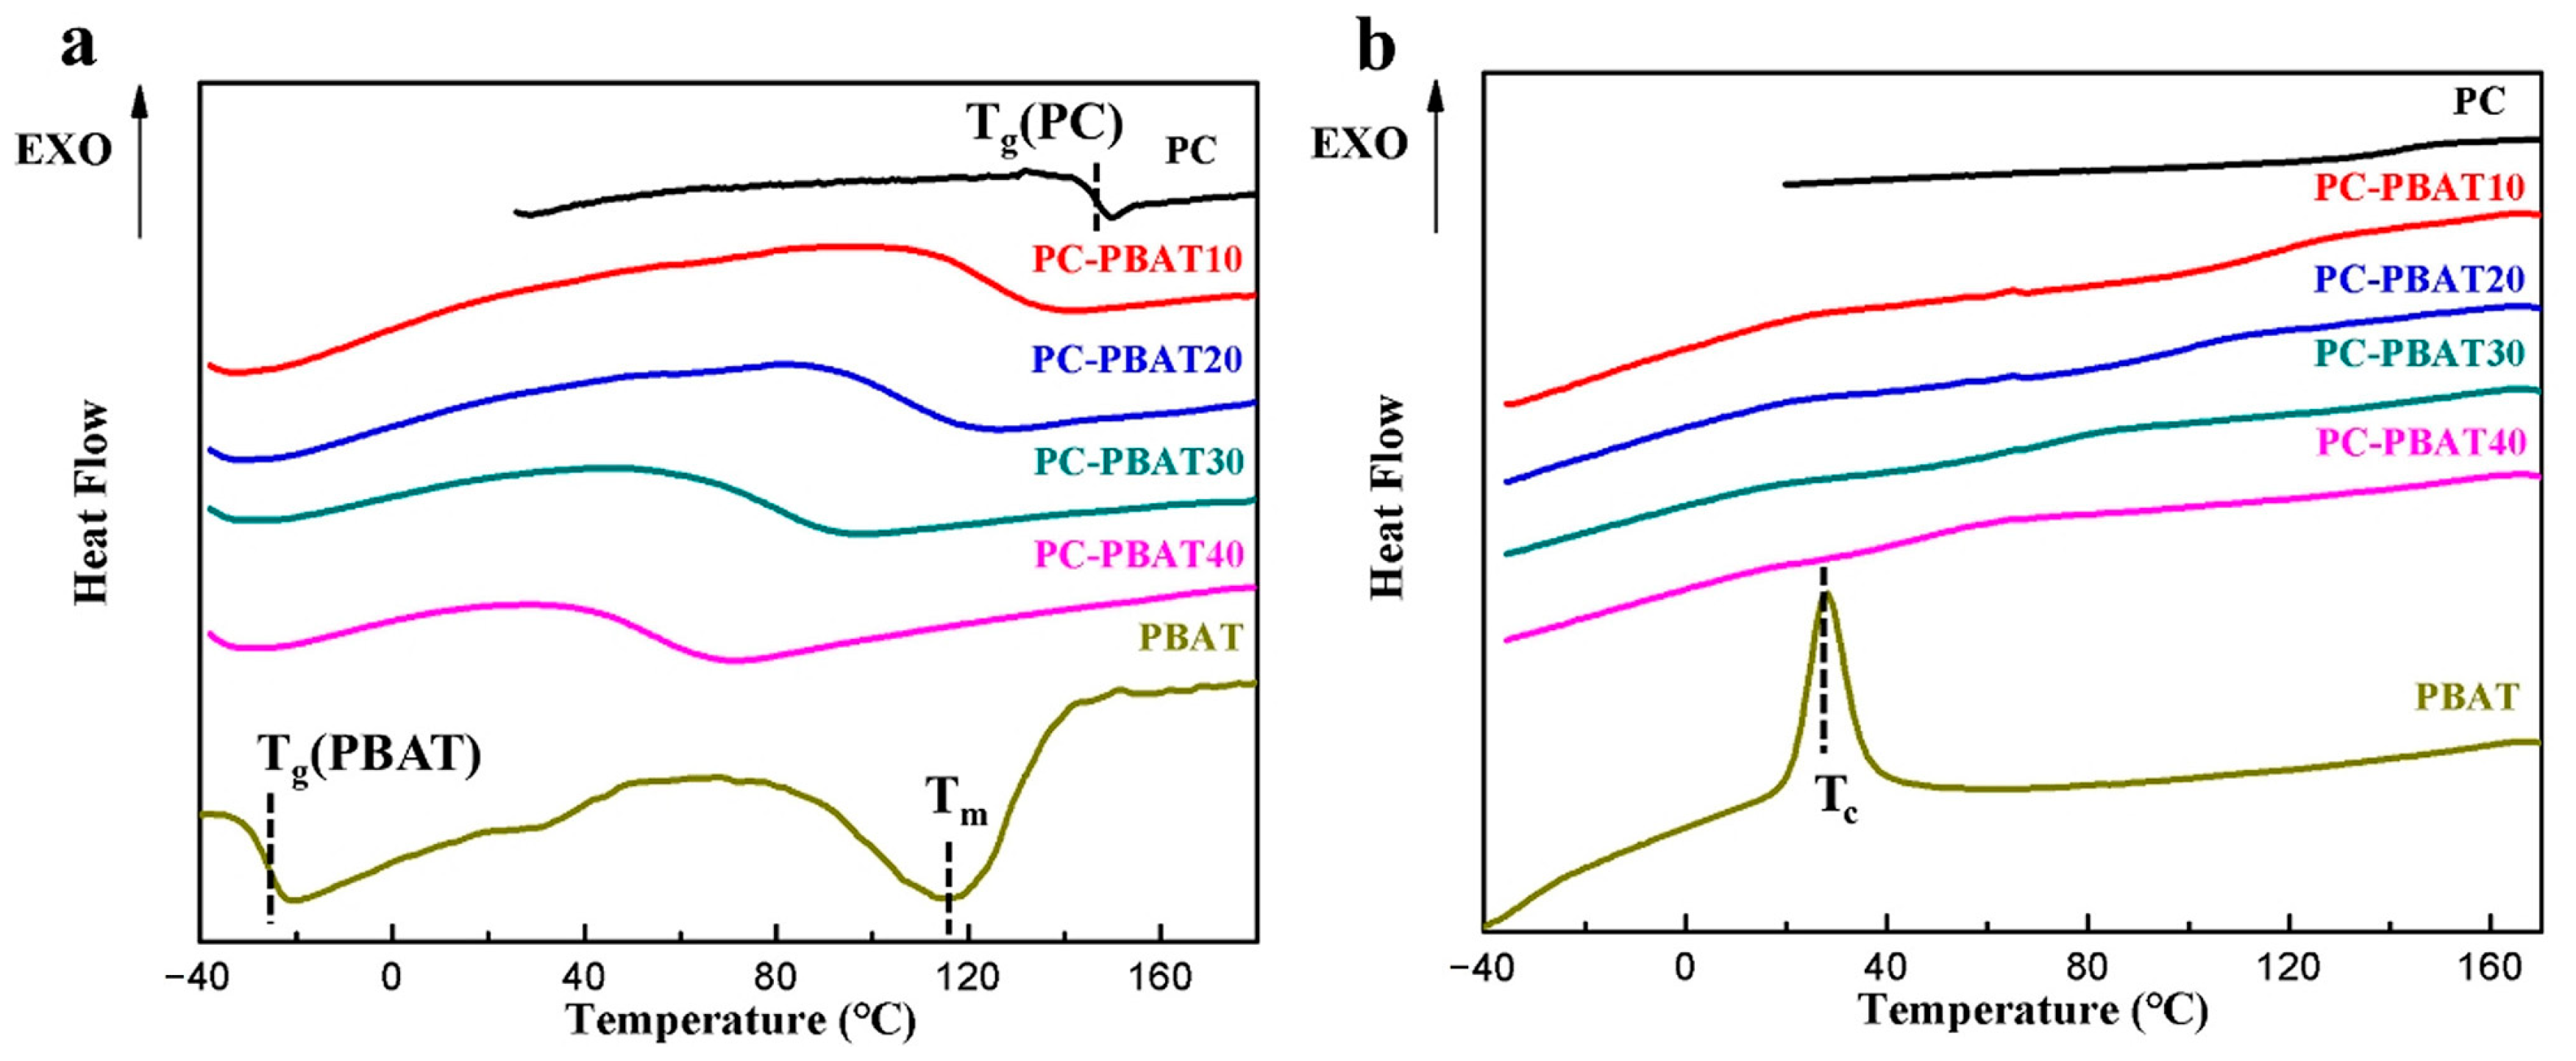
3.2.1. Melting and Crystallization Behavior
3.2.2. Dynamic Mechanical Performance
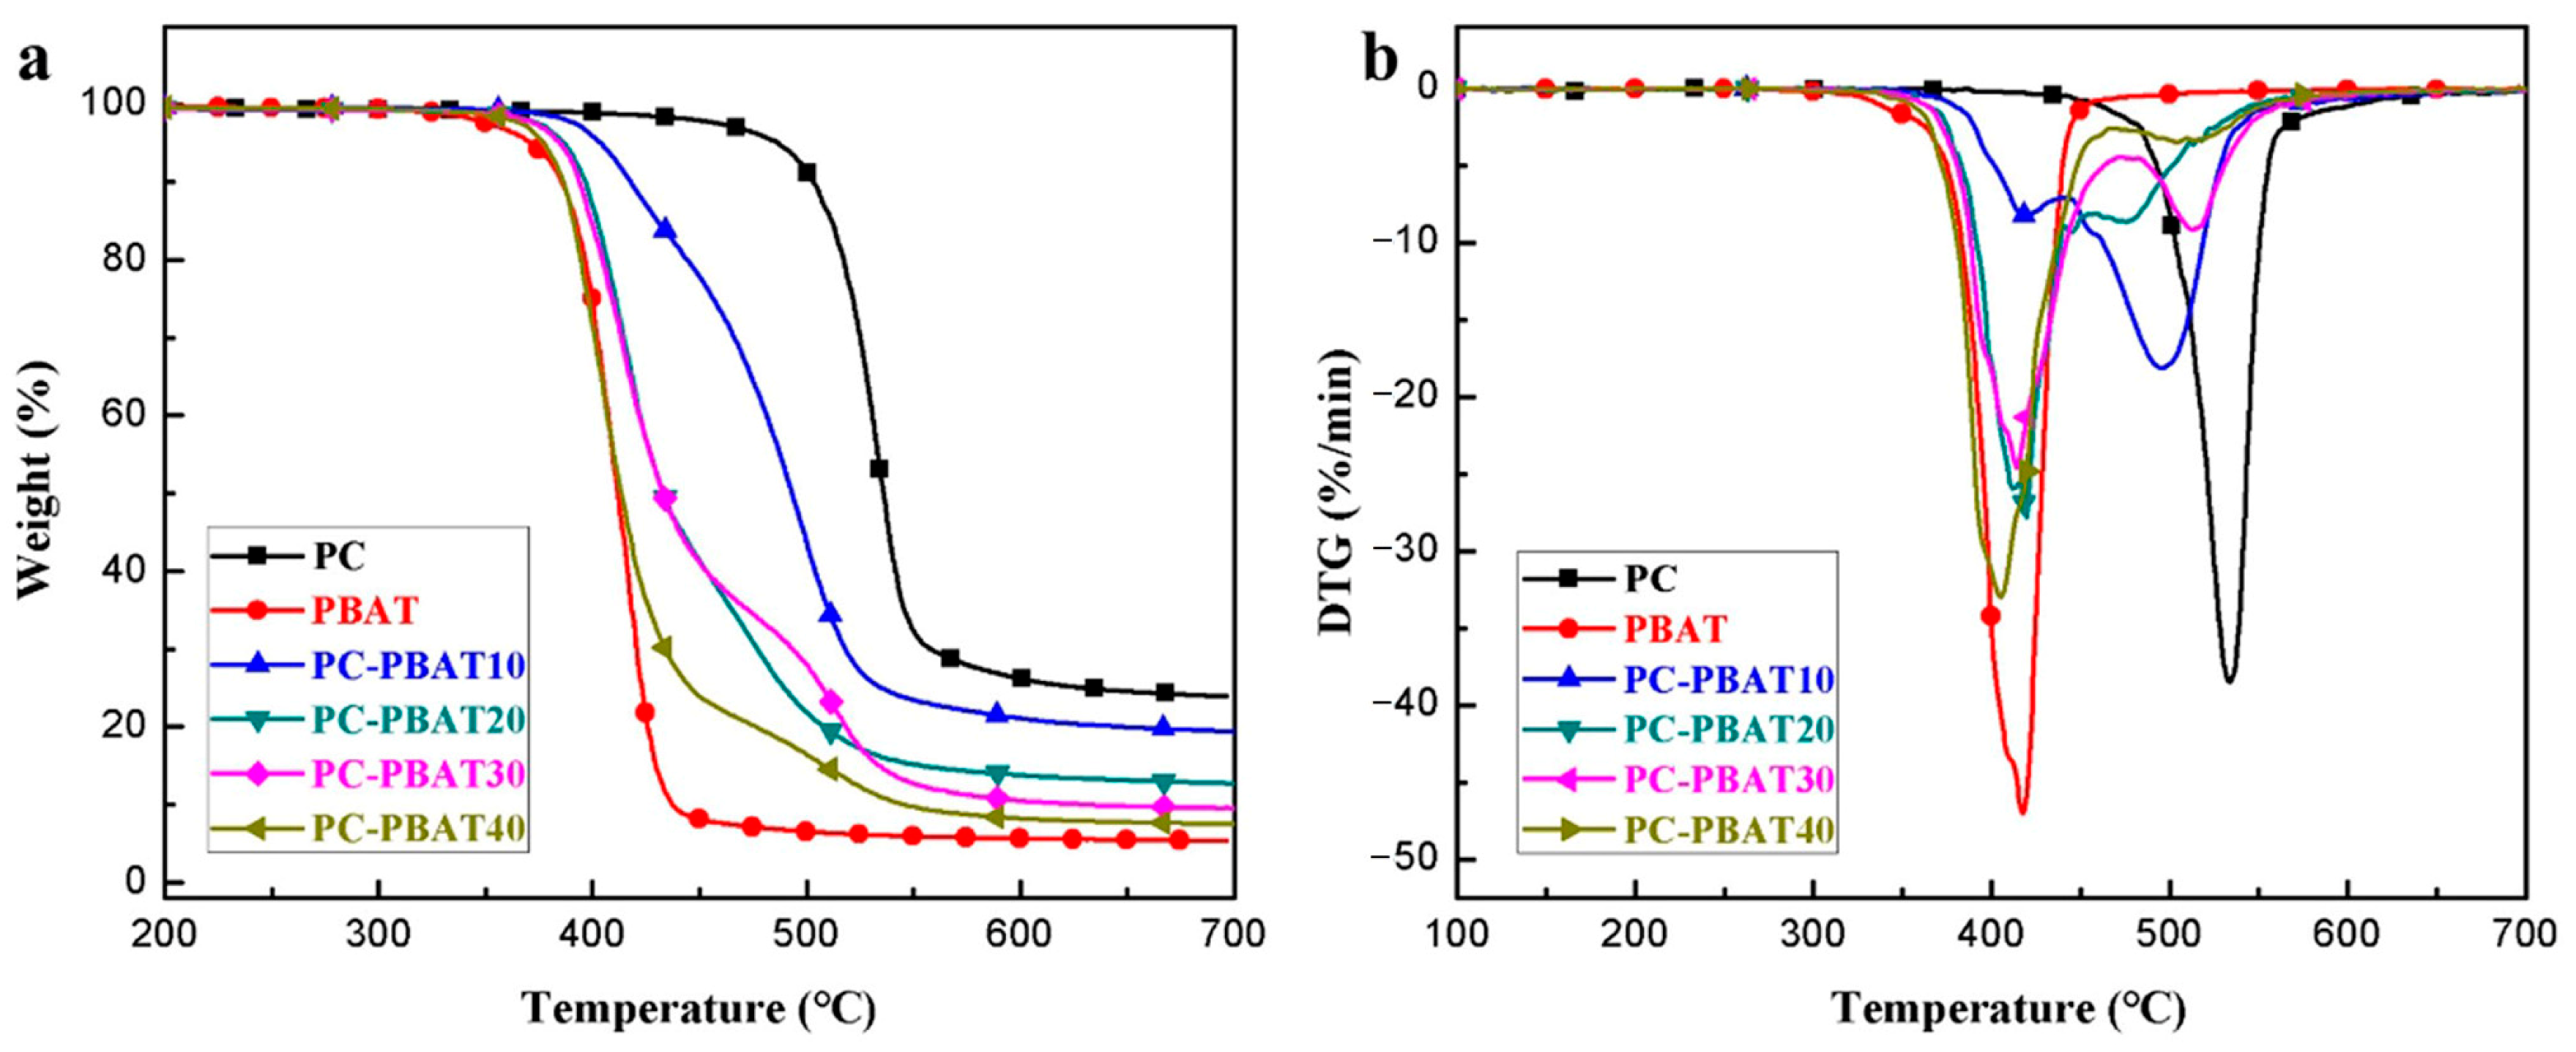
3.2.3. Thermal Decomposition Behavior
3.2.4. Heat Resistance
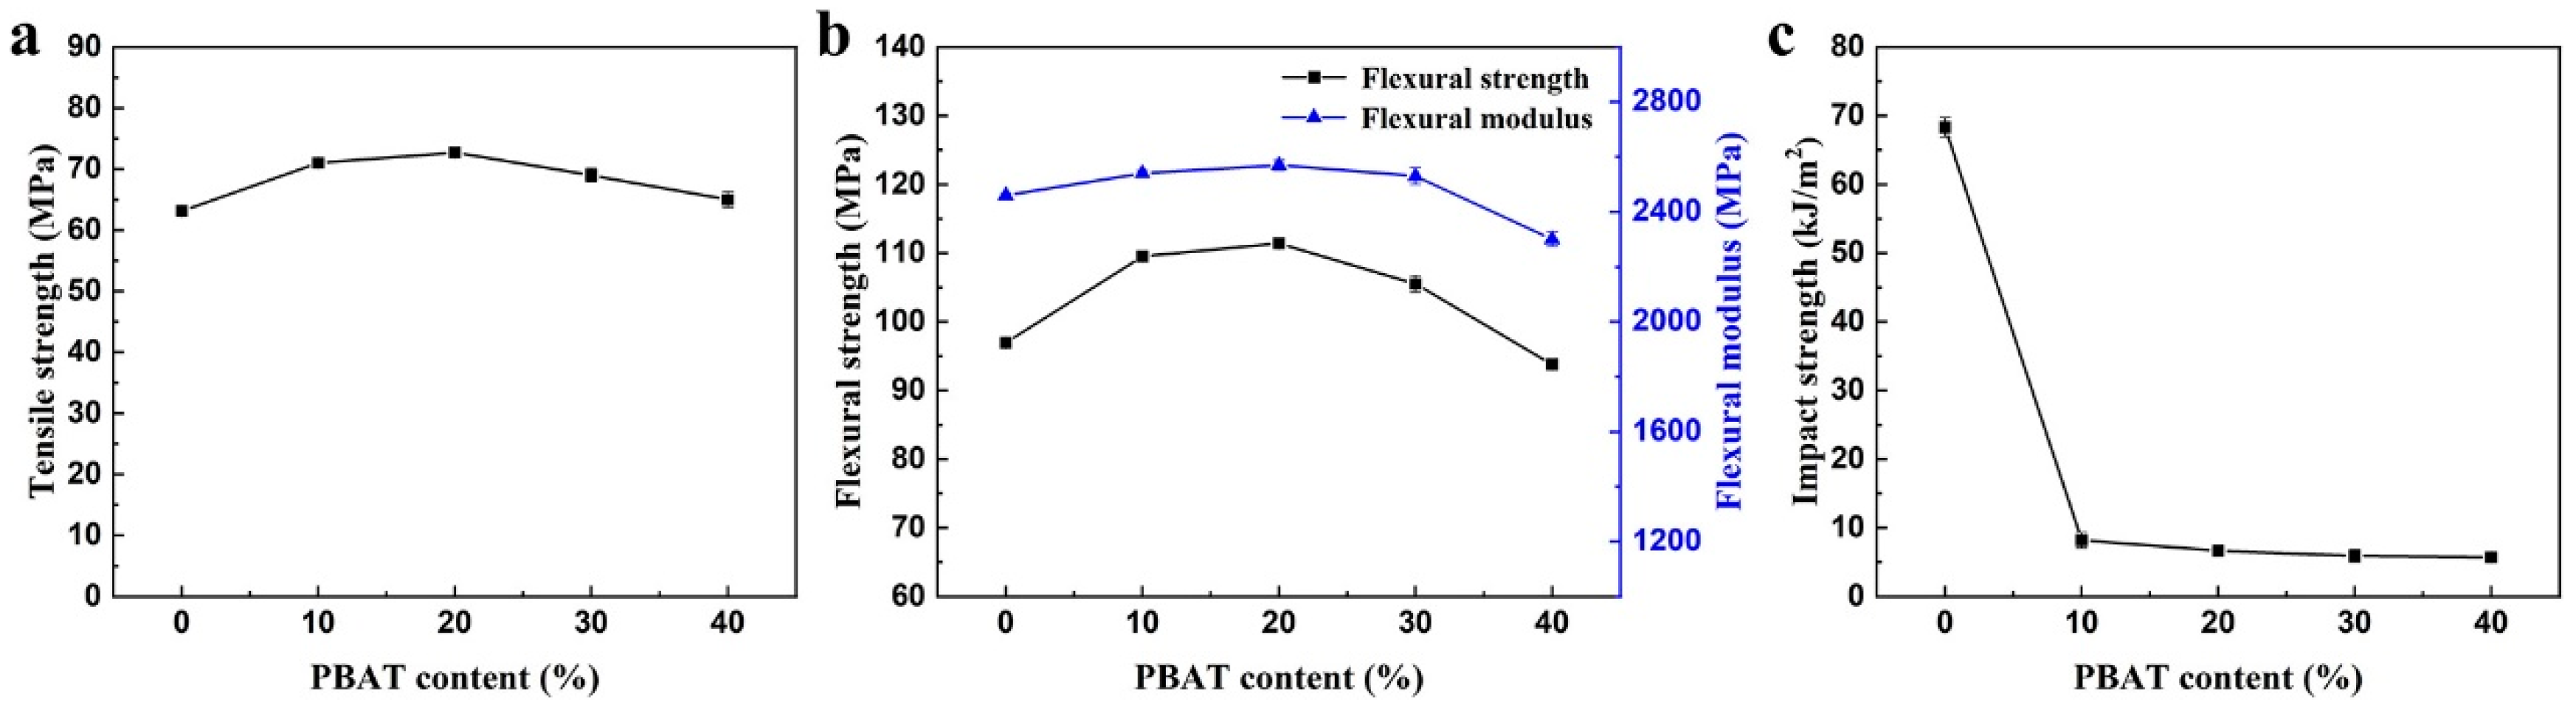
3.3. Effect of PBAT on Mechanical Properties of PC/PBAT Blends
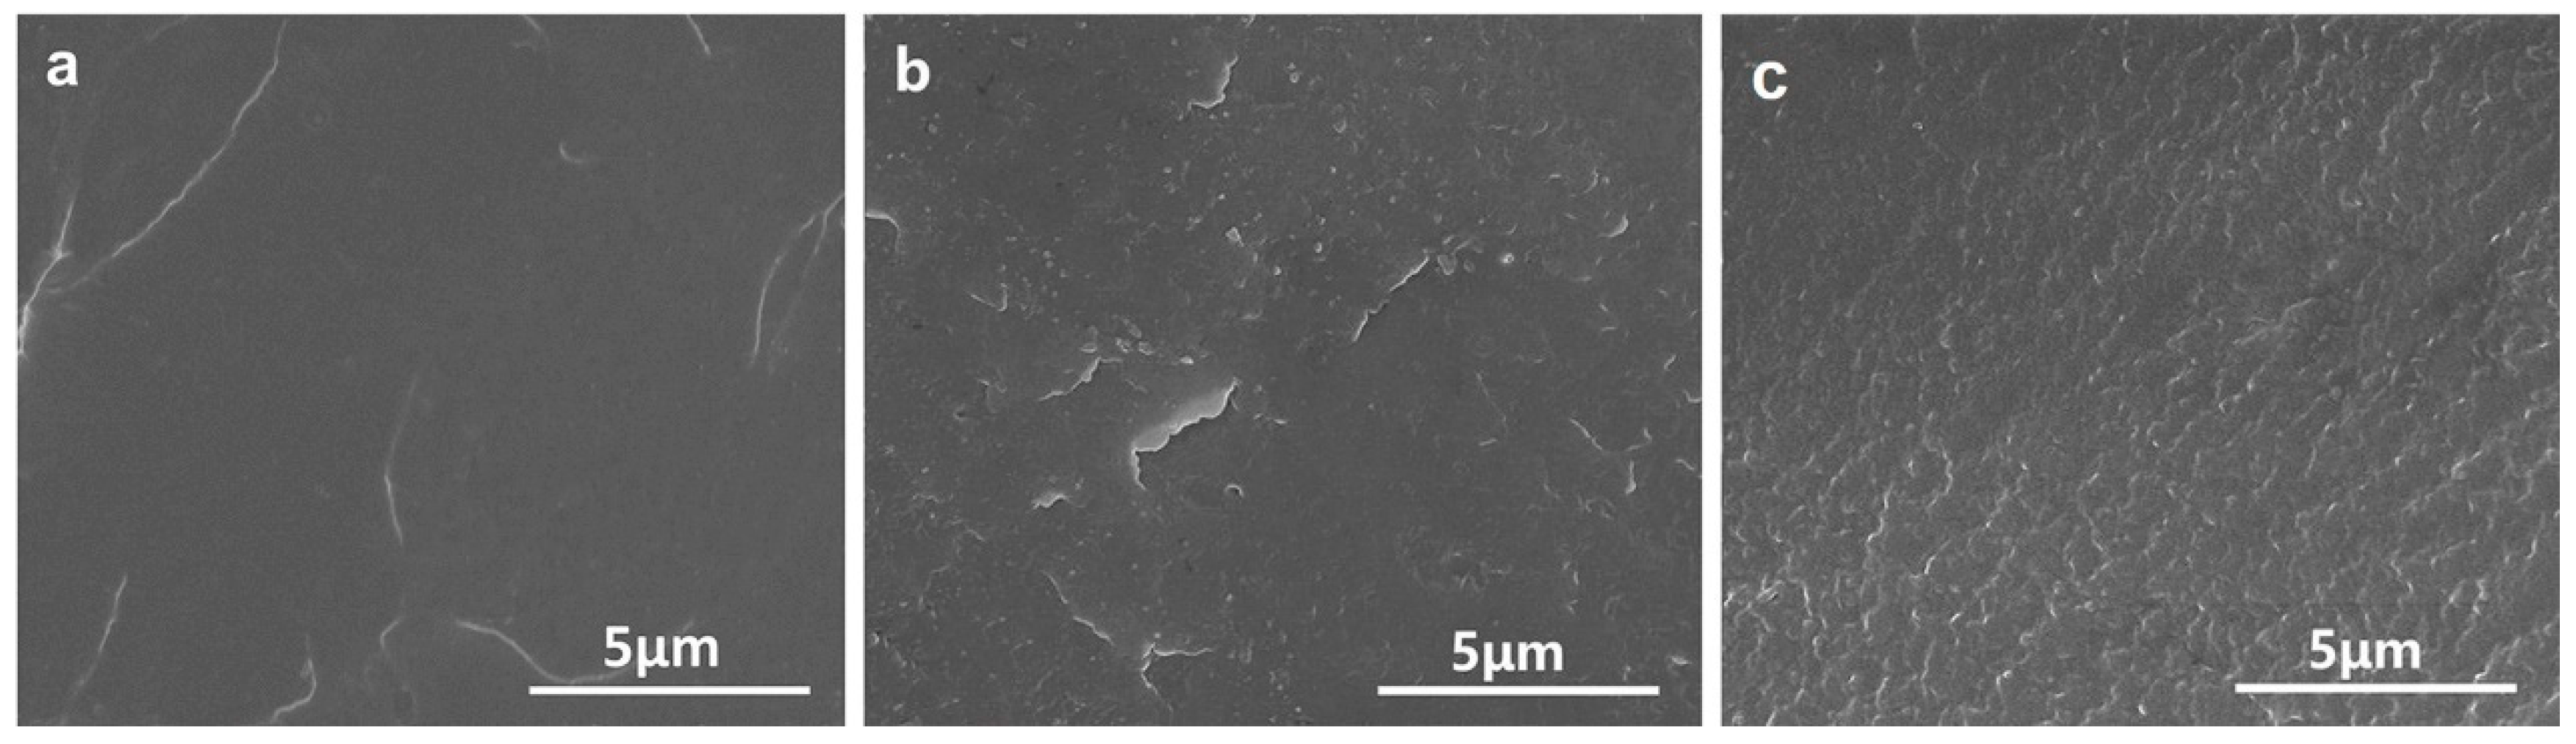
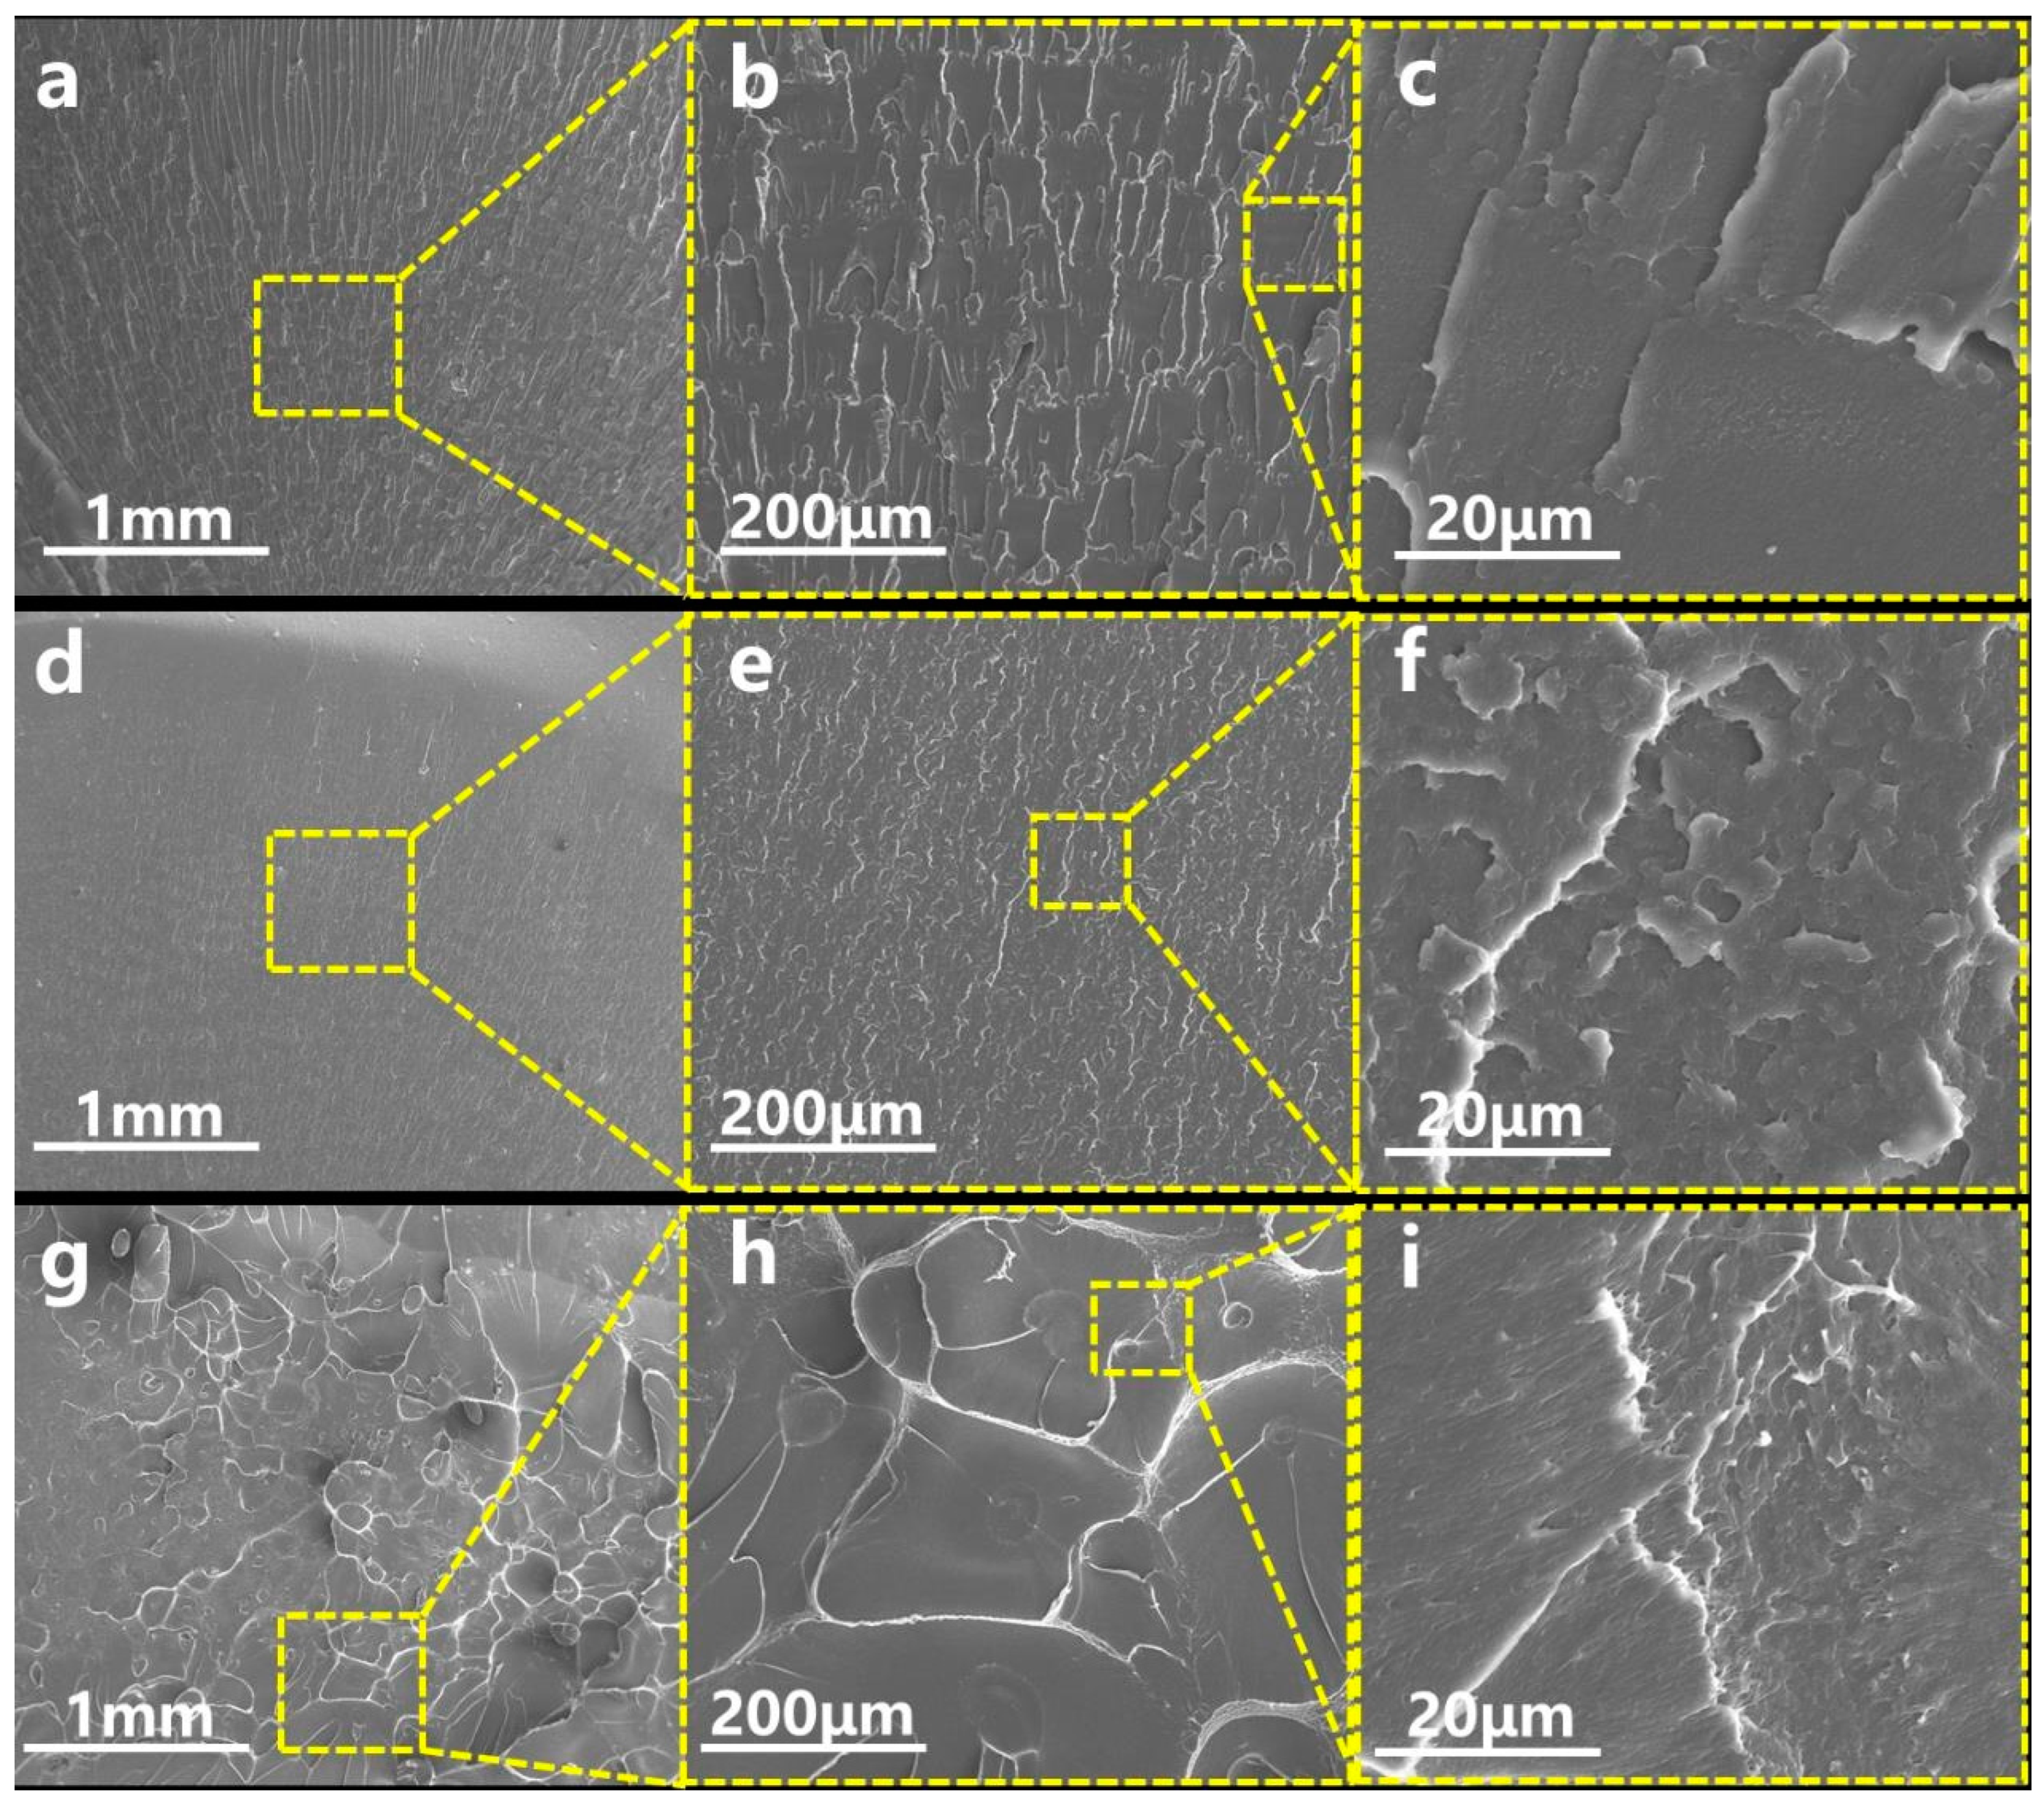
3.4. Morphology of PC/PBAT Blends
3.5. The 3D Printing Performance of the PC/PBAT Blends
3.6. Effect of MBS on Properties of PC/PBAT Blends
3.6.1. Mechanical Properties
3.6.2. Morphology
3.6.3. The 3D Printing Performance
4. Conclusions
Supplementary Materials
Author Contributions
Funding
Institutional Review Board Statement
Data Availability Statement
Conflicts of Interest
References
- Wu, X.; Li, J.; Yao, L.; Xu, Z. Auto-sorting commonly recovered plastics from waste household appliances and electronics using near-infrared spectroscopy. J. Clean. Prod. 2020, 246, 118732. [Google Scholar] [CrossRef]
- Yang, B.; Lu, L.; Liu, X.; Xie, Y.; Li, J.; Tang, Y. Uniaxial tensile and impact investigation of carbon-fabric/polycarbonate composites with different weave tow widths. Mater. Des. 2017, 131, 470–480. [Google Scholar] [CrossRef]
- Gómez-Gras, G.; Abad, M.D.; Pérez, M.A. Mechanical performance of 3D-printed biocompatible polycarbonate for biomechanical applications. Polymers 2021, 13, 3669. [Google Scholar] [CrossRef] [PubMed]
- Park, S.J.; Lee, J.E.; Lee, H.B.; Park, J.; Lee, N.K.; Son, Y.; Park, S.H. 3D printing of bio-based polycarbonate and its potential applications in ecofriendly indoor manufacturing. Addit. Manuf. 2020, 31, 100974. [Google Scholar] [CrossRef]
- Zhu, Y.; Yu, R.; Wang, S.; Xing, H.; Qiu, J.; Liu, J.; Tang, T. Unexpected core-shell char from polycarbonate/polyborosiloxane composites and its application in improving flame retardancy. Chem. Eng. J. 2022, 446, 136742. [Google Scholar] [CrossRef]
- Goh, G.D.; Toh, W.; Yap, Y.L.; Ng, T.Y.; Yeong, W.Y. Additively manufactured continuous carbon fiber-reinforced thermoplastic for topology optimized unmanned aerial vehicle structures. Compos. B Eng. 2021, 216, 108840. [Google Scholar] [CrossRef]
- Bergsma, J.M.; van der Zalm, M.; Pruyn, J.F. 3D-printing and the maritime construction sector. In Proceedings of the 10th Symposium on High-Performance Marine Vehicles, HIPER, Cortona, Italy, 17–19 October 2016; Volume 16, pp. 428–442. [Google Scholar]
- Tetsuka, H.; Shin, S.R. Materials and technical innovations in 3D printing in biomedical applications. J. Mater. Chem. B 2020, 8, 2930–2950. [Google Scholar] [CrossRef]
- Wickramasinghe, S.; Do, T.; Tran, P. FDM-based 3D printing of polymer and associated composite: A review on mechanical properties, defects and treatments. Polymers 2020, 12, 1529. [Google Scholar] [CrossRef] [PubMed]
- Liu, Z.; Wang, Y.; Wu, B.; Cui, C.; Guo, Y.; Yan, C. A critical review of fused deposition modeling 3D printing technology in manufacturing polylactic acid parts. Int. J. Adv. Manuf. Technol. 2019, 102, 2877–2889. [Google Scholar] [CrossRef]
- Rahim, T.N.A.T.; Abdullah, A.M.; Akil, H.M. Recent developments in fused deposition modeling-based 3D printing of polymers and their composites. Polym. Rev. 2019, 59, 589–624. [Google Scholar] [CrossRef]
- Valino, A.D.; Dizon, J.R.C.; Espera, A.H.; Chen, Q.; Messman, J.; Advincula, R.C. Advances in 3D printing of thermoplastic polymer composites and nanocomposites. Prog. Polym. Sci. 2019, 98, 101162. [Google Scholar] [CrossRef]
- Huang, B.; Meng, S.; He, H.; Jia, Y.; Xu, Y.; Huang, H. Study of processing parameters in fused deposition modeling based on mechanical properties of acrylonitrile-butadiene-styrene filament. Polym. Eng. Sci. 2019, 59, 120–128. [Google Scholar] [CrossRef]
- Liu, H.; He, H.; Peng, X.; Huang, B.; Li, J. Three-dimensional printing of poly (lactic acid) bio-based composites with sugarcane bagasse fiber: Effect of printing orientation on tensile performance. Polym. Adv. Technol. 2019, 30, 910–922. [Google Scholar] [CrossRef]
- Wu, J.; Chen, N.; Wang, Q. Preparation of novel thermoplastic poly(vinyl alcohol) with improved processability for fused deposition modeling. Polym. Adv. Technol. 2018, 29, 1447–1455. [Google Scholar] [CrossRef]
- Geng, Y.; He, H.; Liu, H.; Jing, H. Preparation of polycarbonate/poly (lactic acid) with improved printability and processability for fused deposition modeling. Polym. Adv. Technol. 2020, 31, 2848–2862. [Google Scholar] [CrossRef]
- Roberson, D.; Shemelya, C.M.; Macdonald, E.; Wicker, R. Expanding the applicability of FDM-type technologies through materials development. Rapid Prototyp. J. 2015, 21, 137–143. [Google Scholar] [CrossRef]
- Fidan, I.; Huseynov, O.; Ali, M.A.; Alkunte, S.; Rajeshirke, M.; Gupta, A.; Hasanov, S.; Tantawi, K.; Yasa, E.; Yilmaz, O.; et al. Recent inventions in additive manufacturing: Holistic review. Inventions 2023, 8, 103. [Google Scholar] [CrossRef]
- Goh, G.D.; Yap, Y.L.; Tan, H.K.J.; Sing, S.L.; Goh, G.L.; Yeong, W.Y. Process-structure-properties in polymer additive manufacturing via material extrusion: A review. Crit. Rev. Solid State Mater. Sci. 2020, 45, 113–133. [Google Scholar] [CrossRef]
- Jia, Y.; He, H.; Geng, Y.; Huang, B.; Peng, X. High through-plane thermal conductivity of polymer based product with vertical alignment of graphite flakes achieved via 3D printing. Compos. Sci. Technol. 2017, 145, 55–61. [Google Scholar] [CrossRef]
- Peng, X.; He, H.; Jia, Y.; Liu, H.; Geng, Y.; Huang, B.; Luo, C. Shape memory effect of three-dimensional printed products based on polypropylene/nylon 6 alloy. J. Mater. Sci. 2019, 54, 9235–9246. [Google Scholar] [CrossRef]
- Spoerk, M.; Sapkota, J.; Weingrill, G.; Fischinger, T.; Arbeiter, F.; Holzer, C. Shrinkage and warpage optimization of expanded-perlite-filled polypropylene composites in extrusion-based additive manufacturing. Macromol. Mater. Eng. 2017, 302, 1700143. [Google Scholar] [CrossRef]
- Ryu, S.C.; Kim, J.Y.; Kim, W.N. Relationship between the interfacial tension and compatibility of polycarbonate and poly(acrylonitrile–butadiene–styrene) blends with reactive compatibilizers. J. Appl. Polym. Sci. 2018, 135, 46418. [Google Scholar] [CrossRef]
- Kannan, S.; Ramamoorthy, M. Mechanical characterization and experimental modal analysis of 3D printed ABS, PC and PC-ABS materials. Mater. Res. Express 2020, 7, 015341. [Google Scholar] [CrossRef]
- Phuong, V.T.; Gigante, V.; Aliotta, L.; Coltelli, M.B.; Cinelli, P.; Lazzeri, A. Reactively extruded ecocomposites based on poly(lactic acid)/bisphenol A polycarbonate blends reinforced with regenerated cellulose microfibers. Compos. Sci. Technol. 2017, 139, 127–137. [Google Scholar] [CrossRef]
- Li, J.; Wang, X.; Yang, C.; Yang, J.; Wang, Y.; Zhang, J. Toughening modification of polycarbonate/poly (butylene terephthalate) blends achieved by simultaneous addition of elastomer particles and carbon nanotubes. Compos. A Appl. Sci. Manuf. 2016, 90, 200–210. [Google Scholar] [CrossRef]
- Zhang, S.; Zhang, H.; Zhang, W.; Wu, Z.; Chen, F.; Fu, Q. Toughening of polycarbonate through reactive melt blending: Effect of hydroxyl content and viscosity of hydroxyl-terminated polydimethysiloxane. Chin. J. Polym. Sci. 2014, 32, 823–833. [Google Scholar] [CrossRef]
- Yemisci, F.; Aytac, A. Compatibilization of poly (lactic acid)/polycarbonate blends by different coupling agents. Fiber. Polym. 2017, 18, 1445–1451. [Google Scholar] [CrossRef]
- Lee, J.B.; Lee, Y.K.; Choi, G.D.; Na, S.W.; Park, T.S.; Kim, W.N. Compatibilizing effects for improving mechanical properties of biodegradable poly (lactic acid) and polycarbonate blends. Polym. Degrad. Stabil. 2011, 96, 553–560. [Google Scholar] [CrossRef]
- Ganguly, A.; Channe, P.; Jha, R.; Mitra, S.; Saha, S. Review on transesterification in polycarbonate-poly(butylene terephthalate) blend. Polym. Eng. Sci. 2021, 61, 650–661. [Google Scholar] [CrossRef]
- Liu, C.; Lin, S.; Zhou, C.; Yu, W. Influence of catalyst on transesterification between poly (lactic acid) and polycarbonate under flow field. Polymer 2013, 54, 310–319. [Google Scholar] [CrossRef]
- ISO 527-2:2012(E); Plastics-Determination of Tensile Properties—Part 2: Test conditions for Moulding and Extrusion Plastics. International Organization for Standardization: Geneva, Switzerland, 2012.
- ISO 178:2010(E); Plastics-Determination of Flexural Properties. International Organization for Standardization: Geneva, Switzerland, 2010.
- GB/T 1843-2008; Plastics-Determination of Izod Impact Strength. Standardization Administration of China: Beijing, China, 2008.
- GB/T 1633-2000; Plastics-Thermoplastic Materials-Determination of Vicat Softening Temperature. Standardization Administration of China: Beijing, China, 2000.
- Brostow, W.; Chiu, R.; Kalogeras, I.M.; Vassilikou-Dova, A. Prediction of glass transition temperatures: Binary blends and copolymers. Mater. Lett. 2008, 62, 3152–3155. [Google Scholar] [CrossRef]
- Sharifi, M.; Jang, C.; Abrams, C.F.; Palmese, G.R. Epoxy polymer networks with improved thermal and mechanical properties via controlled dispersion of reactive toughening agents. Macromolecules 2015, 48, 7495–7502. [Google Scholar] [CrossRef]
- Spoerk, M.; Holzer, C.; Gonzalez-Gutierrez, J. Material extrusion-based additive manufacturing of polypropylene: A review on how to improve dimensional inaccuracy and warpage. J. Appl. Polym. Sci. 2020, 137, 48545. [Google Scholar] [CrossRef]
- Zhang, H.; Liu, N.; Ran, X.; Han, C.; Han, L.; Zhuang, Y.; Dong, L. Toughening of polylactide by melt blending with methyl methacrylate-butadiene-styrene copolymer. J. Appl. Polym. Sci. 2012, 125, E550–E561. [Google Scholar] [CrossRef]
- Chang, E.; Zhao, J.; Zhao, C.; Li, G.; Lee, P.C.; Park, C.B. Scalable production of crosslinked rubber nanofibre networks as highly efficient toughening agent for isotactic polypropylene: Toughening mechanism of Non-traditional anisotropic rubber inclusion. Chem. Eng. J. 2022, 438, 134060. [Google Scholar] [CrossRef]


| Sample | PC (%) | PBAT (%) |
|---|---|---|
| PC | 100 | 0 |
| PC-PBAT10 | 90 | 10 |
| PC-PBAT20 | 80 | 20 |
| PC-PBAT30 | 70 | 30 |
| PC-PBAT40 | 60 | 40 |
| Sample | Matrix (100 phr) | MBS (phr) | |
|---|---|---|---|
| PC (%) | PBAT (%) | ||
| PC-PBAT30/MBS-2 | 70 | 30 | 2 |
| PC-PBAT30/MBS-4 | 70 | 30 | 4 |
| PC-PBAT30/MBS-6 | 70 | 30 | 6 |
| PC-PBAT30/MBS-8 | 70 | 30 | 8 |
| Parameter | Nozzle Diameter | Nozzle Temperature | Printing Speed | Layer Thickness | Raster Angle | Infill Density | Platform Temperature |
|---|---|---|---|---|---|---|---|
| Value | 0.5 mm | 250 °C | 20 mm/s | 0.1 mm | 45°/−45° | 100% | 90 °C |
| PBAT Content (%) | 0 | 10 | 20 | 30 | 40 |
|---|---|---|---|---|---|
| Equilibrium torque | 11.7 | 7.2 | 4.9 | 3.5 | 2.2 |
| Maximum torque | 35.8 | 33.3 | 21.9 | 16.1 | 11.1 |
| Sample | Tg (°C) | Tg* (°C) |
|---|---|---|
| PC | 147.0 | 147.0 |
| PC-PBAT10 | 121.1 | 121.9 |
| PC-PBAT20 | 107.9 | 97.2 |
| PC-PBAT30 | 82.1 | 75.5 |
| PC-PBAT40 | 59.1 | 56.2 |
| PBAT | –26.3 | –26.3 |
| Sample | Storage Modulus at 25 °C (MPa) | Tan δ Peak Temperature (°C) |
|---|---|---|
| PC | 1795 | 170.0 |
| PC-PBAT10 | 2286 | 163.6 |
| PC-PBAT20 | 2382 | 139.8 |
| PC-PBAT30 | 2471 | 114.2 |
| PC-PBAT40 | 2498 | 97.7 |
| PBAT | 110 | −9.4 |
| Sample | Tonset (°C) | Tmax1 (°C) | Tmax2 (°C) | Residue (%) |
|---|---|---|---|---|
| PC | 486.7 | - | 533.6 | 23.9 |
| PC-PBAT10 | 403.8 | 418.5 | 495.6 | 19.5 |
| PC-PBAT20 | 386.5 | 419.4 | 475.7 | 12.8 |
| PC-PBAT30 | 384.6 | 414.1 | 512.7 | 9.6 |
| PC-PBAT40 | 377.1 | 405.1 | 509.3 | 7.5 |
| PBAT | 371.2 | 417.6 | - | 5.4 |
| PBAT Content (%) | 0 | 10 | 20 | 30 | 40 |
|---|---|---|---|---|---|
| VST (°C) | 148.2 | 116.3 | 95.9 | 78.5 | 67.0 |
| Sample | Platform Temperature (°C) | Tg (°C) | Adhere to the Platform | Warping Degree | Image of the 3D Printed Specimen |
|---|---|---|---|---|---|
| PC | 110 | 147.0 | No | Unable to print | None |
| PC-PBAT10 | 110 | 121.1 | No | Unable to print | None |
| PC-PBAT20 | 110 | 107.9 | Yes | Very low |  |
| PC-PBAT30 | 90 | 82.1 | Yes | Very low |  |
| PC-PBAT40 | 70 | 59.1 | Yes | Very low | 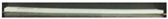 |
| Sample | Adhere to the Platform | Warping Degree | Image of the 3D Printed Specimen |
|---|---|---|---|
| PC-PBAT30 | Yes | Very low | 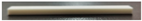 |
| PC-PBAT30/MBS-2 | Yes | Very low |  |
| PC-PBAT30/MBS-4 | Yes | Very low |  |
| PC-PBAT30/MBS-6 | Yes | Very low | 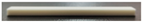 |
| PC-PBAT30/MBS-8 | Yes | Very low | 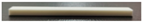 |
Disclaimer/Publisher’s Note: The statements, opinions and data contained in all publications are solely those of the individual author(s) and contributor(s) and not of MDPI and/or the editor(s). MDPI and/or the editor(s) disclaim responsibility for any injury to people or property resulting from any ideas, methods, instructions or products referred to in the content. |
© 2023 by the authors. Licensee MDPI, Basel, Switzerland. This article is an open access article distributed under the terms and conditions of the Creative Commons Attribution (CC BY) license (https://creativecommons.org/licenses/by/4.0/).
Share and Cite
Liu, H.; Chen, S.; Li, C.; Chen, X.; Li, J.; Chen, P.; Xie, F.; Jian, H.; Huang, X.; Liu, L. Preparation and Characterization of Polycarbonate-Based Blend System with Favorable Mechanical Properties and 3D Printing Performance. Polymers 2023, 15, 4066. https://doi.org/10.3390/polym15204066
Liu H, Chen S, Li C, Chen X, Li J, Chen P, Xie F, Jian H, Huang X, Liu L. Preparation and Characterization of Polycarbonate-Based Blend System with Favorable Mechanical Properties and 3D Printing Performance. Polymers. 2023; 15(20):4066. https://doi.org/10.3390/polym15204066
Chicago/Turabian StyleLiu, Hao, Simin Chen, Chengdi Li, Xiao Chen, Jinbo Li, Ping Chen, Fuzhen Xie, Huihua Jian, Xiaoying Huang, and Lei Liu. 2023. "Preparation and Characterization of Polycarbonate-Based Blend System with Favorable Mechanical Properties and 3D Printing Performance" Polymers 15, no. 20: 4066. https://doi.org/10.3390/polym15204066
APA StyleLiu, H., Chen, S., Li, C., Chen, X., Li, J., Chen, P., Xie, F., Jian, H., Huang, X., & Liu, L. (2023). Preparation and Characterization of Polycarbonate-Based Blend System with Favorable Mechanical Properties and 3D Printing Performance. Polymers, 15(20), 4066. https://doi.org/10.3390/polym15204066