
Methanolysis of Poly(lactic Acid) Using Catalyst Mixtures and the Kinetics of Methyl Lactate Production


Abstract
: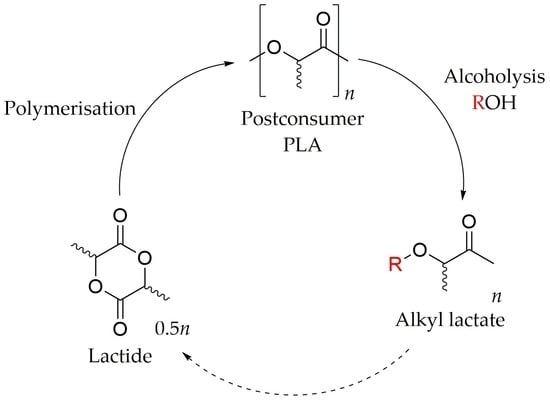
1. Introduction
2. Materials and Methods
2.1. Materials and Apparatus
2.2. Procedure for Experiments Reported in Section 3.1
2.3. Procedure for Experiments Reported in Section 3.2
2.4. Procedure for Experiments Reported in Section 3.3
2.5. GC and NMR Spectroscopy
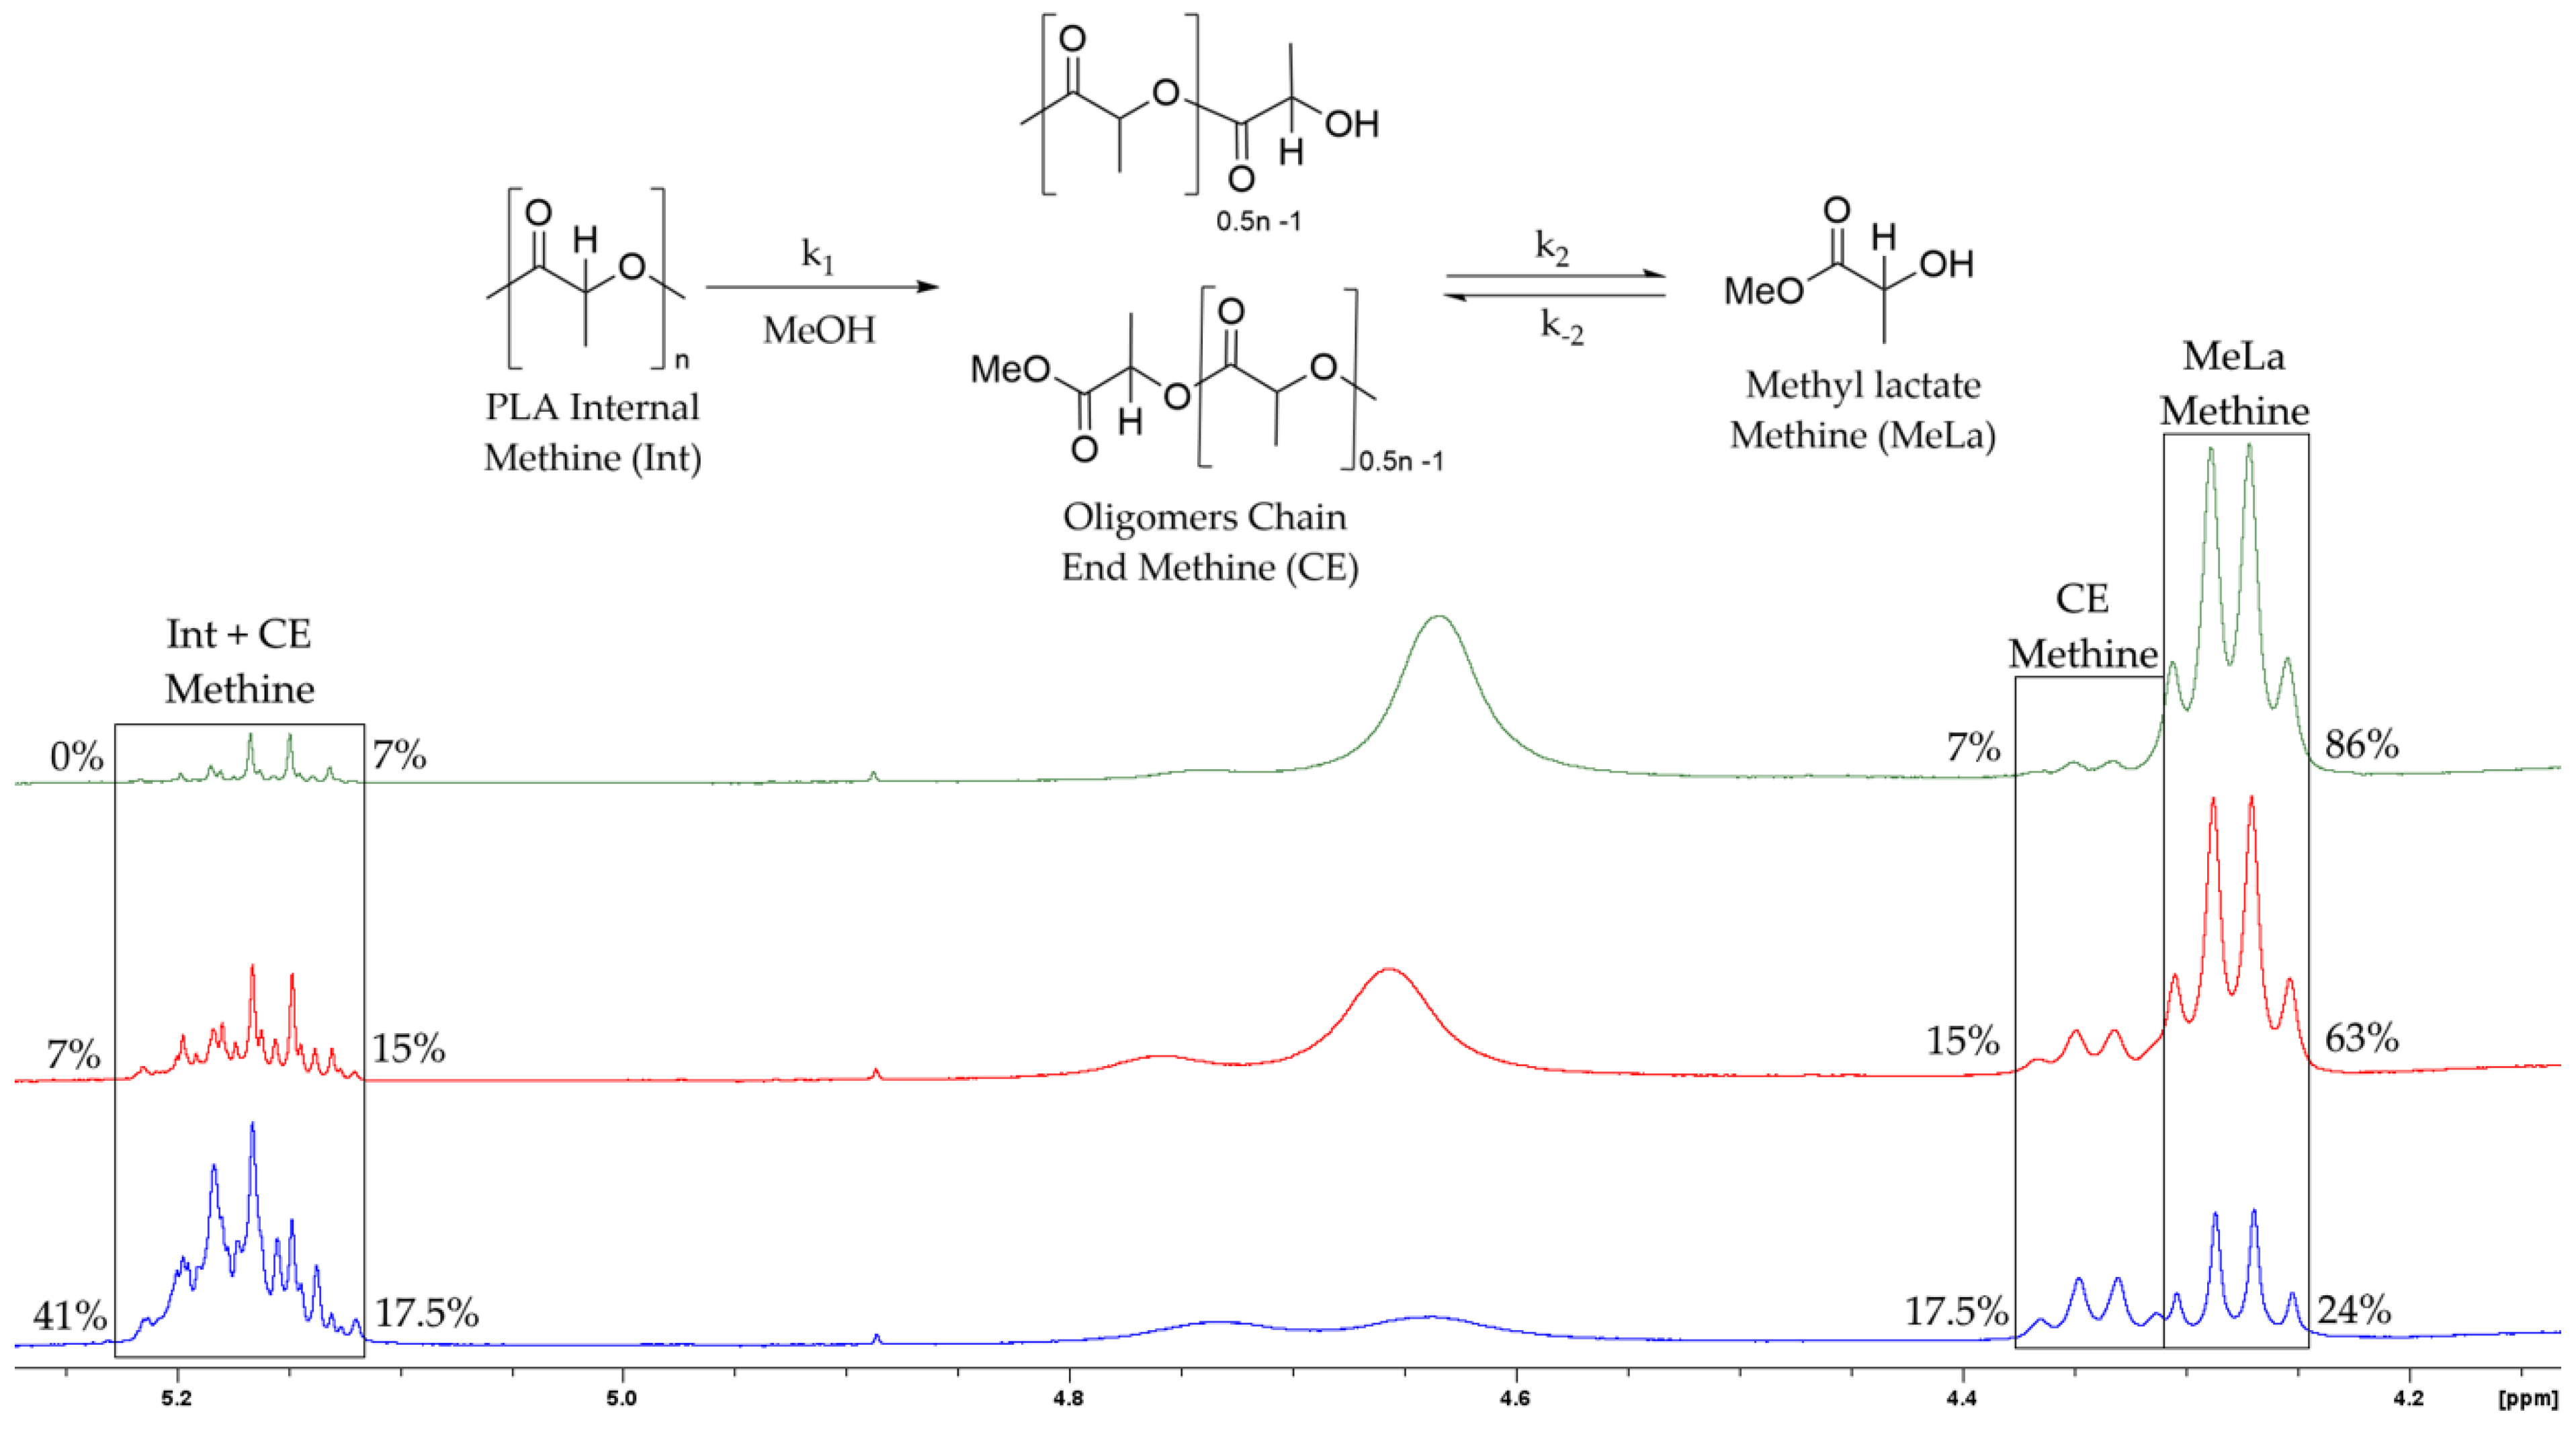
2.6. Kinetic Modelling
3. Results and Discussion
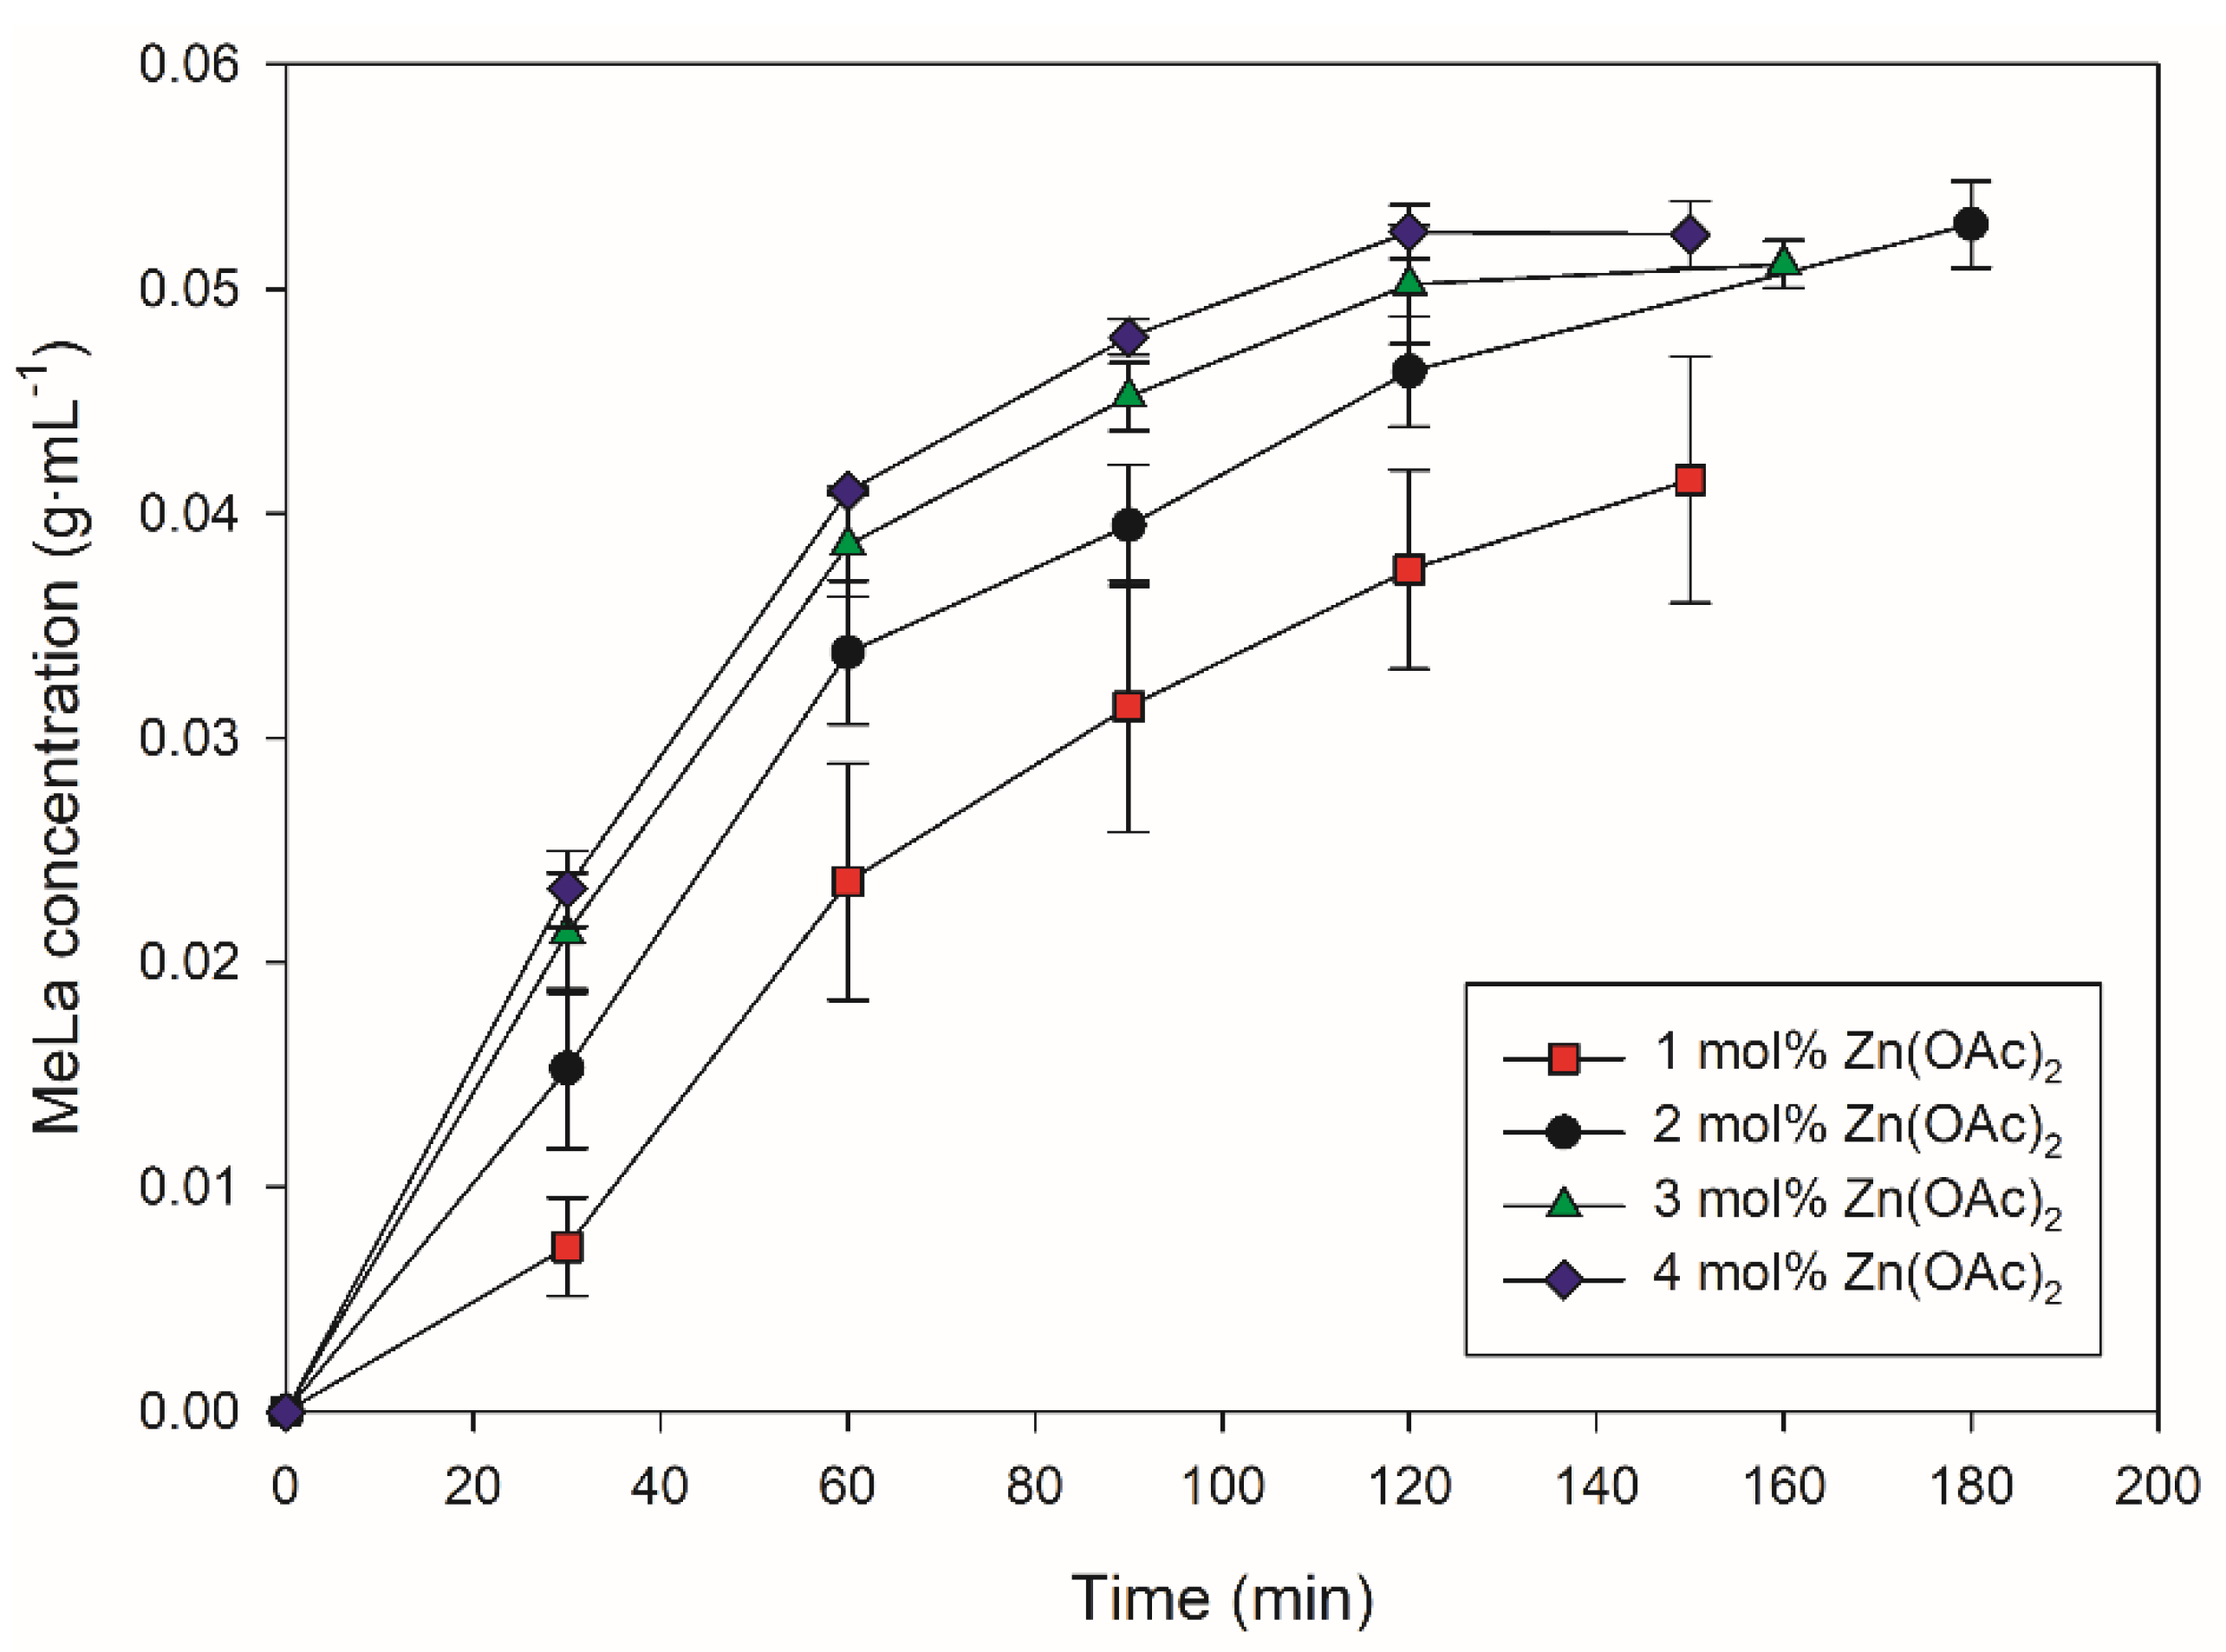
3.1. PLA Methanolysis Using Zn(OAc)2
3.2. PLA Methanolysis Using Mixed Catalysts
3.3. Conversion, Selectivity, and Yield of MeLa
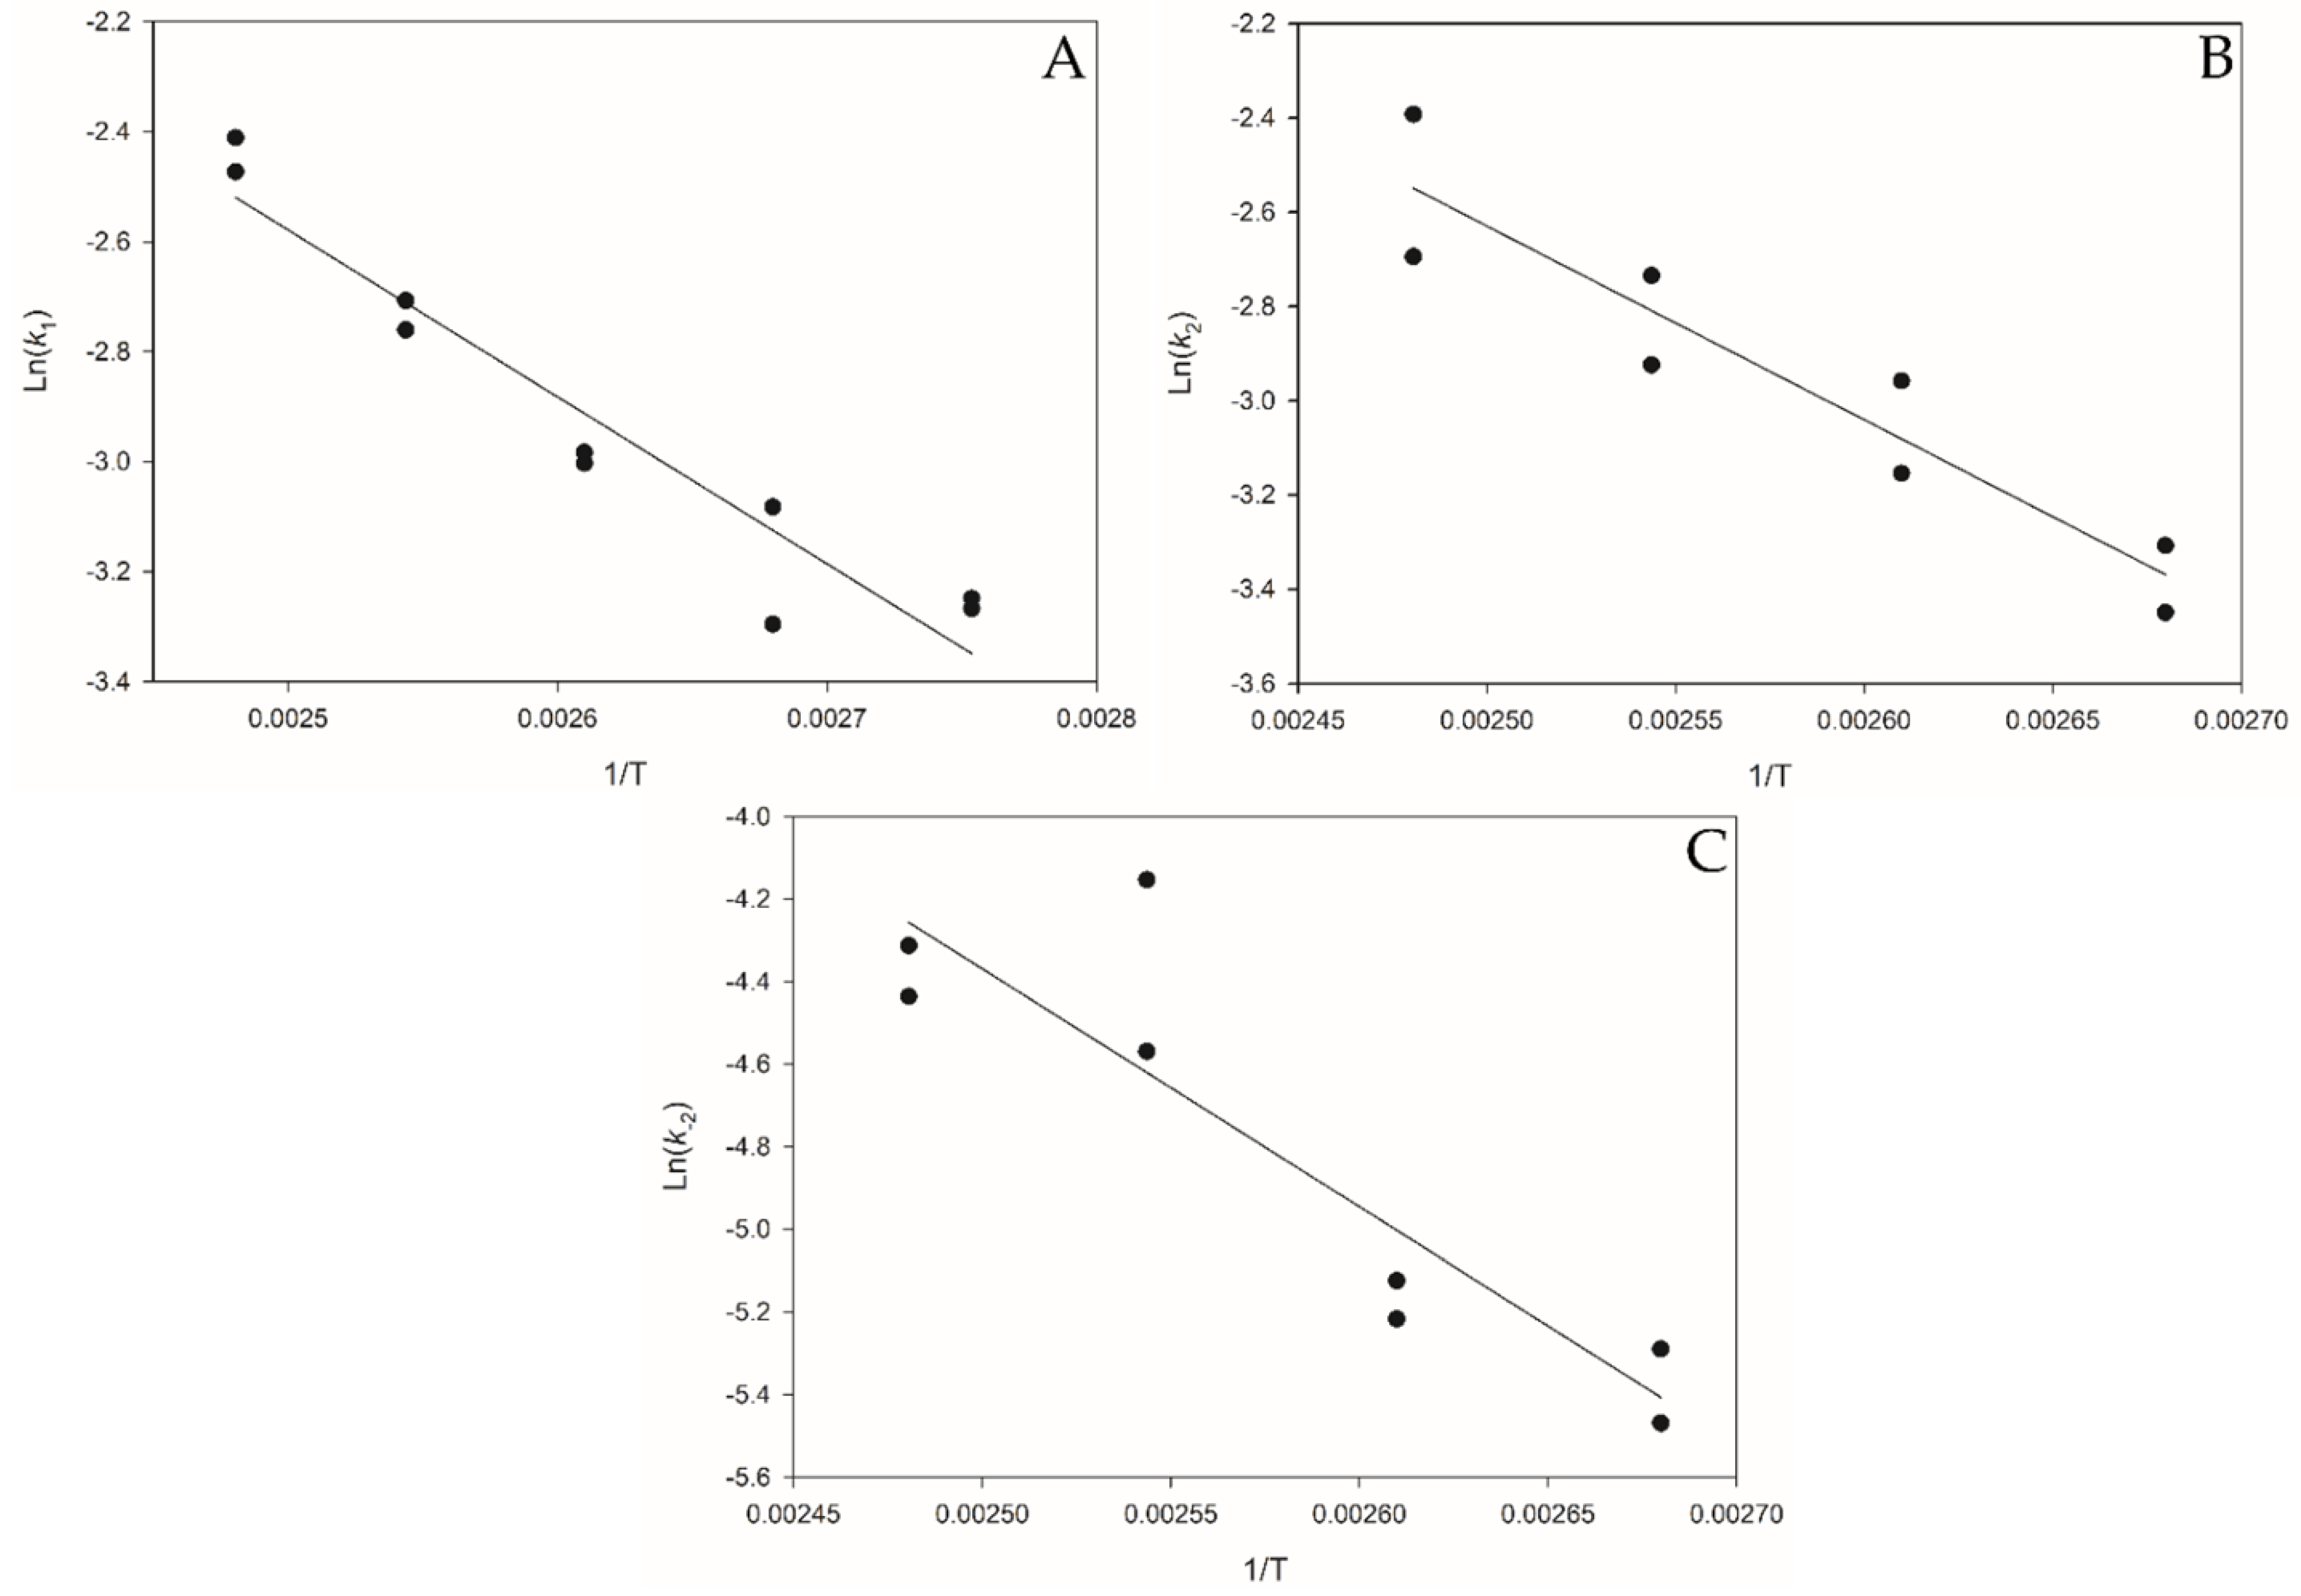
3.4. Arrhenius Temperature-Dependent Parameters
4. Conclusions
Supplementary Materials
Author Contributions
Funding
Data Availability Statement
Acknowledgments
Conflicts of Interest
References
- European Bioplastics Bioplastics Market Development Update 2021. Available online: https://docs.european-bioplastics.org/publications/market_data/2021/Report_Bioplastics_Market_Data_2021_short_version.pdf (accessed on 7 February 2022).
- Lee, H.D.; Lee, M.Y.; Hwang, Y.S.; Cho, Y.H.; Kim, H.W.; Park, H.B. Separation and Purification of Lactic Acid from Fermentation Broth Using Membrane-Integrated Separation Processes. Ind. Eng. Chem. Res. 2017, 56, 8301–8310. [Google Scholar] [CrossRef]
- Payne, J.; Jones, M.D. The Chemical Recycling of Polyesters for a Circular Plastics Economy: Challenges and Emerging Opportunities. ChemSusChem 2021, 14, 4041–4070. [Google Scholar] [CrossRef]
- Farah, S.; Anderson, D.G.; Langer, R. Physical and mechanical properties of PLA, and their functions in widespread applications—A comprehensive review. Adv. Drug Deliv. Rev. 2016, 107, 367–392. [Google Scholar] [CrossRef] [Green Version]
- Geyer, R.; Jambeck, J.R.; Law, K.L. Production, use, and fate of all plastics ever made. Sci. Adv. 2017, 3, 1–5. [Google Scholar] [CrossRef] [PubMed] [Green Version]
- Parker, K.; Garancher, J.P.; Shah, S.; Fernyhough, A. Expanded polylactic acid-An eco-friendly alternative to polystyrene foam. J. Cell. Plast. 2011, 47, 233–243. [Google Scholar] [CrossRef]
- Haider, T.P.; Vçlker, C.; Kramm, J.; Landfester, K.; Wurm, F.R. Plastics of the Future? The Impact of Biodegradable Polymers on the Environment and on Society. Angew. Chemie Int. Ed. 2019, 58, 50–62. [Google Scholar] [CrossRef] [Green Version]
- Nampoothiri, K.M.; Nair, N.R.; John, R.P. An overview of the recent developments in polylactide (PLA) research. Bioresour. Technol. 2010, 101, 8493–8501. [Google Scholar] [CrossRef]
- Cosate de Andrade, M.F.; Souza, P.M.S.; Cavalett, O.; Morales, A.R. Life Cycle Assessment of Poly(Lactic Acid) (PLA): Comparison Between Chemical Recycling, Mechanical Recycling and Composting. J. Polym. Environ. 2016, 24, 372–384. [Google Scholar] [CrossRef]
- Schyns, Z.O.G.; Shaver, M.P. Mechanical Recycling of Packaging Plastics: A Review. Macromol. Rapid Commun. 2021, 42, 1–27. [Google Scholar] [CrossRef]
- Meys, R.; Frick, F.; Westhues, S.; Sternberg, A.; Klankermayer, J.; Bardow, A. Towards a circular economy for plastic packaging wastes—The environmental potential of chemical recycling. Resour. Conserv. Recycl. 2020, 162, 105010. [Google Scholar] [CrossRef]
- Ragaert, K.; Delva, L.; Van Geem, K. Mechanical and chemical recycling of solid plastic waste. Waste Manag. 2017, 69, 24–58. [Google Scholar] [CrossRef] [PubMed]
- McNeill, I.C.; Leiper, H.A. Degradation studies of some polyesters and polycarbonates-2. Polylactide: Degradation under isothermal conditions, thermal degradation mechanism and photolysis of the polymer. Polym. Degrad. Stab. 1985, 11, 309–326. [Google Scholar] [CrossRef]
- VanWouwe, P.; Dusselier, M.; Vanleeuw, E.; Sels, B. Lactide Synthesis and Chirality Control for Polylactic acid Production. ChemSusChem 2016, 9, 907–921. [Google Scholar] [CrossRef] [PubMed]
- Inkinen, S.; Hakkarainen, M.; Albertsson, A.C.; Södergård, A. From lactic acid to poly(lactic acid) (PLA): Characterization and analysis of PLA and Its precursors. Biomacromolecules 2011, 12, 523–532. [Google Scholar] [CrossRef] [PubMed]
- Piemonte, V.; Sabatini, S.; Gironi, F. Chemical Recycling of PLA: A Great Opportunity Towards the Sustainable Development? J. Polym. Environ. 2013, 21, 640–647. [Google Scholar] [CrossRef]
- Pereira, C.S.M.; Silva, V.M.T.M.; Rodrigues, A.E. Ethyl lactate as a solvent: Properties, applications and production processes—A review. Green Chem. 2011, 13, 2658–2671. [Google Scholar] [CrossRef]
- Biddy, M.J.; Scarlata, C.; Kinchin, C. Chemicals from Biomass: A Market Assessment of Bioproducts with Near-Term Potential. Available online: https://www.osti.gov/biblio/1244312/ (accessed on 7 February 2022).
- Leibfarth, F.A.; Moreno, N.; Hawker, A.P.; Shand, J.D. Transforming polylactide into value-added materials. J. Polym. Sci. Part. A Polym. Chem. 2012, 50, 4814–4822. [Google Scholar] [CrossRef]
- Rosales-Calderon, O.; Arantes, V. A review on commercial-scale high-value products that can be produced alongside cellulosic ethanol. Biotechnol. Biofuels 2019, 12, 240. [Google Scholar] [CrossRef] [Green Version]
- De Clercq, R.; Dusselier, M.; Poleunis, C.; Debecker, D.P.; Giebeler, L.; Oswald, S.; Makshina, E.; Sels, B.F. Titania-Silica Catalysts for Lactide Production from Renewable Alkyl Lactates: Structure-Activity Relations. ACS Catal. 2018, 8, 8130–8139. [Google Scholar] [CrossRef]
- De Clercq, R.; Dusselier, M.; Makshina, E.; Sels, B.F. Catalytic Gas-Phase Production of Lactide from Renewable Alkyl Lactates. Angew. Chemie Int. Ed. 2018, 57, 3074–3078. [Google Scholar] [CrossRef]
- Aryan, V.; Maga, D.; Majgaonkar, P.; Hanich, R. Valorisation of polylactic acid (PLA) waste: A comparative life cycle assessment of various solvent-based chemical recycling technologies. Resour. Conserv. Recycl. 2021, 172, 105670. [Google Scholar] [CrossRef]
- Brake, L.D. Preparation of Alkyl Esters By Depolymerization. U.S. Patent 5264617, 23 November 1993. [Google Scholar]
- Whitelaw, E.L.; Davidson, M.G.; Jones, M.D. Group 4 salalen complexes for the production and degradation of polylactide. Chem. Commun. 2011, 47, 10004–10006. [Google Scholar] [CrossRef] [PubMed] [Green Version]
- Román-Ramírez, L.A.; Mckeown, P.; Jones, M.D.; Wood, J. Poly(lactic acid) degradation into methyl lactate catalyzed by a well-defined Zn(II) complex. ACS Catal. 2019, 9, 409–416. [Google Scholar] [CrossRef] [Green Version]
- Lamberti, F.M.; Román-Ramírez, L.A.; Mckeown, P.; Jones, M.D.; Wood, J. Kinetics of alkyl lactate formation from the alcoholysis of poly(lactic acid). Processes 2020, 8, 738. [Google Scholar] [CrossRef]
- Song, X.; Zhang, X.; Wang, H.; Liu, F.; Yu, S.; Liu, S. Methanolysis of poly(lactic acid) (PLA) catalyzed by ionic liquids. Polym. Degrad. Stab. 2013, 98, 2760–2764. [Google Scholar] [CrossRef]
- Song, X.; Bian, Z.; Hui, Y.; Wang, H.; Liu, F.; Yu, S. Zn-Acetate-Containing ionic liquid as highly active catalyst for fast and mild methanolysis of Poly(lactic acid). Polym. Degrad. Stab. 2019, 168, 108937. [Google Scholar] [CrossRef]
- Liu, H.; Song, X.; Liu, F.; Liu, S.; Yu, S. Ferric chloride as an efficient and reusable catalyst for methanolysis of poly(lactic acid) waste. J. Polym. Res. 2015, 22, 135. [Google Scholar] [CrossRef]
- Jehanno, C.; Pérez-Madrigal, M.M.; Demarteau, J.; Sardon, H.; Dove, A.P. Organocatalysis for depolymerisation. Polym. Chem. 2019, 10, 172–186. [Google Scholar] [CrossRef] [Green Version]
- Xu, S.; Held, I.; Kempf, B.; Mayr, H.; Steglich, W.; Zipse, H. The DMAP-catalyzed acetylation of alcohols—A mechanistic study (DMAP = 4-(dimethylamino)pyridine). Chem. A Eur. J. 2005, 11, 4751–4757. [Google Scholar] [CrossRef]
- Otera, J. Transesterification. Chem. Rev. 1993, 93, 1449–1470. [Google Scholar] [CrossRef]
- Thomas, C.; Bibal, B. Hydrogen-bonding organocatalysts for ring-opening polymerization. Green Chem. 2014, 16, 1687–1699. [Google Scholar] [CrossRef]
- Reinoso, D.M.; Damiani, D.E.; Tonetto, G.M. Zinc carboxylic salts used as catalyst in the biodiesel synthesis by esterification and transesterification: Study of the stability in the reaction medium. Appl. Catal. A Gen. 2012, 449, 88–95. [Google Scholar] [CrossRef]
- Capelot, M.; Montarnal, D.; Tournilhac, F.; Leibler, L. Metal-catalyzed transesterification for healing and assembling of thermosets. J. Am. Chem. Soc. 2012, 134, 7664–7667. [Google Scholar] [CrossRef] [PubMed]
- Wang, Z.; Yang, X.; Liu, S.; Zhang, H.; Wang, G. Magnesium acetate used as an effective catalyst for synthesizing aliphatic polycarbonates via melt transesterification process. Chem. Res. Chinese Univ. 2016, 32, 512–518. [Google Scholar] [CrossRef]
- Basterretxea, A.; Jehanno, C.; Mecerreyes, D.; Sardon, H. Dual Organocatalysts Based on Ionic Mixtures of Acids and Bases: A Step Toward High Temperature Polymerizations. ACS Macro Lett. 2019, 8, 1055–1062. [Google Scholar] [CrossRef] [Green Version]
- Delle Chiaie, K.R.; McMahon, F.R.; Williams, E.J.; Price, M.J.; Dove, A.P. Dual-catalytic depolymerization of polyethylene terephthalate (PET). Polym. Chem. 2020, 11, 1450–1453. [Google Scholar] [CrossRef] [Green Version]
- Lamberti, F.M.; Ingram, A.; Wood, J. Synergistic Dual Catalytic System and Kinetics for the Alcoholysis of Poly (Lactic Acid). Processes 2021, 9, 921. [Google Scholar] [CrossRef]
- Raheem, A.B.; Noor, Z.Z.; Hassan, A.; Abd Hamid, M.K.; Samsudin, S.A.; Sabeen, A.H. Current developments in chemical recycling of post-consumer polyethylene terephthalate wastes for new materials production: A review. J. Clean. Prod. 2019, 225, 1052–1064. [Google Scholar] [CrossRef]
- Reinoso, D.M.; Ferreira, M.L.; Tonetto, G.M. Study of the reaction mechanism of the transesterification of triglycerides catalyzed by zinc carboxylates. J. Mol. Catal. A Chem. 2013, 377, 29–41. [Google Scholar] [CrossRef]
- Payne, J.; McKeown, P.; Jones, M.D. A circular economy approach to plastic waste. Polym. Degrad. Stab. 2019, 165, 170–181. [Google Scholar] [CrossRef]


| 2 mol% Catalyst | Speed (rpm) | Molar Equivalents of MeOH | Average Final Time (min) | Average Final MeLa Concentration (g∙mL−1) | Average Initial Rate of MeLa Production at 40 min (g∙mL−1∙min−1) |
|---|---|---|---|---|---|
| ZnAc | 300 | 9 | 173 | 0.0538 | 5.37 × 10⁻⁴ |
| ZnAc | 300 | 17 | 48 | 0.0593 | 1.42 × 10⁻³ |
| ZnAc | 600 | 17 | 70 | 0.0577 | 1.19 × 10⁻³ |
| DMAP | 300 | 9 | 360 | 0.0437 | 3.09 × 10⁻⁵ |
| DMAP | 300 | 17 | 340 | 0.0510 | 4.65 × 10⁻⁵ |
| DMAP | 600 | 17 | 200 | 0.0257 | 2.03 × 10⁻⁵ |
| MgAc | 300 | 9 | 360 | 0.0449 | 5.39 × 10⁻⁵ |
| MgAc | 300 | 17 | 107 | 0.0562 | 9.09 × 10⁻⁵ |
| MgAc | 600 | 17 | 83 | 0.0624 | 1.09 × 10⁻³ |
| TBD | 300 | 9 | 160 | 0.0501 | 5.37 × 10⁻⁴ |
| TBD | 300 | 17 | 140 | 0.0534 | 5.27 × 10⁻⁴ |
| TBD | 600 | 17 | 135 | 0.0557 | 6.43 × 10⁻⁴ |
| Catalyst (2 mol% Total) | Average Final Time (min) | Average Final MeLa Concentration (g∙mL−1) | Average Initial Rate of MeLa Production at 40 min (g∙mL−1∙min−1) |
|---|---|---|---|
| Zn(OAc)2/TBD (1:1) | 60 | 0.0584 | 1.34 × 10⁻³ |
| Zn(OAc)2/DMAP (1:1) | 80 | 0.0608 | 1.29 × 10⁻³ |
| Mg(OAc)2/TBD (1:1) | 80 | 0.0617 | 1.36 × 10⁻³ |
| Mg(OAc)2/DMAP (1:1) | 110 | 0.0602 | 8.44 × 10⁻⁴ |
| TBD/DMAP (1:1) | 180 | 0.0531 | 2.84 × 10⁻⁴ |
| Zn(OAc)2/Mg(OAc)2 (1:1) | 120 | 0.0561 | 6.87 × 10⁻⁴ |
| Zn(OAc)2/TBD/ DMAP (1:0.5:0.5) | 90 | 0.0600 | 1.27 × 10⁻³ |
| Mg(OAc)2/TBD/ DMAP (1:0.5:0.5) | 105 | 0.0591 | 8.72 × 10⁻⁴ |
| TBD/Zn(OAc)2/Mg(OAc)2 (1:0.5:0.5) | 120 | 0.0529 | 5.46 × 10⁻⁴ |
| DMAP/Zn(OAc)2/Mg(OAc)2 (1:0.5:0.5) | 90 | 0.0581 | 9.22 × 10⁻⁴ |
| Zn(OAc)2/Mg(OAc)2/TBD/DMAP (1:1:1:1) | 120 | 0.0626 | 7.41 × 10⁻⁴ |
| Temperature (°C) | XInt (%) | SMeLa (%) | YMeLa (%) | Average XInt (%) | Average SMeLa (%) | Average YMeLa (%) |
|---|---|---|---|---|---|---|
| 130 | 100 | 84 | 84 | 100 | 81 | 81 |
| 130 | 100 | 78 | 78 | |||
| 120 | 100 | 68 | 68 | 99.5 | 72 | 71.5 |
| 120 | 99 | 76 | 75 | |||
| 110 | 97 | 75 | 73 | 96 | 73 | 70 |
| 110 | 95 | 71 | 67 | |||
| 100 | 92 | 68 | 63 | 90.5 | 64.5 | 58.5 |
| 100 | 89 | 61 | 54 | |||
| 90 | 88 | 64 | 56 | 88 | 64.5 | 56.5 |
| 90 | 88 | 65 | 57 |
Publisher’s Note: MDPI stays neutral with regard to jurisdictional claims in published maps and institutional affiliations. |
© 2022 by the authors. Licensee MDPI, Basel, Switzerland. This article is an open access article distributed under the terms and conditions of the Creative Commons Attribution (CC BY) license (https://creativecommons.org/licenses/by/4.0/).
Share and Cite
Lamberti, F.M.; Román-Ramírez, L.A.; Dove, A.P.; Wood, J. Methanolysis of Poly(lactic Acid) Using Catalyst Mixtures and the Kinetics of Methyl Lactate Production. Polymers 2022, 14, 1763. https://doi.org/10.3390/polym14091763
Lamberti FM, Román-Ramírez LA, Dove AP, Wood J. Methanolysis of Poly(lactic Acid) Using Catalyst Mixtures and the Kinetics of Methyl Lactate Production. Polymers. 2022; 14(9):1763. https://doi.org/10.3390/polym14091763
Chicago/Turabian StyleLamberti, Fabio M., Luis A. Román-Ramírez, Andrew P. Dove, and Joseph Wood. 2022. "Methanolysis of Poly(lactic Acid) Using Catalyst Mixtures and the Kinetics of Methyl Lactate Production" Polymers 14, no. 9: 1763. https://doi.org/10.3390/polym14091763
APA StyleLamberti, F. M., Román-Ramírez, L. A., Dove, A. P., & Wood, J. (2022). Methanolysis of Poly(lactic Acid) Using Catalyst Mixtures and the Kinetics of Methyl Lactate Production. Polymers, 14(9), 1763. https://doi.org/10.3390/polym14091763