

Effect of Ultrasonication on the Morphology, Mechanical Property, Ionic Conductivity, and Flame Retardancy of PEO-LiCF3SO3-Halloysite Nanotube Composites for Use as Solid Polymer Electrolyte

Abstract
:1. Introduction
2. Materials and Methods
2.1. Materials
2.2. Fabrication of Solid Polymer Electrolyte (SPEs) Nanocomposites
2.3. Measurements
3. Results
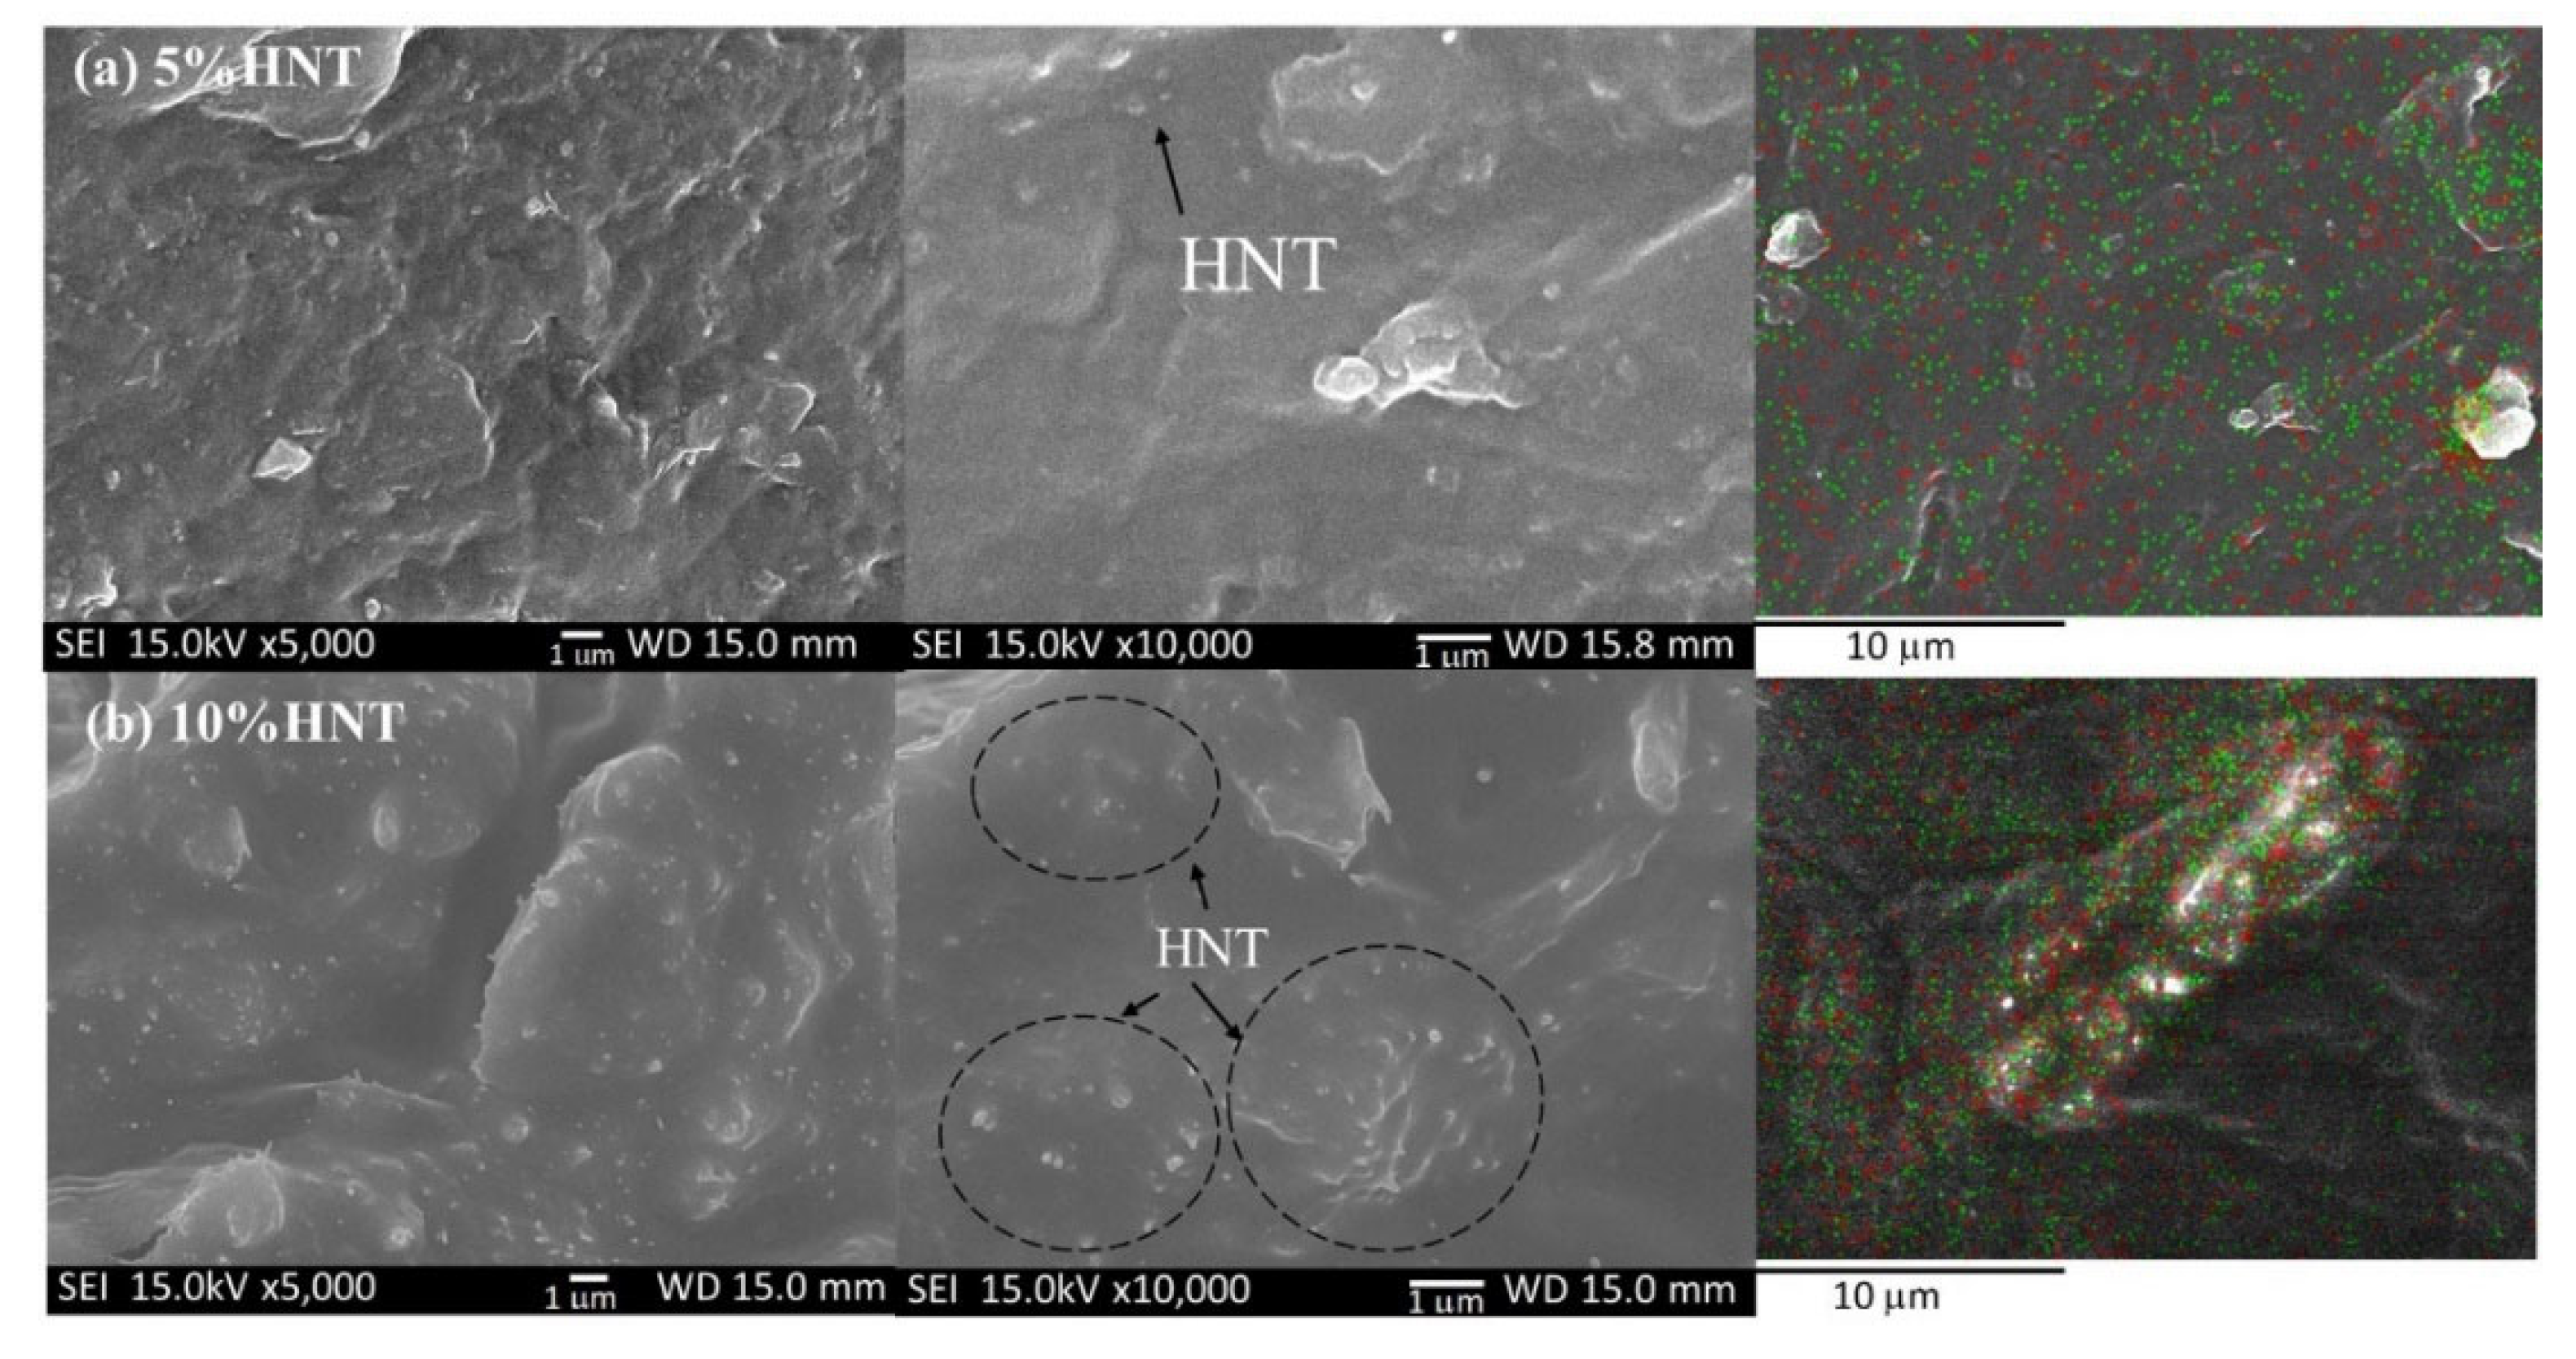
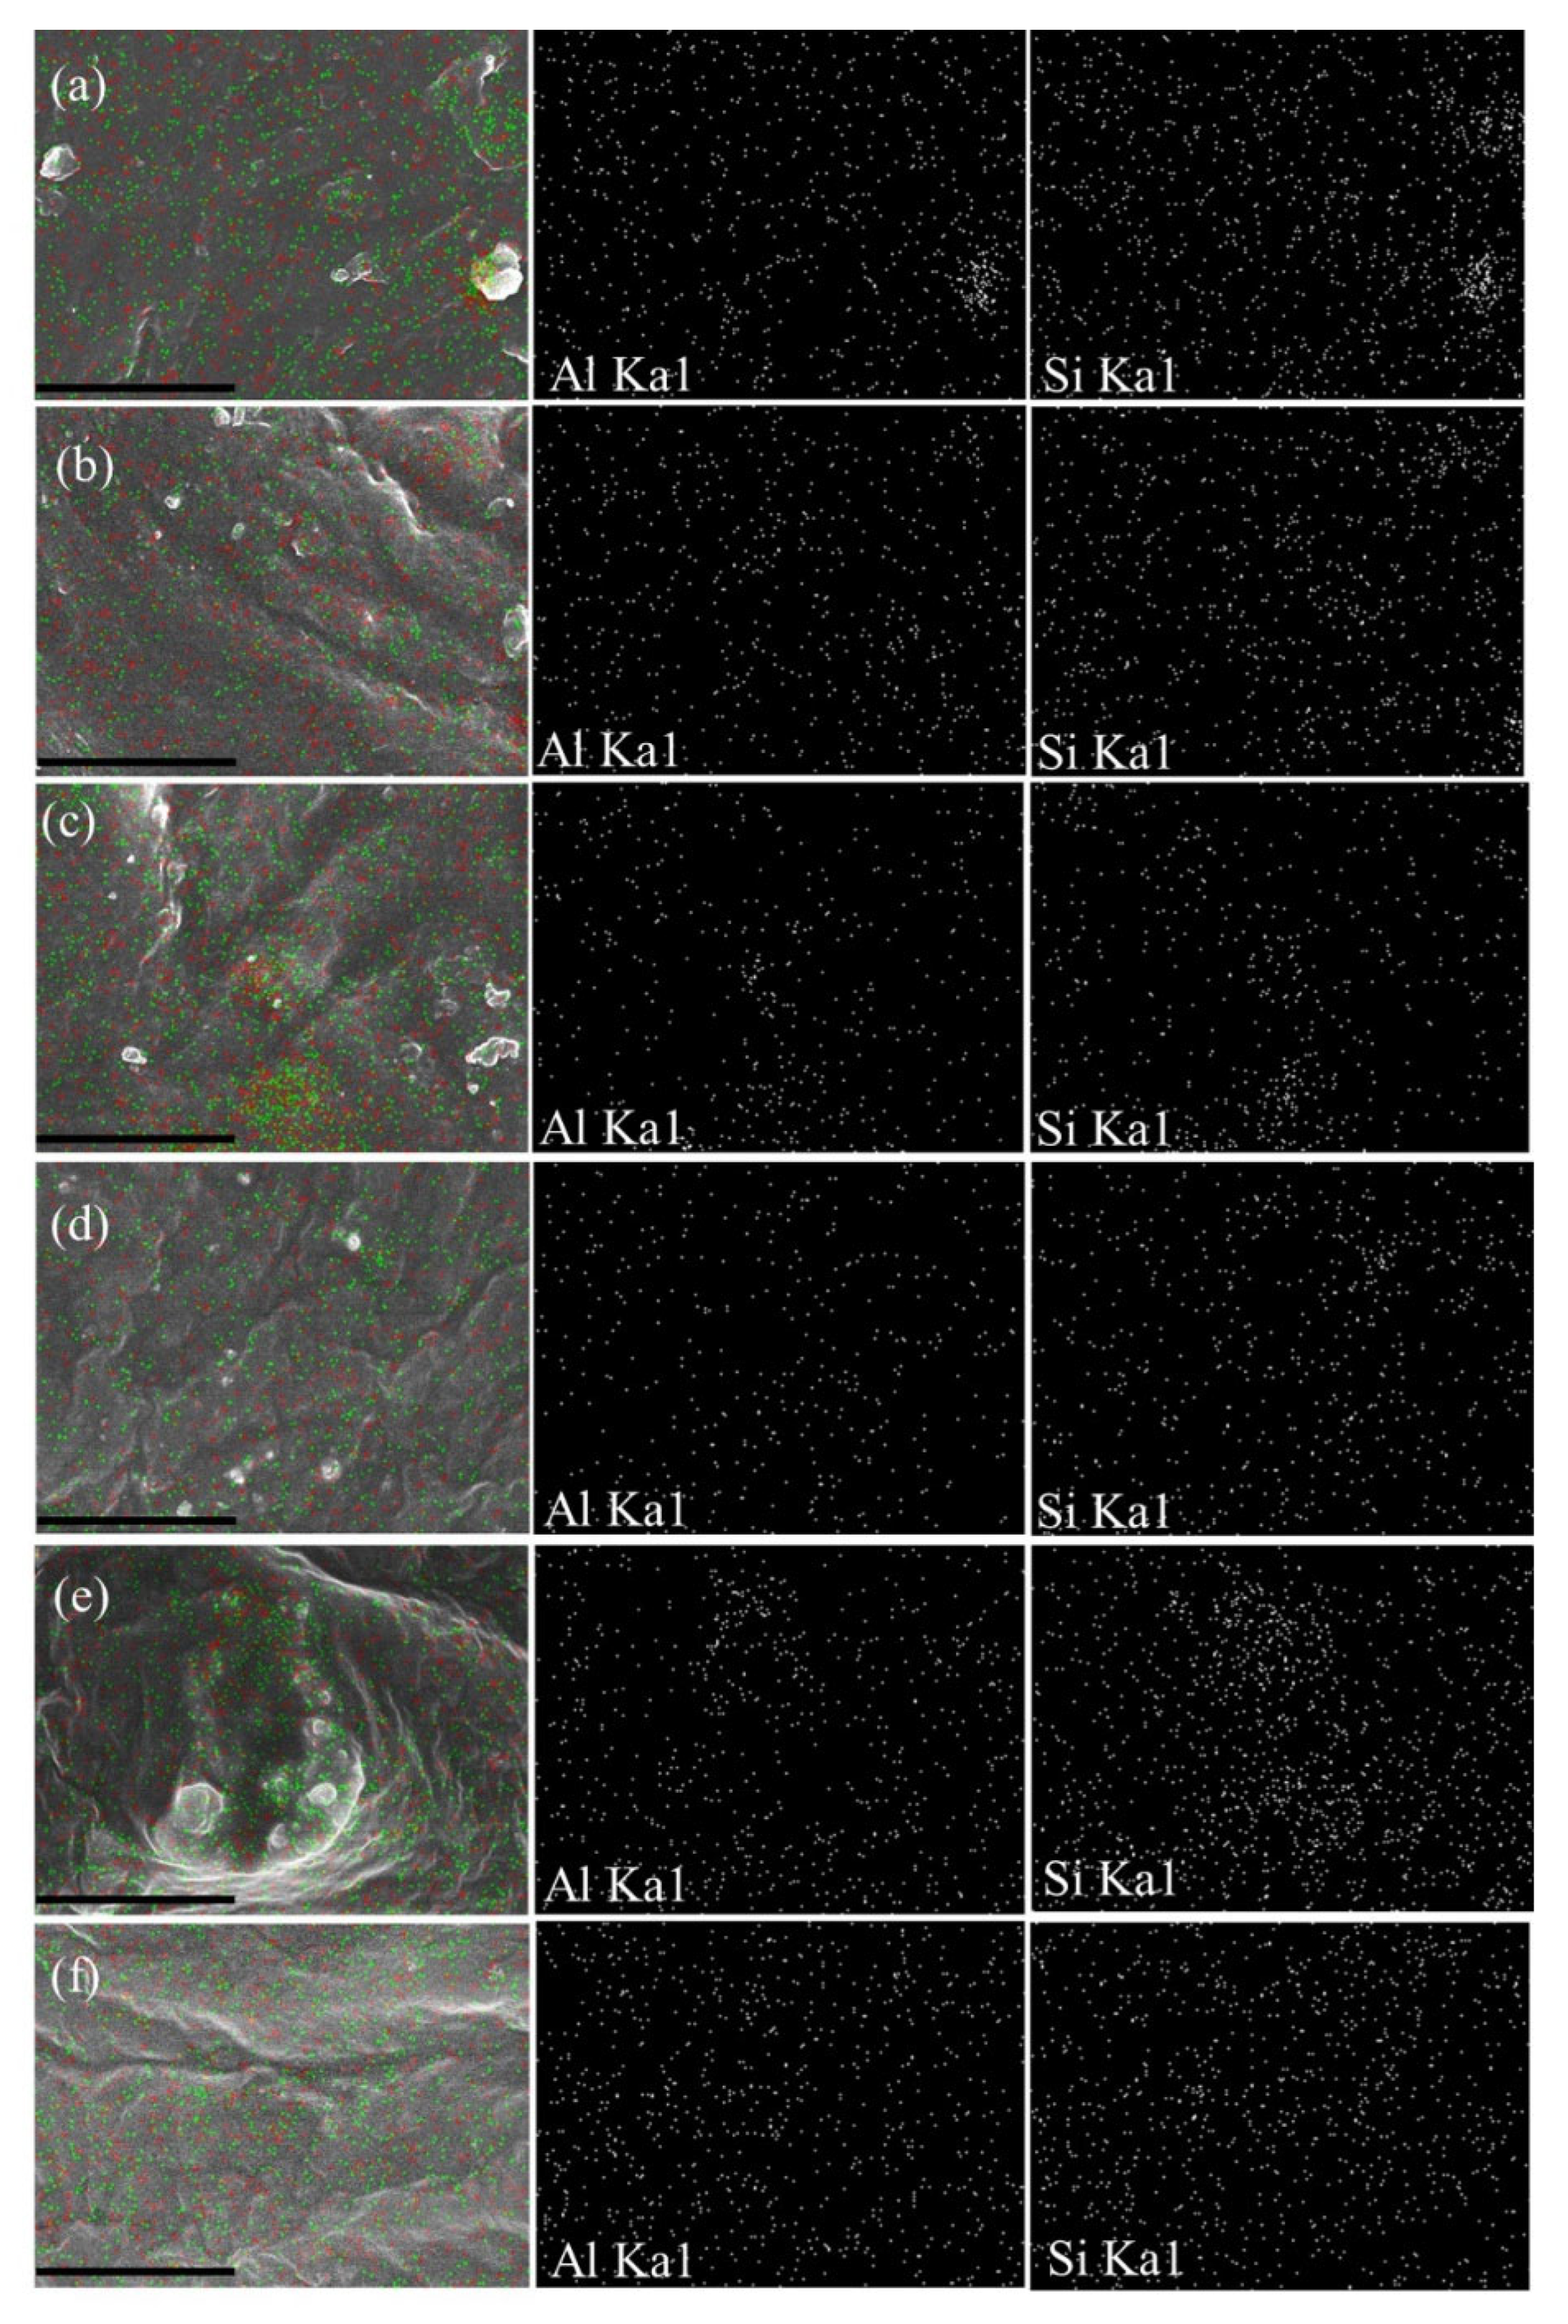
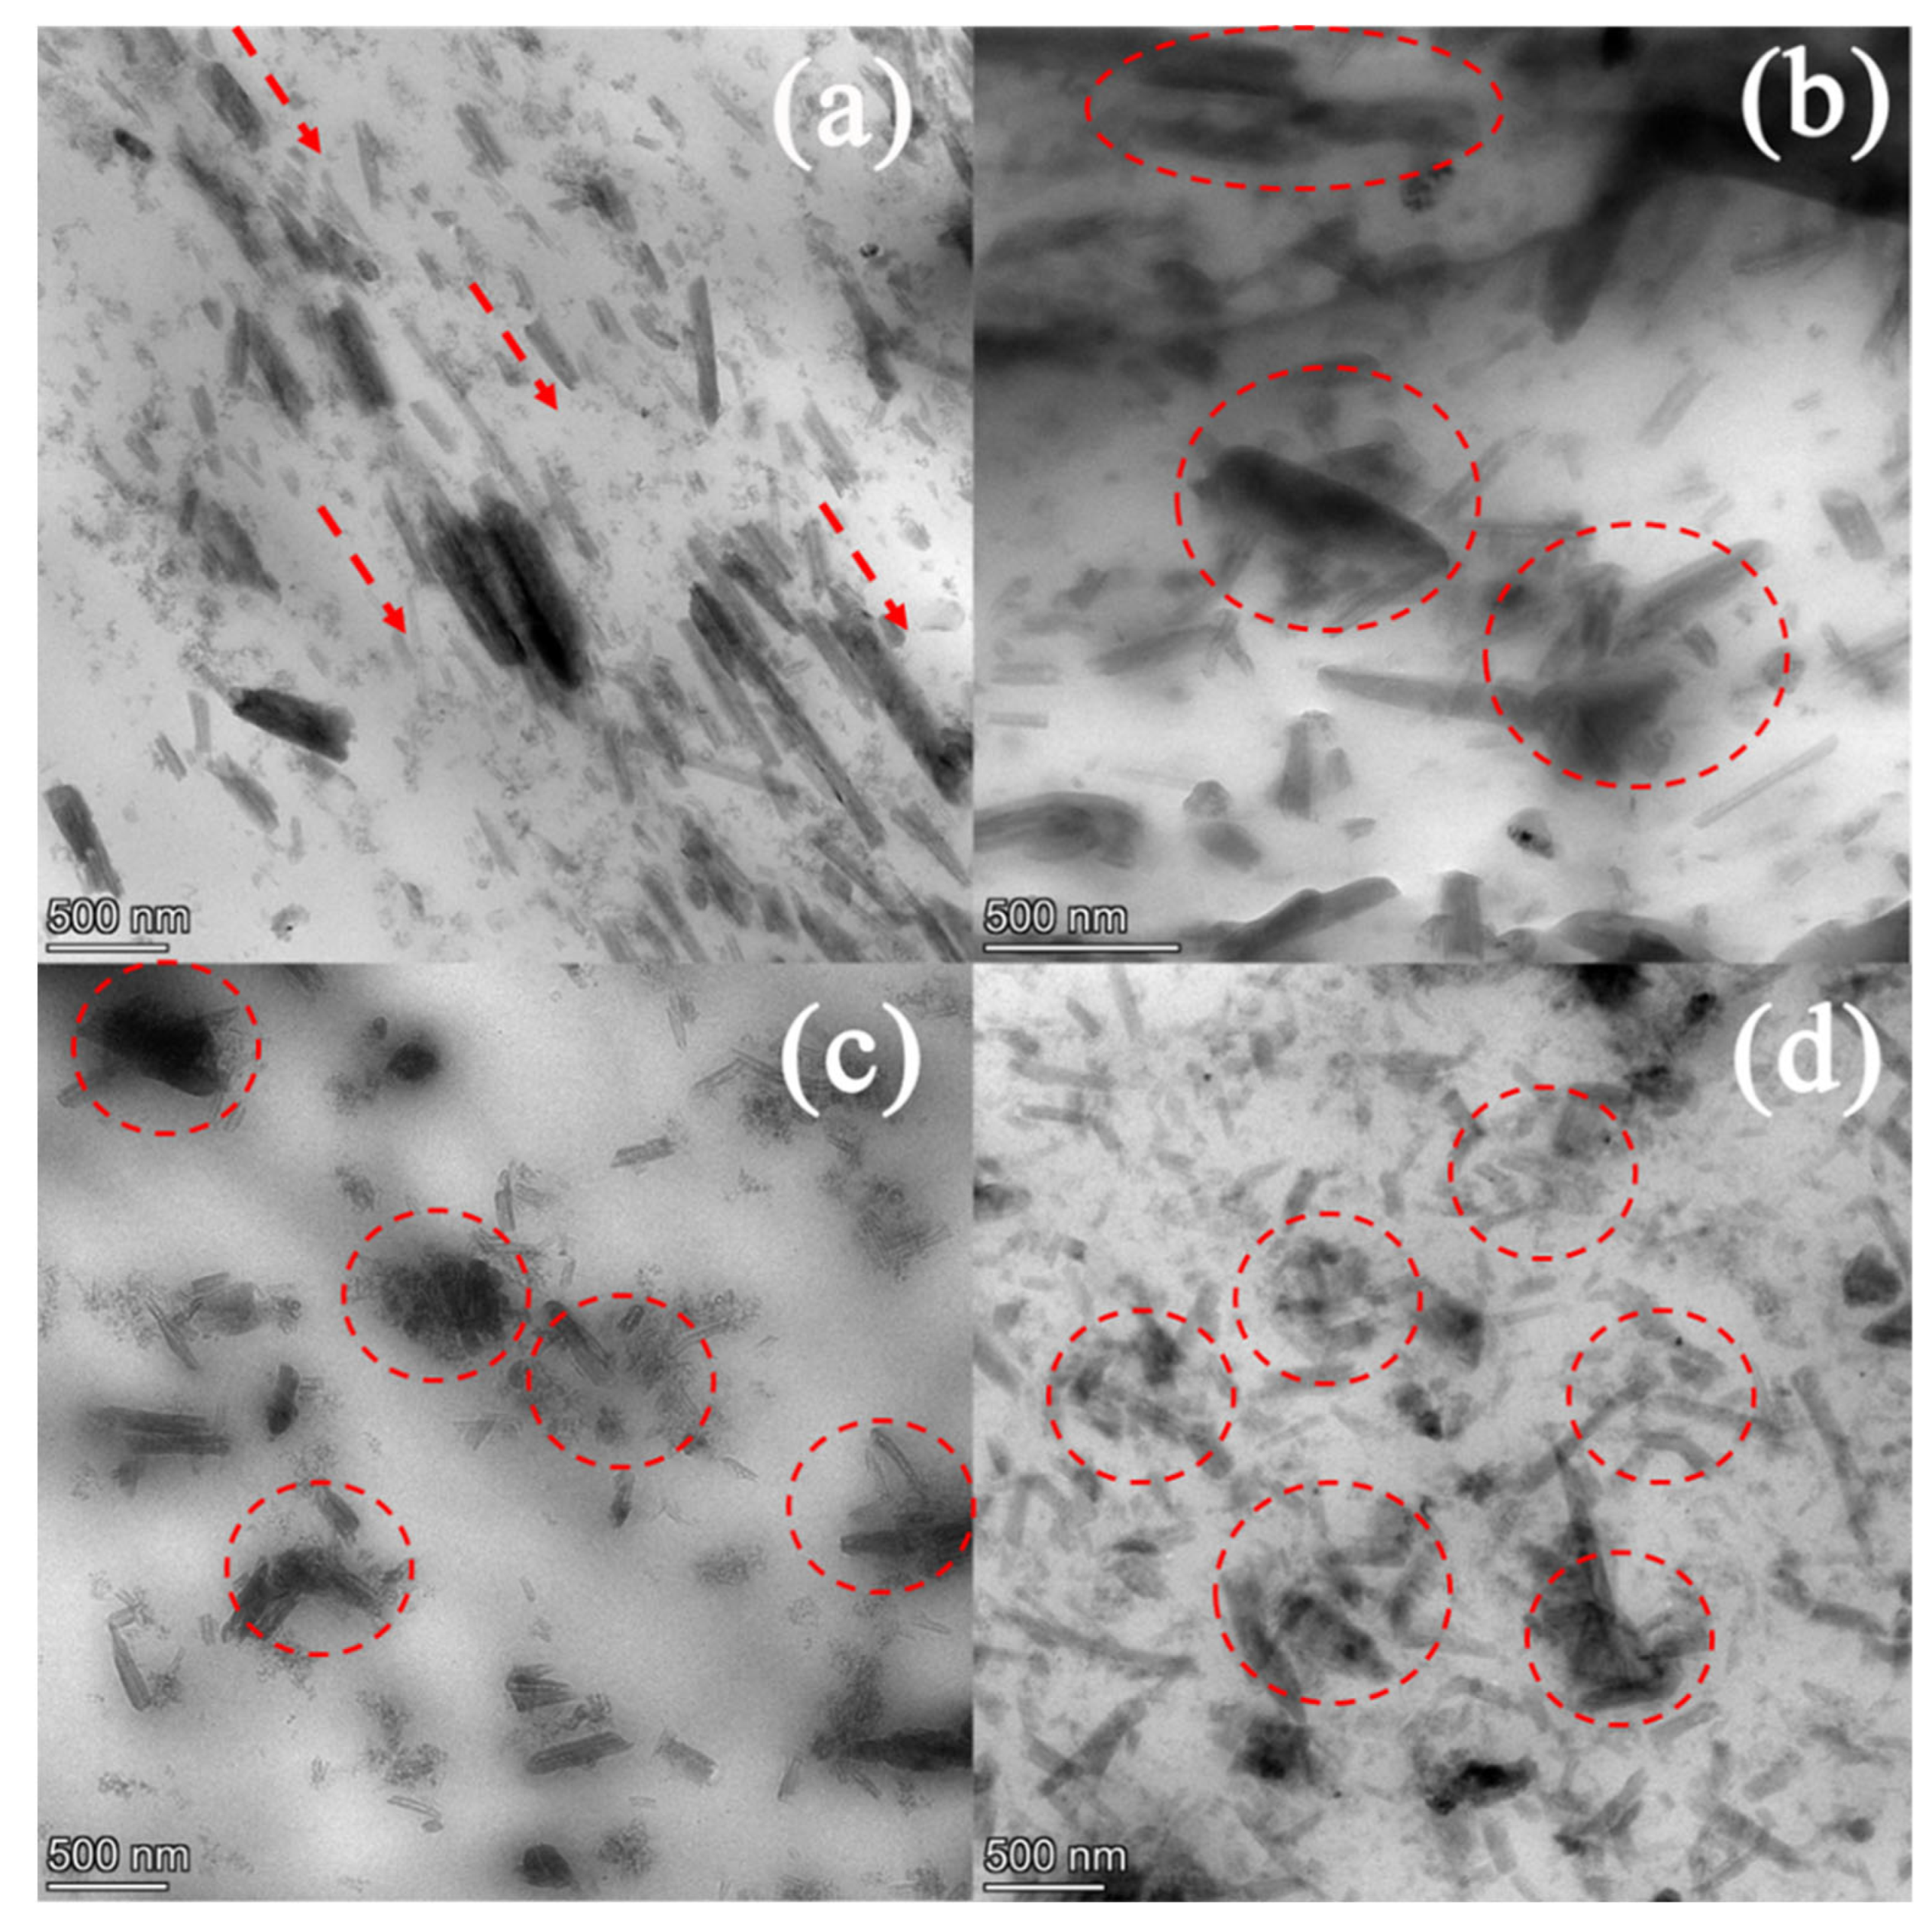
3.1. Effect of Ultrasonication on the Dispersion of HNTs in SPE
Morphology Study
3.2. Effect of Ultrasonication on Crystallinity and Thermal Properties of SPE
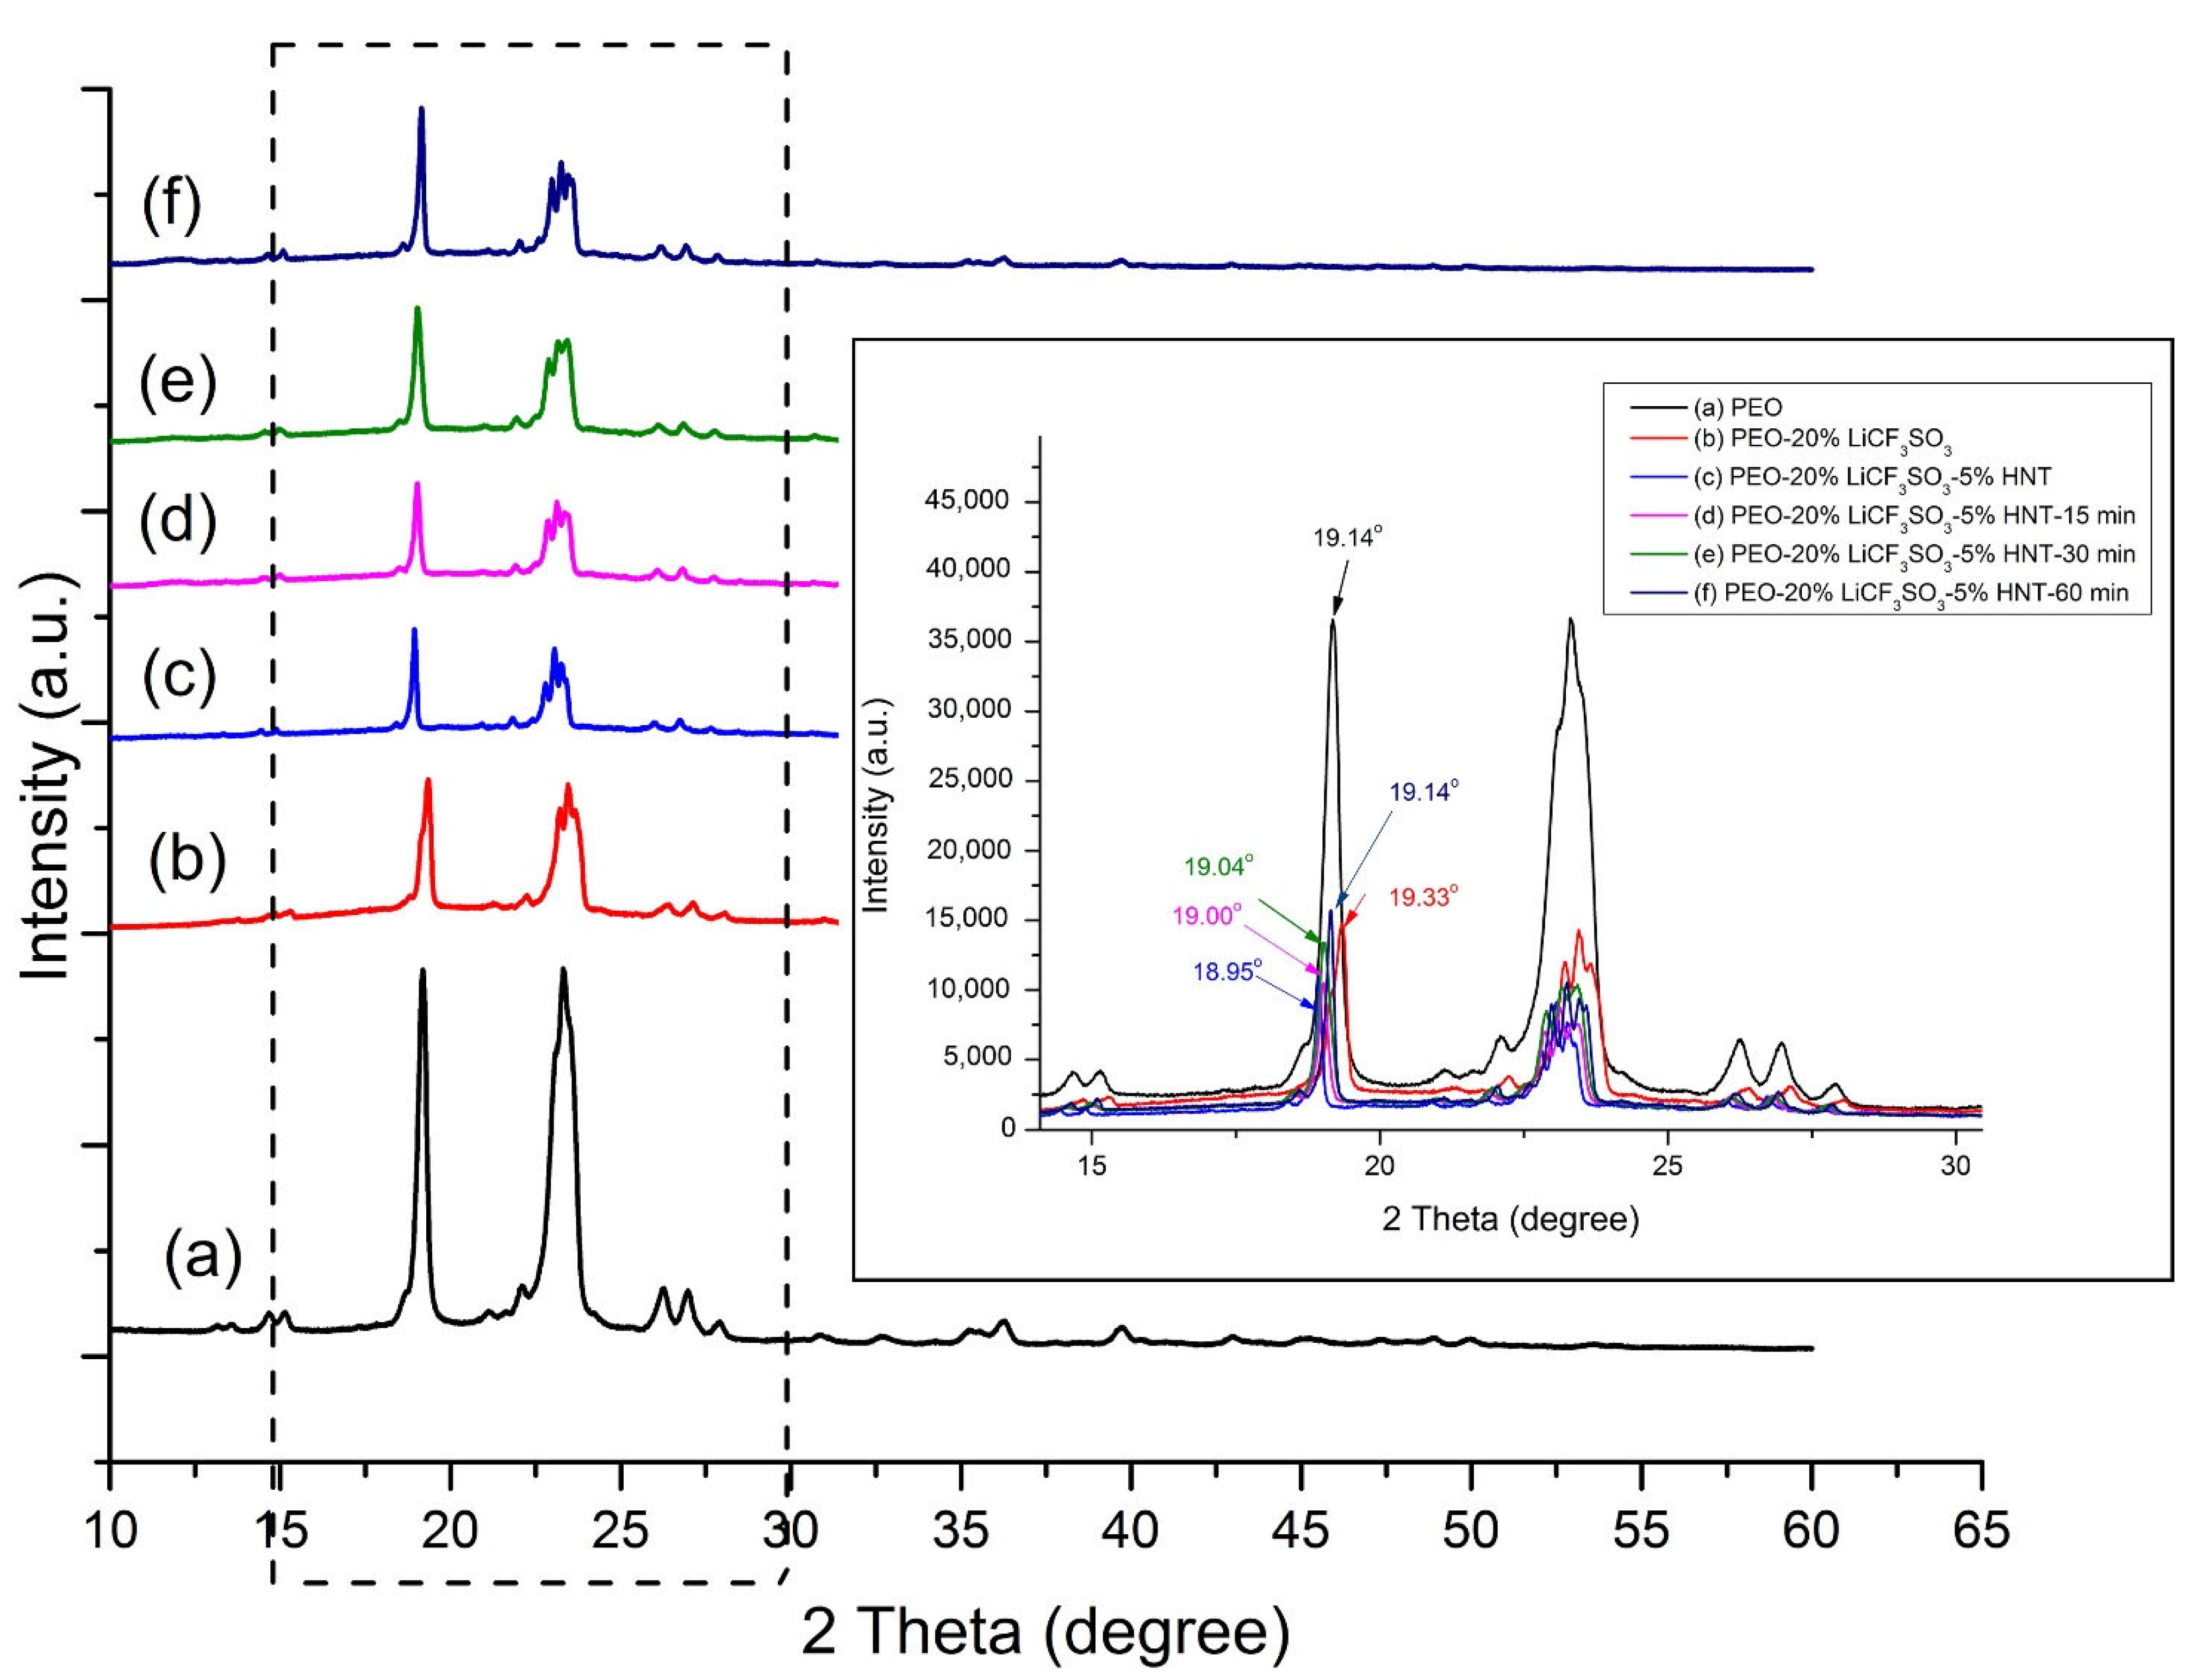
3.2.1. XRD Analysis
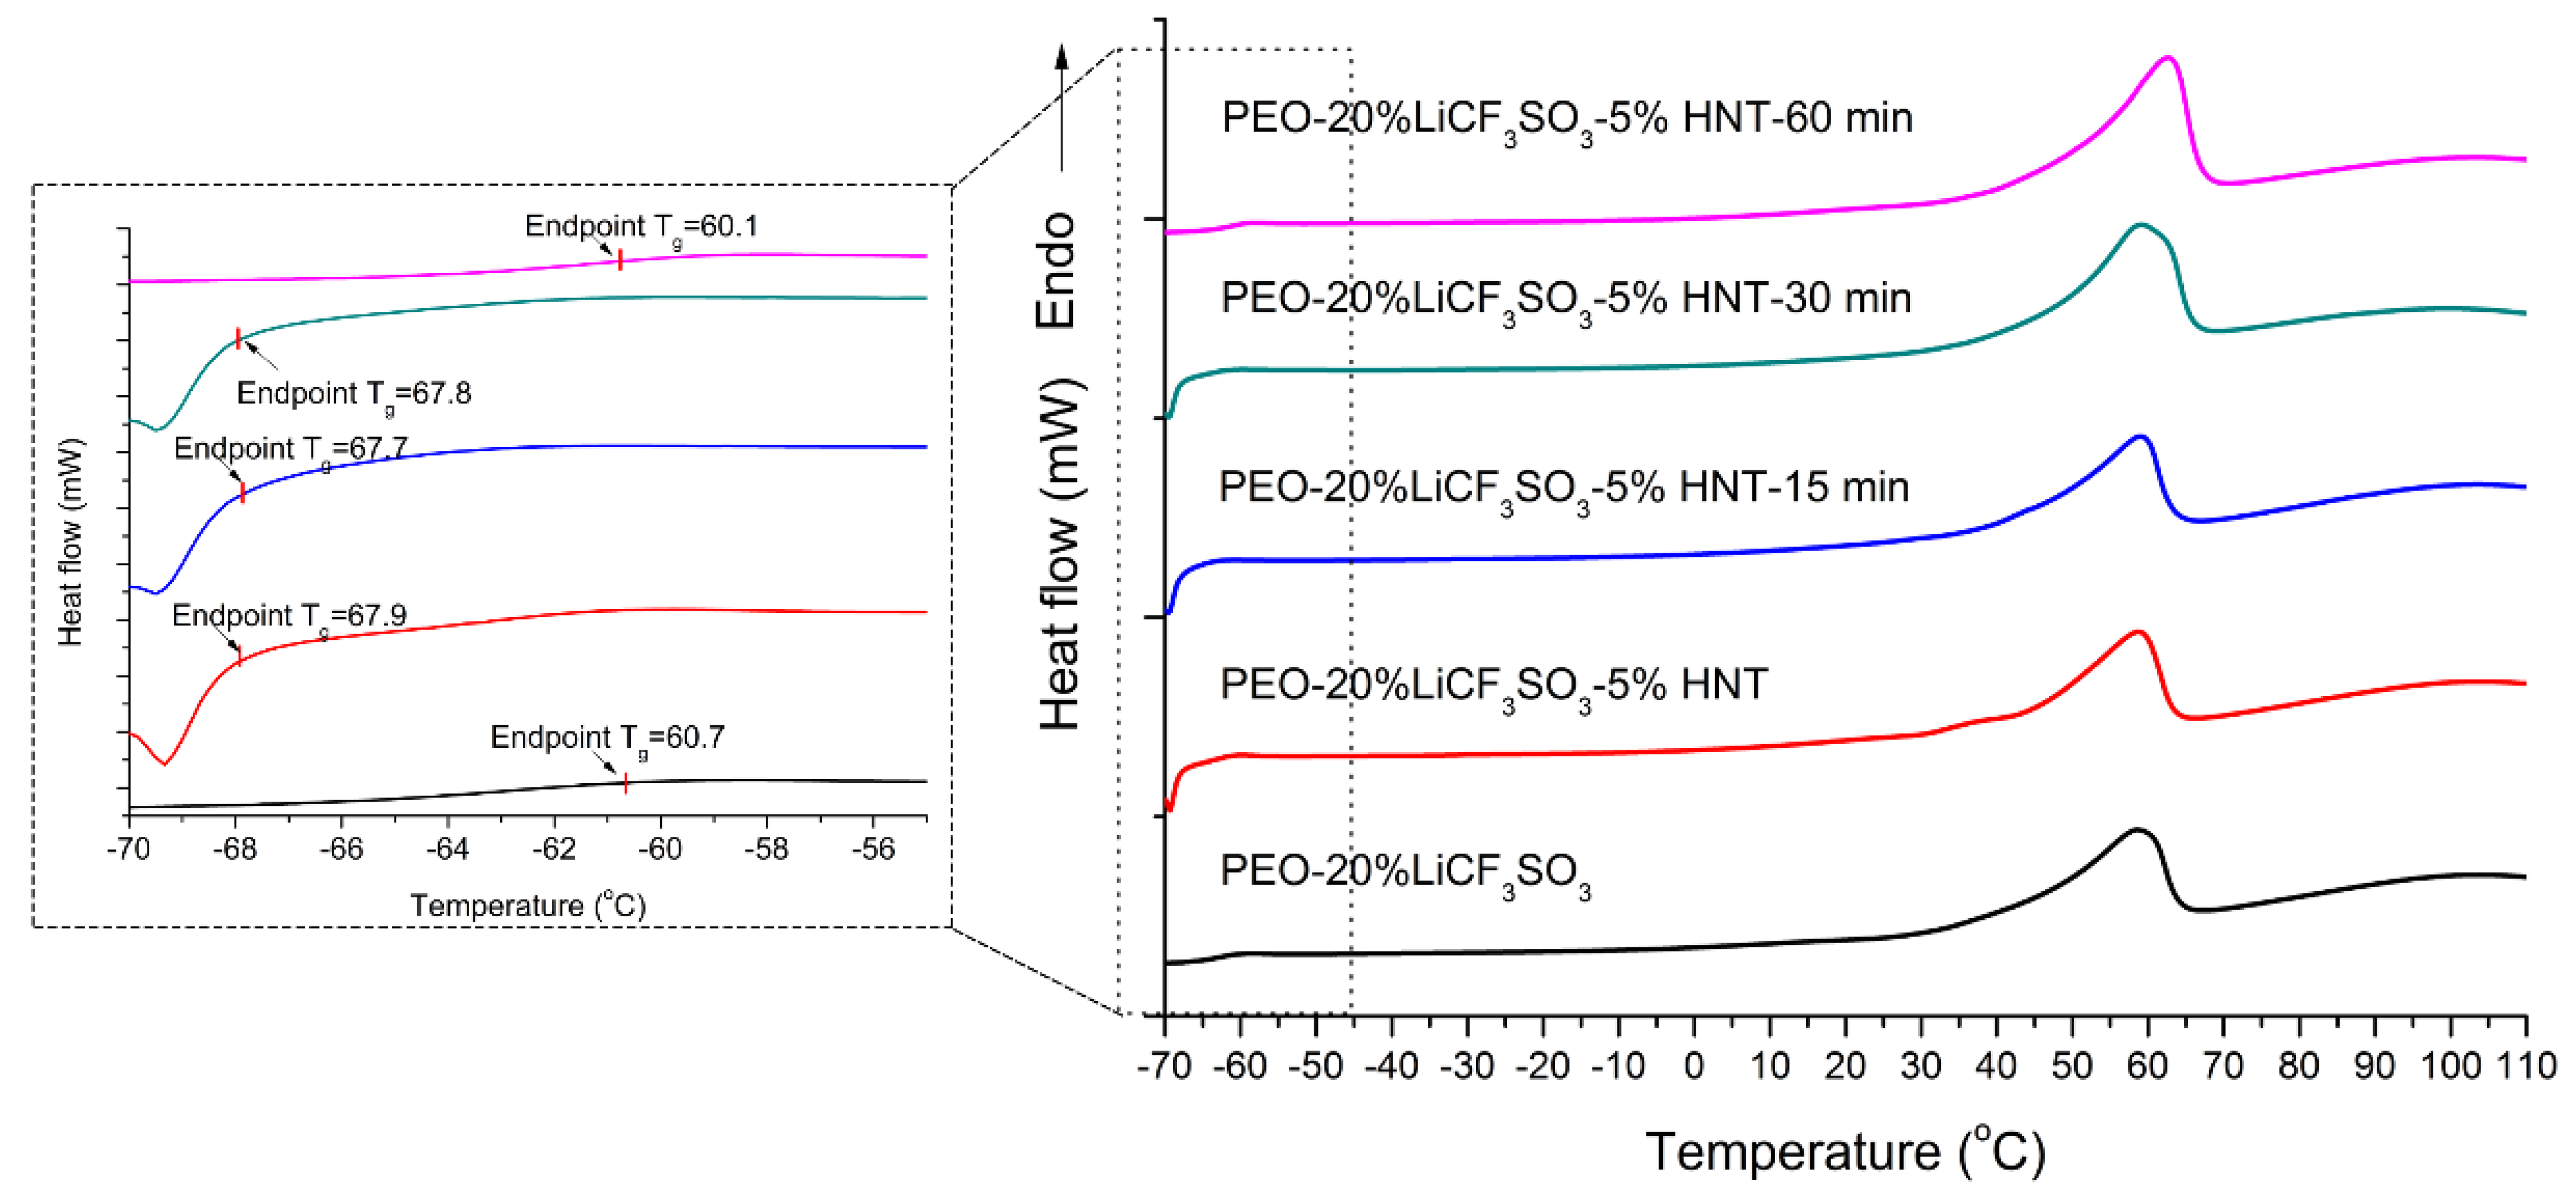
3.2.2. DSC Analysis
3.3. Effect of Ultrasonication on PEO−LiCF3SO3−HNT Complex
3.4. Effect of Ultrasonication on Ionic Conductivity
3.5. Effect of Ultrasonication on Electrochemical Stability
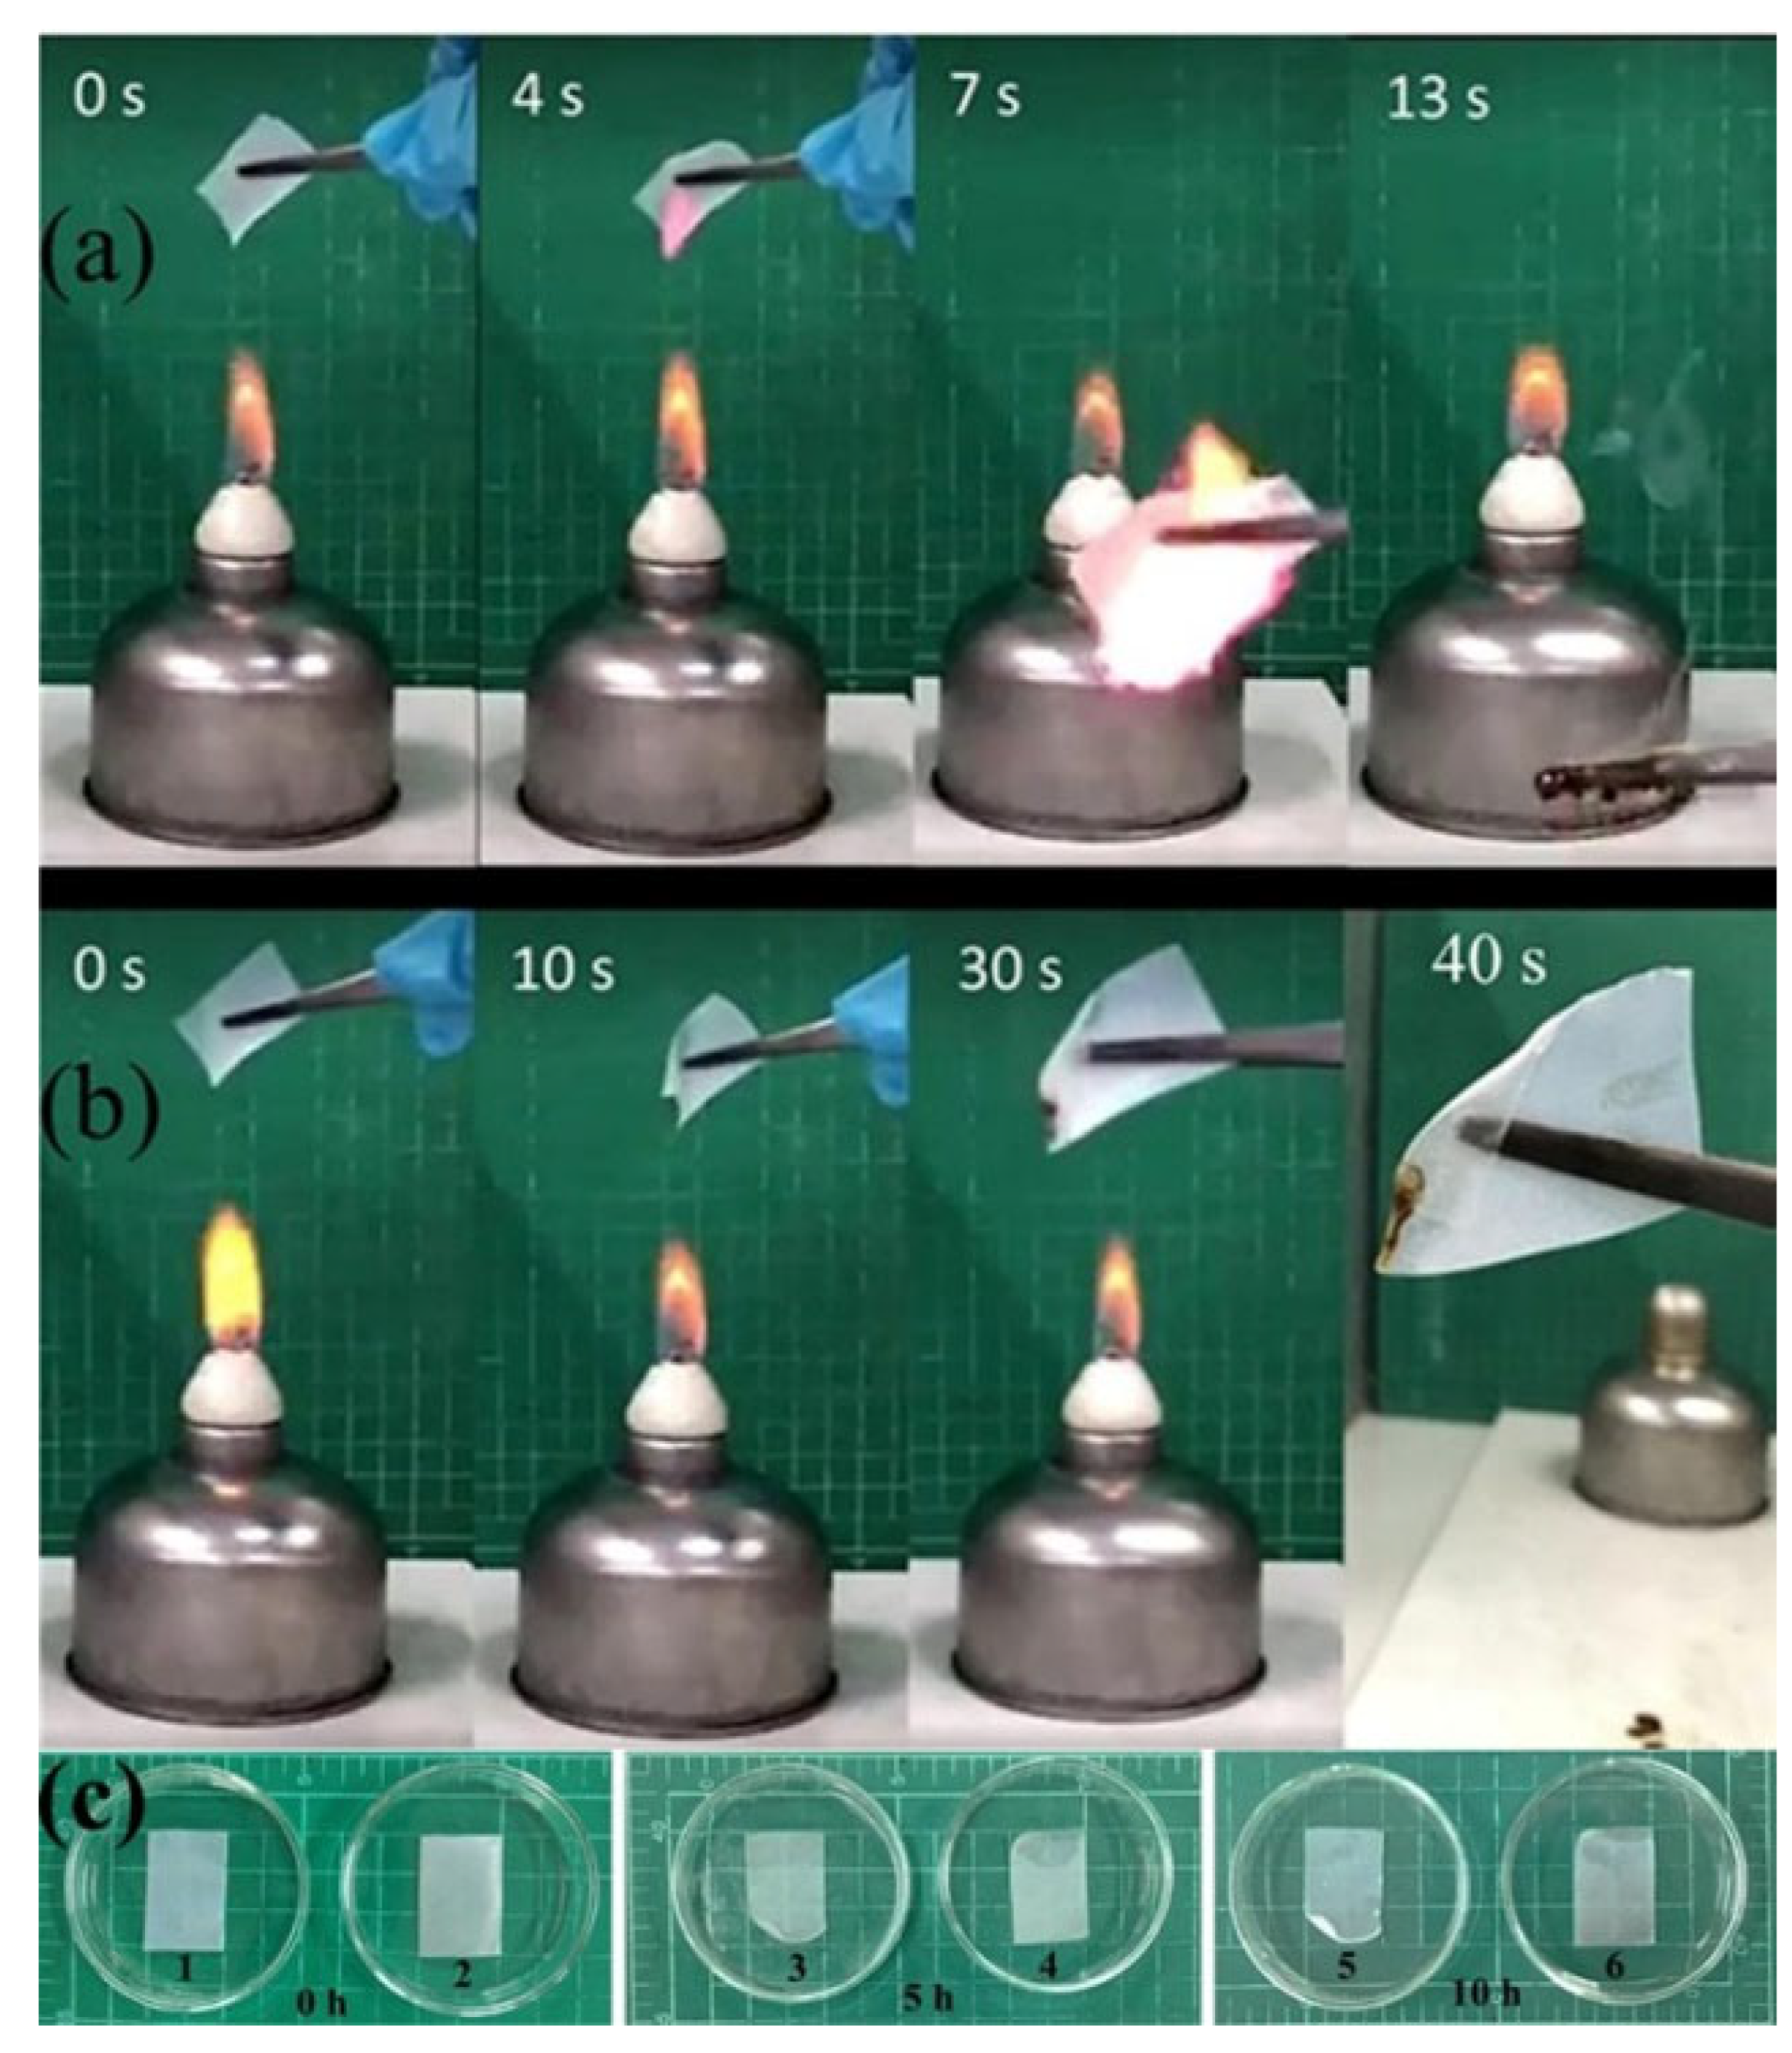
3.6. Flame Retardance Testing and Dimensional Stability
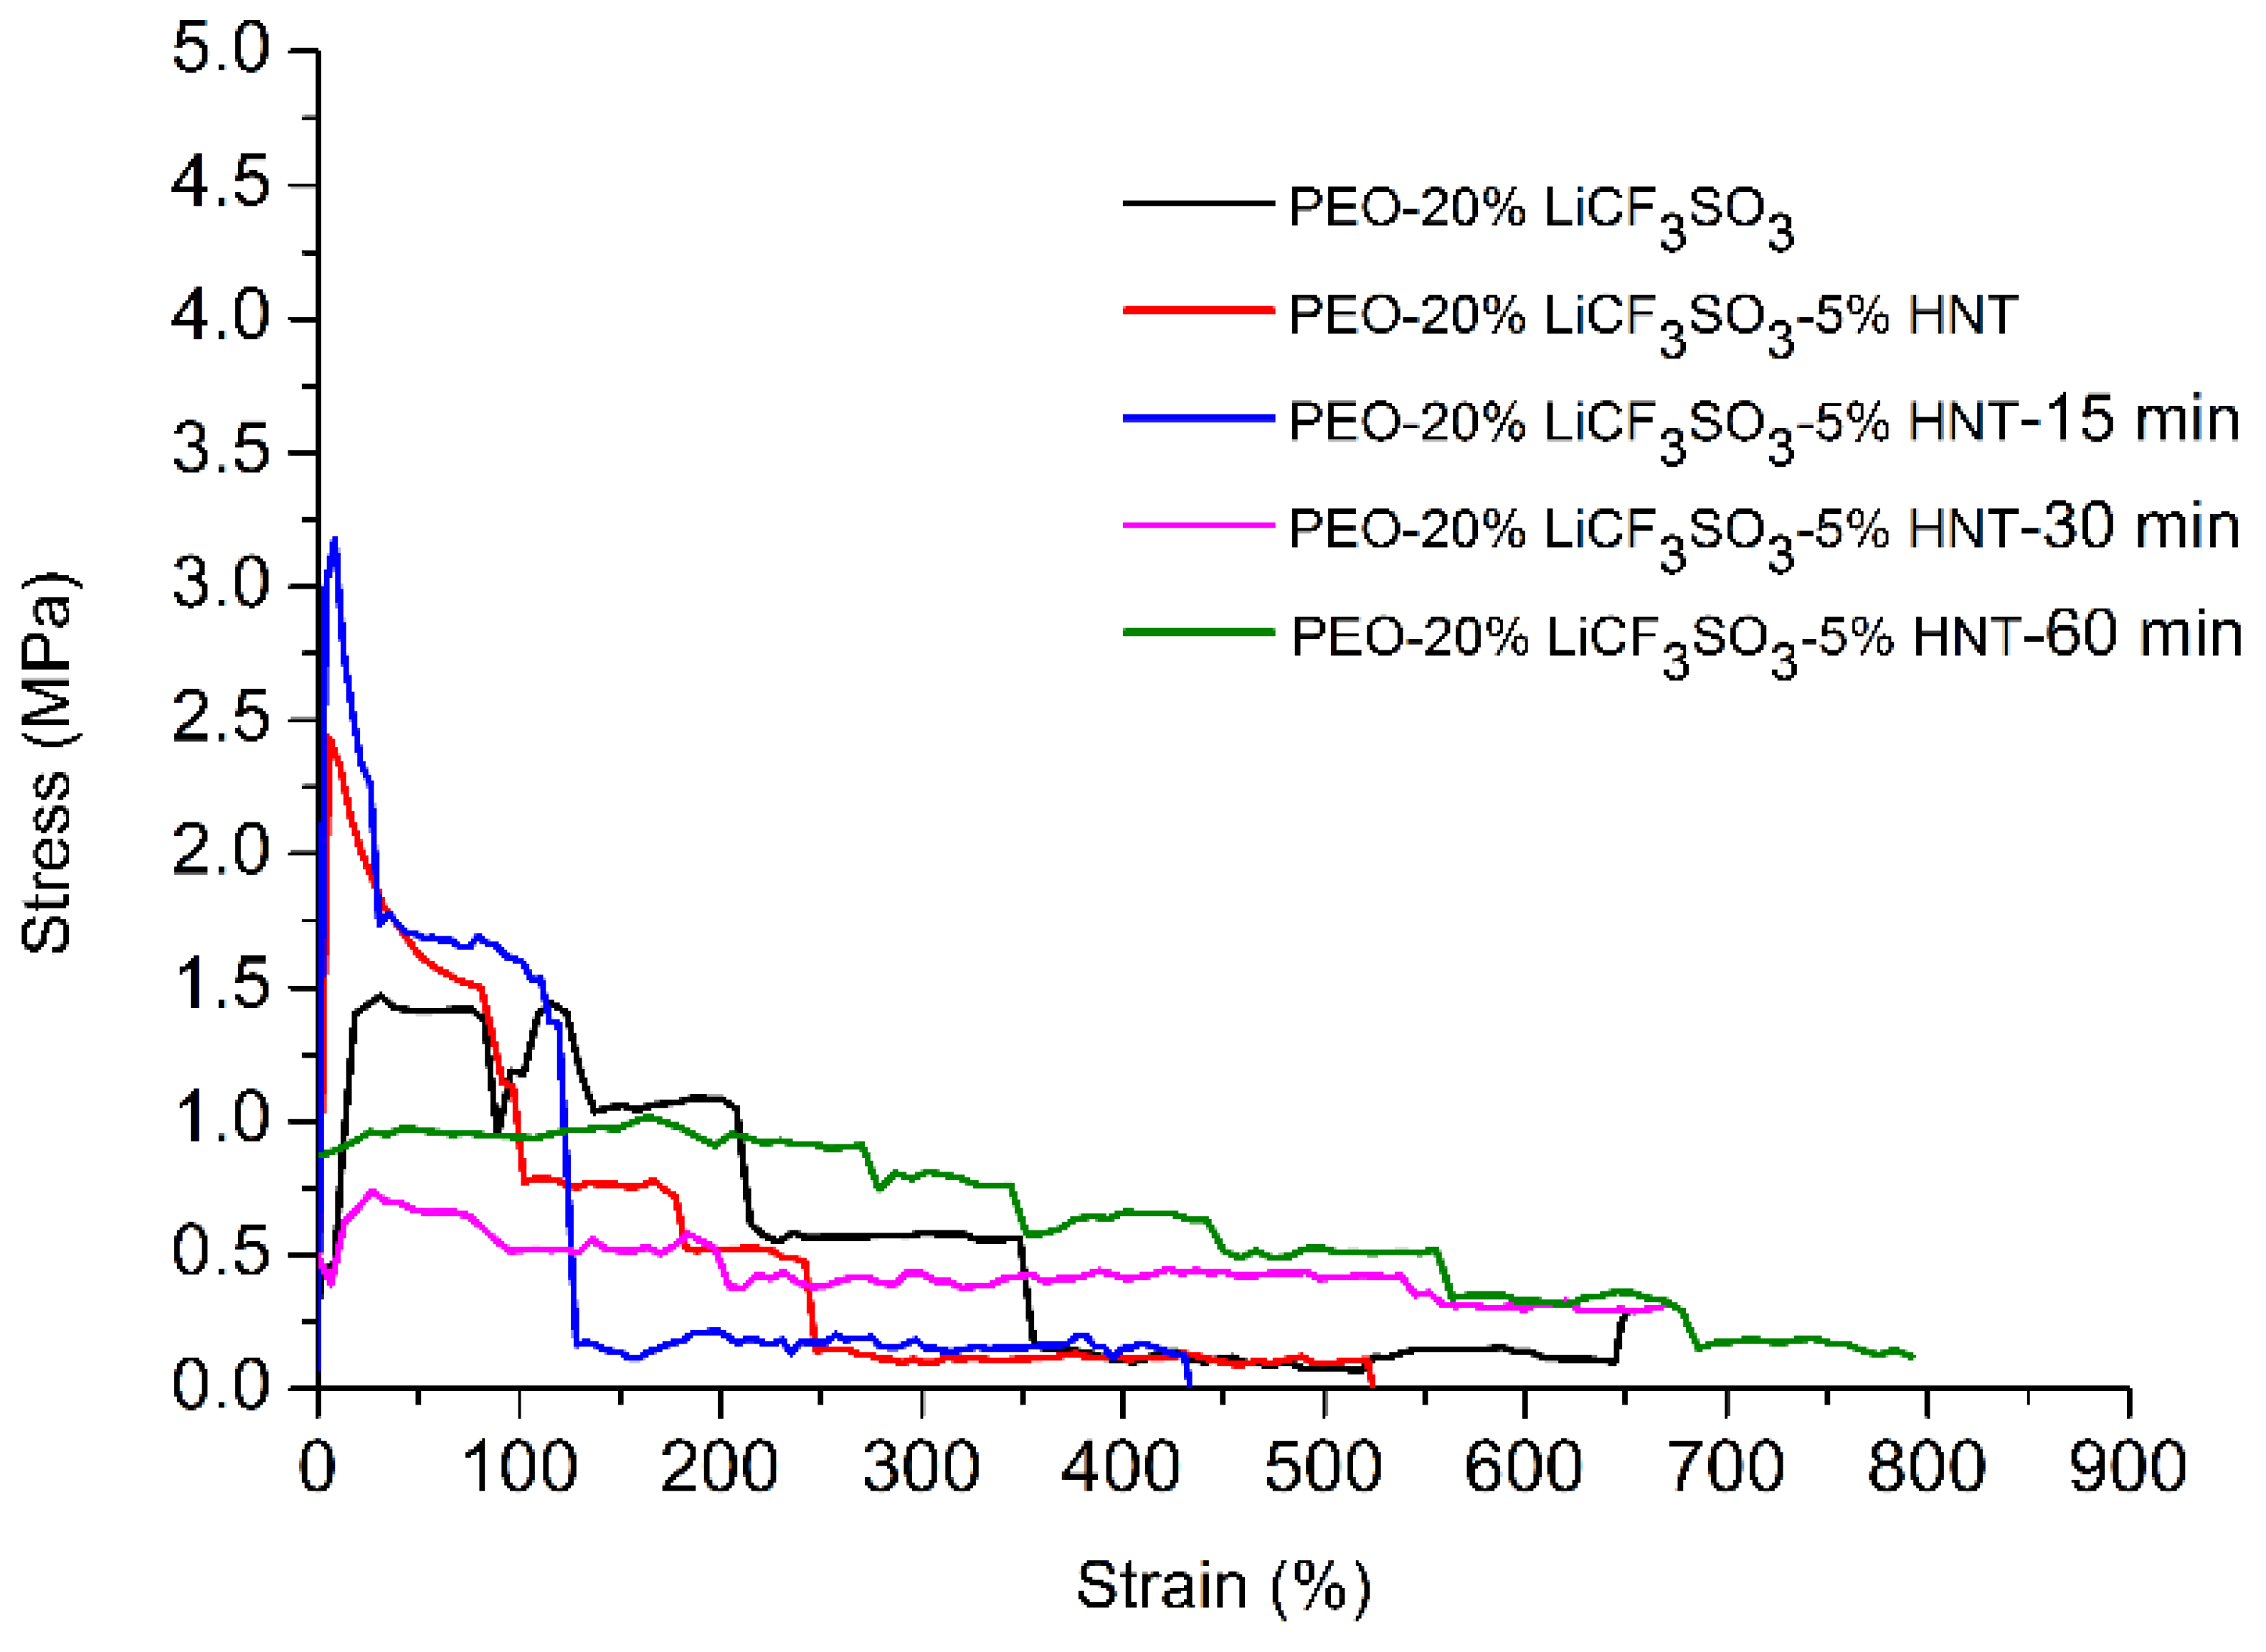
3.7. Effect of Ultrasonication on Tensile Properties
4. Conclusions
Author Contributions
Funding
Institutional Review Board Statement
Informed Consent Statement
Data Availability Statement
Conflicts of Interest
References
- Kim, H.W.; Manikandan, P.; Lim, Y.J.; Kim, J.H.; Nam, S.; Kim, Y. Hybrid solid electrolyte with the combination of Li7La3Zr2O12 ceramic and ionic liquid for high voltage pseudo-solid-state Li-ion batteries. J. Mater. Chem. A 2016, 4, 17025–17032. [Google Scholar] [CrossRef]
- Zhang, Y.; Lu, W.; Cong, L.; Liu, J.; Sun, L.; Mauger, A.; Julien, C.M.; Xie, H.; Liu, J. Cross-linking network based on Poly(ethylene oxide): Solid polymer electrolyte for room temperature lithium battery. J. Power Sources 2019, 420, 63–72. [Google Scholar] [CrossRef]
- Choi, J.-H.; Lee, C.-H.; Yu, J.-H.; Doh, C.-H.; Lee, S.-M. Enhancement of ionic conductivity of composite membranes for all-solid-state lithium rechargeable batteries incorporating tetragonal Li7La3Zr2O12 into a polyethylene oxide matrix. J. Power Sources 2015, 274, 458–463. [Google Scholar] [CrossRef]
- Liu, Y.-H.; Chen, K.T.; Liu, B.H. Fabrication of composite probe electrode used for localized impedance analysis of solid-state electrolyte LATP. Solid State Ion. 2019, 336, 11–18. [Google Scholar] [CrossRef]
- Zhao, Y.; Wang, L.; Zhou, Y.; Liang, Z.; Tavajohi, N.; Li, B.; Li, T. Solid Polymer Electrolytes with High Conductivity and Transference Number of Li Ions for Li-Based Rechargeable Batteries. Adv. Sci. 2021, 8, 2003675. [Google Scholar] [CrossRef] [PubMed]
- Fu, X.; Yu, D.; Zhou, J.; Li, S.; Gao, X.; Han, Y.; Qi, P.; Feng, X.; Wang, B. Inorganic and organic hybrid solid electrolytes for lithium-ion batteries. CrystEngComm 2016, 18, 4236–4258. [Google Scholar] [CrossRef]
- Khurana, R.; Schaefer, J.L.; Archer, L.A.; Coates, G.W. Suppression of Lithium Dendrite Growth Using Cross-Linked Polyethylene/Poly(ethylene oxide) Electrolytes: A New Approach for Practical Lithium-Metal Polymer Batteries. J. Am. Chem. Soc. 2014, 136, 7395–7402. [Google Scholar] [CrossRef]
- Dam, T.; Karan, N.K.; Thomas, R.; Pradhan, D.K.; Katiyar, R.S. Observation of ionic transport and ion-coordinated segmental motions in composite (polymer-salt-clay) solid polymer electrolyte. Ionics 2015, 21, 401–410. [Google Scholar] [CrossRef]
- Mohanta, J.; Singh, U.P.; Panda, S.K.; Si, S. Enhancement of Li+ ion conductivity in solid polymer electrolytes using surface tailored porous silica nanofillers. Adv. Nat. Sci. Nanosci. Nanotechnol. 2016, 7, 035011. [Google Scholar] [CrossRef]
- Jia, W.; Li, Z.; Wu, Z.; Wang, L.; Wu, B.; Wang, Y.; Cao, Y.; Li, J. Graphene oxide as a filler to improve the performance of PAN-LiClO4 flexible solid polymer electrolyte. Solid State Ion. 2018, 315, 7–13. [Google Scholar] [CrossRef]
- Dean, K.; Krstina, J.; Tian, W.; Varley, R.J. Effect of Ultrasonic Dispersion Methods on Thermal and Mechanical Properties of Organoclay Epoxy Nanocomposites. Macro. Mol. Mater. Eng. 2007, 292, 415–427. [Google Scholar] [CrossRef]
- Parveen, S.; Rana, S.; Ferreira, S.; Filho, A.; Fangueiro, R. Ultrasonic dispersion of micro crystalline cellulose for developing cementitious composites with excellent strength and stiffness. Ind. Crops Prod. 2018, 122, 156–165. [Google Scholar] [CrossRef]
- Yuhana, N.Y.; Ahmad, S.; Bahri, A.R.S. The Effect of Ultrasonic Treatment on Thermal Stability of the Cured Epoxy/Layered Silicate Nano composite. Adv. Mater. Sci. Eng. 2012, 2012, 789815. [Google Scholar] [CrossRef]
- Jokar, A.; Azizi, M.H.; Esfehani, Z.H.; Abbasi, S. Effects of ultrasound time on the properties of methylcellulose-montmorillonite films. Int. Nano Lett. 2017, 7, 59–68. [Google Scholar] [CrossRef]
- Lun, H.; Ouyang, J.; Yang, H. Enhancing dispersion of halloysite nanotubes via chemical modification. Phys. Chem. Miner. 2014, 41, 281–288. [Google Scholar] [CrossRef]
- Pongsuk, P.; Pumchusak, J. Effects of Natural Clay on Ionic Conductivity, Crystallinity and Thermal Properties of PEO-LiCF3SO3-Natural Clay as Solid Polymer Electrolyte Nanocomposites. Key Eng. Mater. 2020, 803, 98–103. [Google Scholar] [CrossRef]
- Zhou, X.; Yin, Y.; Wang, Z.; Zhou, J.; Huang, H.; Mansour, A.N.; Zaykoski, J.A.; Fedderly, J.J.; Balizer, E. Effect of hot pressing on the ionic conductivity of the PEO/LiCF3SO3 based electrolyte membranes. Solid State Ion. 2011, 196, 18–24. [Google Scholar] [CrossRef]
- Shao, L.; Wang, X.; Yang, B.; Wang, Q.; Tian, Q.; Ji, Z.; Zhang, J. A Highly Sensitive Ascorbic Acid Sensor Based on Hierarchical Polyaniline Coated Halloysite Nanotubes Prepared by Electrophoretic Deposition. Electrochim. Acta 2017, 255, 286–297. [Google Scholar] [CrossRef]
- Weon, J.-I.; Xia, Z.Y.; Sue, H.J. Morphological characterization of nylon-6 nanocomposite following a large-scale simple shear process. J. Polym. Sci. Part B Polym. Phys. 2005, 43, 3555–3566. [Google Scholar] [CrossRef]
- Chrissopoulou, K.; Andrikopoulos, K.S.; Fotiadou, S.; Bollas, S.; Karageorgaki, C.; Christofilos, D.; Voyiatzis, G.A.; Anastasiadis, S.H. Crystallinity and Chain Conformation in PEO/Layered Silicate Nanocomposites. Macromolecules 2011, 44, 9710–9722. [Google Scholar] [CrossRef]
- Elashmawi, I.S.; Elsayed, N.H.; Altalhi, F.A. The changes of spectroscopic, thermal and electrical properties of PVDF/PEO containing lithium nanoparticles. J. Alloys Compd. 2014, 617, 877–883. [Google Scholar] [CrossRef]
- Polu, A.R.; Rhee, H.-W. Nanocomposite solid polymer electrolytes based on poly(ethylene oxide)/POSS-PEG (n = 13.3) hybrid nanoparticles for lithium ion batteries. J. Ind. Eng. Chem. 2015, 31, 323–329. [Google Scholar] [CrossRef]
- Talaat, H.; Turky, G.; Abdelghany, A.M.; Fathia, M. Structure-dynamic properties relationships in poly(ethylene oxide)/silicon dioxide nanocomposites:dielectric relaxation study. Polym. Bull. 2021, 78, 5205–5223. [Google Scholar]
- Garcia-Garcia, D.; Ferri, J.M.; Ripoll, L.; Hidalgo, M.; Lopez-Martinez, J.; Balart, R. Characterization of selectively etched halloysite nanotubes by acid treatment. Appl. Surf. Sci. 2017, 422, 616–625. [Google Scholar] [CrossRef]
- Abreha, M.; Subrahmanyam, A.R.; Kumar, J.S. Ionic conductivity and transport properties of poly(vinylidene fluoride-co-hexafluoropropylene)-based solid polymer electrolytes. Chem. Phys. Lett. 2016, 658, 240–247. [Google Scholar] [CrossRef]
- Kiliaris, P.; Papaspyrides, C.D. Polymer/layered silicate (clay) nanocomposites: An overview of flame retardancy. Prog. Polym. Sci. 2010, 35, 902–958. [Google Scholar] [CrossRef]
- Angulakshmi, N.; Thomas, S.; Nahm, K.S.; Stephan, A.M.; Elizabeth, R.N. Electrochemical and mechanical properties of nanochitin-incorporated PVDF-HFP-based polymer electrolytes for lithium batteries. Ionics 2011, 17, 407–414. [Google Scholar] [CrossRef]
- Klongkan, S.; Pumchusak, J. Effects of Nano Alumina and Plasticizers on Morphology, Ionic Conductivity, Thermal and Mechanical Properties of PEO-LiCF3SO3 Solid Polymer Electrolyte. Electrochim. Acta 2015, 161, 171–176. [Google Scholar] [CrossRef]
- Jang, H.S.; Raj, C.J.; Lee, W.-G.; Kim, B.C.; Yu, K.H. Enhanced supercapacitive performances of functionalized activated carbon in novel gel polymer electrolytes with ionic liquid redox-mediated poly(vinyl alcohol)/phosphoric acid. RSC Adv. 2016, 6, 75376–75383. [Google Scholar] [CrossRef]
- Pu, Y.; Zou, Q.; Hou, D.; Zhang, Y.; Chen, S. Molecular weight kinetics and chain scission models for dextran polymers during ultrasonic degradation. Carbohydr. Polym. 2017, 156, 71–76. [Google Scholar] [CrossRef]
- Sim, L.H.; Gan, S.N.; Chan, C.H.; Yahya, R. ATR-FTIR studies on ion interaction of lithium perchlorate in polyacrylate/poly(ethylene oxide) blends, Spectrochim. Acta A Mol. Biomol. Spectrosc. 2010, 76, 287–292. [Google Scholar] [CrossRef] [PubMed]
- Selvasekarapandian, S.; Baskaran, R.; Kamishima, O.; Kawamura, J.; Hattori, T. Laser Raman and FTIR studies on Li+ interaction in PVAc–LiClO4 polymer electrolytes. Spectrochim. Acta A Mol. Biomol. Spectrosc. 2006, 65, 1234–1240. [Google Scholar] [CrossRef] [PubMed]
- Isa, K.B.M.; Osman, Z.; Arof, A.K.; Othman, L.; Zainol, N.H.; Samin, S.M.; Chong, W.G.; Kamarulzaman, N. Lithium ion conduction and ion–polymer interaction in PVdF-HFP based gel polymer electrolytes. Solid State Ion. 2014, 268, 288–293. [Google Scholar] [CrossRef]
- Frech, R.; Chintapalli, S.; Bruce, P.G.; Vincent, C.A. Crystalline and Amorphous Phases in the Poly(ethylene oxide)−LiCF3SO3 System. Macromolecules 1999, 32, 808–813. [Google Scholar] [CrossRef]
- Winie, T.; Muhammad, F.; Hazwani, N. Effect of Anion Size on the Conductivity Behaviour of Hexanoyl Chitosan-Based Polymer Electrolytes. Adv. Mat. Res. 2012, 545, 317–320. [Google Scholar] [CrossRef]
- Vignarooban, K.; Dissanayake, M.A.K.L.; Albinsson, I.; Mellander, B.-E. Effect of TiO2 nano-filler and EC plasticizer on electrical and thermal properties of poly(ethylene oxide) (PEO) based solid polymer electrolytes. Solid State Ion. 2014, 266, 25–28. [Google Scholar] [CrossRef]
- Suait, M.S.; Ahmad, A.; Hamzah, H.; Rahman, M.Y.A. Effect of lithium salt concentrations on blended 49% poly(methyl methacrylate) grafted natural rubber and poly(methyl methacrylate) based solid polymer electrolyte. Electrochim. Acta 2011, 57, 123–131. [Google Scholar] [CrossRef]
- Polu, A.R.; Rhee, H.-W. Effect of TiO2 nanoparticles on structural, thermal, mechanical and ionic conductivity studies of PEO12–LiTDI solid polymer electrolyte. J. Ind. Eng. Chem. 2016, 37, 347–353. [Google Scholar] [CrossRef]
- Barzegar, F.; Dangbegnon, J.K.; Bello, A.; Momodu, D.Y.; Johnson, A.T.C.; Manyala, N. Effect of conductive additives to gel electrolytes on activated carbon-based supercapacitors. AIP Adv. 2015, 5, 097171. [Google Scholar] [CrossRef]
- Lin, Y.; Wang, X.; Liu, J.; Miller, J.D. Natural halloysite nano-clay electrolyte for advanced all-solid-state lithium-sulfur batteries. Nano Energy 2017, 31, 478–485. [Google Scholar] [CrossRef]
- Chew, K.W.; Tan, K.W. The Effects of Ceramic Fillers on PMMA-Based Polymer Electrolyte Salted with Lithium Triflate, LiCF3SO3. Int. J. Electrochem. Sci. 2011, 6, 5792–5801. [Google Scholar]
- Jinisha, B.; Anilkumar, K.M.; Manoj, M.; Pradeep, V.S.; Jayalekshmi, S. Development of a novel type of solid polymer electrolyte for solid state lithium battery applications based on lithium enriched poly (ethylene oxide) (PEO)/poly (vinyl pyrrolidone) (PVP) blend polymer. Electrochim. Acta 2017, 235, 210–222. [Google Scholar]
- Deng, D. Li-ion batteries: Basics, progress, and challenges. Energy Sci. Eng. 2015, 3, 385–418. [Google Scholar] [CrossRef]
- Pavlinakova, V.; Fohlerova, Z.; Pavlinak, D.; Khunova, V.; Vojtova, L. Effect of halloysite nanotube structure on physical, chemical, structural and biological properties of elastic polycaprolactone/gelatin nanofibers for wound healing applications. Mater. Sci. Eng. C 2018, 91, 94–102. [Google Scholar] [CrossRef] [PubMed]
- Pignanelli, F.; Romero, M.; Faccio, R.; Fernández-Werner, L.; Mombru, A.W. Enhancement of Lithium-Ion Transport in Poly(acrylonitrile) with Hydrogen Titanate Nanotube Fillers as Solid Polymer Electrolytes for Lithium-Ion Battery Applications. J. Phys. Chem. C 2018, 122, 1492–1499. [Google Scholar] [CrossRef]
- Carli, L.N.; Crespo, J.S.; Mauler, R.S. PHBV nanocomposites based on organomodified montmorillonite and halloysite: The effect of clay type on the morphology and thermal and mechanical properties. Compos. Part A Appl. Sci. Manuf. 2011, 42, 1601–1608. [Google Scholar] [CrossRef]


| Samples | Tg end point (°C) | Tm (°C) | ΔHm (J/g) | Degree of Crystallinity (%) | |
|---|---|---|---|---|---|
| DSC | XRD | ||||
| PEO−20%LiCF3SO3 | −60.7 | 58.2 | 67.32 | 31.50 | 35.25 |
| PEO−20%LiCF3SO3−5%HNT | −67.9 | 58.4 | 54.09 | 23.41 | 30.26 |
| PEO−20%LiCF3SO3−5%HNT−15 min | −67.7 | 58.8 | 52.54 | 22.74 | 26.24 |
| PEO−20%LiCF3SO3−5%HNT−30 min | −67.8 | 58.7 | 68.38 | 29.60 | 35.58 |
| PEO−20%LiCF3SO3−5%HNT−60 min | −60.1 | 62.4 | 69.34 | 30.01 | 36.11 |
| Samples | Wavenumber (cm−1) | ||||||||
|---|---|---|---|---|---|---|---|---|---|
| Box1 | Box2 | Box3 | Box4 | Box5 | Box6 | Box7 | Box8 | Box9 | |
| CF3 Stretch | CH2 Rock | CH2 Rock | C-O-C | CH2 Twist | CH2 Wag | CH2 Scissor | CH2 Stretch | OH Stretch | |
| a | 639 | 841 | 960, 948 | 1147, 1097, 1060 | 1279, 1259, 1241 | 1359, 1341 | 1467, 1454 | 2882 | 3494 |
| b | 639 | 841 | 961, 946 | 1147, 1097, 1060 | 1279, 1259, 1242 | 1359, 1342 | 1467, 1455 | 2884 | 3487 |
| c | 641 | 844 | 963, 949 | 1148, 1098, 1062 | 1281, 1260, 1244 | 1361, 1343 | 1469, 1457 | 2885 | 3493 |
| d | 638 | 842 | 960, 947 | 1146, 1096, 1061 | 1278, 1255, 1242 | 1359, 1341 | 1467, 1454 | 2881 | 3487 |
| e | 638 | 842 | 960, 946 | 1144, 1095, 1061 | 1278, 1253, 1266 | 1359, 1342 | 1467, 1455 | 2882 | 3487 |
| Solid Polymer Electrolytes | Ultrasonication Time (min) | Ionic Conductivity (S/cm) |
|---|---|---|
| PEO−20%LiCF3SO3−5%HNT | 0 | 6.6 ± 1.33 × 10⁻⁶ |
| 5 | 1.3 ± 0.83 × 10⁻⁵ | |
| 10 | 1.5 ± 0.03 × 10⁻⁵ | |
| 15 | 1.1 ± 0.19 × 10⁻⁴ | |
| 30 | 1.7 ± 0.84 × 10⁻⁵ | |
| 60 | 1.5 ± 1.24 × 10⁻⁵ | |
| PEO−20%LiCF3SO3−10%HNT | 0 | 1.4 ± 0.17 × 10⁻⁶ |
| 15 | 5.1 ± 1.15 × 10⁻⁵ | |
| 30 | 3.6 ± 1.15 × 10⁻⁵ |
| Samples | Tensile Strength (MPa) | %Strain at Break | Stress @ 2% Offset of Strain |
|---|---|---|---|
| PEO-20%LiCF3SO3 | 1.47 ± 0.99 | 793.54 ± 3.46 | 0.43 |
| PEO-20%LiCF3SO3-5%HNT | 2.43 ± 0.44 | 525.01 ± 44.72 | 1.04 |
| PEO-20%LiCF3SO3-5%HNT-15 min | 3.18 ± 0.06 | 433.34 ± 57.74 | 1.53 |
| PEO-20%LiCF3SO3-5%HNT-30 min | 0.71 ± 0.12 | 799.98 ± 0.21 | 0.40 |
| PEO-20%LiCF3SO3-5%HNT-60 min | 1.02 ± 0.22 | 791.87 ± 4.33 | 0.87 |
Publisher’s Note: MDPI stays neutral with regard to jurisdictional claims in published maps and institutional affiliations. |
© 2022 by the authors. Licensee MDPI, Basel, Switzerland. This article is an open access article distributed under the terms and conditions of the Creative Commons Attribution (CC BY) license (https://creativecommons.org/licenses/by/4.0/).
Share and Cite
Pongsuk, P.; Pumchusak, J. Effect of Ultrasonication on the Morphology, Mechanical Property, Ionic Conductivity, and Flame Retardancy of PEO-LiCF3SO3-Halloysite Nanotube Composites for Use as Solid Polymer Electrolyte. Polymers 2022, 14, 3710. https://doi.org/10.3390/polym14183710
Pongsuk P, Pumchusak J. Effect of Ultrasonication on the Morphology, Mechanical Property, Ionic Conductivity, and Flame Retardancy of PEO-LiCF3SO3-Halloysite Nanotube Composites for Use as Solid Polymer Electrolyte. Polymers. 2022; 14(18):3710. https://doi.org/10.3390/polym14183710
Chicago/Turabian StylePongsuk, Pattranuch, and Jantrawan Pumchusak. 2022. "Effect of Ultrasonication on the Morphology, Mechanical Property, Ionic Conductivity, and Flame Retardancy of PEO-LiCF3SO3-Halloysite Nanotube Composites for Use as Solid Polymer Electrolyte" Polymers 14, no. 18: 3710. https://doi.org/10.3390/polym14183710
APA StylePongsuk, P., & Pumchusak, J. (2022). Effect of Ultrasonication on the Morphology, Mechanical Property, Ionic Conductivity, and Flame Retardancy of PEO-LiCF3SO3-Halloysite Nanotube Composites for Use as Solid Polymer Electrolyte. Polymers, 14(18), 3710. https://doi.org/10.3390/polym14183710