Article

Effect of Graphene/Spherical Graphite Ratio on the Properties of PLA/TPU Composites

Hubei Engineering Research Center for Graphite Additive Manufacturing Technology and Equipment, China Three Gorges University, Yichang 443002, China
*
Author to whom correspondence should be addressed.
Polymers 2022, 14(13), 2538; https://doi.org/10.3390/polym14132538
Submission received: 15 May 2022 / Revised: 10 June 2022 / Accepted: 16 June 2022 / Published: 22 June 2022
(This article belongs to the Special Issue Electrical and Magnetic Properties of Polymers and Polymer Composites)

Abstract

:
Wave-absorbing materials are developing in the direction of “light weight, wide frequency band, thin layer and high strength”, and it is difficult to achieve the synergy between wave-absorbing performance and mechanical properties when graphene absorbent is compounded with a single resin matrix. In this paper, based on the preparation of a new composite absorbing wire with a graphene (GR)/spherical graphite (SG) double absorbent and polylactic acid (PLA)/thermoplastic polyurethane (TPU) double matrix, we proposed a new method to prepare samples for testing the electromagnetic parameters and tensile strength by fused deposition modeling (FDM). Furthermore, the effect of SG/GR ratio on the microwave absorbing properties and mechanical properties of PLA/TPU composites was specifically studied. It was found that when the ratio of SG/GR was small (0:5, 1:4), the dielectric loss (interfacial polarization loss, dipole polarization loss, conductivity loss) and attenuation ability of the composites were stronger, and the impedance matching was better. When the SG/GR ratio was large (5:0, 4:1), the composites had high strength and toughness. When the ratio of SG/GR was moderate (2:3, 3:2), it could retain the absorbing and mechanical properties of the absorbing materials. On the one hand, the SG and PLA/TPU matrix formed an “island structure”, which improves the dispersion of GR; on the other hand, the GR and PLA/TPU matrix formed a “core-shell structure”, which promotes polarization and multiple scattering.

1. Introduction

With the advent of the 5G era, electronic communication and radar detection technology are widely used in military and civil fields, which bring convenience to human life. At the same time, the resulting electromagnetic radiation problem is becoming more and more serious, and the development of wave-absorbing materials is imminent [1,2,3]. At present, carbon materials have extraordinary application potential for sensors, biology, energy, environment and other fields [4,5,6]. Because of their light weight, strong conductivity, good stability and other advantages, they can effectively replace traditional wave absorbing materials [7]. However, carbon-based materials (such as spherical graphite (SG), carbon black (CB), carbon fiber (CF), carbon nanotubes (CNTs), graphene (GR), etc.) mostly exist in the form of powder and fiber, which are difficult to form, and the impedance matching level is low when used alone. Therefore, researchers often combine them with various matrices (such as epoxy resin (EP), polypropylene (PP), polyoxyethylene (POE), polylactide (PLA), thermoplastic polyurethane (TPU), etc.) to improve the molding process, and adjust the impedance matching by reducing the electrical conductivity, which makes it possible to design and manufacture complex and efficient wave absorbers based on carbon materials.
Graphene (GR), as a carbon allotrope, is generally prepared by mechanical stripping, oxidation-reduction and chemical deposition [5]. It has excellent conductivity, usually used as an electrode material because of its two-dimensional porous structure and large specific surface area, and is expected to become the most ideal high-efficiency absorbent [8,9]. Xue [10] mixed a graphene oxide aqueous dispersion with liquid epoxy resin by wet transfer-three-roll grinding and prepared a graphene oxide/epoxy resin composite by the mold casting process, which obtained good dispersion and wave absorption effect. However, the temperature was difficult to control and a special mold needed to be developed which led to high costs. Liu [11] developed GR/PLA composite wires with different contents, and then realized the rapid preparation of porous absorbers by FDM technology. The effective absorption bandwidth reached 6.7 GHz and the maximum reflection loss was −33 dB. However, when the GR content was high, its strength and toughness were insufficient.
In recent years, researchers have mostly focused on the broadband and strong absorption of absorbing materials, but paid little attention to the mechanical properties of practical engineering applications. On the choice of matrix, He [12] and others prepared PLA/TPU nanofiber composites with in situ ordered orientation by the melt blending method. The elongation at break was about 12 times that of pure PLA and reached 113% [13], which greatly improved the brittleness of the single PLA matrix. On the choice of filler, Yu [14] filled graphene nanosheets/nano-SiO2 hybrid particles into an epoxy resin matrix. He found that, compared with a single filler, binary hybrid particles had the best reinforcing and toughening effect on composites.
In this paper, GR and SG were selected as binary carbon-based absorbents. After preparing SG/GR/PLA/TPU composite wires with six SG/GR ratios (5:0, 4:1, 3:2, 2:3, 1:4, 0:5) by the two-step method [3], coaxial rings and tensile samples were quickly prepared by FDM technology. Firstly, the microstructure, lattice structure, chemical bonds and functional groups of SG and GR were characterized by SEM, TEM and FTIR. The phase structure and graphitization degree of the composites were further analyzed by XRD and Raman spectroscopy. Secondly, the mechanism of dielectric loss was revealed by electromagnetic parameter test. The reflectivity, attenuation constant and value were calculated by the formula, and the influence of SG/GR ratio on the microwave absorbing properties of the composites was studied. Finally, based on the tensile test and the micro-morphology of the composite powder, the influence of SG/GR ratio on the mechanical properties of the composite was studied by analyzing the dispersion state of SG and GR in PLA/TPU, which provided a reference for high strength and high toughness absorbing materials.

2. Experimental Section

2.1. Materials and Instruments

The raw materials and instruments required for the experiment are shown in Table 1 and Table 2, respectively.

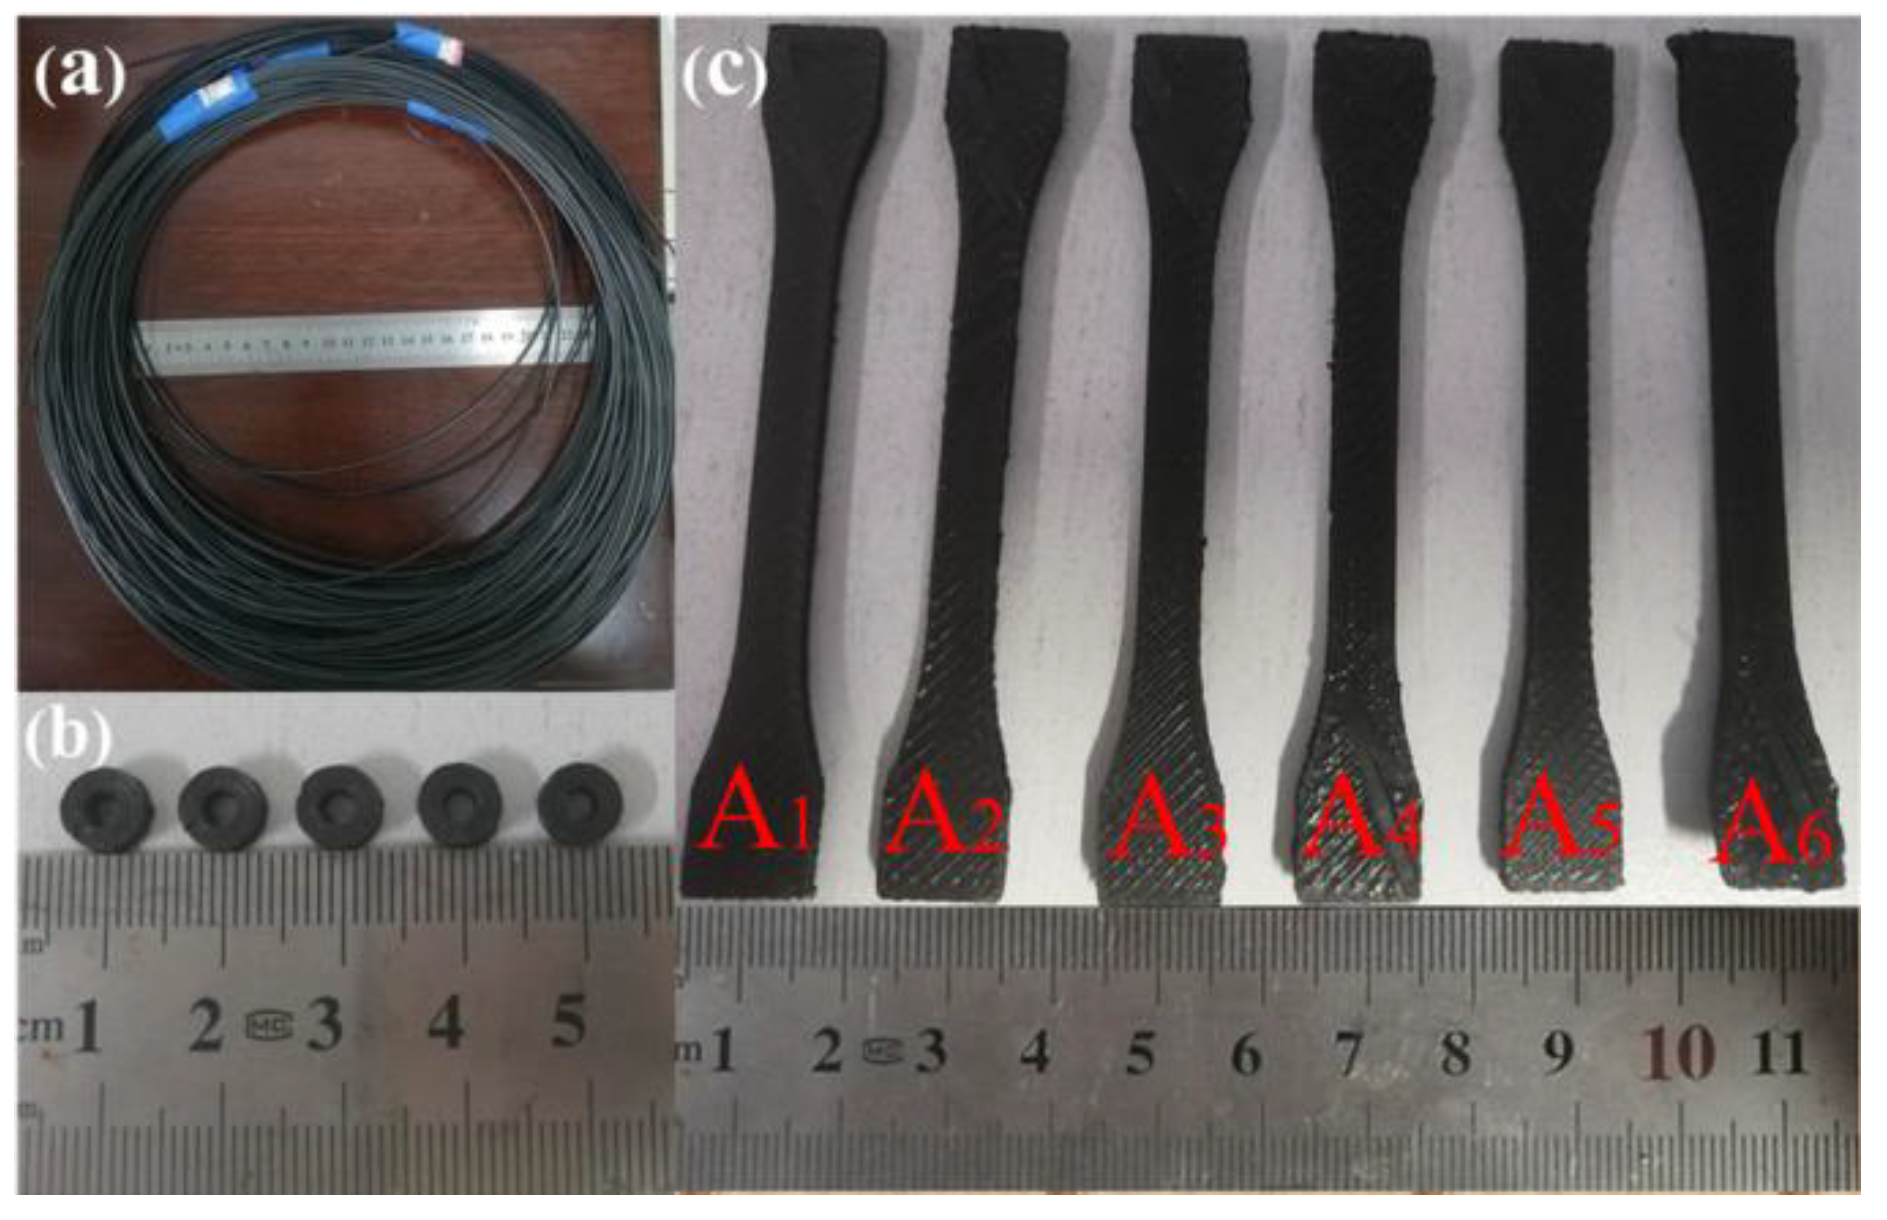
2.2. Preparation of SG/GR/PLA/TPU Composites

PLA and TPU powders were dried in an electrothermal constant-temperature blast drying oven at 60 °C for 6 h before being used, then mixed with SG and GR powders and zirconia beads in a horizontal planetary ball mill at a mass ratio of 1:1 for 3.5 h to obtain composite powders with different contents. Then, a single-screw extruder (130 °C in the first zone of the barrel, 150 °C in the second zone of the barrel, 170 °C in the die mouth, 16 r/min in the screw speed and 8 r/min in the traction speed) was used to prepare the corresponding 3D printing composite wire (Figure 1a, the wire diameter is Φ1.75 ± 0.05 mm), and its formula composition is shown in Table 3.
The composite wire rods were printed with double nozzle printer (nozzle temperature was 210 °C, platform temperature 50 °C, printing speed 30 mm/s, filling rate 100%) to prepare electromagnetic parameter samples and tensile samples. The electromagnetic parameter sample was a coaxial ring with an outer diameter of 7 mm, an inner diameter of 3.04 mm and a thickness of 2.5 mm, as shown in Figure 1b. Tensile specimen was the 1BA specimen of GB/T 1040.1-2006 standard, as shown in Figure 1c.

2.3. Performance Characterization

The methods for testing and characterizing the properties of SG, GR and SG/GR/PLA/TPU composites are shown in Table 4 below

3. Results and Discussion

3.1. Material Characterization Analysis

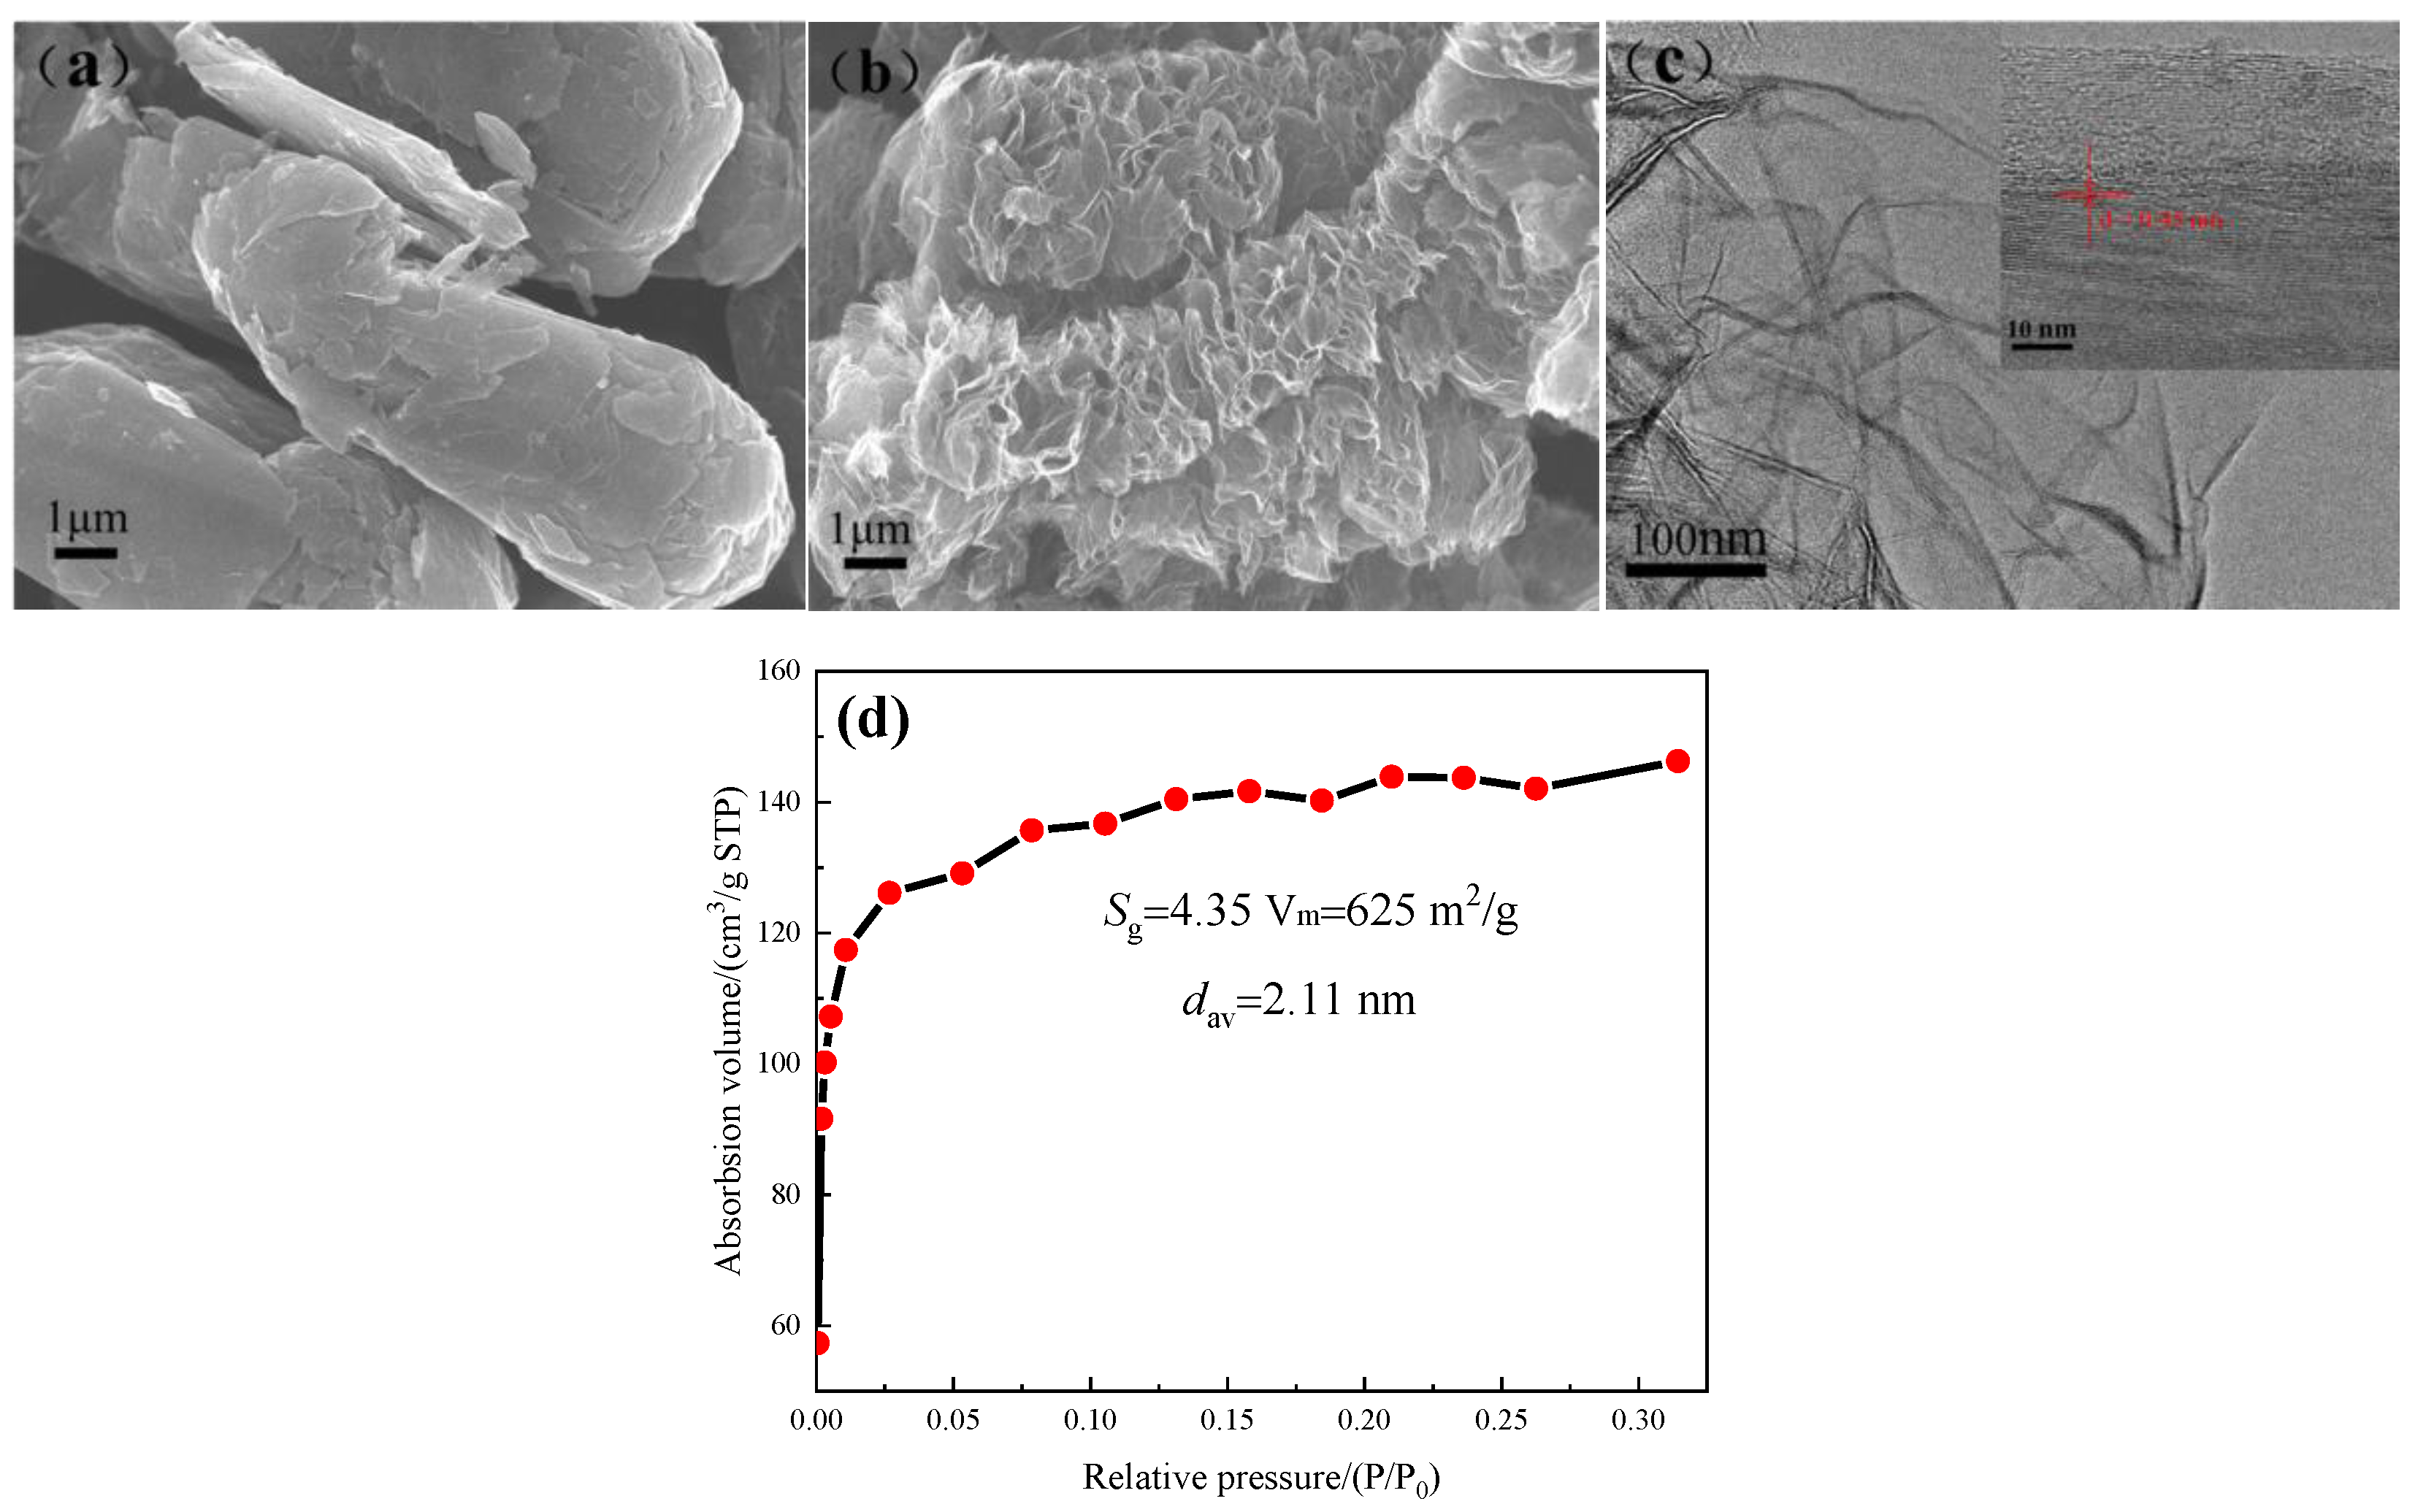
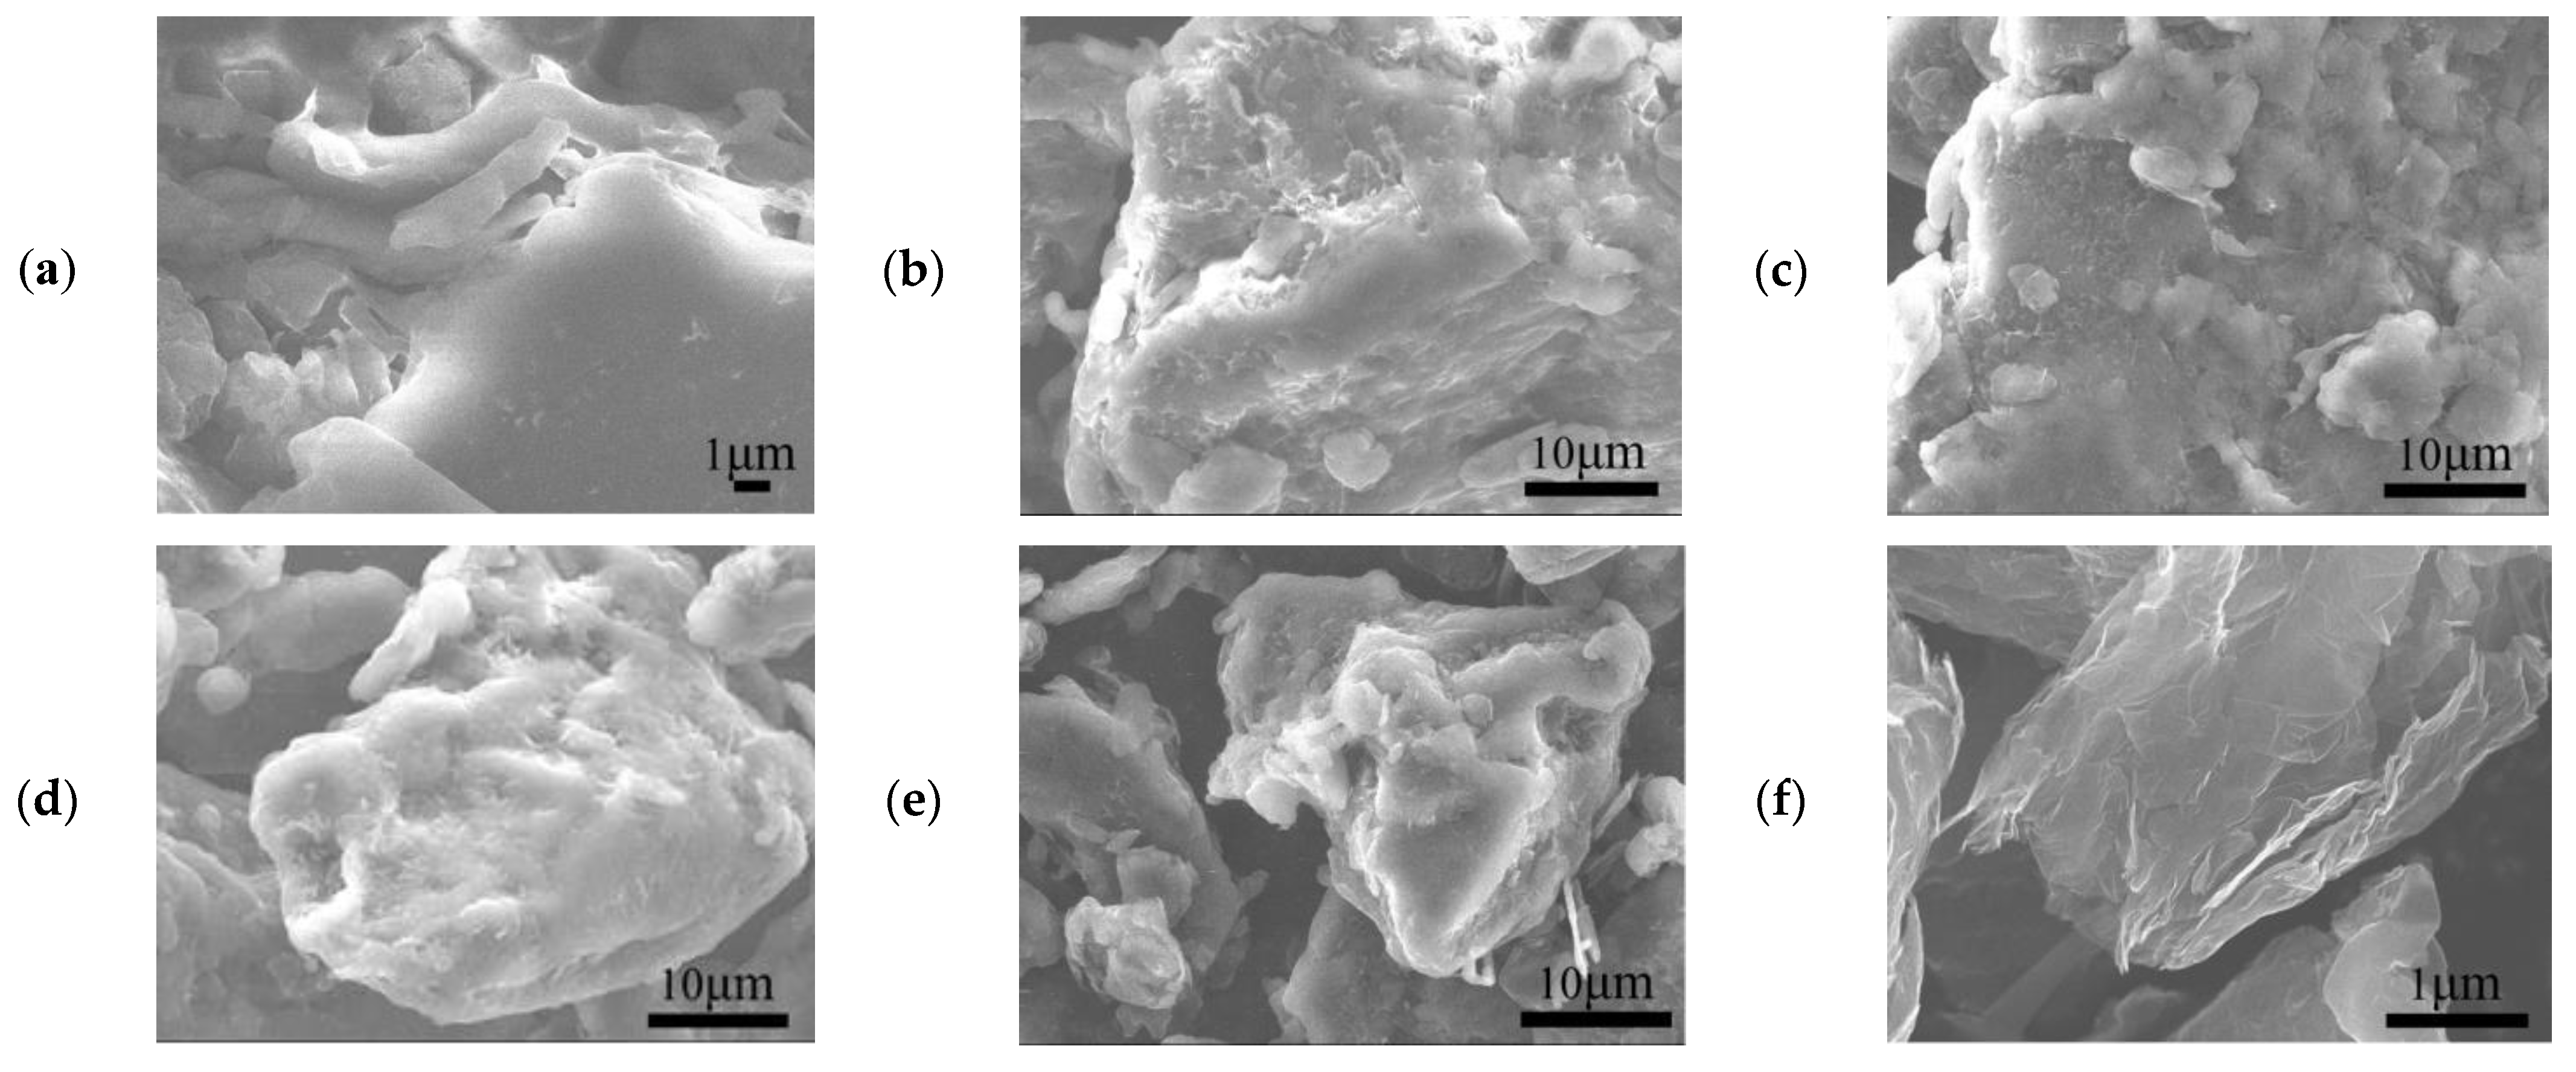
3.1.1. The Micro-Morphology and Size Structure of SG and GR

The micro-morphology of SG and GR powders were as shown in Figure 2a,b, showing three-dimensional elliptical spheres (smooth surface) and a two-dimensional curled sheet (rich surface folds), respectively. GR was stacked by 10 graphene layers with a sheet diameter of about 5 μm (lattice structure is shown in Figure 2c). The measured specific surface area was 625 m2/g and the average pore diameter was 2.11 nm (adsorption-desorption isotherm is shown in Figure 2d). The particle size distribution of SG measured by laser particle size analyzer is shown in Figure 3, and its average particle size was 7.88 μm.
Figure 4 shows the infrared spectra of SG and GR powders in the wave number range of 4000~450 cm−1. There were certain absorption peaks at 3442 cm−1 and 3436 cm−1, 1645 cm−1 and 1628 cm−1, 1021 cm−1 and 1121 cm−1, which corresponded to the stretching vibration peaks of -OH, C=C, -C-O-C, respectively [15]. Among them, the peak intensity of GR was very strong and SG was very weak, which indicated that there were still a lot of oxygen-containing functional groups such as -OH, -C-O-C in the GR after redox.

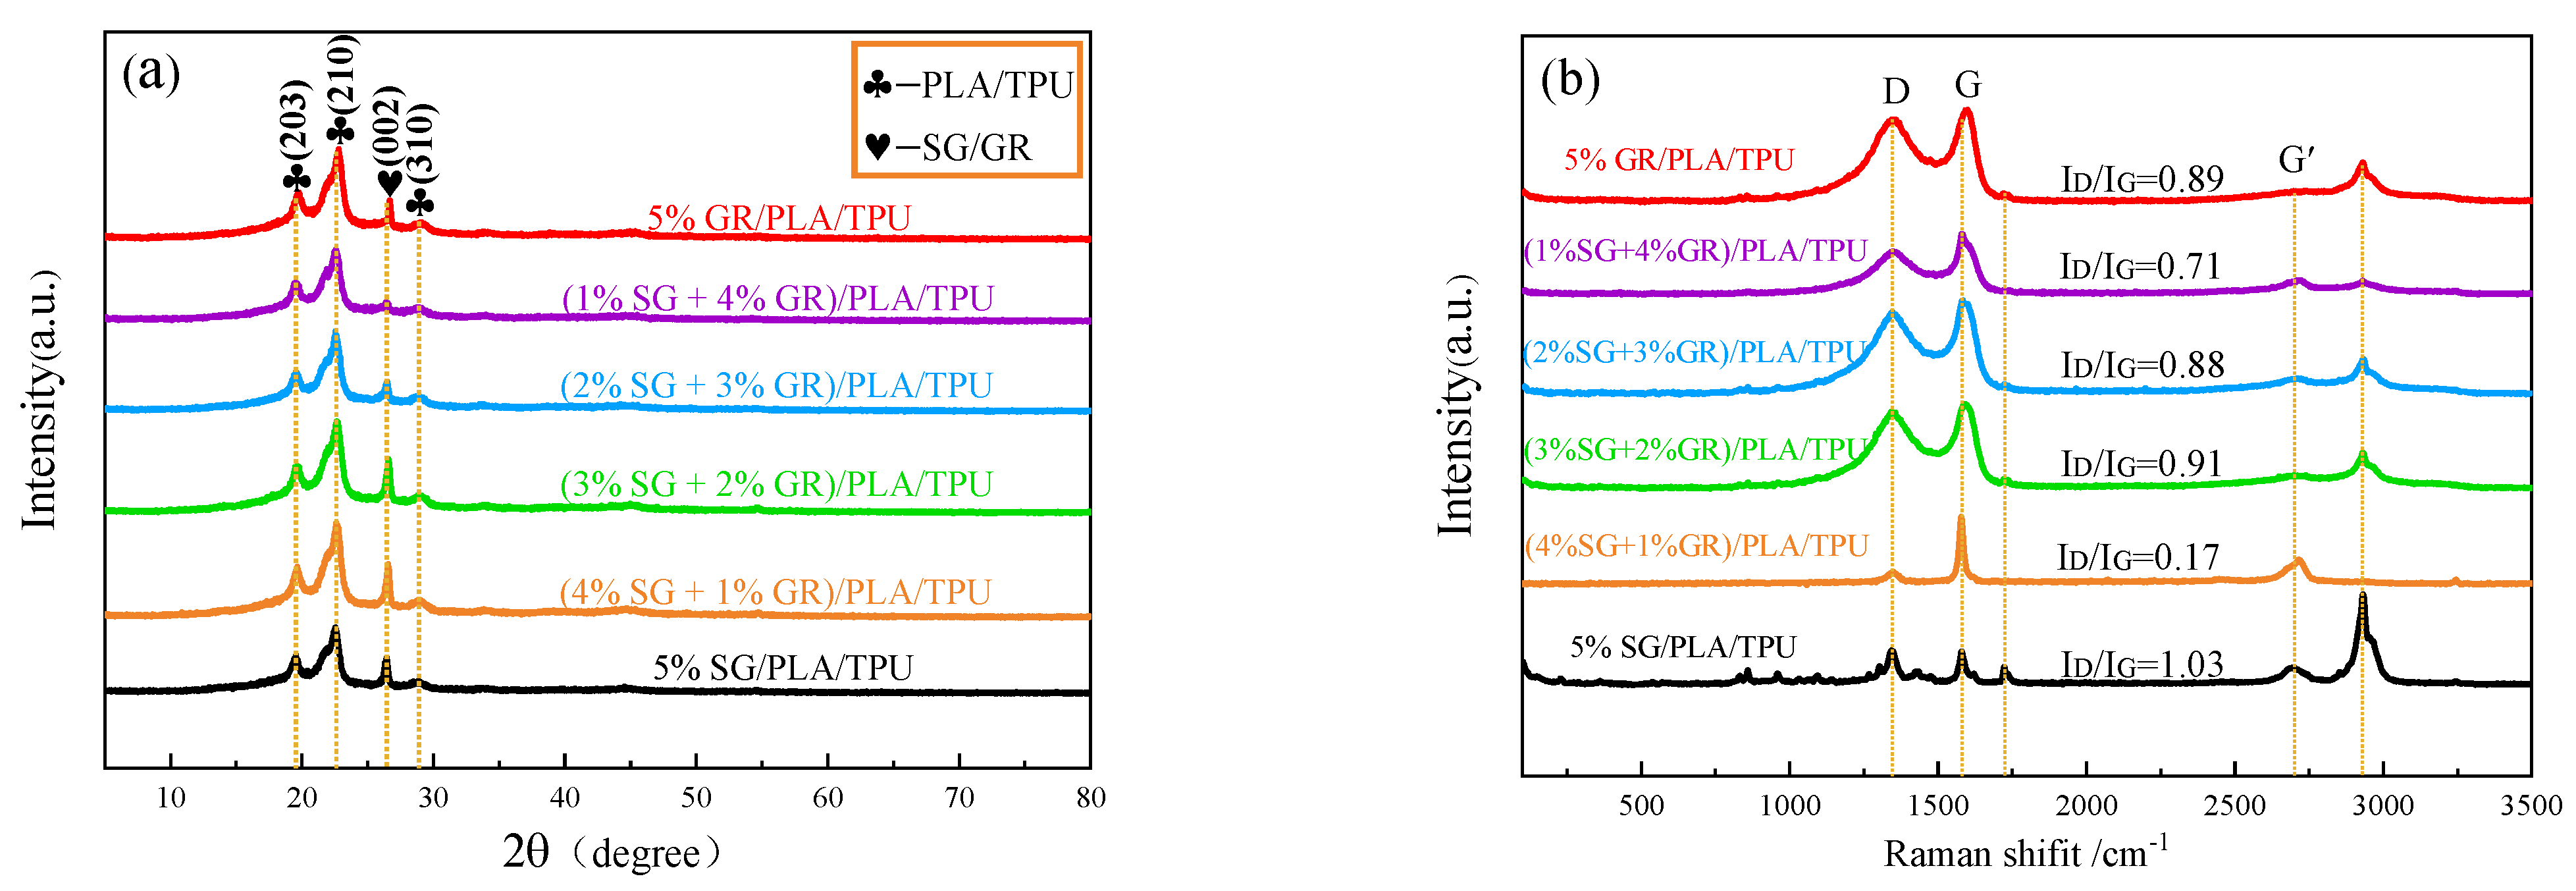
3.1.2. Phase Structure and Graphitization Degree of SG/GR/PLA/TPU Composites

Figure 5a shows the XRD patterns of six SG/GR/PLA/TPU composites with different contents. Diffraction peaks belonging to PLA/TPU were observed at 2θ = 19.55°, 22.62° and 28.90°, corresponding to (203), (210) and (310) crystal planes, respectively. The C-phase (SG/GR) diffraction peak corresponding to (002) crystal plane (JCPDSNo. 41-1487) was observed at 2θ = 26.46°. The difference is that the SG/GR peak of (1% SG + 4% GR)/PLA/TPU composite is the smallest, which promotes the crystallization of PLA/TPU. The SG/GR peak of (4% SG + 1% GR)/PLA/TPU composite is closer to the peak intensity of the (210) crystal plane, which is beneficial to the uniform composite of a PLA/TPU matrix.
Figure 5b shows the Raman spectra of six SG/GR/PLA/TPU composites with different contents. There were peaks in different degrees around 1346 cm−1 (D-band), 1580 cm−1 (G-band), 2700 cm−1 (G′-band) and 2930 cm−1. Among them, the D-band indicated the defect and disorder of lattice, G-band indicated the tensile vibration of carbon atoms sp2 hybridization, and G′-band indicated the number of layers of graphite sheets (The peak shape moves to the right when there are multiple layers). Generally speaking, the smaller the ID/IG value (the strength ratio of D-band to G-band), the greater the graphitization degree [16]. Therefore, the defect of 5% GR/PLA/TPU composites was the most serious, and the graphitization degree of (4% SG + 1% GR)/PLA/TPU composites was the highest. The stretching vibration peak of C-H at 930 cm−1 increased with the increase of ID/IG value.

3.2. Effect of SG/GR Ratio on Microwave Absorbing Properties of PLA/TPU Composites

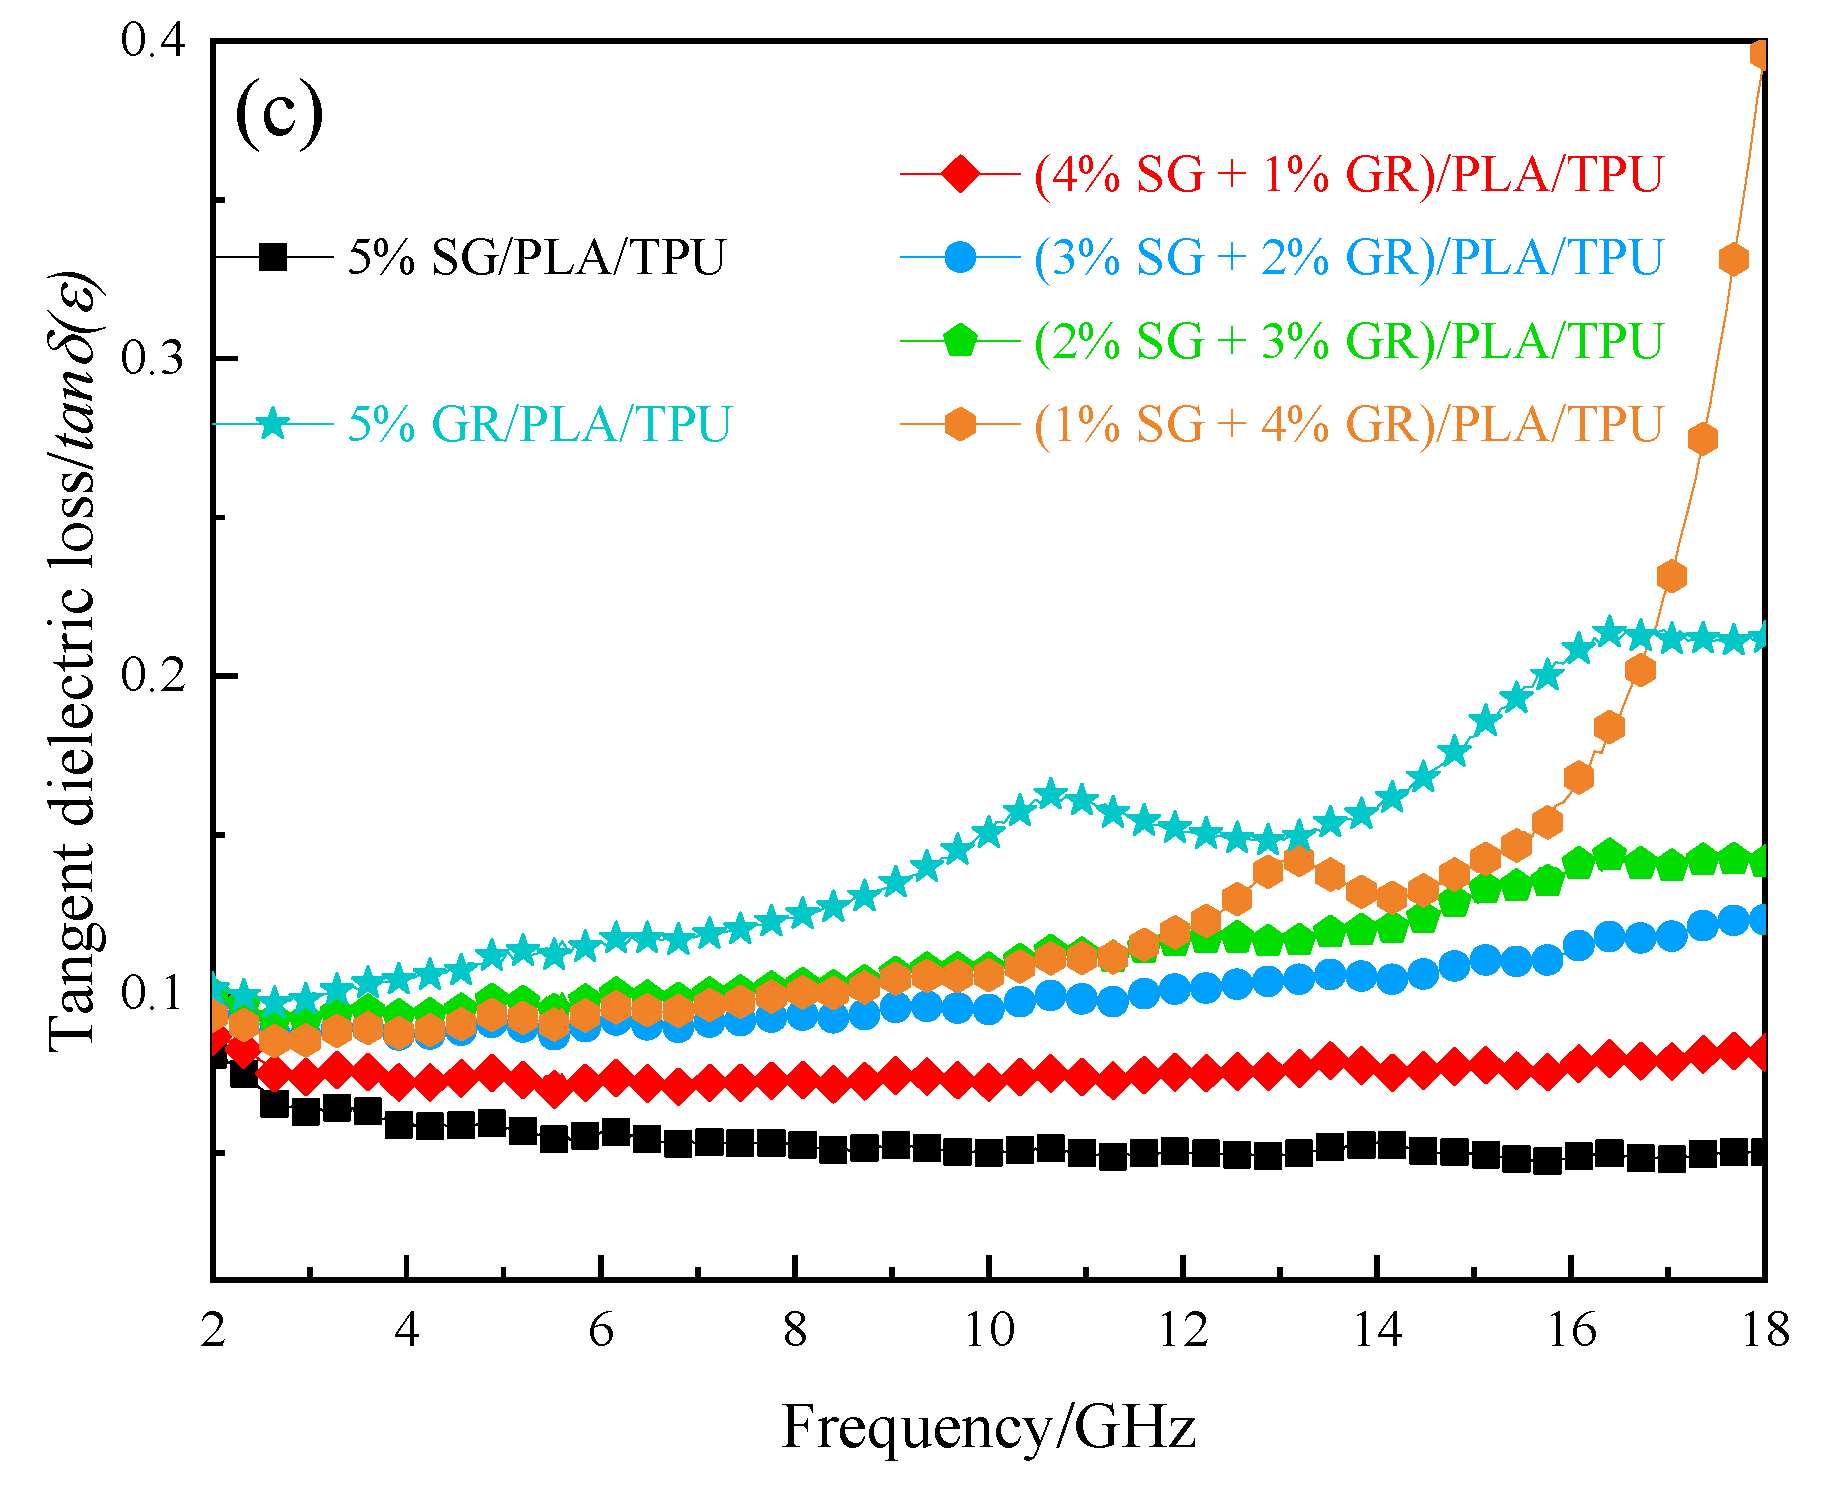
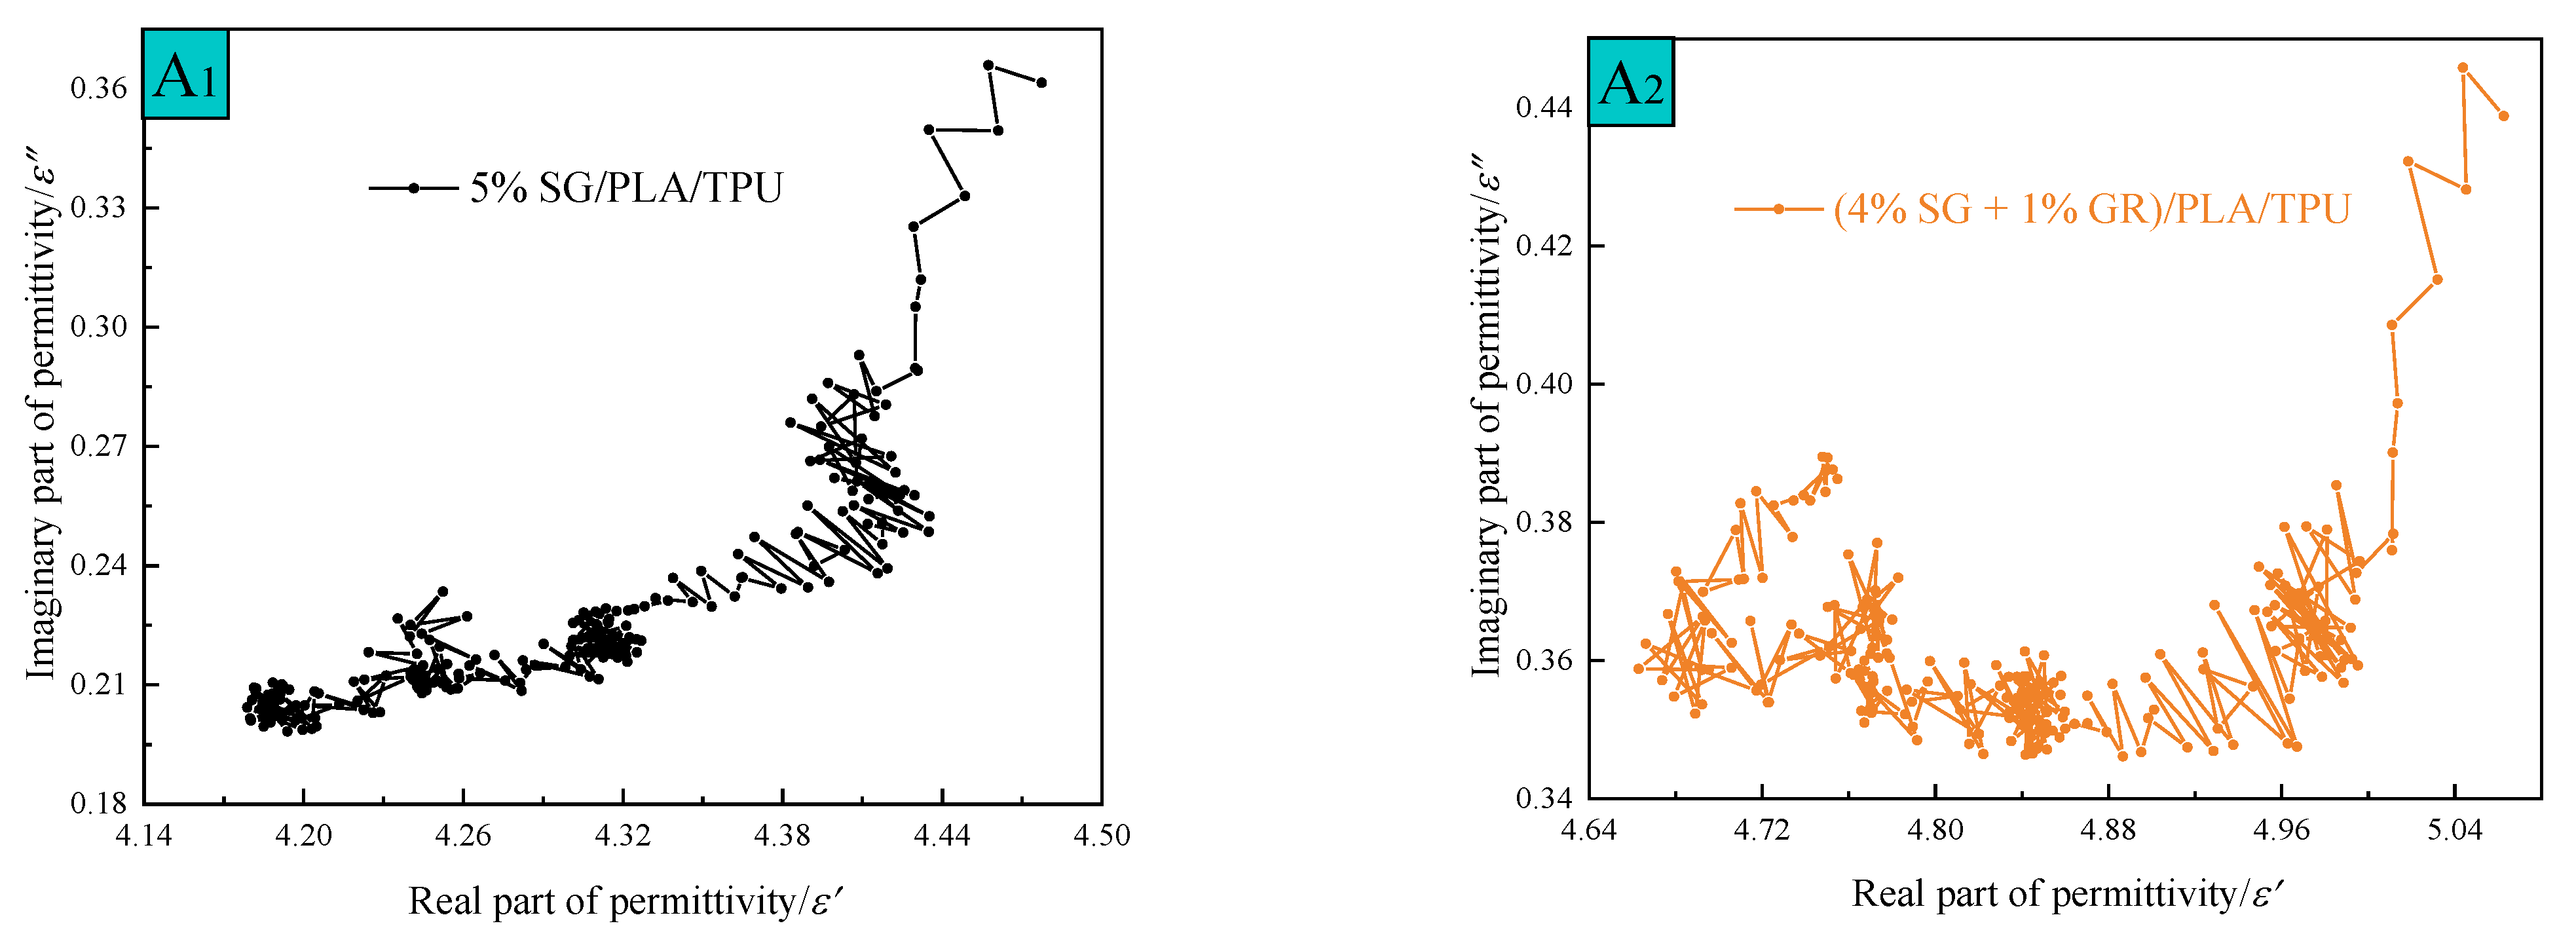
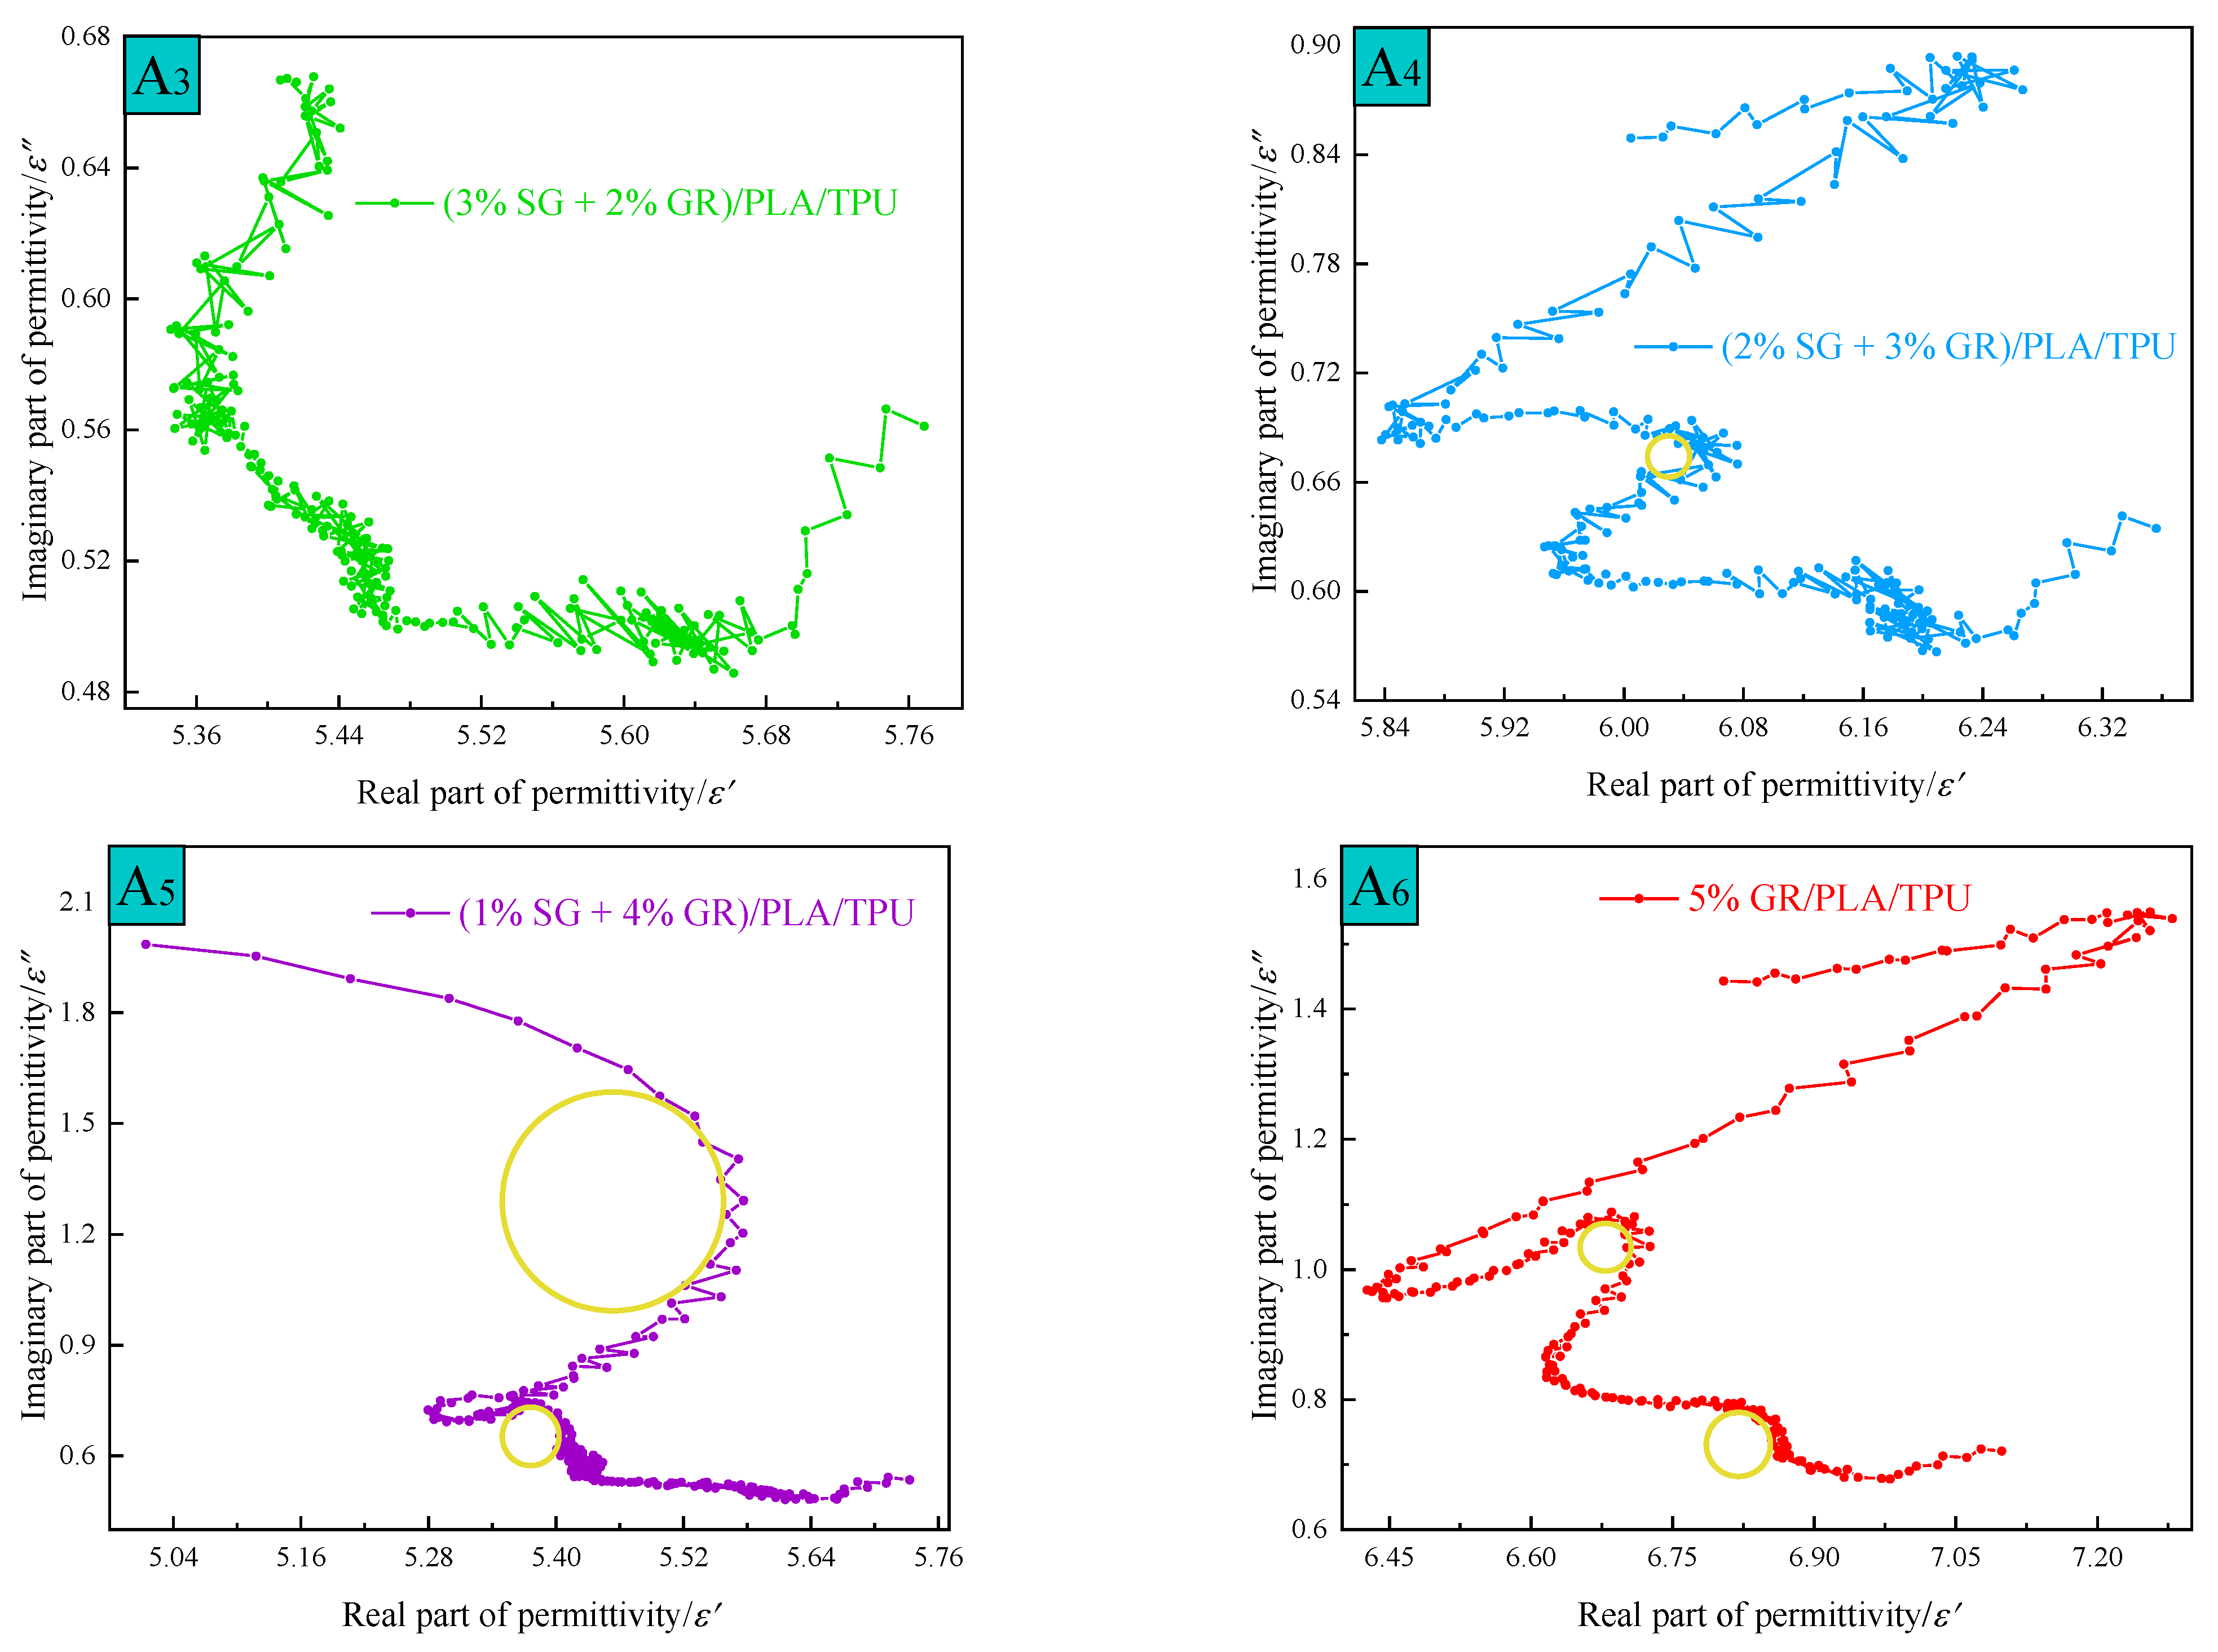
3.2.1. Dielectric Loss of Composites

It is nonmagnetic with SG and GR, and the electromagnetic parameters of the composite material were mainly complex dielectric constants. The curves of its real part ε′, imaginary part ε″ and tangent tanδ (tanδ = ε″/ε′) with frequency in 2~18 GHz are shown in Figure 6. Except for the (1% SG + 4% GR)/PLA/TPU composites, with the decrease of SG content and the increase of GR content, the values of ε′ and ε″ gradually increased and fluctuated obviously. It shows that the ability to store and lose charge is enhanced. When the ratio of SG/GR was 1:4, the composite of binary absorbent in PLA/TPU matrix reached the percolation threshold [17,18]. Overall, its complex dielectric constant was similar to that of (2% SG + 3% GR)/PLA/TPU composites. However, the imaginary part and tangent value suddenly rose in the range of 16~18 GHz, resulting in a large frequency response, which could explain this point.
Dielectric materials are mainly characterized by interfacial polarization, dipole polarization loss and conductance loss in the microwave absorption frequency band [19,20], which are generally characterized by the Debye equation [21]:
[ ε 1 2 ( ε s + ε ) ] 2 + ( ε ) 2 = 1 4 ( ε s + ε ) 2
where ε′ is the real part of the complex dielectric constant, ε″ is the imaginary part of the complex dielectric constant, ε s is the static dielectric constant, and ε is the high-frequency limit dielectric constant. The Cole–Cole semicircle can be obtained in the complex plane with ε′ as the abscissa and ε″ as the ordinate, as shown in Figure 7. With the decrease of SG content and the increase of GR content in A1~A6 composites, the Cole–Cole curve changed from disorder to linear order, and the formation of a semicircle was gradually observed, which meant the enhancement of dielectric loss. This shows that the GR two-dimensional sheet is more beneficial to electromagnetic wave attenuation consumption than the SG three-dimensional spherical sheet. At the same time, based on the nanosize effect [22] that GR has a smaller particle size and larger specific surface area than SG, which increases the activity of materials. The wrinkles on its surface aggravate the interfacial polarization and multiple scattering [23]. In addition, the GR retained a large number of oxygen-containing functional groups because of the redox process in the preparation, which formed defects and acted as a polarization center to induce dipole polarization [24].

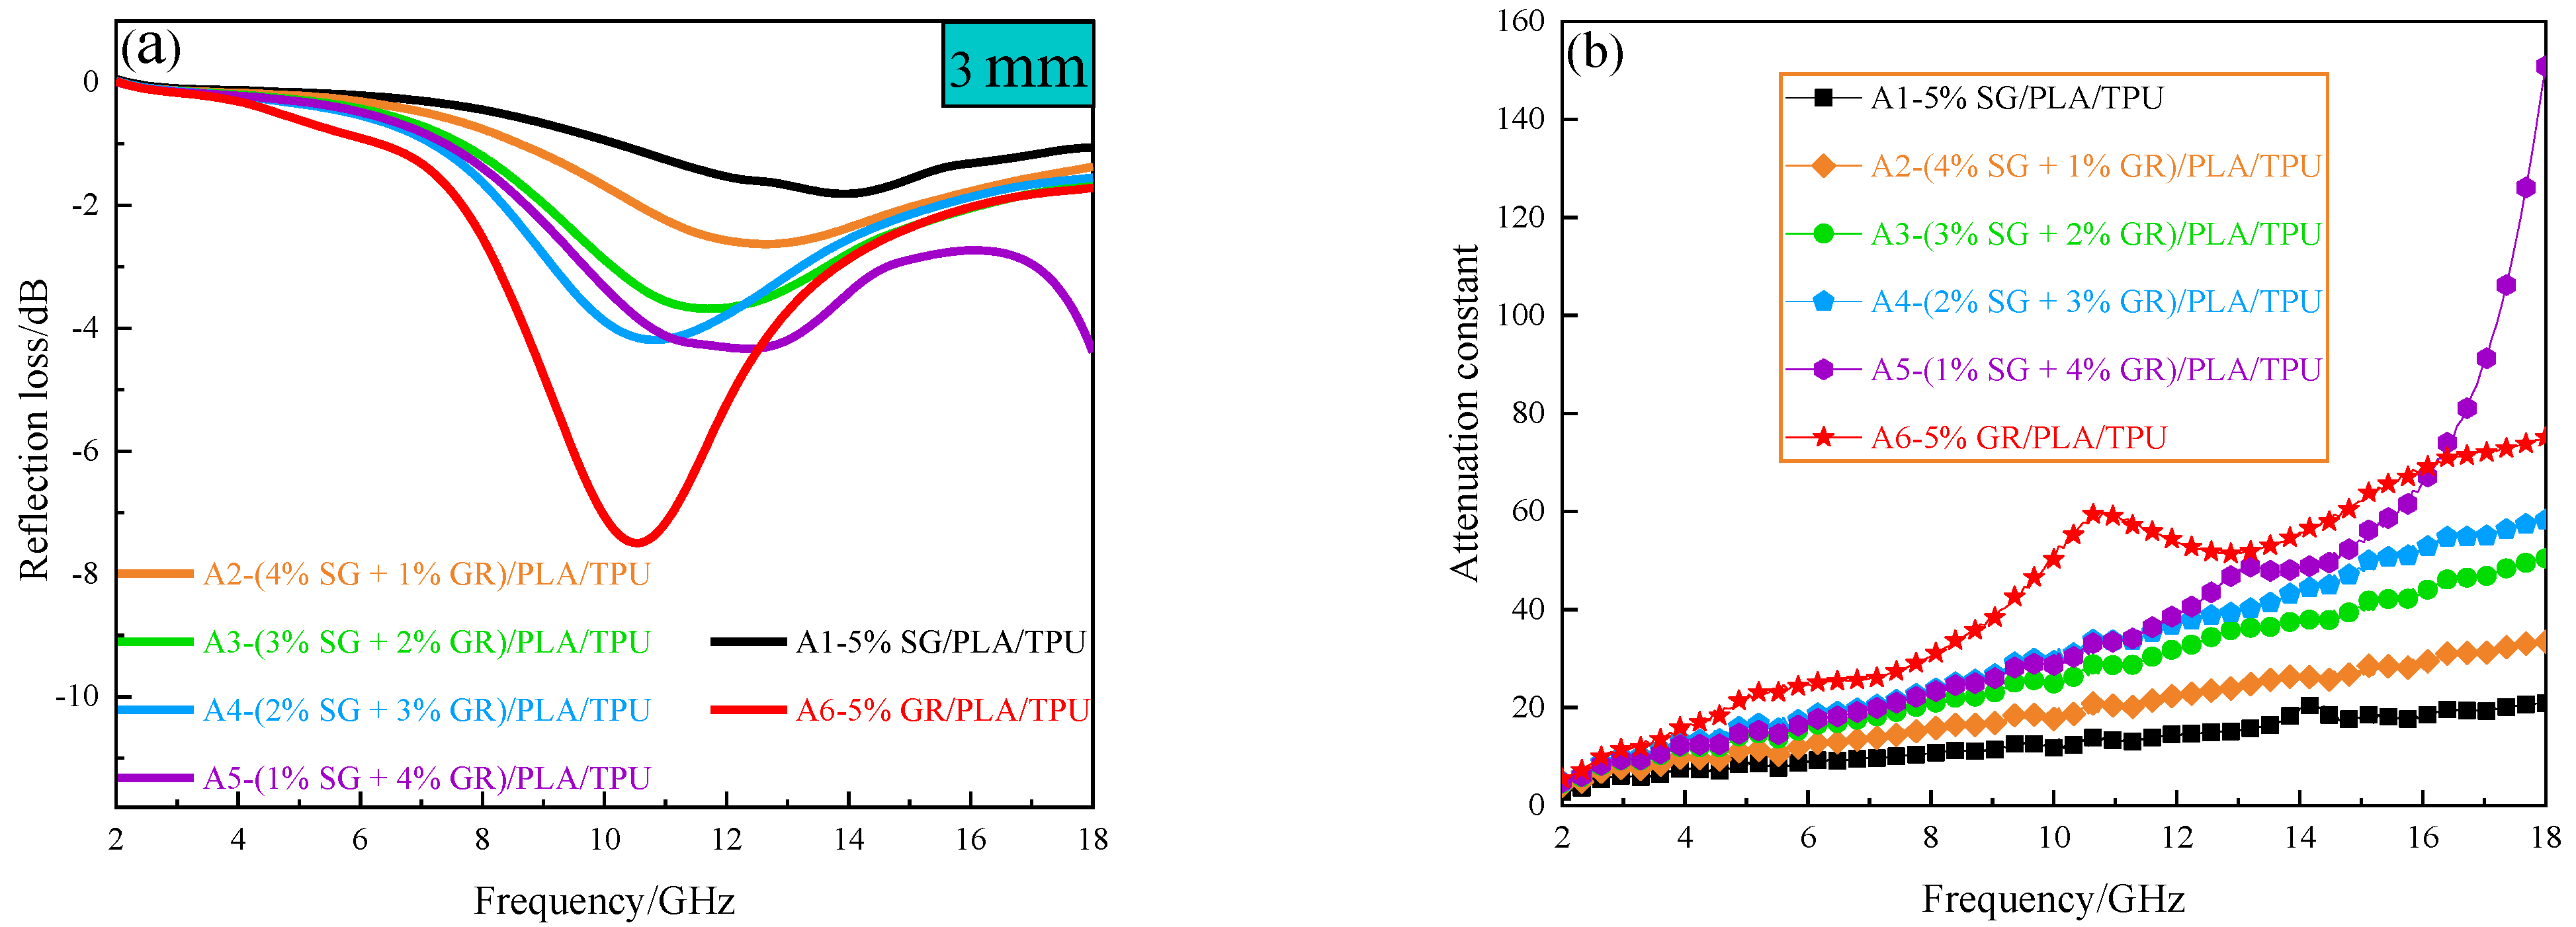
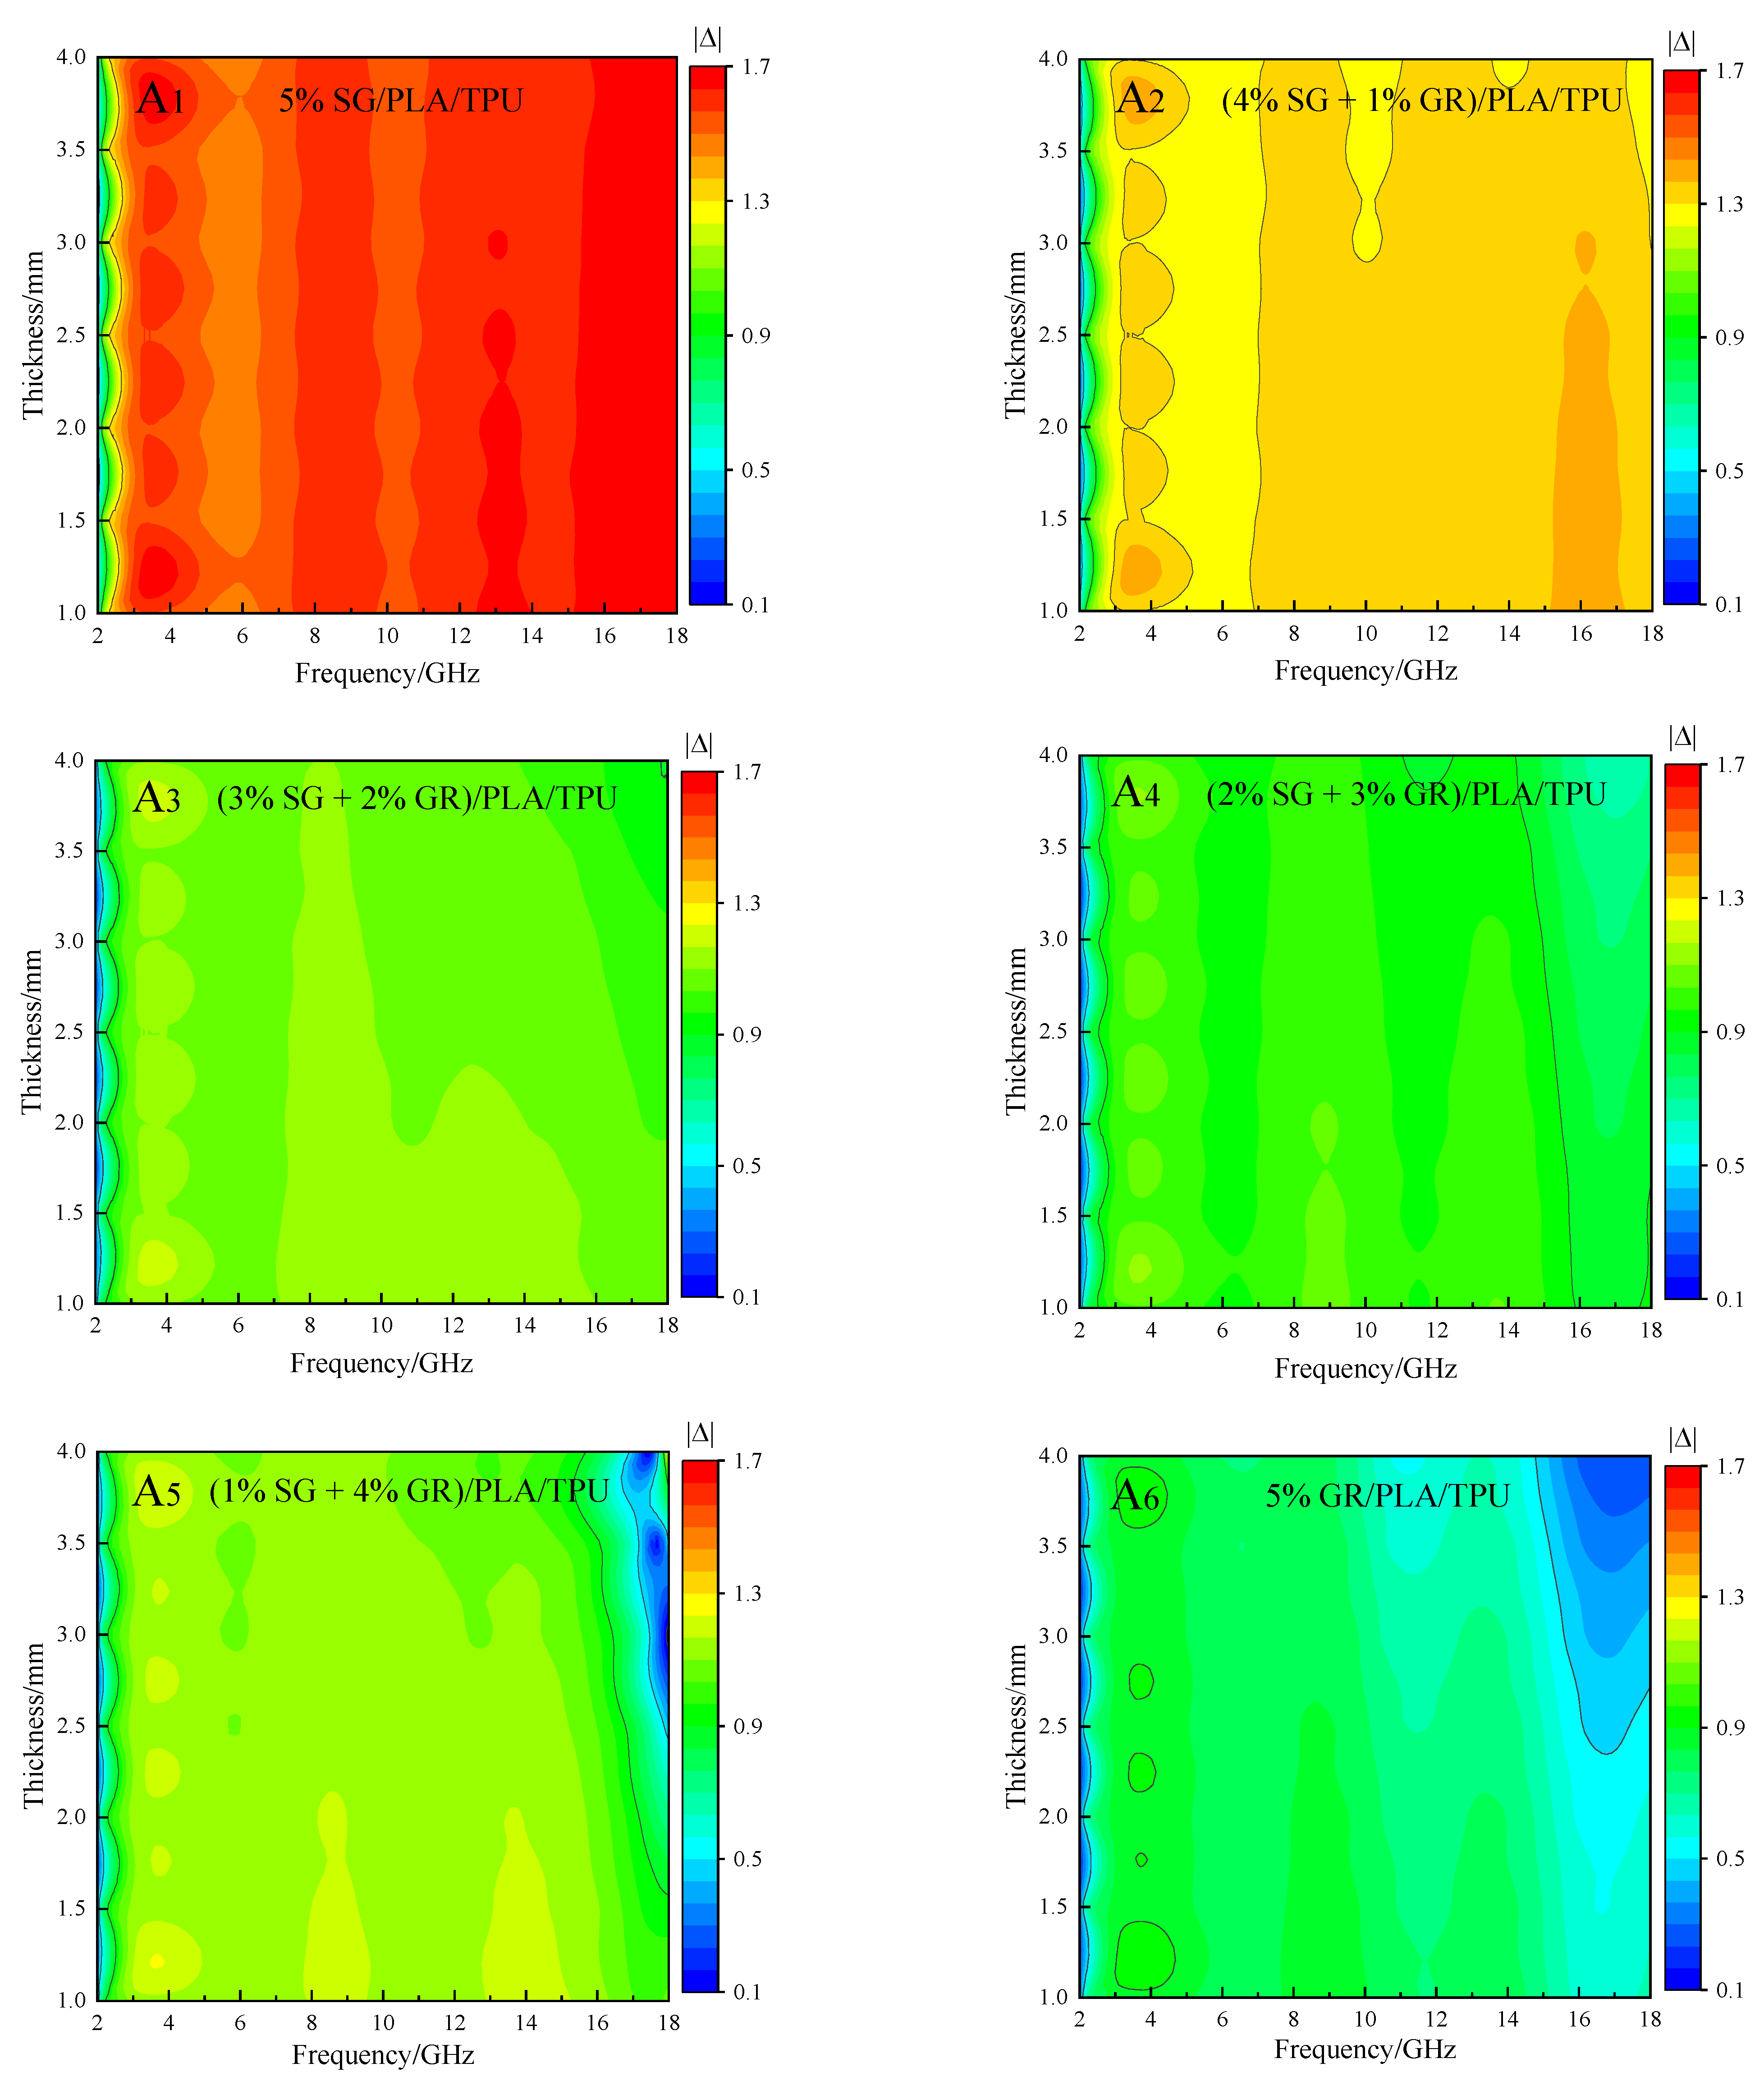
3.2.2. Microwave Absorption of Composites

In order to further analyze the influence of SG/GR ratio on the absorbing effect of composite materials, the reflection loss RL of a single-layer homogeneous absorber with different thicknesses was calculated according to Formulas (2) and (3) by using transmission line theory [25,26] (the results are shown in Figure 8):
R L = 20 lg | Z in 1 Z in + 1 |
Z in = Z O μ r ε r tan h ( j 2 π f d c μ r ε r )
where ZO is the wave impedance of free space, Zin is the input impedance, c is the propagation speed of electromagnetic waves in free space, f is the electromagnetic wave frequency, d is the thickness of the sample, j is the imaginary unit, εr and μr represent complex permittivity and complex permeability, respectively.
The reflectivity peaks of A1~A6 composites all moved to low frequency with the increase of absorbing thickness, which can be explained by quarter-wave theory and Formula (4) [27,28,29].
f m = ( 2 n + 1 ) c 4 d ε μ
where n is a positive integer, c is the speed of light, fm is the peak frequency, d is the absorbing thickness, ε and μ represent complex permittivity and complex permeability, respectively.
A6 composite has the maximum absorption peak, reaching −7.66 dB (at 10.64 GHz). A5 composite has the maximum reflection loss of −12.84 dB (at 18 GHz), but there is no maximum peak in 2~18 GHz. Figure 9a is the curve of reflectivity of SG/GR/PLA/TPU composites with different contents with frequency at the thickness of 3 mm. With the decrease of SG/GR ratio (from A1 to A6), the absorption peak gradually increases and tends to move to low frequency (except A5 composite). It can be seen from Formula (4) that when d is constant, the larger ε μ is, the smaller fm is. According to the electromagnetic parameters of the above composites, the correctness of this phenomenon can be proved. Figure 9b is the curve of attenuation constant of SG/GR/PLA/TPU composites with different contents with frequency, which can reflect its attenuation loss ability to electromagnetic waves. It can be calculated by Formula (5) [30]:
α = 2 π f c μ ε μ ε + ( μ ε μ ε ) 2 + ( μ ε + μ ε ) 2
with the increase of frequency, the attenuation ability of A1~A6 composites increases. With the decrease of SG/GR ratio (from A1 to A6), the attenuation ability is improved and, especially, the (1% SG + 4% GR)/PLA/TPU composite increased significantly in 16~18 GHz.
A good wave-absorbing effect requires not only excellent attenuation ability, but also impedance matching, so as to prevent electromagnetic waves from being directly reflected into the air without incident into the material for consumption [31]. The delta function method [32] is generally used to characterize impedance matching (the smaller the value, the better the impedance matching [33]). Its calculation formulas are as follows (6), (7) and (8), and the results are shown in Figure 10.
K = 4 π μ ε sin [ ( δ e + δ m ) / 2 ] c cos δ e cos δ m
M = 4 μ ε cos δ e cos δ m ( μ cos δ e ε cos δ m ) 2 + [ tan ( δ m / 2 δ e / 2 ) ] 2 ( μ cos δ e + ε cos δ m ) 2
| | = | sin h 2 ( K f d ) M |
Overall, the 5% SG/PLA/TPU composite had the worst impedance matching (more red areas), and the 5% GR/PLA/TPU composite had the best impedance matching (more green and blue areas). For the SG/GR double-carbon absorbent, the addition of GR can improve the impedance matching. When the ratio of SG/GR was 2:3, the impedance matching in the whole frequency band with the thickness of 1~4 mm could be maintained well (more green areas). However, when the ratio of SG/GR was 1:4, their recombination reached the percolation threshold, so that good impedance matching only concentrated in the high frequency (16~18 GHz) with the thickness of 2~4 mm (blue area).

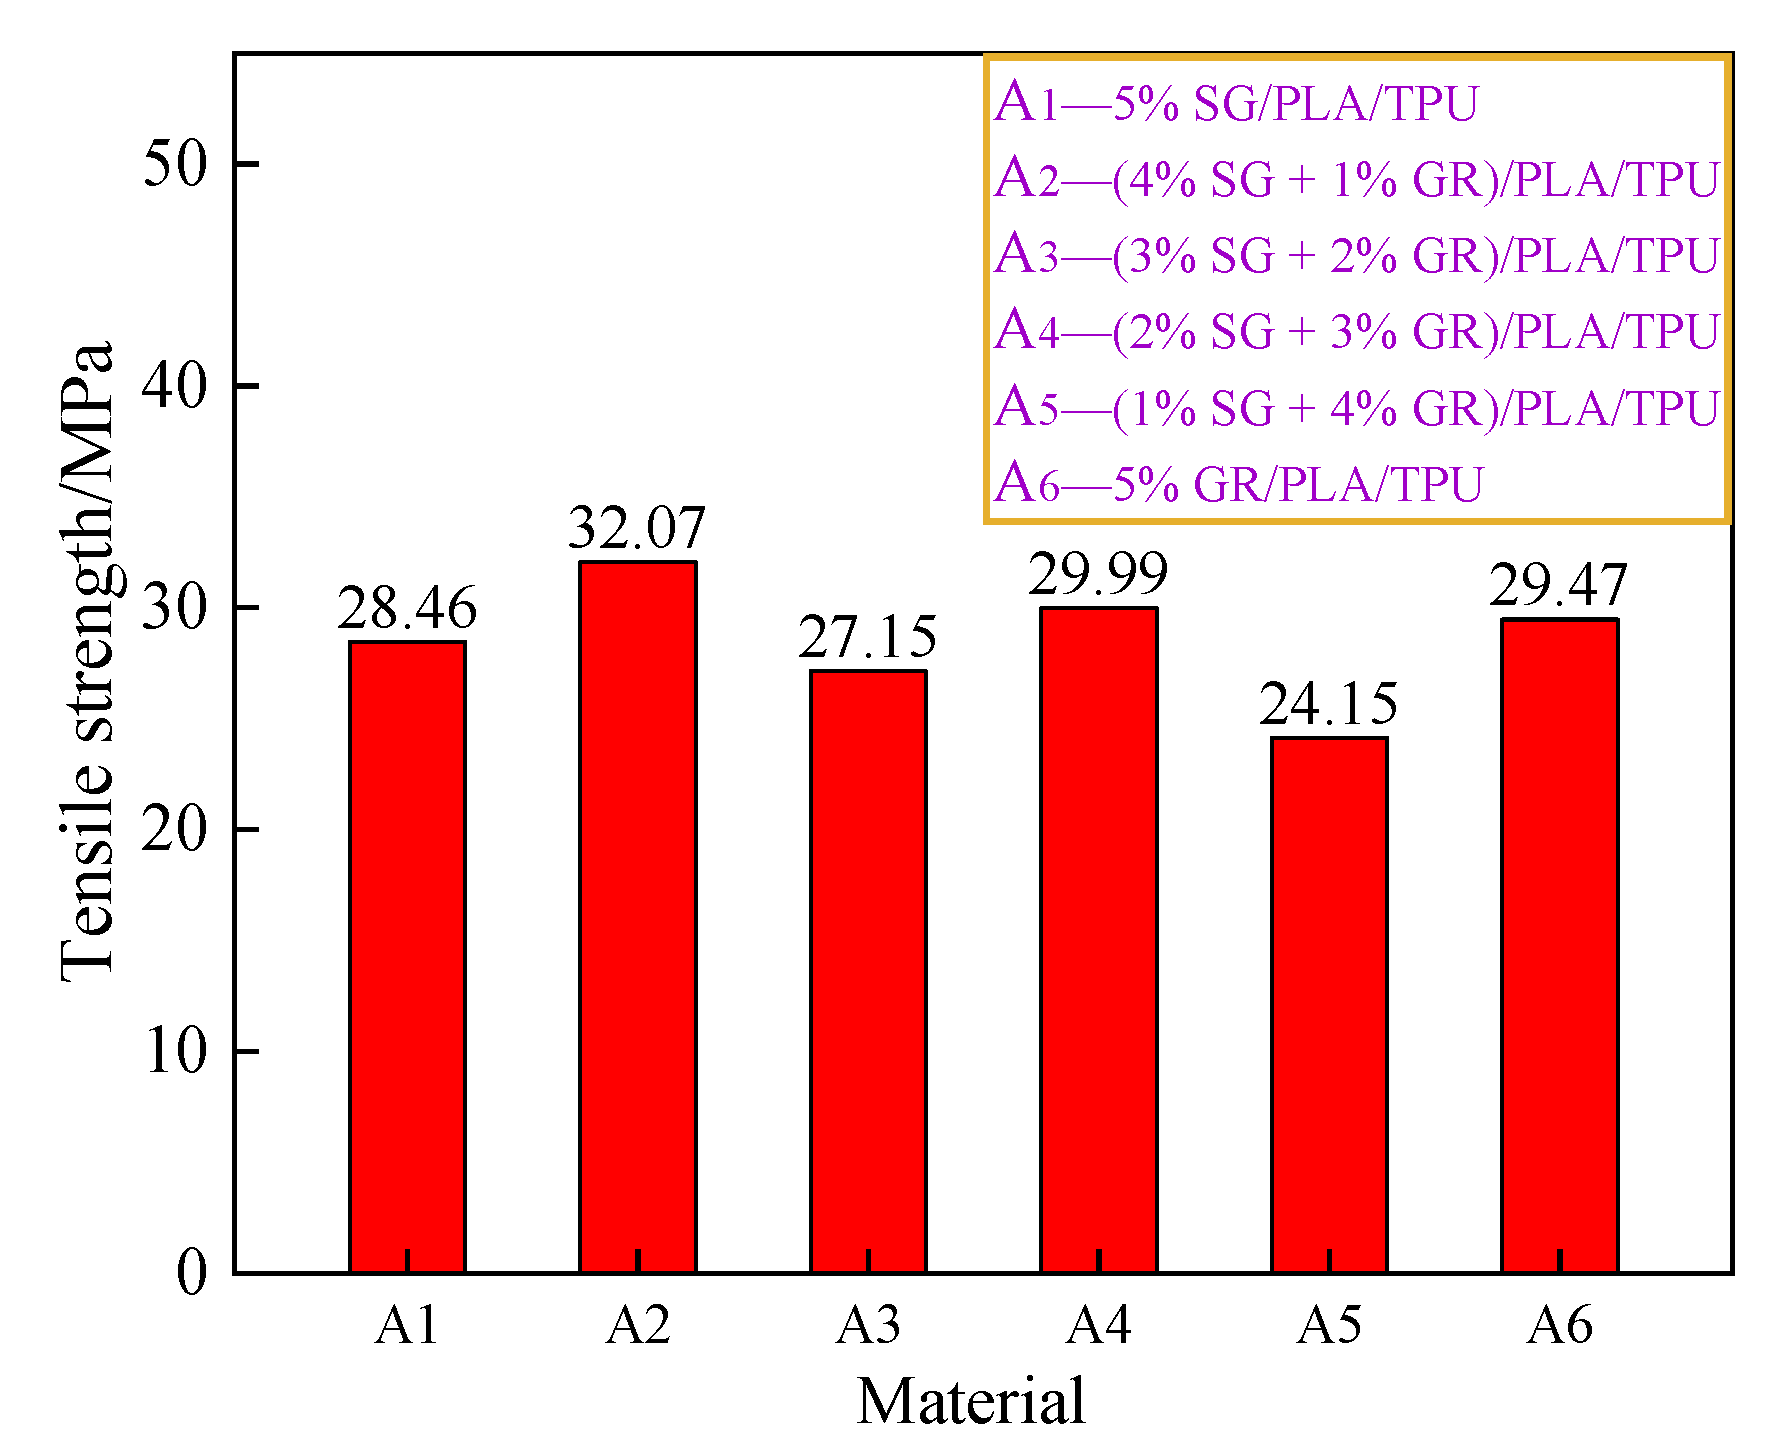
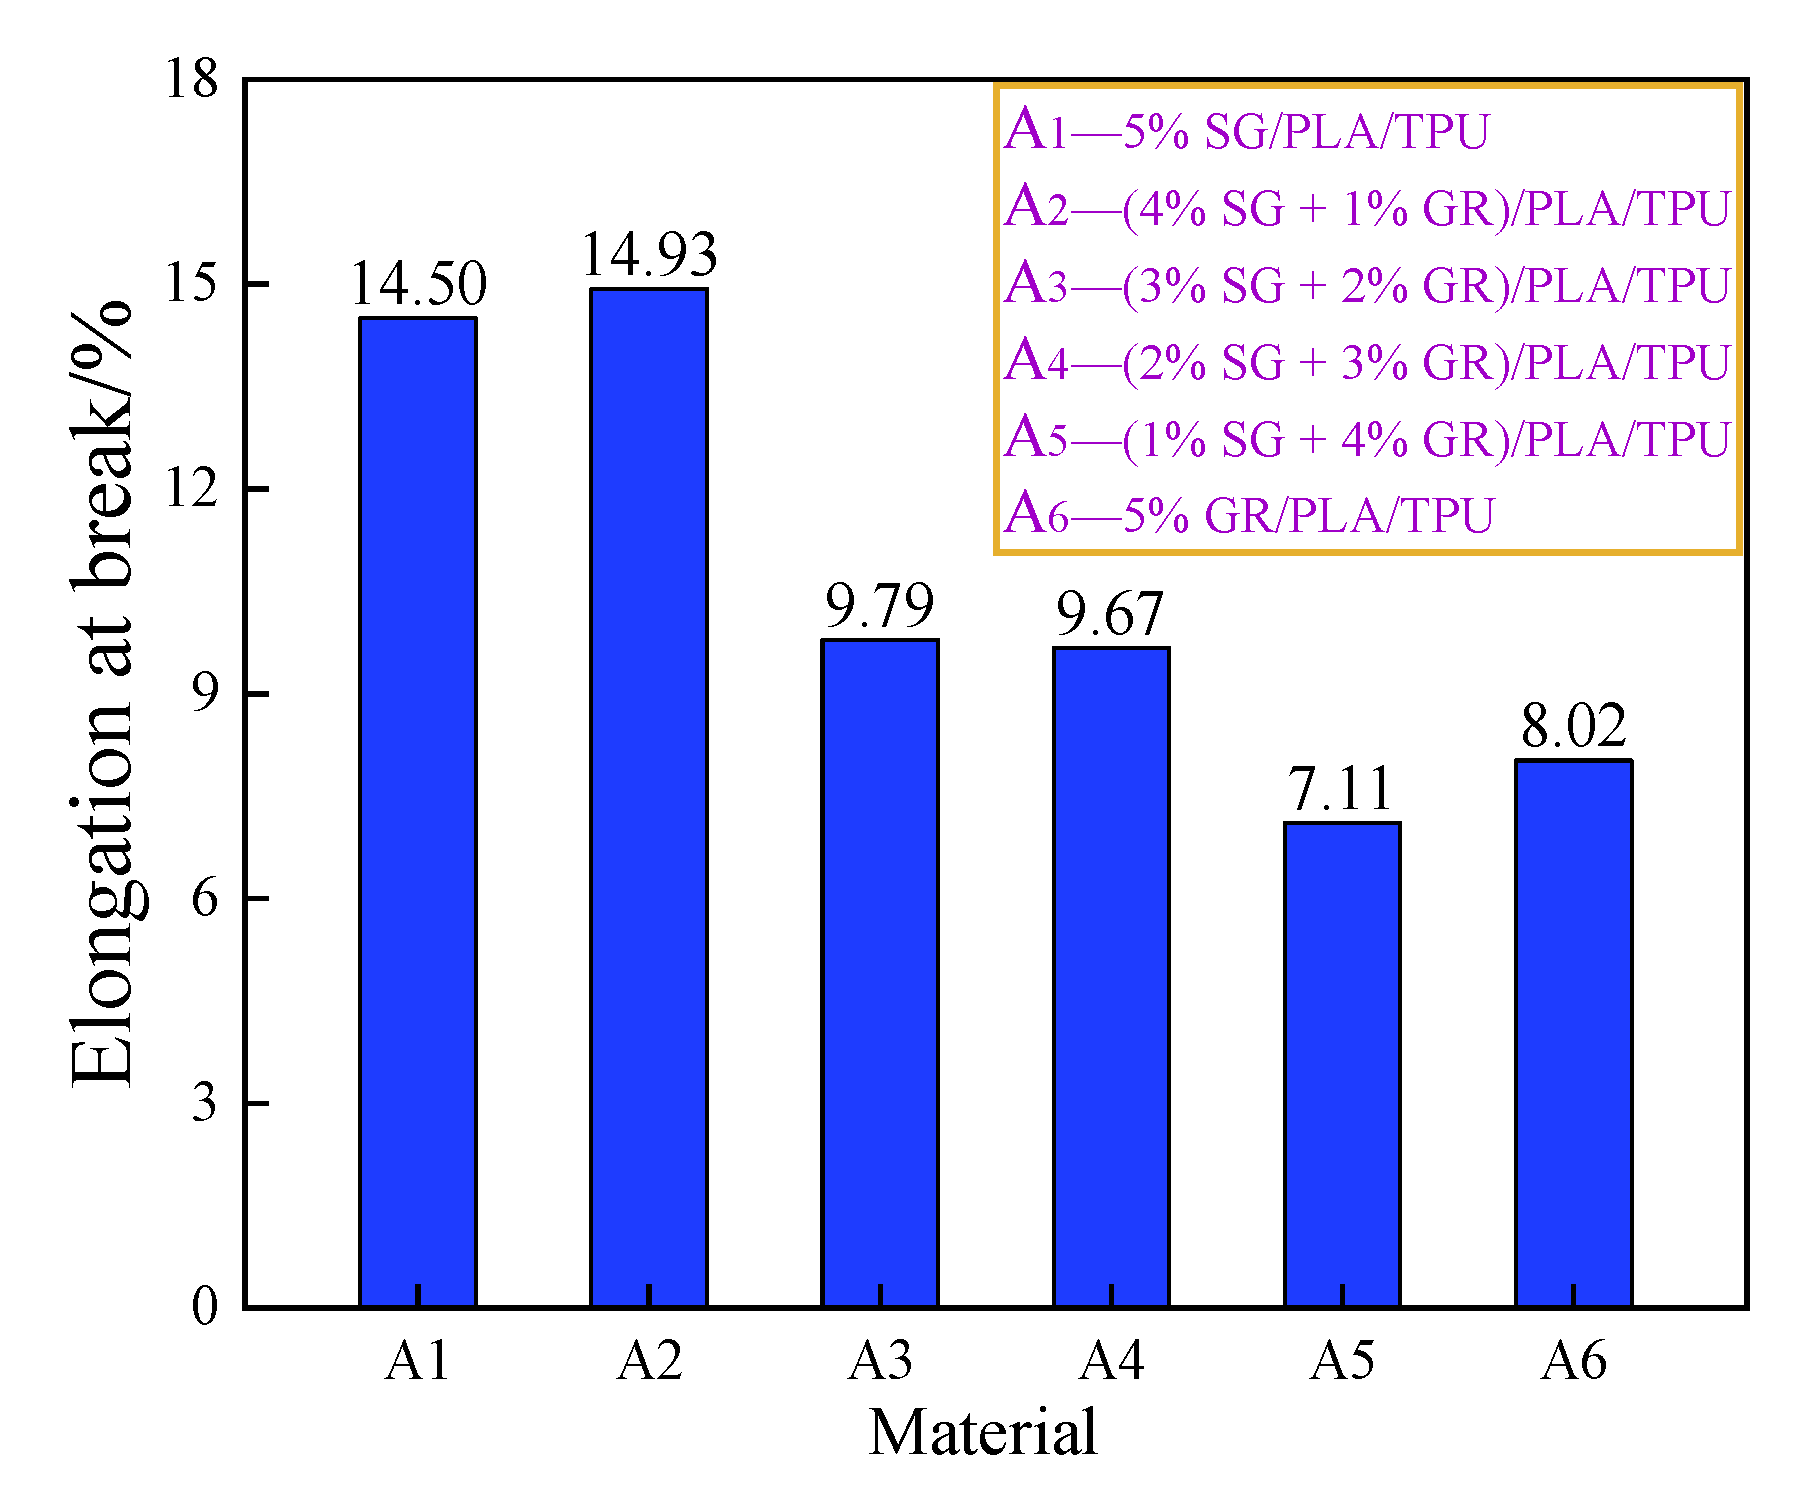
3.3. Effect of SG/GR Ratio on Mechanical Properties of PLA/TPU Composites

Figure 11 and Figure 12 are the average values of tensile strength and elongation at break of the SG/GR/PLA/TPU composites with different contents. For single filler particles, such as SG or GR (A1, A6), when the content was 5%, the tensile strength of GR/PLA/TPU composite was slightly higher than that of the SG/PLA/TPU composite. However, its low elongation at break led to poor toughness. For binary filler particles (A2, A3, A4, A5), the graphitization degree of the composite was high when the ratio of SG/GR was 4:1, and tensile strength and elongation at break reached 32.07 MPa and 14.93%, respectively. At this time, it not only surpassed the single composite A6 in strength, but also exceeded the single composite A1 in toughness. The composite reached the percolation threshold when the ratio was 1:4, with a tensile strength and elongation at break of only 24.15 MPa and 7.11%, respectively.
Generally speaking, the filler particles whose shape, particle size and amount change their interfacial bonding and dispersion in the matrix, will seriously affect the mechanical properties of composites [34,35]. Figure 13 is the SEM picture of SG/GR/PLA/TPU composite powders with different content ratios. Comparing (a) with (f), three-dimensional SG particles are mainly embedded between PLA and TPU to form an “island structure”, which makes it well dispersed because of this random distribution. However, two-dimensional GR nanosheets are mainly wrapped and adhered to PLA and TPU to form a “core-shell structure”, which is beneficial to improving the interfacial adhesion, but easy to cause agglomeration. Therefore, this is the direct reason that its composites have high tensile strength but low elongation at break. Compared with (b), (c), (d) and (e), the “island” phase is transformed into a “core-shell” phase with the decrease of SG content and the increase of GR content, which makes the dispersion effect reduce greatly to cause a decline in toughness. However, when a small amount (1%) of GR is added, it not only retains the good dispersibility of SG, but also forms a hydrogen bond with the TPU hard segment through the hydrophobic effect of PLA. This improves the interfacial bonding strength by inducing the molecular chains to diffuse each other [14,36].

4. Conclusions

Table 5 shows the comparison of the properties between carbon-based absorbent particles and resin matrix composites in recent years. Combined with the research work in this paper, the conclusions and prospects are as follows:
  • When the content of GR in SG/GR ratio is high, GR forms a number of “core-shell structures” in the PLA/TPU matrix. On the one hand, GR whose surface wrinkles, functional groups and defects enhance the electromagnetic wave attenuation ability (polarization loss and conductivity loss) by promoting polarization (interface polarization and dipole polarization) and multiple scattering. On the other hand, it is beneficial to improve impedance matching to improve the wave absorbing effect. Among them, when the ratio of SG/GR is 1:4, the recombination reaches the percolation threshold. At this time, there is the maximum reflection loss that is −12.84 dB (at 18 GHz), which is slightly higher than that of reference [37] but lower than that of reference [38].
  • When the content of SG in SG/GR ratio is high, SG forms a large number of “island structures” in the PLA/TPU matrix, showing good dispersibility to improve the mechanical properties. Among them, when the ratio of SG/GR is 4:1, the graphitization degree of the composites is high. At this time, the maximum tensile strength and elongation at break are 32.07 MPa and 14.93%, respectively, which are higher than those in reference [39] but lower than the toughness of reference [40].
  • When the ratio of SG/GR is moderate (2:3 or 3:2), SG/GR/PLA/TPU composites have a certain electromagnetic wave-absorption capacity on the basis of high strength and toughness.
  • Compared with the single performance (wave-absorbing property or mechanical property) of carbon-based composites in Table 5, the combination of a multi-component absorbent (multiloss mechanism: electrical loss and magnetic loss) and multi-component matrix (high-strength and high-toughness matrix or particle-reinforced matrix) is the development trend for new carbon-based wave-absorbing materials to achieve the synergy of wave absorbency and mechanical properties. In addition, FDM 3D printing has obvious advantages in energy saving, environmental protection and complex structure manufacturing.

Author Contributions

Funding acquisition, H.W.; methodology, Z.Y.; visualization, R.Z., K.D., Y.L., Z.L., Q.Z. and Y.K.; writing—original draft, Z.Y.; writing—review and editing, H.W. All authors have read and agreed to the published version of the manuscript.

Funding

This work was supported by National Natural Science Foundation of China (Grant No. 51575313) and the State Key Laboratory of Solid Lubrication, Lanzhou Institute of Chemical Physics, Chinese Academy of Sciences Open Project Research Fund (LSL-2015).

Institutional Review Board Statement

Not applicable.

Informed Consent Statement

Not applicable.

Data Availability Statement

Not applicable.

Acknowledgments

The authors gratefully acknowledge the support of Harbin Institute of Technology in the testing technology.

Conflicts of Interest

The authors declare that there is no conflict of interest.

References

  1. Zeng, Q.; Wang, R.C.; Zhang, X.L.; Peng, H.N.; Hu, S.P.; Liu, Q. Research progress of electromagnetic wave absorption materials. Jiangxi Chem. Ind. 2021, 37, 100–103. [Google Scholar]
  2. Li, H.; Chen, K.B.; Luo, Y.T.; Sun, L.Z.; Du, J. Absorbing Mechanism and Progress of Carbon-based Electromagnetic Wave Absorbing Nanocomposites. Mater. Rep. 2019, 33, 73–77. [Google Scholar]
  3. Wu, H.H.; Yang, Z.H.; Liu, L.; Zhang, R.J.; Deng, K.X.; Li, Y. Forming of Three-layer Graphene Absorber by Fused Deposition Modeling and Effect of Interlayer Material Distribution on Microwave Absorption Properties. Mater. Rep. 2023, 2, 1–12. [Google Scholar]
  4. Khayal, A.; Dawane, V.; Amin, M.A.; Tirth, V.; Yadav, V.K.; Algahtani, A.; Khan, S.H.; Islam, S.; Yadav, K.K.; Jeon, B.H. Advances in the Methods for the Synthesis of Carbon Dots and Their Emerging Applications. Polymers 2021, 13, 3190. [Google Scholar] [CrossRef]
  5. Tuccitto, N.; Riela, L.; Zammataro, A.; Spitaleri, L.; Li-Destri, G.; Sfuncia, G.; Nicotra, G.; Pappalardo, A.; Capizzi, G.; Sfrazzetto, G.T. Functionalized Carbon Nanoparticle-Based Sensors for Chemical Warfare Agents. ACS Appl. Nano Mater. 2020, 3, 8182–8191. [Google Scholar] [CrossRef]
  6. Wolfbeis, O.S. An overview of nanoparticles commonly used in fluorescent bioimaging. Chem. Soc. Rev. 2015, 44, 4743–4768. [Google Scholar] [CrossRef] [PubMed] [Green Version]
  7. Cao, M.; Deng, Y.X.; Xu, K.; Hao, X.F.; Hu, J.Y.; Yang, X. Research progress of new carbon based magnetic composite electromagnetic waveabsorbing materials. Acta Mater. Compos. Sin. 2020, 37, 3004–3016. [Google Scholar]
  8. Prekodravac, J.R.; Kepic, D.P.; Colmenares, J.C.; Giannakoudakis, D.A.; Jovanovic, S.P. A comprehensive review on selected graphene synthesis methods: From electrochemical exfoliation through rapid thermal annealing towards biomass pyrolysis. J. Mater. Chem. C 2021, 9, 6722–6748. [Google Scholar] [CrossRef]
  9. Ion-Ebrasu, D.; Andrei, R.D.; Enache, S.; Caprarescu, S.; Negrila, C.C.; Jianu, C.; Enache, A.; Boerasu, I.; Carcadea, E.; Varlam, M.; et al. Nitrogen Functionalization of CVD Grown Three-Dimensional Graphene Foam for Hydrogen Evolution Reactions in Alkaline Media. Materials 2021, 14, 4952. [Google Scholar] [CrossRef]
  10. Xue, G. Study on Mechanical and Electromagnetic Properites of Graphene/Epoxy Resin Composites. Ph.D. Thesis, Harbin Engineering University, Harbin, China, 2020. [Google Scholar]
  11. Wu, H.H.; Liu, L.; Cai, Y.; Zhang, C.; Xing, L.; Li, Y.F.; Hu, Z.-L.; Qiang, P. Microwave structural absorbers perparation and absorbing properties of magnetic/dielectric composite. Trans. Mater. Heat Treat. 2020, 41, 34–41. [Google Scholar]
  12. He, Y.; Yang, Z.; Qu, J. Super-toughened poly (lactic acid)/thermoplastic poly (ether) urethane nanofiber composites with in-situ formation of aligned nanofibers prepared by an innovative eccentric rotor extruder. Compos. Sci. Technol. 2019, 169, 135–141. [Google Scholar] [CrossRef]
  13. Liu, H.; Zhang, J. Research progress in toughening modification of poly(lactic acid). J. Polym. Sci. B Polym. Phys. 2011, 49, 1051–1083. [Google Scholar] [CrossRef]
  14. Yu, F.; Huang, H.X. Simultaneously toughening and reinforcing poly (lactic acid)/thermoplastic polyurethane blend via enhancing interfacial adhesion by hydrophobic silica nanoparticles. Polym. Test. 2015, 45, 107–113. [Google Scholar] [CrossRef]
  15. Giofre, S.V.; Tiecco, M.; Celesti, C.; Patane, S.; Triolo, C.; Gulino, A.; Spitaleri, L.; Scalese, S.; Scuderi, M.; Iannazzo, D. Eco-Friendly 1,3-Dipolar Cycloaddition Reactions on Graphene Quantum Dots in Natural Deep Eutectic Solvent. Nanomaterials 2020, 10, 2549. [Google Scholar] [CrossRef] [PubMed]
  16. Xiang, Z.; Huang, C.; Songa, Y.; Denga, B.; Zhanga, X.; Zhua, X.; Bataluc, D.; Tutunarud, O.; Lua, W. Rational construction of hierarchical accordion-like Ni@porous carbon nanocomposites derived from metal-organic frameworks with enhanced microwave absorption. Carbon 2020, 167, 364–377. [Google Scholar] [CrossRef]
  17. Ellingford, C.; Bowen, C.; McNally, T.; Wan, C.Y. Intrinsically Tuning the Electromechanical Properties of Elastomeric Dielectrics: A Chemistry Perspective. Macromol. Rapid Commun. 2018, 39, 1800340. [Google Scholar] [CrossRef]
  18. Liu, Y.H.; Li, H.F.; Yang, K. Effect of copper nanomaterials dimensions on the dielectric properties and percolation threshold of P (VDF-HFP)-based composites. J. Funct. Mater. 2019, 50, 12020–12034. [Google Scholar]
  19. Tao, J.; Zhou, J.; Yao, Z.; Jiao, Z.; Wei, B.; Tan, R.; Li, Z. Multi-shell hollow porous carbon nanoparticles with excellent microwave absorption properties. Carbon 2021, 172, 542–555. [Google Scholar] [CrossRef]
  20. Ren, F.; Yu, H.; Wang, L.; Saleem, M.; Tian, Z.; Ren, P. Current progress on the modification of carbon nanotubes and their application in electromagnetic wave absorption. RSC Adv. 2014, 4, 14419. [Google Scholar] [CrossRef]
  21. Cheng, Y.; Seow, J.Z.Y.; Zhao, H.; Xu, Z.J.; Ji, G. A Flexible and Lightweight Biomass-Reinforced Microwave Absorber. Nano-Micro Lett. 2020, 12, 5–19. [Google Scholar] [CrossRef]
  22. Zhang, X.; Liu, S.H.; Duan, Y.P.; Guan, H.-T.; Wen, B. Electromagnetic Characteristics of Carbon Black Doped with Nanometer Manganese Dioxide. J. Aeronaut. Mater. 2007, 2, 58–61. [Google Scholar]
  23. Jia, K.; Wang, D.H.; Li, K.X.; Gu, J.Y.; Liu, W. Progress and Future Developments of Graphene Composites Serving as Microwave Absorbing Materials. Mater. Rep. 2019, 33, 805–811. [Google Scholar]
  24. Deng, J.; Zhang, X.; Zhao, B.; Bai, Z.; Wen, S.; Li, S.; Li, S.; Yang, J.; Zhang, R. Fluffy microrods to heighten the microwave absorption properties through tuning the electronic state of Co/CoO. J. Mater. Chem. C 2018, 26, 7128–7140. [Google Scholar] [CrossRef]
  25. Chen, X.; Shi, T.; Wu, G.; Lu, Y. Design of molybdenum disulfide@polypyrrole compsite decorated with Fe3O4 and superior electromagnetic wave absorption performance. J. Colloid Interface Sci. 2020, 572, 227–235. [Google Scholar] [CrossRef]
  26. Huang, B.; Yue, J.; Wei, Y.; Huang, X.; Tang, X.; Du, Z. Enhanced microwave absorption properties of carbon nanofibers functionalized by FeCo coatings. Appl. Surf. Sci. 2019, 483, 98–105. [Google Scholar] [CrossRef]
  27. Chen, S.; Tan, G.; Gu, X.; Man, Q.; Li, F.; Chang, C.; Wang, X.; Li, R.-W. Microwave absorbing properties of FeCrMoNiPBCSi amorphous powders composite. J. Alloys Compd. 2017, 705, 309–313. [Google Scholar] [CrossRef]
  28. Qiao, M.; Lei, X.; Ma, Y. Dependency of tunable microwave absorption performance on morphology-controlled hierarchical shells for core-shell Fe3O4@MnO2 composite microspheres. Chem. Eng. J. 2016, 304, 552–562. [Google Scholar] [CrossRef]
  29. Kim, S.S.; Jo, S.B.; Gueon, K.I.; Choi, K.K.; Kim, J.M.; Churn, K.S. Complex permeability and permittivity and microwave absorption of ferrite-rubber composite at X-band frequencies. IEEE Trans. Magn. 1991, 27 Pt 6, 5462–5464. [Google Scholar] [CrossRef]
  30. Shu, X.; Ren, H.; Jiang, Y.; Zhou, J.; Wang, Y.; Wang, Y.; Liu, Y.; Oh, W.-C. Enhanced electromagnetic wave absorption performance of silane coupling agent KH550@Fe3O4 hollow nanospheres/graphene composites. J. Mater. Chem. C Mater. Opt. Electron. Devices 2020, 8, 2913–2926. [Google Scholar] [CrossRef]
  31. Cheng, J.B.; Zhao, H.B.; Li, M.E.; Li, S.L.; Wang, Y.Z. Research Progress on Carbon-Based Microwave Absorption Materials. Mater. China 2019, 38, 897–905. [Google Scholar]
  32. Zhi, M.; Yi, Z.; Chen, T.C.; Yuan, J.; Liu, Q.; Wang, J. Attractive microwave absorption and the impedance match effect in zincoxide and carbonyl iron composite. Phys. B Condens. Matter 2011, 406, 4620–4624. [Google Scholar]
  33. Lian, Y.; Han, B.; Liu, D.; Wang, Y.; Zhao, H.; Xu, P.; Han, X.; Du, Y. Solvent-Free Synthesis of Ultrafine Tungsten Carbide Nanoparticles-Decorated Carbon Nanosheets for Microwave Absorption. Nano-Micro Lett. 2020, 12, 145–157. [Google Scholar] [CrossRef] [PubMed]
  34. Lei, Y.Z.; Wang, S.W.; Lv, Q.N.; Li, Z.Z. Crystallization and rheological properites of carbon fiber/poly(lactic acid) composites. Acta Mater. Compos. Sin. 2018, 35, 1402–1406. [Google Scholar]
  35. Lu, Y.D.; Guo, J.H.; Jiang, X.H. Research progress of Core-shell Absorption Fillers and its Polymer Composites. Spec. Purp. Rubber Prod. 2021, 42, 56–63+66. [Google Scholar]
  36. Zhou, X.; Hu, B.; Xiao, W.; Jiang, H.; Zhang, L.; Wang, Z.; Lin, H.; Bian, J.; Zhao, X. Preparation and Properties of Composites of Polyvinyl Alcohol Grafted Graphene Oxide/thermoplastic Polyurethane. Chin. J. Mater. Res. 2017, 31, 874–880. [Google Scholar]
  37. Zhao, R. The Research of Carbon black/Carbon Fiber with Epoxy Composite Absorbing Material. Master’s Thesis, Hainan University, Hainan, China, 2012. [Google Scholar]
  38. Hu, Z.L.; Wu, H.H.; Yang, Z.H.; Jiang, J.T.; Zhou, J.X. Preparation of graphene-iron-nickel alloy-polylactic acid composites and their microwave absorption properties. Acta Mater. Compos. Sin. 2022, 39, 3310–3323. [Google Scholar]
  39. Wu, H.H.; Wang, J.; Cai, Y.; Peng, J.H.; Zhong, J.H.; Wei, Z.Y. Preparations and Properties of graphene/PLA composite wire for 3D printing. Carbon Technol. 2018, 37, 61–65. [Google Scholar]
  40. Wang, Y.; Li, Z.Q.; Xia, Y.T.; Cui, H.; Cheng, S.K. Preparation and Properties of PP/POE/CB Semi-Conductive Shielding Composite. Plastics 2020, 49, 32–35. [Google Scholar]
Figure 1. (a) SG/GR/PLA/TPU composite wire; (b) electromagnetic parameter sample; (c) tensile specimens of A1~A6 composites.
Polymers 14 02538 g001
Figure 2. (a) SEM of SG powder; (b) SEM of GR powder; (c) TEM of GR powder; (d) N2 adsorption-desorption isotherm of GR powder.
Polymers 14 02538 g002
Figure 3. Particle size distribution diagram of SG powder.
Polymers 14 02538 g003
Figure 4. Fourier infrared spectra of SG and GR powders.
Polymers 14 02538 g004
Figure 5. Six SG/GR/PLA/TPU composites with different contents: (a) XRD; (b) Raman spectrum.
Polymers 14 02538 g005
Figure 6. Electromagnetic parameters of six kinds of SG/GR/PLA/TPU composites with different contents: (a) real part of permittivity; (b) imaginary part of permittivity; (c) tangent dielectric loss.
Polymers 14 02538 g006aPolymers 14 02538 g006b
Figure 7. Cole–Cole curves of A1~A6 composites.
Polymers 14 02538 g007aPolymers 14 02538 g007b
Figure 8. Variation curves of reflectivity with frequency of A1~A6 composites with different thicknesses.
Polymers 14 02538 g008
Figure 9. A1~A6 composites: (a) the curve of reflectivity with frequency at 3 mm thickness; (b) curve of attenuation constant with frequency.
Polymers 14 02538 g009
Figure 10. |Δ| value of A1~A6 composites.
Polymers 14 02538 g010
Figure 11. Tensile strength of A1~A6 composites.
Polymers 14 02538 g011
Figure 12. Elongation at break of A1~A6 composites.
Polymers 14 02538 g012
Figure 13. SEM diagram of A1~A6 composite powders: (a) 5% SG/PLA/TPU; (b) (4% SG + 1% GR)/PLA/TPU; (c) (3% SG + 2% GR)/PLA/TPU; (d) (2% SG + 3% GR)/PLA/TPU; (e) (1% SG + 4% GR)/PLA/TPU; (f) 5% GR/PLA/TPU.
Polymers 14 02538 g013
Table 1. Raw material.
NameTrademarkPreparation Method/Average Particle SizeSource
PLA4032DThe average particle size is 62 μmNatureWorks Inc. (Minnetonka, MN, USA).
TPU5377AThe average particle size is 114 μmBayer company (Leverkusen, Germany)
SG-Coarse crushing, trimming, magnetic separation and high-temperature purification of natural flake graphite.Qingdao Xinghe graphite company (Qingdao, China)
GR-Graphite oxidation reduction processYichang Xincheng graphite company (Yichang, China)
Table 2. Experimental instruments.
NameModelManufacturer
Electrothermal constant-temperature blast drying ovenBPG-43BGGuangzhou Bilang instrument Co., Ltd. (Guangzhou, China)
Horizontal planetary ball millQM-WX4Nanjing Nanda Instrument Co., Ltd. (Nanjing, China)
Single screw extruderSHSJ-25Dongguan Songhu machinery Co., Ltd. (Dongguan, China)
Double nozzle printerAllcct TankWuhan Allcct Co., Ltd. (Wuhan, China)
Table 3. Composition of SG/GR/PLA/TPU composite wires.
NumberNameContent (wt%)
RatioSGGRPLATPURatio
A15% SG/PLA/TPU5:05085.59.59:1
A2(4% SG + 1% GR)/PLA/TPU4:14185.59.59:1
A3(3% SG + 2% GR)/PLA/TPU3:23285.59.59:1
A4(2% SG + 3% GR)/PLA/TPU2:32385.59.59:1
A5(1% SG + 4% GR)/PLA/TPU1:41485.59.59:1
A65% GR/PLA/TPU0:50585.59.59:1
Table 4. Testing and characterization methods of material properties.
NameModelManufacturerTest Parameters and ScopeCharacterization
Specific surface and aperture analyzerNovatouchQuantachrome (Boynton Beach, FL, USA)Accuracy of pressure sensor < 0.1%. The A/D converter signal resolution reaches 24 bit.Specific surface area and pore diameter of GR
Laser particle size analyzerS3500Microtrac, America (Montgomeryville, PA, USA)Measuring range: 0.02–2000 μm. Analysis accuracy: error ≤ 0.6%. Repeatability: error ≤ 1%.Particle size distribution of SG
Field scanning electron microscopeJSM-7500FJapan electronics Co., Ltd. (Tokyo, Japan)Resolution: 1.0 nm (15 KV), 1.4 nm (1 KV). Magnification: 250–1,000,000 times.Microstructure of SG, GR and their composite powders
Field high resolution transmission electron microscopeJEOL-F200Japan electronics Co., Ltd. (Tokyo, Japan)Resolution: 0.10 nm (TEM mode), 0.14 nm (STEM mode). Magnification: 20–2,000,000 times.Lattice structure of GR
Fourier transform infrared spectrometerSpectrum 100Perkin Elmer, America (Waltham, MA, USA)The wave number is in the range of 4000~450 cm−1.Chemical structure and functional groups of SG and GR
X-ray diffractomerUltima IVXRDJapan Neo-Confucianism Corporation (Tokyo, Japan)With copper target Ka ray, scanning speed 5 (°)/min, step distance 0.02°, diffraction scanning angle 2θ = 5~80°.Element composition and crystal type of composites
Laser confocal Raman spectrometerThermo Scientific DXRThermo Fisher Scientific (Waltham, MA, USA)Raman shift is in the range of 100~3500 cm−1.Graphitization degree of composites
Vector network analyzerR&S ZNARhodes & Schwartz Co., Ltd. (Munich, Germany)Test the electromagnetic parameters of coaxial ring at 2~18 GHz.Electromagnetic properties of composites
Electro mechanical universal testing machines5569Instron, America (Norwood, MA, USA)The tensile rate is 2 mm/min, and each group of tensile samples is measured for 3 times and averaged.Tensile strength and elongation at break of composites
Table 5. Comparison of properties between carbon-based absorbent particles and resin matrix composites in recent years.
MaterialAbsorbentMatrixContentAbsorption Maximum/dBTensile Strength/MPaElongation at Break/%Ref.
CB/EPCarbon blackEpoxy resin5%−10--[37]
GR/FeNi50/PLAGraphene/FeNi50 (magnetic)Polylactide5%−20.8--[38]
GR/PLAGraphenePolylactide5%-21.43.8[39]
PP/POE/CBCarbon blackPolypropylene/polyoxyethylene5%-16.8650[40]
Publisher’s Note: MDPI stays neutral with regard to jurisdictional claims in published maps and institutional affiliations.

