
Influence of Structure and Composition of Woven Fabrics on the Conductivity of Flexography Printed Electronics

 ,
,  , and
, and 
Abstract
:1. Introduction
2. Materials and Methods
2.1. Materials
2.2. Flexographic Electronic Printing
2.3. Characterization
3. Results and Discussion
3.1. Electrical Characterization
3.2. Physical Characterization
4. Conclusions
5. Patents
Author Contributions
Funding
Institutional Review Board Statement
Informed Consent Statement
Data Availability Statement
Conflicts of Interest
References
- Avuthu, S.G.; Gill, M.; Ghalib, N.; Sussman, M.R.; Wable, G.; Richstein, J.; Circuit, J. An introduction to the process of printed electronics. In Proceedings of the SMTA International, Rosemont, IL, USA, 25–29 September 2016. [Google Scholar]
- Kim, C.; Jeon, S.W.; Kim, C.H. Reduction of Linearly Varying Term of Register Errors Using a Dancer System in Roll-to-Roll Printing Equipment for Printed Electronics. Int. J. Precis. Eng. Manuf. 2019, 20, 1485–1493. [Google Scholar] [CrossRef]
- Wiklund, J.; Karakoç, A.; Palko, T.; Yiğitler, H.; Ruttik, K.; Jäntti, R.; Paltakari, J. A Review on Printed Electronics: Fabrication Methods, Inks, Substrates, Applications and Environmental Impacts. J. Manuf. Mater. Process. 2021, 5, 89. [Google Scholar] [CrossRef]
- Rocha, L.A.; Viana, J.C. Printing Technologies on Flexible Substrates for Printed Electronics. 2018. Available online: https://doi.org/10.5772/intechopen.76161 (accessed on 15 June 2021). [CrossRef] [Green Version]
- Karim, N.; Afroj, S.; Tan, S.; Novoselov, K.S.; Yeates, S.G. All Inkjet-Printed Graphene-Silver Composite Ink on Textiles for Highly Conductive Wearable Electronics Applications. Sci. Rep. 2019, 9, 8035. [Google Scholar] [CrossRef] [PubMed] [Green Version]
- Cano-Raya, C.; Denchev, Z.Z.; Cruz, S.F.; Viana, J.C. Chemistry of solid metal-based inks and pastes for printed electronics—A review. Appl. Mater. Today 2019, 15, 416–430. [Google Scholar] [CrossRef]
- Søndergaard, R.R.; Hosel, M.; Krebs, F. Roll to roll fabrication of large area functional organic materials. J. Polym. Sci. 2012, 51, 16–34. [Google Scholar] [CrossRef]
- Mogg, B.T.; Claypole, T.; Deganello, D.; Phillips, C. Flexographic printing of ultra-thin semiconductor polymer layers. Transl. Mater. Res. 2016, 3, 015001. [Google Scholar] [CrossRef] [Green Version]
- Davide, D. Control of morphological and electrical properties of flexographic printed electronics through tailored ink rheology. Org. Electron. 2019, 73, 212–218. [Google Scholar]
- Yang, K.; Torah, R.; Wei, Y.; Beeby, S.; Tudor, J. Waterproof and durable screen printed silver conductive tracks on textiles. Text. Res. J. 2013, 83, 2023–2031. [Google Scholar] [CrossRef]
- Ferri, J.; Llopis, R.L.; Moreno, J.; Lidón-Roger, J.V.; Garcia-Breijo, E. An investigation into the fabrication parameters of screen-printed capacitive sensors on e-textiles. Text. Res. J. 2020, 90, 1749–1769. [Google Scholar] [CrossRef]
- Quinto, C.; Linares, A.; Llarena, E.; Montes, C.; González, O.; Molina, D.; Pío, A.; Ocaña, L.; Friend, M.; Cendagorta, M. Screen Printing for Perovskite Solar Cells Metallization. In Proceedings of the 31st European Photovoltaic Solar Energy Conference and Exhibition, Hamburg, Germany, 14–18 September 2015; pp. 1144–1148. [Google Scholar] [CrossRef]
- Vena, A.; Perret, E.; Tedjini, S. Implementation and Measurements of Chipless RFID Tags. In Chipless RFID Based on RF Encoding Particle; ISTE Press—Elsevier: London, UK, 2016. [Google Scholar] [CrossRef]
- Rodes-Carbonell, A.M.; Ferri, J.; Garcia-Breijo, E.; Bou-Belda, E. A preliminary study of printed electronics through flexography impression on flexible substrates. Ind. Textila 2021, 72, 133–137. [Google Scholar] [CrossRef]
- Kumar, B.; Hu, J. Woven fabric structures and properties. In The Textile Institute Book Series; Woodhead Publishing: Sawston, UK, 2017; pp. 133–151. [Google Scholar] [CrossRef]
- Amin, R.; Haque, M. Effect of weave structure on fabric properties. Ann. Univ. Oradea Fascicle Text. 2011, 12, 161–165. [Google Scholar]
- Rogina-Car, B.; Kovačević, S.; Schwarz, I.; Dimitrovski, K. Microbial Barrier Properties of Cotton Fabric—Influence of Weave Architecture. Polymers 2020, 12, 1570. [Google Scholar] [CrossRef]
- Hasan, M.; Calvimontes, A.; Synytska, A.; Dutschk, V. Effects of Topographic Structure on Wettability of Differently Woven Fabrics. Text. Res. J. 2008, 78, 996–1003. [Google Scholar] [CrossRef] [Green Version]
- Meseldžija, M.; Vukić, N.; Erceg, T.; Budinski, N.; Lavicza, Z.; Lera, I.; Kojić, D. The analysis of the substrate influence on the print quality parameters of screen-printed textile. In Proceedings of the VIII International Conference on Social and Technological Development, Bosnia and Herzegovina, Balkans, 8–9 November 2019. [Google Scholar] [CrossRef]
- Hong, H.; Hu, J.; Yan, X. Effect of the basic surface properties of woven lining fabric on printing precision and electrical performance of screen-printed conductive lines. Text. Res. J. 2019, 90, 1212–1223. [Google Scholar] [CrossRef]
- Agathian, K.; Kannammal, L.; Meenarathi, B.; Kailash, S.; Anbarasan, R. Synthesis, characterization and adsorption behavior of cotton fiber based Schiff base. Int. J. Biol. Macromol. 2018, 107, 1102–1112. [Google Scholar] [CrossRef] [PubMed]
- Grishanov, S.; Meshkov, V.; Omelchenko, A. A Topological Study of Textile Structures. Part I: An Introduction to Topological Methods. Text. Res. J. 2009, 79, 702–713. [Google Scholar] [CrossRef]
- Özdemir, H.; Mert, E. The effects of fabric structural parameters on the tensile, bursting, and impact strengths of cellular woven fabrics. J. Text. Inst. 2013, 104, 330–338. [Google Scholar] [CrossRef]
- Šajn Gorjanc, D. The Influence of Constructional Parameters on Deformability of Elastic Cotton Fabrics. J. Eng. Fibers Fabr. 2014, 9, 38–46. [Google Scholar] [CrossRef]
- Vrljičak, Z.; Dragana, K.; Skenderi, Z. Impact of yarn count, noil percentage and yarn tension on structure of jersey fabric. Tekstil 2015, 64, 158–168. [Google Scholar]
- Kostajnšek, K.; Dimitrovski, K. Use of Extended Cover Factor Theory in UV Protection of Woven Fabric. Polymers 2021, 13, 1188. [Google Scholar] [CrossRef] [PubMed]
- Żołek-Tryznowska, Z. Rheology of Printing Inks. In The Printing Ink Manual; Springer: Berlin, Germany, 2016; pp. 87–99. [Google Scholar] [CrossRef]
- Revuelta, P.S.; Litrán, S.P.; Thomas, J.P. Electrical Power Terms in the IEEE Std 1459 Framework. In Active Power Line Conditioners; Elsevier: Amsterdam, The Netherlands, 2016; pp. 23–49. [Google Scholar] [CrossRef]
- Textiles—Tests for Colour Fastness—Part C06: Colour Fastness to Domestic and Commercial Laundering (ISO 105-C06:2010). Available online: https://www.une.org/encuentra-tu-norma/busca-tu-norma/norma?c=N0045649 (accessed on 15 June 2021).
- Deopura, B.L.; Padaki, N.V. Synthetic textile fibres: Polyamide, polyester and aramid fibres. In Textiles and Fashion; Woodhead Publishing: Sawston, UK, 2015; pp. 97–114. [Google Scholar]
- Jong, S.E.; Mok, L.Y.; Lee, J.S.; Chul, Y.S. Development of Cellulosic Woven Fabric for Digital Textile Printing. Text. Coloration Finish. 2005, 17, 20–26. [Google Scholar]
- Zhang, Y.; Westland, S.; Cheung, V.; Burkinshaw, S.M.; Blackburn, R.S. A custom ink-jet printing system using a novel pretreatment method. Color. Technol. 2009, 125, 357–365. [Google Scholar] [CrossRef]
- Kašiković, N.; Vladić, G.; Milić, N.; Novaković, D.; Milošević, R.; Dedijer, S. Colour fastness to washing of multi-layered digital prints on textile materials. J. Natl. Sci. Found. Sri Lanka 2018, 46, 381. [Google Scholar] [CrossRef]
- Gabrijelčič, H.; Dimitrovski, K. Influence of yarn count and warp and weft thread density on colour values of woven surface. Fibres Text. East. Eur. 2004, 12, 32–39. [Google Scholar]
- Available online: https://www.une.org/encuentra-tu-norma/busca-tu-norma/norma?c=N0023384 (accessed on 15 July 2021).
- Ly, B.C.K.; Dyer, E.B.; Feig, J.L.; Chien, A.L.; Del Bino, S. Research Techniques Made Simple: Cutaneous Colorimetry: A Reliable Technique for Objective Skin Color Measurement. J. Investig. Dermatol. 2020, 140, 3–12.e1. [Google Scholar] [CrossRef] [PubMed] [Green Version]
- Cherrington, M.; Claypole, T.; Gethin, D.; Worsley, D.; Deganello, D. Non-contact assessment of electrical performance for rapidly sintered nanoparticle silver coatings through colorimetry. Thin Solid Films 2012, 522, 412–414. [Google Scholar] [CrossRef]
- Soleimani-gorgani, A.; Pishvaei, M. Water Fast Ink Jet Print Using an Acrylic /Nano-Silver Ink. Prog. Color Colorants Coat. 2021, 4, 79–83. [Google Scholar] [CrossRef]

 ) measured on warp direction and (
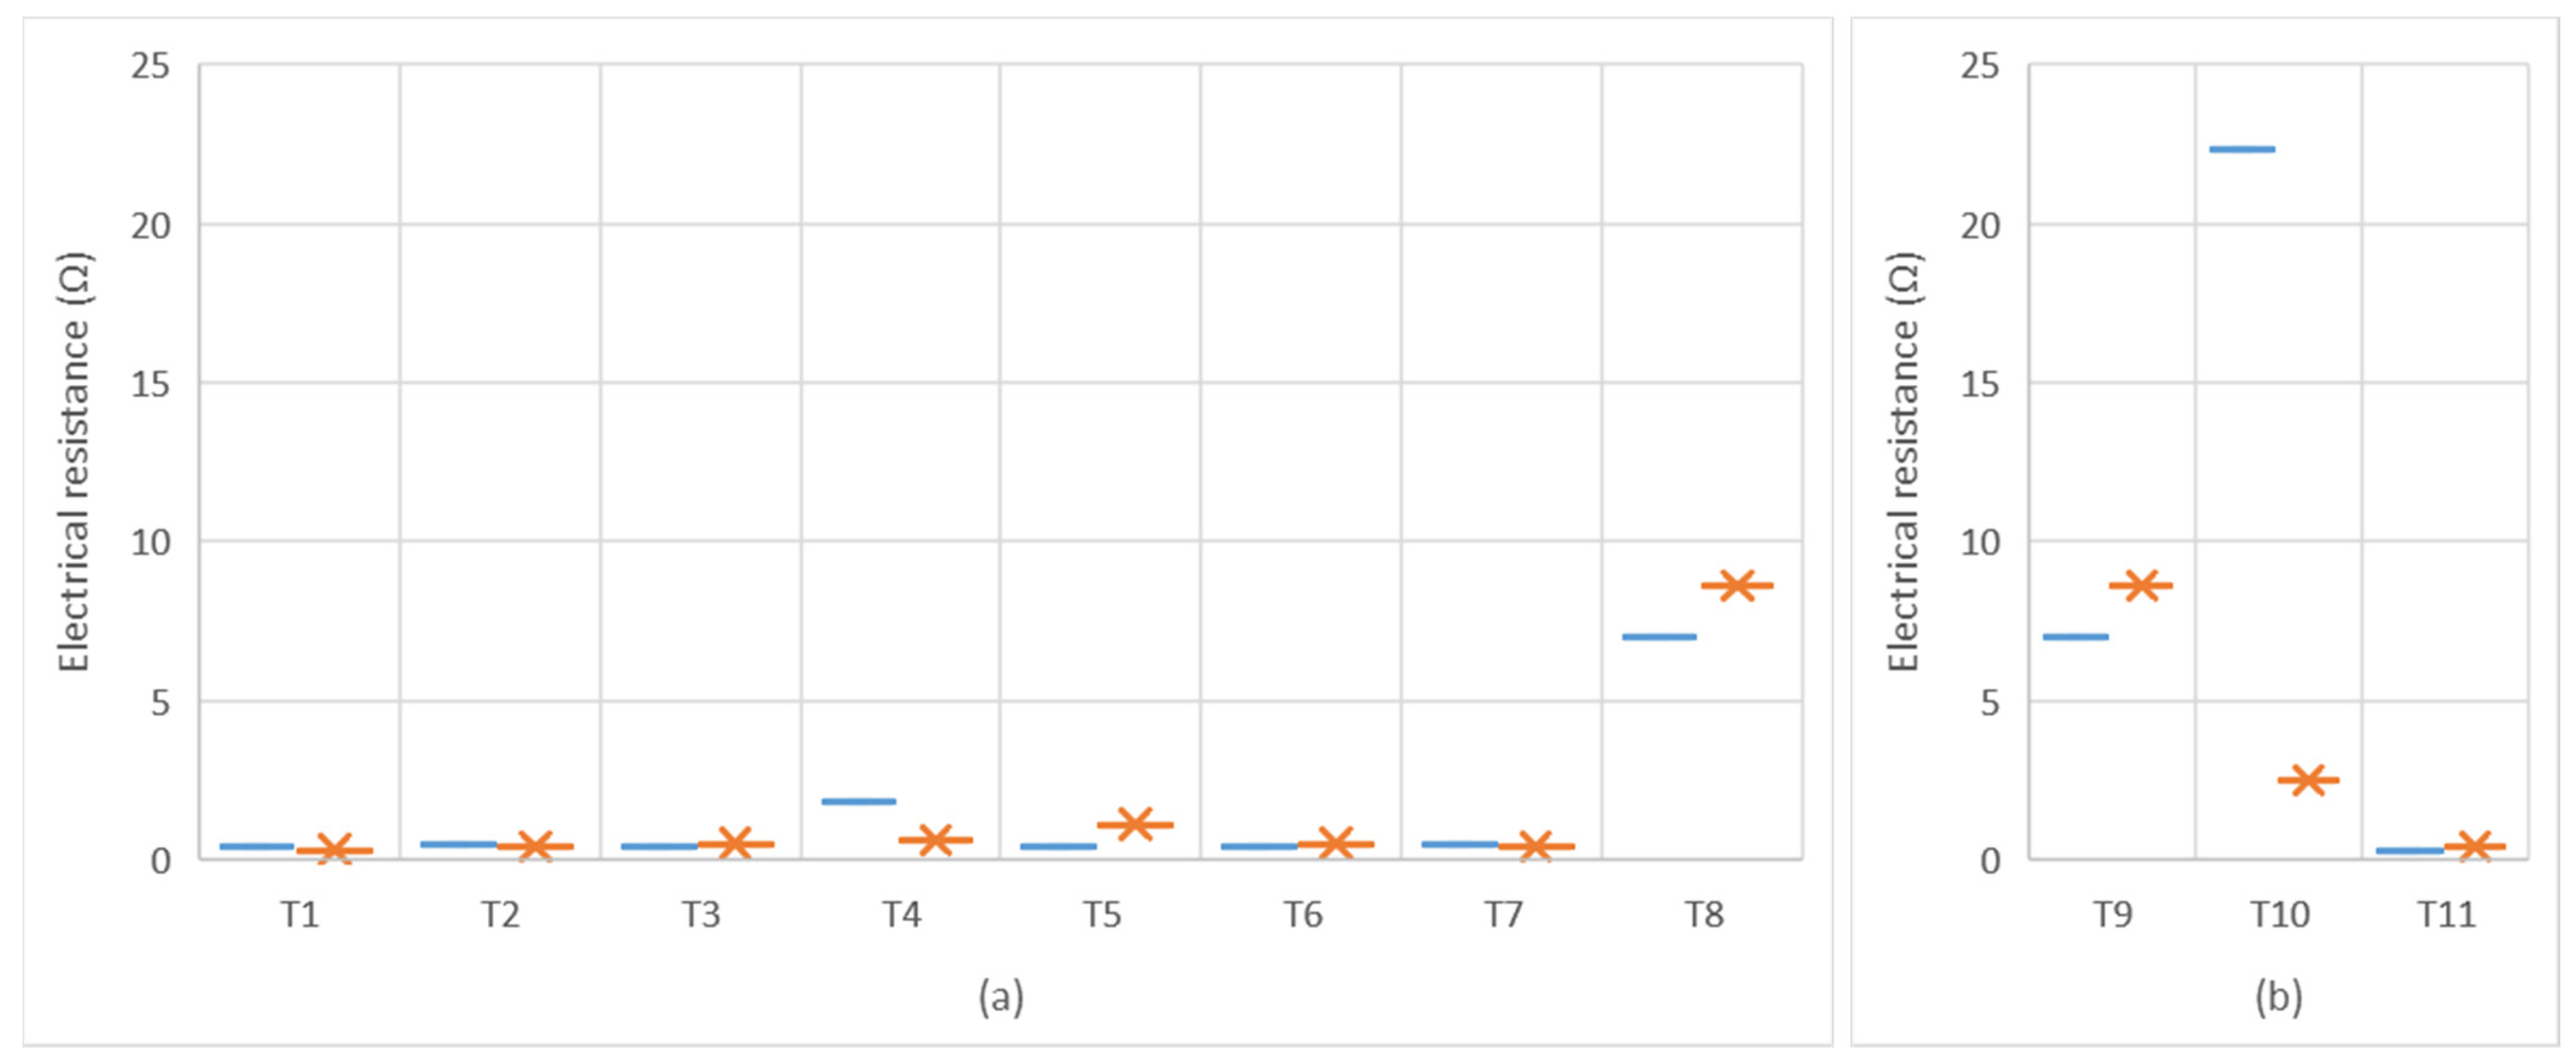
  )measured on weft direction. (a) Electrical resistance affected by the structural variations of the textiles; and (b) Electrical resistance affected by the material composition of the textiles.
) measured on warp direction and ( )measured on weft direction. (a) Electrical resistance affected by the structural variations of the textiles; and (b) Electrical resistance affected by the material composition of the textiles.
)measured on weft direction. (a) Electrical resistance affected by the structural variations of the textiles; and (b) Electrical resistance affected by the material composition of the textiles.
) measured on warp direction and ( )measured on weft direction. (a) Electrical resistance affected by the structural variations of the textiles; and (b) Electrical resistance affected by the material composition of the textiles.
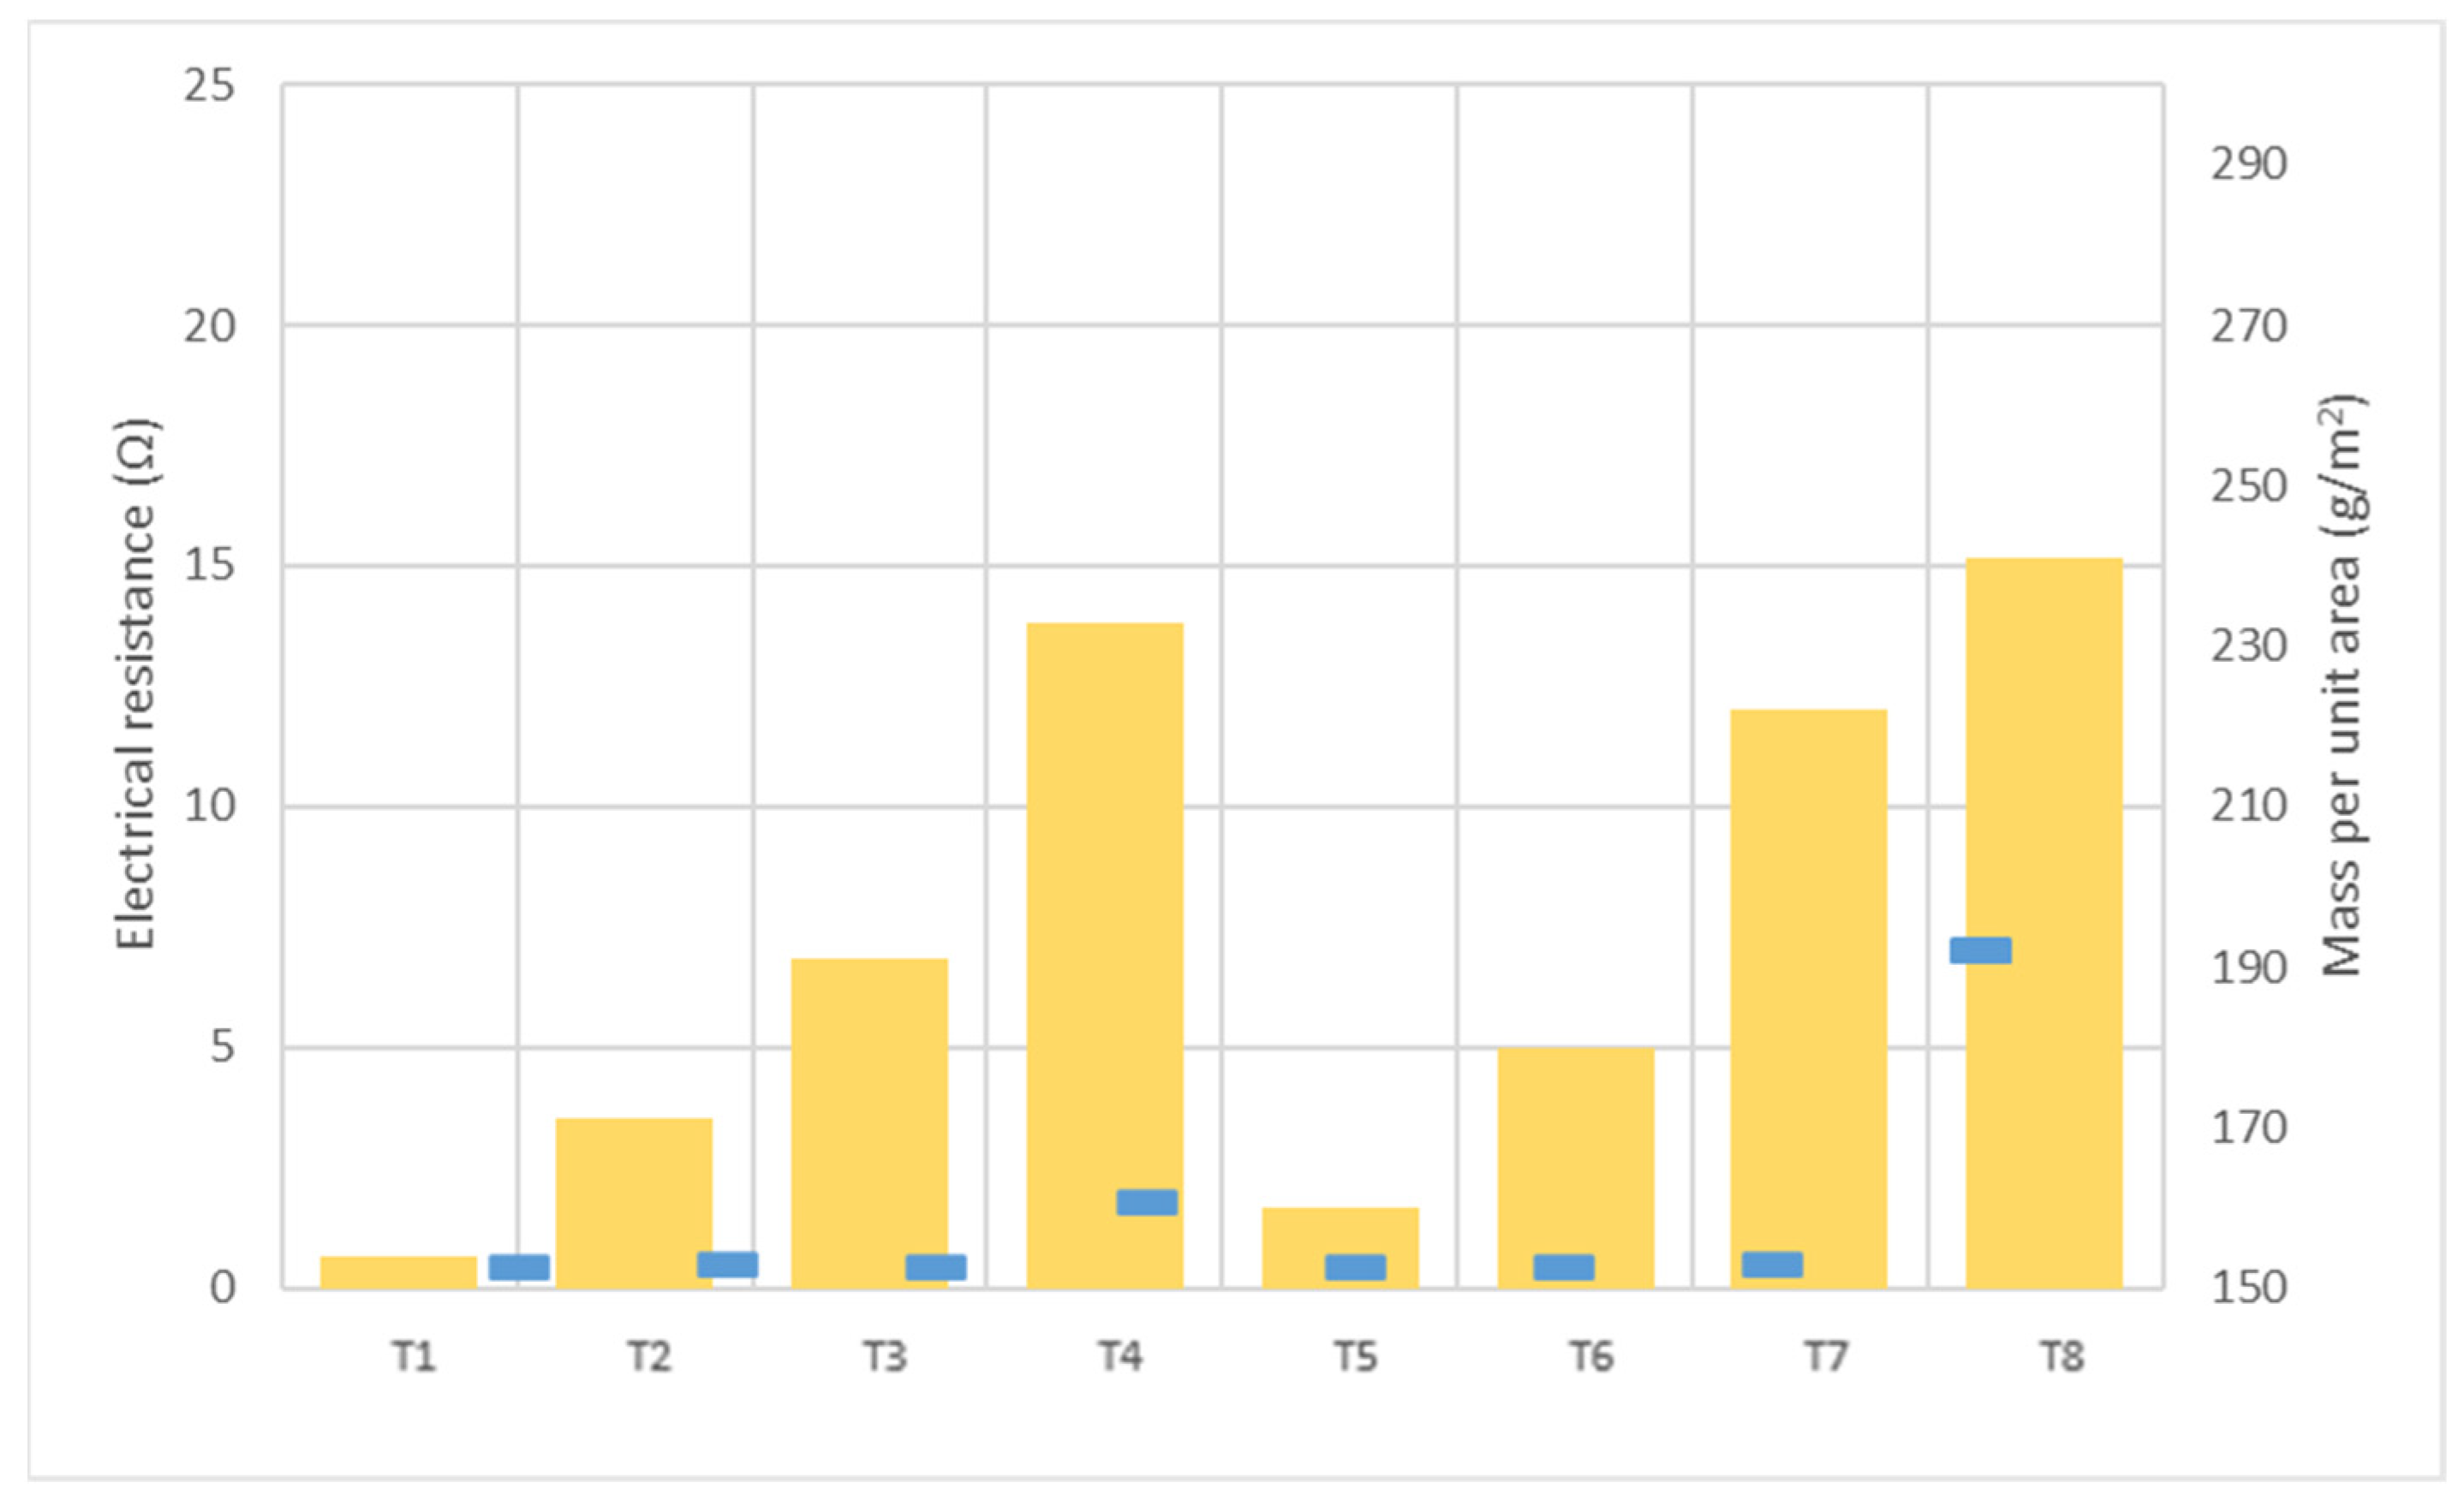
 ) and the mass per unit area (
  ).
) and the mass per unit area ( ).
).
) and the mass per unit area ( ).


| Substrate Code | 3D Modeling | Weft Composition | Weave Construction | Graphic Representation | Interlacing Coefficient (KL) |
|---|---|---|---|---|---|
| T1 |  | Polyester | Plain |  | 1 |
| T2 | 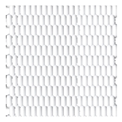 | Polyester | Plain |  | 1 |
| T3 |  | Polyester | Plain |  | 1 |
| T4 | 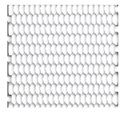 | Polyester | Plain | 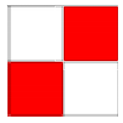 | 1 |
| T5 |  | Polyester | Twill |  | 0.4 |
| T6 | 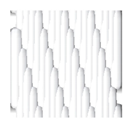 | Polyester | Twill |  | 0.4 |
| T7 |  | Polyester | Twill |  | 0.4 |
| T8 |  | Polyester | Twill |  | 0.4 |
| T9 |  | Polyester | Twill |  | 0.4 |
| T10 |  | Cotton | Twill |  | 0.4 |
| T11 |  | Wool | Twill |  | 0.4 |
| Substrate Code | Warp Density (ends/cm) | Weft Density (picks/cm) | Weft Count (dtex) | Cover Factor (%) | Fabric Weight 1 (g/m2) | Thickness (µm) |
|---|---|---|---|---|---|---|
| T1 | 58.0 | 10.5 | 333.3 | 84.8 | 154 | 515 |
| T2 | 58.8 | 15.3 | 333.3 | 93.6 | 171 | 550 |
| T3 | 58.4 | 10.7 | 666.7 | 92.9 | 191 | 622 |
| T4 | 57.2 | 15.8 | 666.7 | 103.4 | 233 | 650 |
| T5 | 59.2 | 10.6 | 333.3 | 64.5 | 160 | 705 |
| T6 | 55.9 | 16.0 | 333.3 | 68.3 | 180 | 725 |
| T7 | 57.3 | 11.6 | 666.7 | 70.0 | 222 | 744 |
| T8 | 56.3 | 16.5 | 666.7 | 77.6 | 241 | 805 |
| T9 | 59.4 | 15.9 | 666.7 | 79.3 | 235 | 800 |
| T10 | 58.8 | 16.2 | 666.7 | 78.5 | 230 | 795 |
| T11 | 60.4 | 16.8 | 666.7 | 82.1 | 225 | 790 |
| Ink Code | Density (g/mL) | Solids (%) | Viscosity (Pas) | Volume Resistivity (μΩ·cm) | Curing | Properties |
|---|---|---|---|---|---|---|
| PFI-RSA6012—Silver ink | 2.22 | 60 (±2) | 0.05–0.15 @1000 s−1 | 8–10 | 10–60 s 140 °C |
|
| Ink | Anilox Volume | Resolution | Printed Area | Speed | Curing |
|---|---|---|---|---|---|
| PFI-RSA6012—Silver ink | 11 cm3/m2 | 150 LPI | 150 × 95 mm2 | 12 m/min | 60 s 140 °C |
| Substrate Code | Resistance (Ω) Warp Direction | Resistance (Ω) Weft Direction |
|---|---|---|
| T1 | 0.4 | 0.3 |
| T2 | 0.5 | 0.4 |
| T3 | 0.4 | 0.5 |
| T4 | 1.8 | 0.6 |
| T5 | 0.4 | 1.1 |
| T6 | 0.4 | 0.5 |
| T7 | 0.5 | 0.4 |
| T8 | 7 | 8.6 |
| T9 | 7 | 8.6 |
| T10 | 22.3 | 2.5 |
| T11 | 0.3 | 0.4 |
| Substrate Code | Optical (×20) | FE-SEM (×100) | FE-SEM (×150) |
|---|---|---|---|
| T1 | 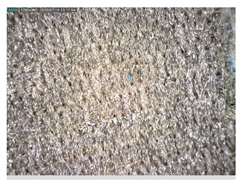 |  |  |
| T2 | 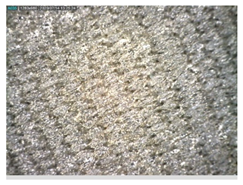 | 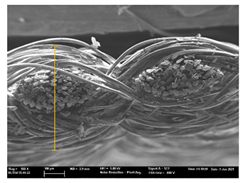 | 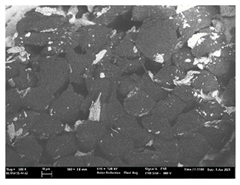 |
| T3 |  |  | 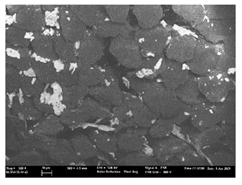 |
| T4 | 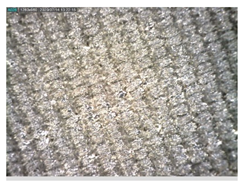 | 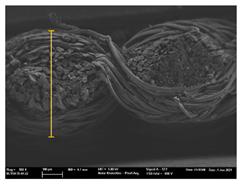 | 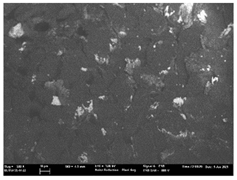 |
| T5 | 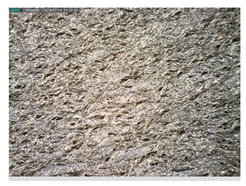 | 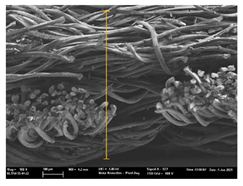 |  |
| T6 | 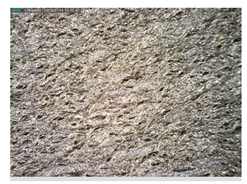 | 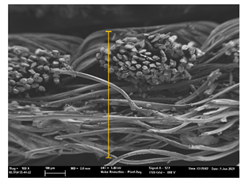 |  |
| T7 | 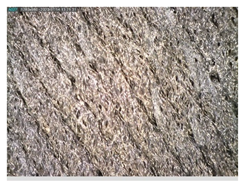 | 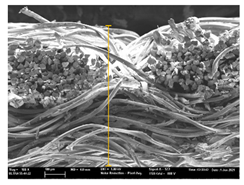 | 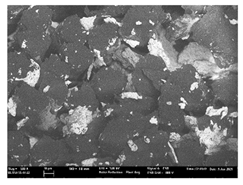 |
| T8 | 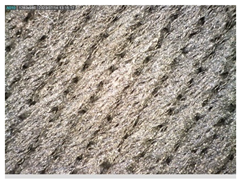 | 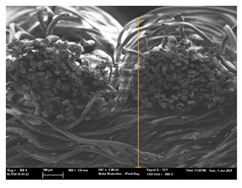 | 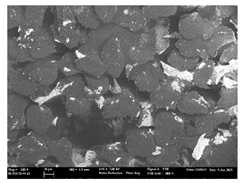 |
| Substrate Code | Optical (×20) | FE-SEM (×100) | FE-SEM (×150) |
|---|---|---|---|
| T9 |  | 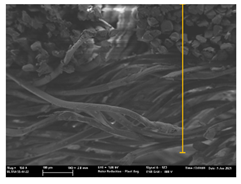 | 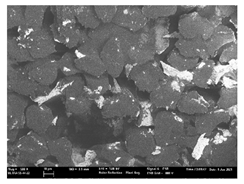 |
| T10 | 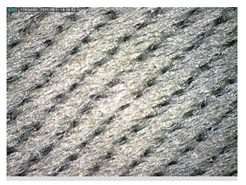 | 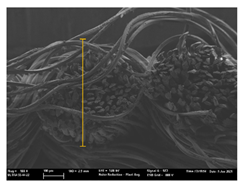 | 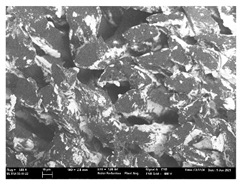 |
| T11 |  | 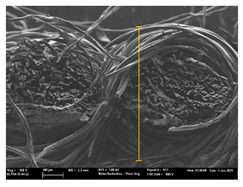 |  |
| Substrate Code | Change in Color | Staining | |||||
|---|---|---|---|---|---|---|---|
| Wool | Acrylic | Polyester | Polyamide | Cotton | Acetate | ||
| T1 | 4–5 | 4–5 | 4–5 | 4–5 | 4–5 | 4–5 | 4–5 |
| T2 | 4–5 | 4–5 | 4–5 | 4–5 | 4–5 | 4–5 | 4–5 |
| T3 | 4–5 | 4–5 | 4–5 | 4–5 | 4–5 | 4–5 | 4–5 |
| T4 | 4 | 4–5 | 4–5 | 4–5 | 4–5 | 4–5 | 4–5 |
| T5 | 4–5 | 4–5 | 4–5 | 4–5 | 4–5 | 4–5 | 4–5 |
| T6 | 4–5 | 4–5 | 4–5 | 4–5 | 4–5 | 4–5 | 4–5 |
| T7 | 4–5 | 4–5 | 4–5 | 4–5 | 4–5 | 4–5 | 4–5 |
| T8 | 4 | 4–5 | 4–5 | 4–5 | 4–5 | 4–5 | 4–5 |
| Substrate Code | Change in Color | Staining | |||||
|---|---|---|---|---|---|---|---|
| Wool | Acrylic | Polyester | Polyamide | Cotton | Acetate | ||
| T9 | 4 | 4–5 | 4–5 | 4–5 | 4–5 | 4–5 | 4–5 |
| T10 | 1 | 4 | 4 | 4 | 4 | 4 | 4 |
| T11 | 1 | 4 | 4 | 4 | 4 | 4 | 4 |
| Substrate Code | L* | a* | b* |
|---|---|---|---|
| T1 | 50.19 | 1.56 | 11.04 |
| T2 | 48.86 | 2.36 | 11.48 |
| T3 | 58.07 | 1.21 | 12.36 |
| T4 | 47.78 | 1.49 | 9.36 |
| T5 | 51.88 | 0.83 | 8.49 |
| T6 | 54.29 | 1.37 | 8.86 |
| T7 | 51.58 | 0.87 | 7.71 |
| T8 | 45.95 | 2 | 9.19 |
| T9 | 45.95 | 2 | 9.19 |
| T10 | 48.91 | −3.55 | 5.53 |
| T11 | 55.58 | −4.24 | 6.19 |
Publisher’s Note: MDPI stays neutral with regard to jurisdictional claims in published maps and institutional affiliations. |
© 2021 by the authors. Licensee MDPI, Basel, Switzerland. This article is an open access article distributed under the terms and conditions of the Creative Commons Attribution (CC BY) license (https://creativecommons.org/licenses/by/4.0/).
Share and Cite
Rodes-Carbonell, A.M.; Ferri, J.; Garcia-Breijo, E.; Montava, I.; Bou-Belda, E. Influence of Structure and Composition of Woven Fabrics on the Conductivity of Flexography Printed Electronics. Polymers 2021, 13, 3165. https://doi.org/10.3390/polym13183165
Rodes-Carbonell AM, Ferri J, Garcia-Breijo E, Montava I, Bou-Belda E. Influence of Structure and Composition of Woven Fabrics on the Conductivity of Flexography Printed Electronics. Polymers. 2021; 13(18):3165. https://doi.org/10.3390/polym13183165
Chicago/Turabian StyleRodes-Carbonell, Ana María, Josué Ferri, Eduardo Garcia-Breijo, Ignacio Montava, and Eva Bou-Belda. 2021. "Influence of Structure and Composition of Woven Fabrics on the Conductivity of Flexography Printed Electronics" Polymers 13, no. 18: 3165. https://doi.org/10.3390/polym13183165
APA StyleRodes-Carbonell, A. M., Ferri, J., Garcia-Breijo, E., Montava, I., & Bou-Belda, E. (2021). Influence of Structure and Composition of Woven Fabrics on the Conductivity of Flexography Printed Electronics. Polymers, 13(18), 3165. https://doi.org/10.3390/polym13183165